Embed Size (px)
Citation preview

MENA quarterly banking report
Q4 2020

About the report
This report analyzes the Q4 2020 performance of 32 leading banks across the MENA region. The report is based on detailed financial information including balance sheets, income statements and management disclosures.All information is sourced from publicly available financial statements of banks.
Contents
Executive summary04
01
Macroeconomicindicators
0602
Bankingperformance
1703
Sector insights
2304
Annexure
3205

4 MENA quarterly banking report: Q4 2020
Despite the COVID-19 pandemic and its economic impact, the MENA banking sector, particularly in the Gulf region, has been resilient, and has benefited from the economic diversification programs implemented by the region’s governments.

Executive summary
The MENA region is dynamic and vibrant. It is accustomed to experiencing a myriad of geopolitical, business and social challenges to which MENA bankers adapted to. The year 2020 — the COVID-19 year — introduced a different dimension to the region’s “regular” challenges. In May 2020, we wrote a point of view (POV) “how the banking sector can emerge stronger after a crisis,” in which we recommended nine areas for MENA banks to focus on during COVID-19. Against the backdrop of 2020 and its complications, MENA banks’ performance was invariably impacted.
While the oil prices have somewhat recovered, they remain far below the levels prior to the first COVID-19 wave in the MENA region. A full-scale recovery of the banking sector is a function of health and economic policies, the response of individuals, firms and the condition of the labor market. Key themes in results of the banking sector in Q4 2020 include:
• Subdued revenue growth due to rate cuts and higher provisioning caused by the COVID-19 pandemic. This trend is expected to continue until there is a recovery in economic activity, even as there is a deliberate effort by banks to decrease the expenses through various cost-cutting measures.
• Despite various long-term and short-term cost control measures such as digitalization, headcount reduction, and branch rationalizations, the cost-to-income ratio increased due to higher decline in operating income compared with operating expenses.
• Loans and deposits continued to grow at a moderate rate with the latter growing at a faster pace than the former. This resulted in further decline in loan-to-deposit ratio (LDR) and the continuation of this trend could affect the future profitability of banks, if the economy fails to recover in the near term.
The year 2021 introduces several changes from a global and regional perspective. At a global level, the COVID-19 vaccination drives with more than 550 million doses administered and economic recovery plans are front and center of the government agenda. This supports the positive outlook provided by the International Monetary Fund (IMF) as they anticipate global gross domestic product (GDP) growth to be at 5.2% in 2021 and the MENA growth rate is expected to be at 3%. Joe Biden assumed his responsibilities as the President of the United States of America, and while the vast majority of analysts expect that his first 100 days in office will focus on the domestic agenda, there is much anticipation of his foreign policy strategy and its implications. According to the tenth annual EY/IIF global bank risk management survey, geopolitical risk management will remain high on agenda over the next five years, although the results of the US foreign policy and its respective ramifications toward Europe, China, and the Middle East (especially as it relates to Joint Comprehensive Plan of Action (JCOPA)) remains to be seen. As the Gulf Cooperation Council (GCC) prepares for three major initiatives starting with EXPO in Dubai, the FIFA World Cup in Qatar and the realization of Neom, the GCC leaders have turned a leaf at Al Ula GCC summit, which ushered in a new era in regional relationships.
01
5 MENA quarterly banking report: Q4 2020
Houssam ItaniPartner,
EY MENA Banking &Capital Markets Leader
Gordon BennieManaging Partner, EY MENA Financial
Services Leader
Dr. Duško DinčovPartner,
EY MENA Financial Services
How MENA banks can turn adversity into opportunity for growth in 2021 and beyond

6 MENA quarterly banking report: Q4 2020
As we steadily move into 2021 and beyond, MENA now has a once-in-a-generation opportunity to accelerate the transformation and cultivate the innovation that will build a more successful future along eight main themes, which will shape banking in MENA.
The rise of the digital regulator and pan-industry collaboration
Market consolidation
Rethinking cost management as the foundation of profitability
Enabling greater customer centricity
Building a more resilient enterprise to enable agility
Emergence of platform and ecosystem business models
Financial crime
Stress testing and balance sheet management
Sector insights021
2
3
4
5
6
7
87 MENA quarterly banking report: Q4 2020
8 MENA quarterly banking report: Q4 2020
Sector insights
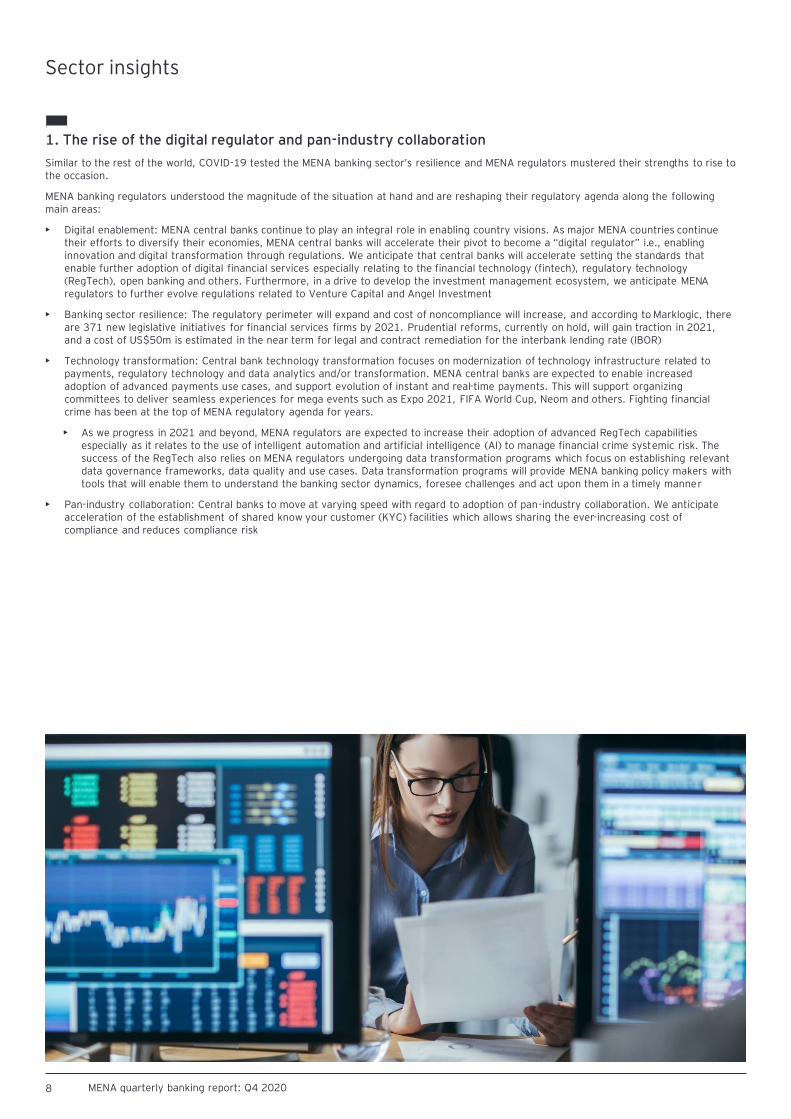
1. The rise of the digital regulator and pan-industry collaboration
Similar to the rest of the world, COVID-19 tested the MENA banking sector’s resilience and MENA regulators mustered their strengths to rise to the occasion.
MENA banking regulators understood the magnitude of the situation at hand and are reshaping their regulatory agenda along the following main areas:
• Digital enablement: MENA central banks continue to play an integral role in enabling country visions. As major MENA countries continue their efforts to diversify their economies, MENA central banks will accelerate their pivot to become a “digital regulator” i.e., enabling innovation and digital transformation through regulations. We anticipate that central banks will accelerate setting the standards that enable further adoption of digital financial services especially relating to the financial technology (fintech), regulatory technology (RegTech), open banking and others. Furthermore, in a drive to develop the investment management ecosystem, we anticipate MENA regulators to further evolve regulations related to Venture Capital and Angel Investment
• Banking sector resilience: The regulatory perimeter will expand and cost of noncompliance will increase, and according to Marklogic, there are 371 new legislative initiatives for financial services firms by 2021. Prudential reforms, currently on hold, will gain traction in 2021, and a cost of US$50m is estimated in the near term for legal and contract remediation for the interbank lending rate (IBOR)
• Technology transformation: Central bank technology transformation focuses on modernization of technology infrastructure related to payments, regulatory technology and data analytics and/or transformation. MENA central banks are expected to enable increasedadoption of advanced payments use cases, and support evolution of instant and real-time payments. This will support organizing committees to deliver seamless experiences for mega events such as Expo 2021, FIFA World Cup, Neom and others. Fighting financial crime has been at the top of MENA regulatory agenda for years.
• As we progress in 2021 and beyond, MENA regulators are expected to increase their adoption of advanced RegTech capabilities especially as it relates to the use of intelligent automation and artificial intelligence (AI) to manage financial crime systemic risk. The success of the RegTech also relies on MENA regulators undergoing data transformation programs which focus on establishing relevant data governance frameworks, data quality and use cases. Data transformation programs will provide MENA banking policy makers with tools that will enable them to understand the banking sector dynamics, foresee challenges and act upon them in a timely manner
• Pan-industry collaboration: Central banks to move at varying speed with regard to adoption of pan-industry collaboration. We anticipate acceleration of the establishment of shared know your customer (KYC) facilities which allows sharing the ever-increasing cost ofcompliance and reduces compliance risk
9 MENA quarterly banking report: Q4 2020
Sector insights (cont’d)
2. Market consolidation
The MENA banking market in several geographies has been overbanked for some time. Reflections on the current COVID-19 situation will provide governments and banks with the opportunity to drive further consolidation activity. We anticipate that the banking consolidation activities in the region will accelerate in the next 12 months. The key driver for this would be growth, both to local and new markets. Additionally, consolidations would enable banks to have an increased ability to compete, add further benefits to the local economies, offer a wider range of products and services, and provide the opportunity for synergies. With the growth that comes from the merging of two or more banks, they will also have the capabilities to service larger ticket transactions and reach customers who were previously unavailable to them.
In the past, majority of the banking mergers in the region have been initiated when there are common shareholders in both the merging banks, which is a major constraint in merging with the right entity. Banking executives should navigate this huddle, if merger activities have to materialize and deliver value.
Another constraint to consider is executing the merger amid restrictions and social distancing requirements imposed due to the pandemic. In our experience, with right planning, executive buy-in and technology, this huddle can be overcome. During the pandemic, EY partnered with a large banking client to execute one of the fastest banking mergers (under eight months) in the region. Majority of the integration activities, including integration management office (IMO) and business, technology and functional workstreams, were executed virtually.
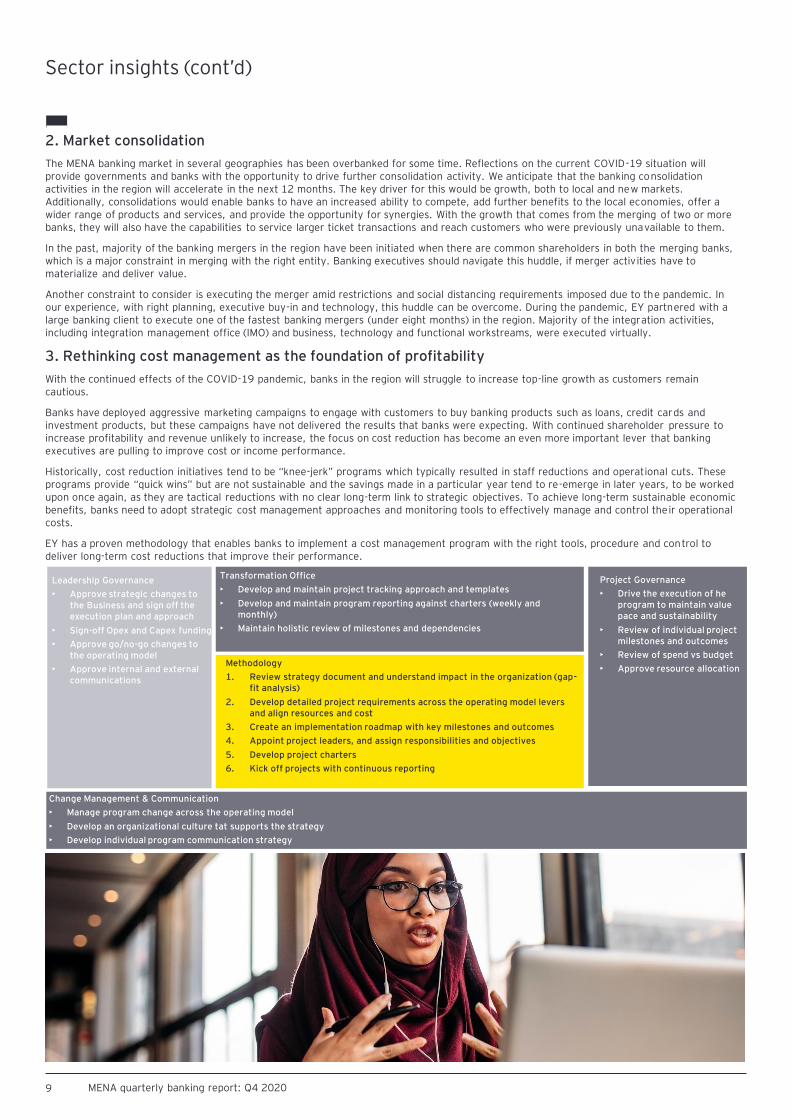
3. Rethinking cost management as the foundation of profitability
With the continued effects of the COVID-19 pandemic, banks in the region will struggle to increase top-line growth as customers remain cautious.
Banks have deployed aggressive marketing campaigns to engage with customers to buy banking products such as loans, credit cards and investment products, but these campaigns have not delivered the results that banks were expecting. With continued shareholder pressure to increase profitability and revenue unlikely to increase, the focus on cost reduction has become an even more important lever that banking executives are pulling to improve cost or income performance.
Historically, cost reduction initiatives tend to be “knee-jerk” programs which typically resulted in staff reductions and operational cuts. These programs provide “quick wins” but are not sustainable and the savings made in a particular year tend to re-emerge in later years, to be worked upon once again, as they are tactical reductions with no clear long-term link to strategic objectives. To achieve long-term sustainable economic benefits, banks need to adopt strategic cost management approaches and monitoring tools to effectively manage and control their operational costs.
EY has a proven methodology that enables banks to implement a cost management program with the right tools, procedure and control to deliver long-term cost reductions that improve their performance.
Leadership Governance
• Approve strategic changes to the Business and sign off the execution plan and approach
• Sign-off Opex and Capex funding
• Approve go/no-go changes to the operating model
• Approve internal and external communications
Transformation Office
• Develop and maintain project tracking approach and templates
• Develop and maintain program reporting against charters (weekly and monthly)
• Maintain holistic review of milestones and dependencies
Project Governance
• Drive the execution of he program to maintain value pace and sustainability
• Review of individual project milestones and outcomes
• Review of spend vs budget
• Approve resource allocation
Change Management & Communication
• Manage program change across the operating model
• Develop an organizational culture tat supports the strategy
• Develop individual program communication strategy
Methodology
1. Review strategy document and understand impact in the organization (gap-fit analysis)
2. Develop detailed project requirements across the operating model levers and align resources and cost
3. Create an implementation roadmap with key milestones and outcomes
4. Appoint project leaders, and assign responsibilities and objectives
5. Develop project charters
6. Kick off projects with continuous reporting
10 MENA quarterly banking report: Q4 2020
Sector insights (cont’d)
Sustainable transformation requires investments and time, which under current market conditions may be hard to justify to shareholders who are looking for positive annual returns. Experience has shown that banks that clearly articulate a vision for change and adopt a flexible roadmap by following the above methodology, tend to implement a cost management approach that positively improves their profitability and performance in the long-term.
A cost management approach and methodology needs to be agile and aligned to the “new normal” in order to face the challenges posed not just by the COVID-19 pandemic but tougher market conditions, which will continue to put pressure on banks to reduce costs for the foreseeable future.
There are three factors that enable banks to deliver sustainable long-term benefits:
• Value: By carefully examining elements of addressable spend and realizing the full value of change with clear goals and objectives
• Pace: Established via effective project management, focus, and balancing short- and long-term cost reduction initiatives that provide shareholder returns and long-term efficiency
• Sustainability: Continuous cost management focus with long-term objectives
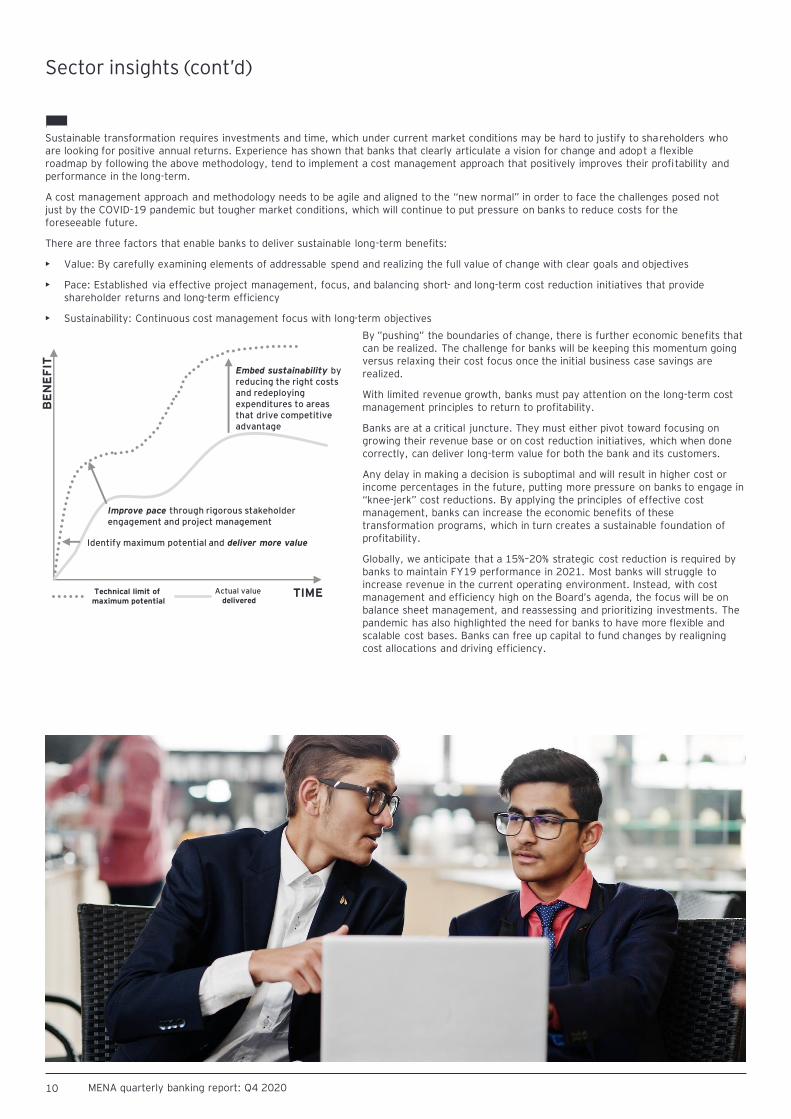
By ”pushing” the boundaries of change, there is further economic benefits that can be realized. The challenge for banks will be keeping this momentum going versus relaxing their cost focus once the initial business case savings are realized.
With limited revenue growth, banks must pay attention on the long-term cost management principles to return to profitability.
Banks are at a critical juncture. They must either pivot toward focusing on growing their revenue base or on cost reduction initiatives, which when done correctly, can deliver long-term value for both the bank and its customers.
Any delay in making a decision is suboptimal and will result in higher cost or income percentages in the future, putting more pressure on banks to engage in “knee-jerk” cost reductions. By applying the principles of effective cost management, banks can increase the economic benefits of these transformation programs, which in turn creates a sustainable foundation of profitability.
Globally, we anticipate that a 15%–20% strategic cost reduction is required by banks to maintain FY19 performance in 2021. Most banks will struggle to increase revenue in the current operating environment. Instead, with cost management and efficiency high on the Board’s agenda, the focus will be on balance sheet management, and reassessing and prioritizing investments. The pandemic has also highlighted the need for banks to have more flexible and scalable cost bases. Banks can free up capital to fund changes by realigning cost allocations and driving efficiency.
BE
NE
FIT
TIMETechnical limit of maximum potential
Actual value delivered
Embed sustainability by reducing the right costs and redeploying expenditures to areas that drive competitive advantage
Improve pace through rigorous stakeholder engagement and project management
Identify maximum potential and deliver more value
11 MENA quarterly banking report: Q4 2020
Sector insights (cont’d)
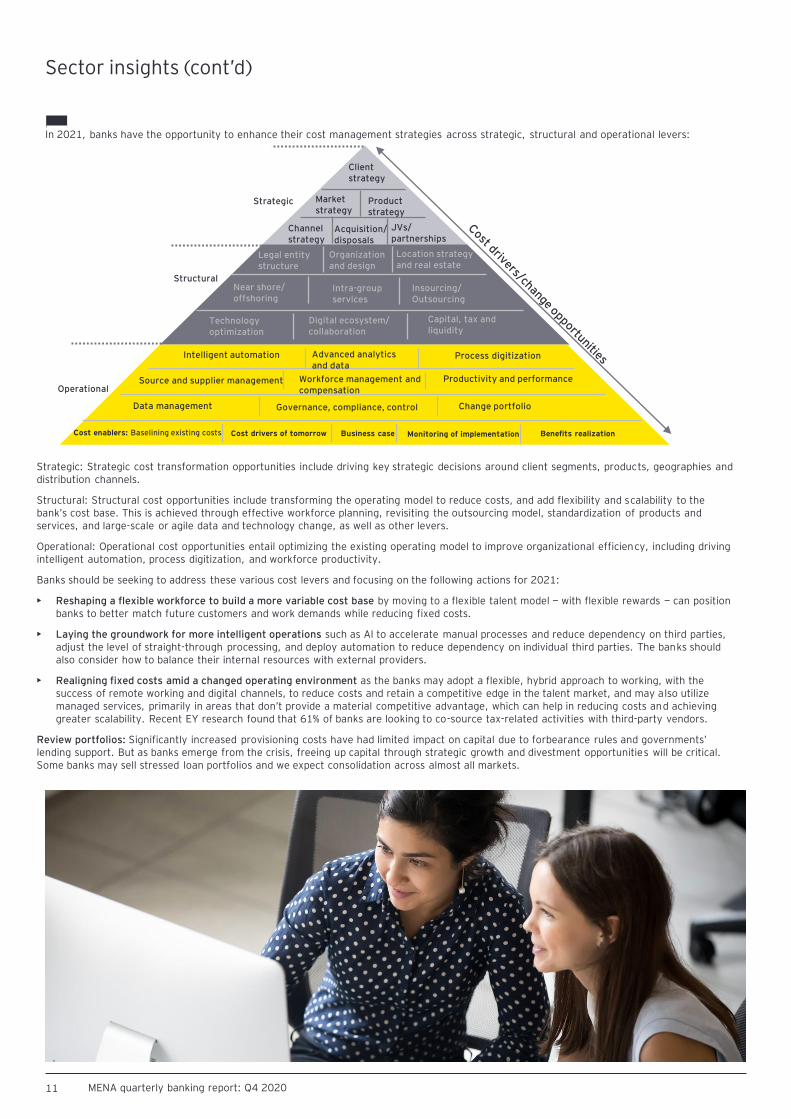
In 2021, banks have the opportunity to enhance their cost management strategies across strategic, structural and operational levers:
Strategic: Strategic cost transformation opportunities include driving key strategic decisions around client segments, products, geographies and distribution channels.
Structural: Structural cost opportunities include transforming the operating model to reduce costs, and add flexibility and scalability to the bank’s cost base. This is achieved through effective workforce planning, revisiting the outsourcing model, standardization of products and services, and large-scale or agile data and technology change, as well as other levers.
Operational: Operational cost opportunities entail optimizing the existing operating model to improve organizational efficiency, including driving intelligent automation, process digitization, and workforce productivity.
Banks should be seeking to address these various cost levers and focusing on the following actions for 2021:
• Reshaping a flexible workforce to build a more variable cost base by moving to a flexible talent model — with flexible rewards — can position banks to better match future customers and work demands while reducing fixed costs.
• Laying the groundwork for more intelligent operations such as AI to accelerate manual processes and reduce dependency on third parties, adjust the level of straight-through processing, and deploy automation to reduce dependency on individual third parties. The banks should also consider how to balance their internal resources with external providers.
• Realigning fixed costs amid a changed operating environment as the banks may adopt a flexible, hybrid approach to working, with the success of remote working and digital channels, to reduce costs and retain a competitive edge in the talent market, and may also utilize managed services, primarily in areas that don’t provide a material competitive advantage, which can help in reducing costs and achieving greater scalability. Recent EY research found that 61% of banks are looking to co-source tax-related activities with third-party vendors.
Review portfolios: Significantly increased provisioning costs have had limited impact on capital due to forbearance rules and governments’ lending support. But as banks emerge from the crisis, freeing up capital through strategic growth and divestment opportunities will be critical. Some banks may sell stressed loan portfolios and we expect consolidation across almost all markets.
Client strategy
Market strategy
Product strategy
Channel strategy
Acquisition/ disposals
JVs/ partnerships
Legal entity structure
Organization and design
Location strategy and real estate
Near shore/ offshoring
Intra-group services
Technology optimization
Insourcing/ Outsourcing
Digital ecosystem/ collaboration
Capital, tax and liquidity
Intelligent automation Advanced analytics and data
Process digitization
Source and supplier management Workforce management and compensation
Productivity and performance
Data management Governance, compliance, control Change portfolio
Cost enablers: Baselining existing costs Cost drivers of tomorrow Business case Monitoring of implementation Benefits realization
Strategic
Structural
Operational

12 MENA quarterly banking report: Q4 2020
Sector insights (cont’d)
4. Enabling greater customer centricity
Talent
• Putting the customer in the center of any business decision require banks to look at the entire ecosystem, with own employees playing the key role. Digitization of services and experiences, as well as the pandemic are having a profound effect on the day-to-day banking operations in MENA and on the future of work in the sector in general. This flexibility is expected to expand the pool of candidates of talent that is not bound by geographic locations across MENA as well as opens the opportunity to reshape the workforce model.
New ways of working allow to realign fixed costs amid a changed operating environment
• The success of remote working and digital channels means many banks may adopt a flexible, hybrid approach to working to both reduce costs and retain a competitive edge in the complex talent market. Moving to a more flexible talent model – with flexible rewards – can allow to build a more variable cost base and position banks to better match future customer and work demands, while reducing fixed costs.
Alignment of workforce model to future intelligent operations
• Banks should consider how to balance internal resources with external providers, use artificial intelligence (AI) to automate or accelerate manual processes, adjust the level of straight-through processing, and deploy automation to reduce dependence on individual third parties.
• Deploying managed services, especially in areas that don’t provide a material competitive advantage, such as anti-money laundering (AML) checks or know your customer (KYC) services, can reduce costs and achieve greater scalability. Recent EY research found that 61% of banks are looking to co-source tax-related activities with third-party vendors.
Building new people capabilities based on customer journey
• Many banks in MENA as well as globally struggle to compete with tech companies for talents. Attracting talent with tech, data analysis and design thinking capabilities that are in high demand can be challenging for banks in MENA, which are facing strong competition from tech, start-ups and service providers.
• Designing employee experience in line with the customer experience can benefit both. Employees would see themselves as directly contributing to the business success at any touch point of the customer journey, while upskilling themselves right on the job. Customers will benefit from customer centricity put in the core of all banking operations, including people management.
Agility to support business transformation
• As technological adoption accelerates, so does the change in the entire banking ecosystem. If technology is the main driver of competitiveness for banks, then company culture, the ways of working and priorities need to be adjusted accordingly.
• There is an inherent contradiction in attempting to empower the fast paced, innovative agile culture associated with technology companies while also trying to maintain the necessary risk profile of a regulated entity. Banks in MENA region will need to balance between the customer-centric approach, agile business transformation and culture shift which enable trust and at the same time is ultimately build on data-driven decisions and technology.

13 MENA quarterly banking report: Q4 2020
Sector insights (cont’d)
5. Building a more resilient enterprise to enable agility
The Global Banking Outlook highlighted how the world’s most consistently profitable banks focus on three key pillars — cost, resilience and customer centricity. That is why banks need to adopt a resiliency by design approach in order to achieve agility. With the drive toward remote working, automation, open banking and the application programming interface (API) economy, establishing a secure and resilient infrastructure that addresses people, process and technology risks will be key if banks are looking to transform and respond quickly to market shifts and new consumer behaviors. Formulating a cybersecurity strategy that addresses the need to prevent, detect and respond to cybersecurity incident, having the needed crisis management plans, procedures and guidelines, periodically stress testing the contingency plans, and improving the implemented controls will be a key factor in achieving resiliency and consequently maintaining enterprise agility.
6. Emergence of platform and ecosystem business models
Prior to COVID-19, the MENA banking landscape was already undergoing a profound disruption, powered by emerging digital technologies, rapidly evolving customer preferences and new competitive threats from fintech and big technology firms. In the post-COVID-19 era, this continues to be accelerating at a speed where banks must not only embrace but also transform with this new norm to be relevant to its increasingly savvy and demanding consumer. Not doing so is simply not an option — unless a bank is seeking a candid exit from the industry in the near future.
The customers are seeking not only to buy a banking product within seconds, they are also looking for a service that extends beyond a product, which provides an experience, a service that is personalized and brings together lifestyle needs, choices and access that is fueled by an ecosystem of providers. Not only does this create a lock-in effect with your consumer, but it also provides new and alternate revenue streams for a bank. Simply put, to compete and survive, banks in the region must embrace ecosystem business models to drive growth, and generate value.
Collaborating with partners through platform-based ecosystems is a smart way for banks to gain customer trust, and bolster product and service offerings to improve customer experiences, deepen relationships and drive revenue growth. European and Asian banks are fast catching on to this, and in some cases have already shown great success, but much is yet to be seen and done in MENA.
To create an ecosystem business model that encompasses speed, collaboration, specialism and bringing of new propositions to customers faster, banks must redefine their business and operating models that consider the following six key principles for interaction:
• Platforms — less is more: Simplification of the banks’ technology architecture to capitalize on ecosystem technology is the key. Platforms that leverage data from multiple sources, combined with advanced analytics, can connect customers to hyper-personalized value propositions, such as loan forgiveness solutions or innovative pricing options for products.
• A robust API strategy: Robust API strategy is driven by clear design principles including being user-centric, incorporating common industry standards, ensuring third parties can easily “discover” the APIs, and incorporating user feedback. It must also embed security, using encryption methods; improve documentation so developers can easily adopt, support and maintain the APIs; and include analytics so the business and developer can assess the effectiveness of the API program.
• Monetization: A well-designed API strategy should unlock a range of revenue opportunities for banks by identifying data streams to monetize, identifying new customers, and by using data to create better insights and underwriting strategies.
• Partnership building: Banks need to design and clearly communicate rules of engagement, such as the types of partnerships — long-term, investments, contractual, alliances, cross-sector, whether to engage fintechs, and how they will manage risk, share rewards, and foster creativity and innovation
14 MENA quarterly banking report: Q4 2020
Sector insights (cont’d)
• Regulatory compliance: New regulations may give some banks the opportunity to unlock additional value. Some banks are restricted to offering services only within their charters, and some nonbanks are restricted from providing banking services
• Talent recruitment: Ecosystems and the changing nature of work means banks need a plan for acquiring and training digital talent with the right skill set to work with multiple partners. To attract digital talent and help them thrive, banks should strive to create a more entrepreneurial culture and agile working environment
EY research shows that while each bank will have its own approach to building its ecosystem around its business model, what is clear is that this fundamental shift and importance of digital ecosystems will be integral to the future of the financial sector … this is no longer a chief information officer (CIO) or “technology” issue but rather a top Board priority.
In late 2020, EY MENA embarked on a survey of over 40 banks across MENA to find out how they are moving beyond their strategic vision to deliver the necessary innovations and the challenges they’re facing from the impact from COVID-19 and the acceleration of Digital to their business model. The focus of the survey was aimed at CIOs, chief digital officers (CDO) and chief marketing officers (CMO), covering eight MENA countries.
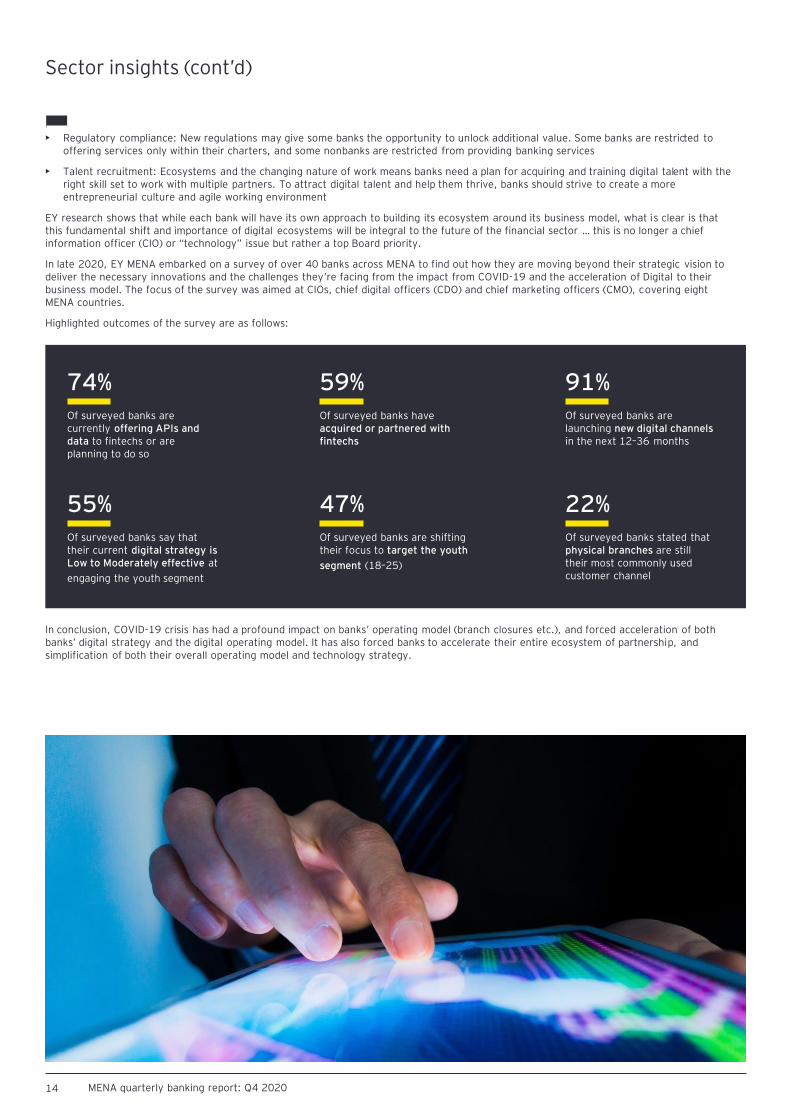
Highlighted outcomes of the survey are as follows:
In conclusion, COVID-19 crisis has had a profound impact on banks’ operating model (branch closures etc.), and forced acceleration of both banks’ digital strategy and the digital operating model. It has also forced banks to accelerate their entire ecosystem of partnership, and simplification of both their overall operating model and technology strategy.
74%Of surveyed banks are currently offering APIs and data to fintechs or are planning to do so
59%Of surveyed banks have acquired or partnered with fintechs
91%Of surveyed banks are launching new digital channels in the next 12–36 months
55%Of surveyed banks say that their current digital strategy is Low to Moderately effective at
engaging the youth segment
47%Of surveyed banks are shifting their focus to target the youth
segment (18–25)
22%Of surveyed banks stated that physical branches are still their most commonly used customer channel

15 MENA quarterly banking report: Q4 2020
Sector insights (cont’d)
7. Financial crime
The efficient performance of the financial industry greatly depends on the effectiveness and adequacy of the relevant regulations. The regulators aim to align with international best practices and new reforms are introduced to attain sustained levels of operational efficiency from time to time. Local regulators work in collaboration with global regulators, for the purpose of safeguarding the integrity of the global financial system.
The regulators in the MENA region are, as always, vigilant to combat unlawful conduct and mitigate the risk of financial crime by imposing penalties on violations and introducing means to improve consumer confidence. The global regulators are also adopting new measures and are allocating more resources to mitigate the risks of financial crimes arising under the cover of the COVID-19 pandemic.
Global focus on money laundering and the financing of terrorism has grown markedly in recent years. As criminals have developed new and innovative tactics to perpetrate their crimes, global financial regulators have evolved to stay one step ahead, reshaping the financial services industry while prioritizing Financial Crime Compliance (FCC).
As a result of the changing regulatory landscape, financial institutions have been required to develop new processes and systems, regularly assess areas of their business, and ensure that appropriate internal safeguards are in place to mitigate any identified financial crime risks. Financial institutions are also expected to identify emerging risk trends by using data analytics and technology; hence, shifting from a reactive approach to a more proactive one.
Since the banking system is expected to undergo fundamental changes in response to the weaknesses highlighted by the COVID-19 pandemic, defining a strategic response focusing on changes to risk management methodologies, processes and systems will be vital. The rapid shift in ways of working will also push financial institutions to review what is required in the workforce of the future and to create a more flexible organization. While solving the now and exploring the next, financial institutions should thus start thinking about how they can exploit the longer-term shift and economic recovery. This will help to establish capabilities, strategy and presence for long-term value creation and enterprise resilience in the face of a future crisis. Progress is also evident for regulatory bodies, especially in the Middle East region. The regulators, most recently the National Anti Money Laundering And Combatting Financing Of Terrorism and Financing of Illegal Organizations Committee (NAMLCFTC) have restructured regulatory requirements and introduced technology-driven solutions, to mitigate globally identified financial crime risks. These actions have been taken in line with the efforts of the Financial Action Task Force (FATF) to develop best practices, while catering to an evolving landscape.

16 MENA quarterly banking report: Q4 2020
Sector insights (cont’d)
8. Stress testing and balance sheet management
COVID-19 has highlighted the significant difference between the capabilities needed for enterprise-wide stress tests used for medium-termplanning and COVID-19-related stress tests. Current scenarios that banks use for stress testing and the assumptions underpinning the liquidity management are insufficient for enabling banks to adequately plan to navigate ahead in a pandemic scenario.
The short and sharp, yet prolonged and constantly changing nature of the global pandemic has resulted in financial institutions having to review their scenarios on an ongoing basis, and consider a range of additional support measures, medical developments and range of social distancing and containment strategies in their design. This resulted in the need for a much greater agility in the forecasting and stress testing approach, which is traditionally a very lengthy process requiring manual overrides and extensive input from across all parts of the business. “Reverse-stress” tests used for adverse and severe one-off events are also no longer fit for the purpose.
The full effect of the current pandemic on bank capital ratios is hard to fully predict at this stage. Extensive government stimulus and support packages across MENA has reduced the full impact on impairments and NPLs. However, there could be a significant cliff-edge effect and a large volume of insolvencies once those measures are lifted. Furthermore, change in consumer behavior and social patterns accelerated by the pandemic are likely to have a long-term impact on the financial sector as countries slowly emerge out of recession. Besides the major demand and supply-side shocks caused by the spread of COVID-19, the MENA region is further hit by the sharp decline in oil prices with countries across the region needing to revitalize their economies, increase productivity and digitization, and reduce dependency of economic output on oil.
There is an urgent need to look at risk-weighted asset (RWA) management, cost management, pricing and finding strategies as well as portfolio rationalization. In response to the pandemic, financial institutions need to introduce a much greater discipline around pricing and margins across both assets and liabilities. Liquidity assumptions need to be redefined in light of relief measures, revised expectations of customers’ ability to make repayments and the analysis of the draw-downs of existing facilities. This will require a departure from the traditional approaches to balance sheet management built around LDR, and toward approaches that are underpinned by a greater understanding of costumer behaviorand market opportunities. In the long-term, this is likely to lead to reconsideration of portfolios, risk appetite and move to off-balance sheet to improve fee-based revenues.

17 MENA quarterly banking report: Q4 2020
Although 2020 has been an exceptionally challenging year for global and MENA economies, the gradual increase in oil outputs due to tapering of production cuts as per the Organization of the Petroleum Exporting Countries plus (OPEC+) agreement, and progress toward vaccination are expected to boost the economic activity in most Middle East countries in 2021.

Section summary02
18 MENA quarterly banking report: Q4 2020
03 Macroeconomic indicators
Regional containment measures are weighing on domestic activity, while the global downturn is hurting external demand. Moreover, oil exporters are hit by lower average oil prices compared with 2019 and constrained oil production following the OPEC+ deal. However, the fiscal and monetary policy support in response to the COVID-19 pandemic has been swift in most economies such as the UAE, KSA, Kuwait, Oman and Qatar. Also, most of these countries are making a strong progress toward administering COVID-19 vaccine, which will boost the non-oil sector. These measures are expected to balance the economies and their outlook in the medium-term.
In the KSA, the economy is expected to recover in the medium-term, supported by recovery in oil and non-oil sectors, combined with effective containment of COVID-19 by expanding the reach of vaccine.
In the UAE, the growth in the number of tourists primarily driven by improved relations with Qatar and Israel, combined with policy reforms, will stimulate growth in the non-oil economy, while the oil sector will remain a drag on growth.
Qatar economy is expected to recover in 2021, backed by the infrastructure related spending ahead of the FIFA World Cup, wider reach of the COVID-19 vaccine and fiscal flexibility.
In Kuwait, the sluggish vaccination progress, tightening of border restrictions and a general shift back toward restrictions in other parts of the world will hamper growth through 2021.
Oman’s economy is expected to recover supported by the visa-free travel and progressing vaccination programs even though the ongoing pressure on oil sector and fears over more transmissible variants of COVID-19 virus may dampen the overall momentum.
Bahrain’s economy is highly impacted by fall in oil sector due to OPEC+ agreement and stringent lockdown measures due to COVID-19; however, a rebound is expected in 2021, driven predominantly by the non-oil sector as vaccine progresses, international travel resumes and reopening of the economy bolsters growth.
Egypt’s economy is expected to recover in the medium-term as global demand picks up and new energy projects gain momentum, thereby increasing the investment. Jordan is expected to recover in 2021, only if there is a continued economic activity without any lockdown.
Macroeconomic indicators (cont’d)
KSA
In the KSA, the rapid implementation of COVID-19 containment measures has helped to limit the health impact of the pandemic. The number of fatalities in the Kingdom has been relatively low, supported by the relatively young population, improved testing and better treatment of the virus in hospitals.
The KSA economy contracted only by 4.1% in 2020, driven by a sharp contraction in oil GDP in the context of OPEC+ oil production cuts. This decline is less severe when compared with many advanced and emerging economies.
The non-oil real GDP shrank relatively less in 2020 due to the Kingdom’s relatively small services sector.
In 2021, the country’s economy is expected to recover supported by recovery in oil and non-oil sectors combined with effective containment of COVID-19. The recovery will be supported by the large Public Investment Fund (PIF) projects underway. PIF will increase its investments to US$40b in 2021 (5.5% of GDP), compared with US$16b in 2019. Most of the investments will be concentrated in real-estate projects.
The recovery is expected to accelerate in the second half of 2021 as the second wave of the pandemic recedes, COVID-19 vaccines become widely available and oil production cuts are tapered in line with the OPEC+ agreement.
The higher oil prices combined with recovery in non-oil revenues is expected to narrow the fiscal deficit from 11.9% of GDP in 2020 to 4.3% in 2021.
The UAE non-oil economy had a relatively strong finish to 2020, but the recovery is now faltering again due to increased travel restrictions in Europe and, in particular, the air corridor with the UK suspended.
Travel and tourism accounts for about 16% of GDP in the UAE and hence the longer that COVID-19 restrictions endure in Europe and elsewhere, the more they will weigh on the UAE’s recovery.
Despite increase in staycations*, the visitor numbers fell by nearly 60% in 2020 and hotel occupancy rates are well below the pre-COVID-19 levels.
Nevertheless, the surge in travel to Dubai at the end of 2020 illustrates the willingness of travelers to spring back. This also bodes well for the success of Expo 2021, which creates an opportunity for a faster recovery in Dubai. The improved relations with Qatar and Israel will also boost visitor numbers. These factors, combined with policy reforms will stimulate growth in the non-oil economy though the governments in the UAE have provided only modest direct fiscal support to the non-oil economy.
The oil output is likely to rise only gradually in 2021 due to current OPEC+ policy and as a result, the oil sector will continue to be a drag on growth.
As for the banking sector, the Government has already taken measures to tackle oversupply and the Central Bank of UAE (CBUAE) is relaxing rules to improve banks’ ability to support the real estate and other sectors. The CBUAE also doubled the size of its stimulus package to AED256b, and allowed banks and finance companies in the country to extend deferrals of principal and interest payments to their customers until 31 December 2020.
UAE
19 MENA quarterly banking report: Q4 2020
GDP(nominal) US$792.9b
Government expenditure percentage of GDP
35.6
Consumer price index (CPI)
97.9
Inflation
–2.1Domestic demand (nominal)
US$714.5b
Industrial production index
133.9
Government investment (nominal)
US$40.9b
GDP(nominal) US$421.1b
Government expenditure percentage of GDP
25.4
CPI
109
Inflation
–1.9Domestic demand (nominal)
US$320.3b
Industrial production index
156.3
Government investment (nominal)
US$48.9b
The banking systemin the Kingdom has remained relatively resilient, helped by sound initial capital and liquidity positions, and flexible response by the Saudi Central Bank, previously known as Saudi Arabian Monetary Authority (SAMA), including regulatory forbearance. Monetary policy is expected to remain accommodative until the recovery is well-established.
*Staycations: a vacation spent in one’s home country rather than abroad or one spent at home involving day trips to local attractions.
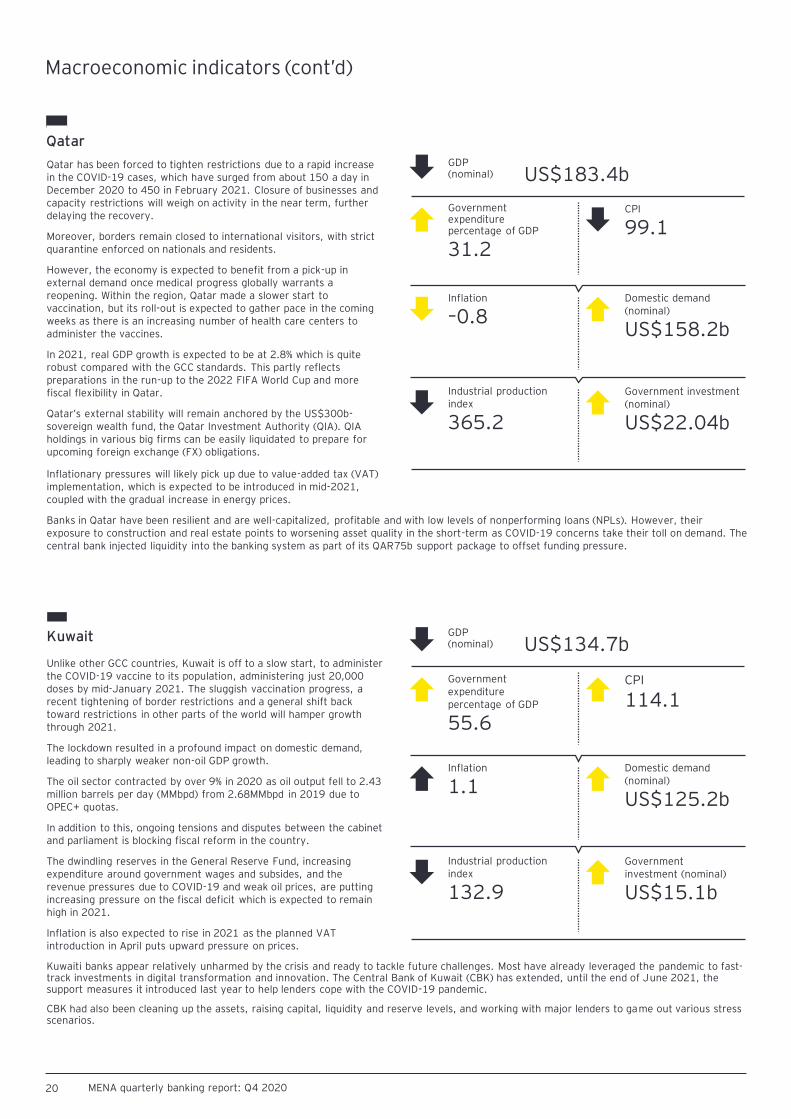
Qatar has been forced to tighten restrictions due to a rapid increase in the COVID-19 cases, which have surged from about 150 a day in December 2020 to 450 in February 2021. Closure of businesses and capacity restrictions will weigh on activity in the near term, further delaying the recovery.
Moreover, borders remain closed to international visitors, with strict quarantine enforced on nationals and residents.
However, the economy is expected to benefit from a pick-up in external demand once medical progress globally warrants a reopening. Within the region, Qatar made a slower start to vaccination, but its roll-out is expected to gather pace in the coming weeks as there is an increasing number of health care centers to administer the vaccines.
In 2021, real GDP growth is expected to be at 2.8% which is quite robust compared with the GCC standards. This partly reflects preparations in the run-up to the 2022 FIFA World Cup and more fiscal flexibility in Qatar.
Qatar’s external stability will remain anchored by the US$300b-sovereign wealth fund, the Qatar Investment Authority (QIA). QIA holdings in various big firms can be easily liquidated to prepare for upcoming foreign exchange (FX) obligations.
Unlike other GCC countries, Kuwait is off to a slow start, to administer the COVID-19 vaccine to its population, administering just 20,000 doses by mid-January 2021. The sluggish vaccination progress, a recent tightening of border restrictions and a general shift back toward restrictions in other parts of the world will hamper growth through 2021.
The lockdown resulted in a profound impact on domestic demand, leading to sharply weaker non-oil GDP growth.
The oil sector contracted by over 9% in 2020 as oil output fell to 2.43 million barrels per day (MMbpd) from 2.68MMbpd in 2019 due to OPEC+ quotas.
In addition to this, ongoing tensions and disputes between the cabinet and parliament is blocking fiscal reform in the country.
The dwindling reserves in the General Reserve Fund, increasing expenditure around government wages and subsides, and the revenue pressures due to COVID-19 and weak oil prices, are putting increasing pressure on the fiscal deficit which is expected to remain high in 2021.
Inflation is also expected to rise in 2021 as the planned VAT introduction in April puts upward pressure on prices.
Kuwait
20 MENA quarterly banking report: Q4 2020
Inflationary pressures will likely pick up due to value-added tax (VAT) implementation, which is expected to be introduced in mid-2021, coupled with the gradual increase in energy prices.
Banks in Qatar have been resilient and are well-capitalized, profitable and with low levels of nonperforming loans (NPLs). However, their exposure to construction and real estate points to worsening asset quality in the short-term as COVID-19 concerns take their toll on demand. The central bank injected liquidity into the banking system as part of its QAR75b support package to offset funding pressure.
Kuwaiti banks appear relatively unharmed by the crisis and ready to tackle future challenges. Most have already leveraged the pandemic to fast-track investments in digital transformation and innovation. The Central Bank of Kuwait (CBK) has extended, until the end of June 2021, the support measures it introduced last year to help lenders cope with the COVID-19 pandemic.
CBK had also been cleaning up the assets, raising capital, liquidity and reserve levels, and working with major lenders to game out various stress scenarios.
Qatar
Macroeconomic indicators (cont’d)
GDP(nominal) US$183.4b
Government expenditure percentage of GDP
31.2
CPI
99.1
Inflation
–0.8Domestic demand (nominal)
US$158.2b
Industrial production index
365.2
Government investment (nominal)
US$22.04b
GDP(nominal) US$134.7b
Government expenditure percentage of GDP
55.6
CPI
114.1
Inflation
1.1Domestic demand (nominal)
US$125.2b
Industrial production index
132.9
Government investment (nominal)
US$15.1b
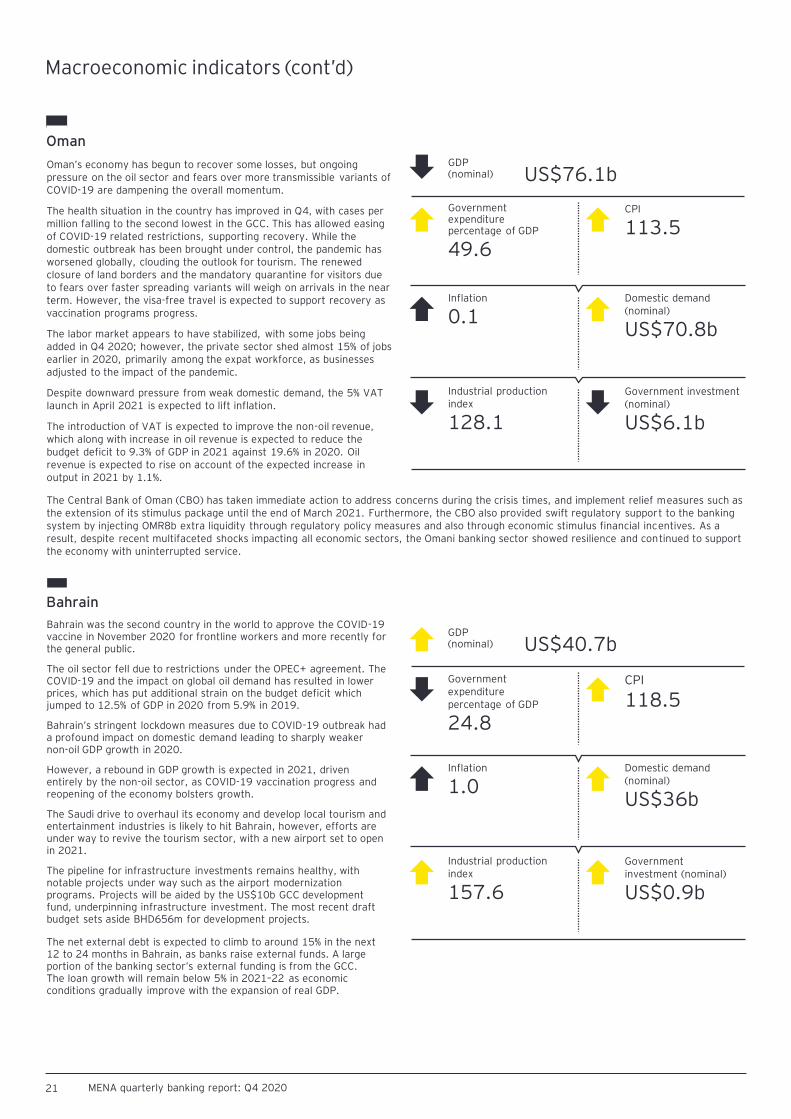
Oman’s economy has begun to recover some losses, but ongoing pressure on the oil sector and fears over more transmissible variants of COVID-19 are dampening the overall momentum.
The health situation in the country has improved in Q4, with cases per million falling to the second lowest in the GCC. This has allowed easing of COVID-19 related restrictions, supporting recovery. While the domestic outbreak has been brought under control, the pandemic has worsened globally, clouding the outlook for tourism. The renewed closure of land borders and the mandatory quarantine for visitors due to fears over faster spreading variants will weigh on arrivals in the near term. However, the visa-free travel is expected to support recovery as vaccination programs progress.
The labor market appears to have stabilized, with some jobs being added in Q4 2020; however, the private sector shed almost 15% of jobs earlier in 2020, primarily among the expat workforce, as businesses adjusted to the impact of the pandemic.
Despite downward pressure from weak domestic demand, the 5% VAT launch in April 2021 is expected to lift inflation.
The introduction of VAT is expected to improve the non-oil revenue, which along with increase in oil revenue is expected to reduce the budget deficit to 9.3% of GDP in 2021 against 19.6% in 2020. Oil revenue is expected to rise on account of the expected increase in output in 2021 by 1.1%.
Bahrain was the second country in the world to approve the COVID-19 vaccine in November 2020 for frontline workers and more recently for the general public.
The oil sector fell due to restrictions under the OPEC+ agreement. The COVID-19 and the impact on global oil demand has resulted in lower prices, which has put additional strain on the budget deficit which jumped to 12.5% of GDP in 2020 from 5.9% in 2019.
Bahrain’s stringent lockdown measures due to COVID-19 outbreak had a profound impact on domestic demand leading to sharply weaker non-oil GDP growth in 2020.
However, a rebound in GDP growth is expected in 2021, driven entirely by the non-oil sector, as COVID-19 vaccination progress and reopening of the economy bolsters growth.
The Saudi drive to overhaul its economy and develop local tourism and entertainment industries is likely to hit Bahrain, however, efforts are under way to revive the tourism sector, with a new airport set to open in 2021.
The pipeline for infrastructure investments remains healthy, with notable projects under way such as the airport modernization programs. Projects will be aided by the US$10b GCC development fund, underpinning infrastructure investment. The most recent draft budget sets aside BHD656m for development projects.
Bahrain
21 MENA quarterly banking report: Q4 2020
The Central Bank of Oman (CBO) has taken immediate action to address concerns during the crisis times, and implement relief measures such as the extension of its stimulus package until the end of March 2021. Furthermore, the CBO also provided swift regulatory support to the banking system by injecting OMR8b extra liquidity through regulatory policy measures and also through economic stimulus financial incentives. As a result, despite recent multifaceted shocks impacting all economic sectors, the Omani banking sector showed resilience and continued to support the economy with uninterrupted service.
The net external debt is expected to climb to around 15% in the next 12 to 24 months in Bahrain, as banks raise external funds. A large portion of the banking sector’s external funding is from the GCC. The loan growth will remain below 5% in 2021–22 as economic conditions gradually improve with the expansion of real GDP.
Macroeconomic indicators (cont’d)
Oman
GDP(nominal) US$76.1b
Government expenditure percentage of GDP
49.6
CPI
113.5
Inflation
0.1Domestic demand (nominal)
US$70.8b
Industrial production index
128.1
Government investment (nominal)
US$6.1b
GDP(nominal) US$40.7b
Government expenditure percentage of GDP
24.8
CPI
118.5
Inflation
1.0Domestic demand (nominal)
US$36b
Industrial production index
157.6
Government investment (nominal)
US$0.9b
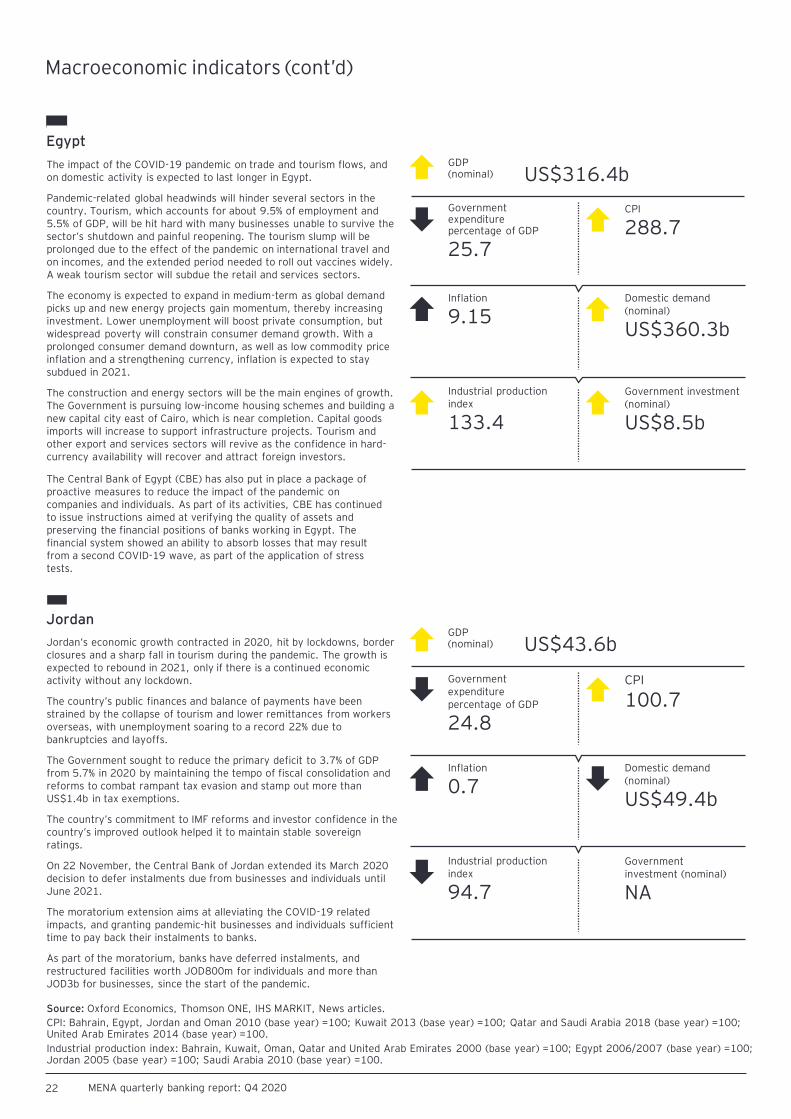
The impact of the COVID-19 pandemic on trade and tourism flows, and on domestic activity is expected to last longer in Egypt.
Pandemic-related global headwinds will hinder several sectors in the country. Tourism, which accounts for about 9.5% of employment and 5.5% of GDP, will be hit hard with many businesses unable to survive the sector’s shutdown and painful reopening. The tourism slump will be prolonged due to the effect of the pandemic on international travel and on incomes, and the extended period needed to roll out vaccines widely. A weak tourism sector will subdue the retail and services sectors.
The economy is expected to expand in medium-term as global demand picks up and new energy projects gain momentum, thereby increasing investment. Lower unemployment will boost private consumption, but widespread poverty will constrain consumer demand growth. With a prolonged consumer demand downturn, as well as low commodity price inflation and a strengthening currency, inflation is expected to stay subdued in 2021.
The construction and energy sectors will be the main engines of growth. The Government is pursuing low-income housing schemes and building a new capital city east of Cairo, which is near completion. Capital goods imports will increase to support infrastructure projects. Tourism and other export and services sectors will revive as the confidence in hard-currency availability will recover and attract foreign investors.
Jordan’s economic growth contracted in 2020, hit by lockdowns, border closures and a sharp fall in tourism during the pandemic. The growth is expected to rebound in 2021, only if there is a continued economic activity without any lockdown.
The country’s public finances and balance of payments have been strained by the collapse of tourism and lower remittances from workers overseas, with unemployment soaring to a record 22% due to bankruptcies and layoffs.
The Government sought to reduce the primary deficit to 3.7% of GDP from 5.7% in 2020 by maintaining the tempo of fiscal consolidation and reforms to combat rampant tax evasion and stamp out more than US$1.4b in tax exemptions.
The country’s commitment to IMF reforms and investor confidence in the country’s improved outlook helped it to maintain stable sovereign ratings.
On 22 November, the Central Bank of Jordan extended its March 2020 decision to defer instalments due from businesses and individuals until June 2021.
The moratorium extension aims at alleviating the COVID-19 related impacts, and granting pandemic-hit businesses and individuals sufficient time to pay back their instalments to banks.
As part of the moratorium, banks have deferred instalments, and restructured facilities worth JOD800m for individuals and more than JOD3b for businesses, since the start of the pandemic.
Jordan
22 MENA quarterly banking report: Q4 2020
Source: Oxford Economics, Thomson ONE, IHS MARKIT, News articles.
CPI: Bahrain, Egypt, Jordan and Oman 2010 (base year) =100; Kuwait 2013 (base year) =100; Qatar and Saudi Arabia 2018 (base year) =100;United Arab Emirates 2014 (base year) =100.
Industrial production index: Bahrain, Kuwait, Oman, Qatar and United Arab Emirates 2000 (base year) =100; Egypt 2006/2007 (base year) =100;Jordan 2005 (base year) =100; Saudi Arabia 2010 (base year) =100.
The Central Bank of Egypt (CBE) has also put in place a package of proactive measures to reduce the impact of the pandemic on companies and individuals. As part of its activities, CBE has continued to issue instructions aimed at verifying the quality of assets and preserving the financial positions of banks working in Egypt. The financial system showed an ability to absorb losses that may result from a second COVID-19 wave, as part of the application of stress tests.
Macroeconomic indicators (cont’d)
Egypt
GDP(nominal) US$316.4b
Government expenditure percentage of GDP
25.7
CPI
288.7
Inflation
9.15Domestic demand (nominal)
US$360.3b
Industrial production index
133.4
Government investment (nominal)
US$8.5b
GDP(nominal) US$43.6b
Government expenditure percentage of GDP
24.8
CPI
100.7
Inflation
0.7Domestic demand (nominal)
US$49.4b
Industrial production index
94.7
Government investment (nominal)
NA

23 MENA quarterly banking report: Q4 2020
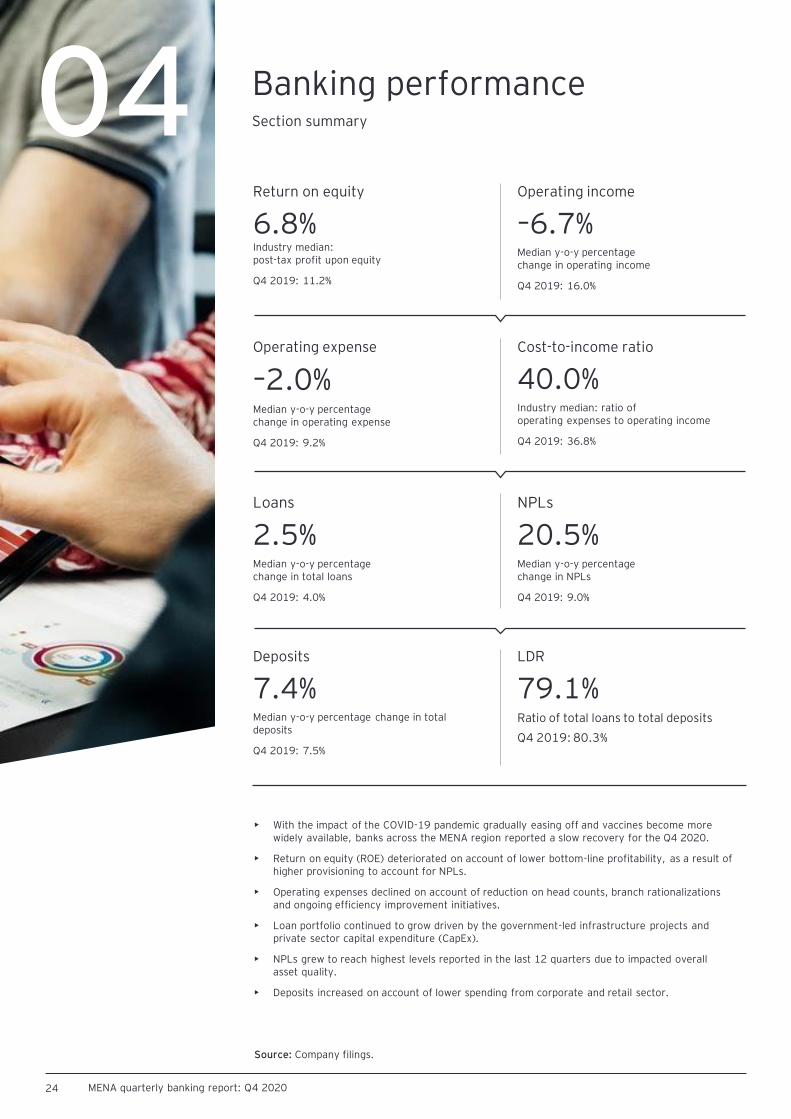
Q4 2020 KPIs: a selection of median year-over-year (y-o-y) percentage change of figures and ratios
24 MENA quarterly banking report: Q4 2020
Source: Company filings.
Return on equity
6.8%Industry median: post-tax profit upon equity
Q4 2019: 11.2%
• With the impact of the COVID-19 pandemic gradually easing off and vaccines become more widely available, banks across the MENA region reported a slow recovery for the Q4 2020.
• Return on equity (ROE) deteriorated on account of lower bottom-line profitability, as a result of higher provisioning to account for NPLs.
• Operating expenses declined on account of reduction on head counts, branch rationalizations and ongoing efficiency improvement initiatives.
• Loan portfolio continued to grow driven by the government-led infrastructure projects and private sector capital expenditure (CapEx).
• NPLs grew to reach highest levels reported in the last 12 quarters due to impacted overall asset quality.
• Deposits increased on account of lower spending from corporate and retail sector.
Operating income
–6.7%Median y-o-y percentage change in operating income
Q4 2019: 16.0%
Operating expense
–2.0%Median y-o-y percentage change in operating expense
Q4 2019: 9.2%
Cost-to-income ratio
40.0%Industry median: ratio of operating expenses to operating income
Q4 2019: 36.8%
Loans
2.5%Median y-o-y percentage change in total loans
Q4 2019: 4.0%
NPLs
20.5%Median y-o-y percentage change in NPLs
Q4 2019: 9.0%
Deposits
7.4%Median y-o-y percentage change in total deposits
Q4 2019: 7.5%
LDR
79.1%Ratio of total loans to total deposits
Q4 2019: 80.3%
Banking performance04 Section summary
Banking performance
25 MENA quarterly banking report: Q4 2020
11
.1%
11
.6%
13
.5%
10
.6%
7.0
%
11
.3%
25
.2%
7.9
%
8.1
%
6.3
%
10
.7%
7.3
%
1.7
%
5.0
%
19
.7%
-0.9
%
-5.0%
0.0%
5.0%
10.0%
15.0%
20.0%
25.0%
30.0%
KS
A
UA
E
Qa
tar
Ku
wa
it
Om
an
Ba
hra
in
Eg
yp
t
Jo
rda
n
Q4 2019 Q4 2020
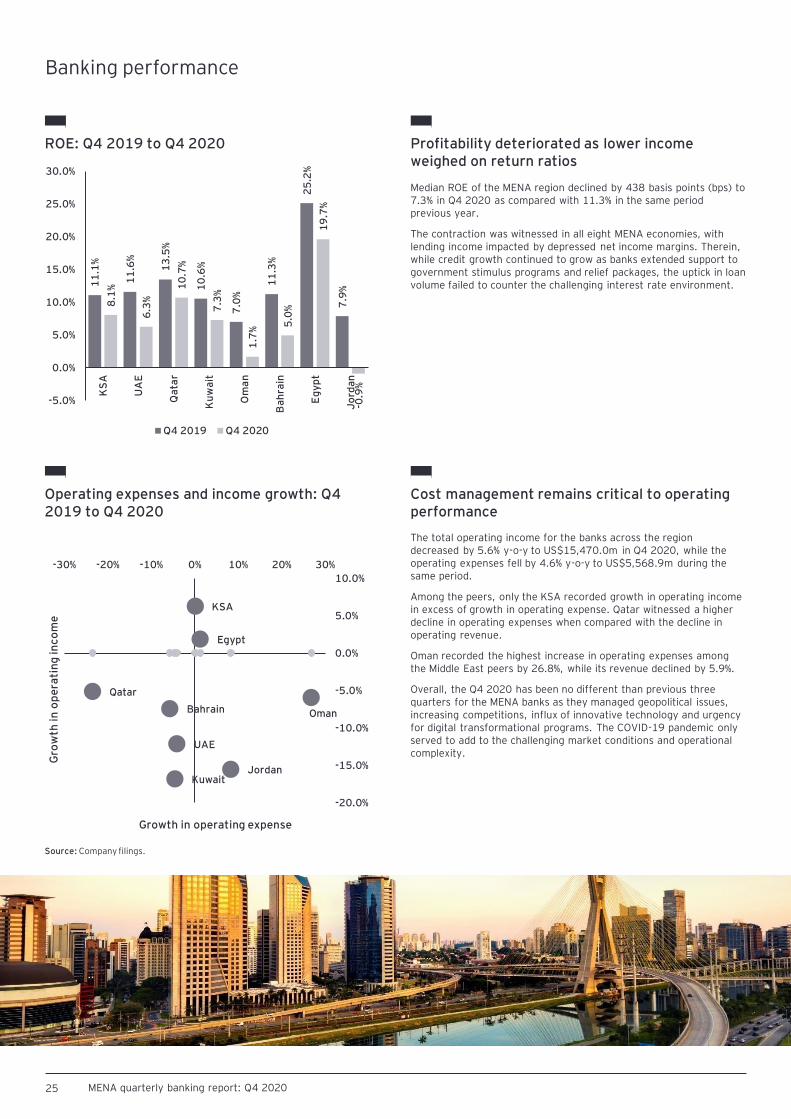
ROE: Q4 2019 to Q4 2020
Median ROE of the MENA region declined by 438 basis points (bps) to 7.3% in Q4 2020 as compared with 11.3% in the same period previous year.
The contraction was witnessed in all eight MENA economies, with lending income impacted by depressed net income margins. Therein, while credit growth continued to grow as banks extended support to government stimulus programs and relief packages, the uptick in loan volume failed to counter the challenging interest rate environment.
Profitability deteriorated as lower income weighed on return ratios
Operating expenses and income growth: Q4 2019 to Q4 2020
The total operating income for the banks across the region decreased by 5.6% y-o-y to US$15,470.0m in Q4 2020, while the operating expenses fell by 4.6% y-o-y to US$5,568.9m during the same period.
Among the peers, only the KSA recorded growth in operating income in excess of growth in operating expense. Qatar witnessed a higher decline in operating expenses when compared with the decline in operating revenue.
Oman recorded the highest increase in operating expenses among the Middle East peers by 26.8%, while its revenue declined by 5.9%.
Overall, the Q4 2020 has been no different than previous three quarters for the MENA banks as they managed geopolitical issues, increasing competitions, influx of innovative technology and urgency for digital transformational programs. The COVID-19 pandemic only served to add to the challenging market conditions and operational complexity.
Cost management remains critical to operating performance
Growth in operating expense
Gro
wth
in o
pe
rati
ng
inco
me
Source: Company filings.
KSA
UAE
Qatar
Kuwait
OmanBahrain
Egypt
Jordan
-20.0%
-15.0%
-10.0%
-5.0%
0.0%
5.0%
10.0%
-30% -20% -10% 0% 10% 20% 30%
26 MENA quarterly banking report: Q4 2020
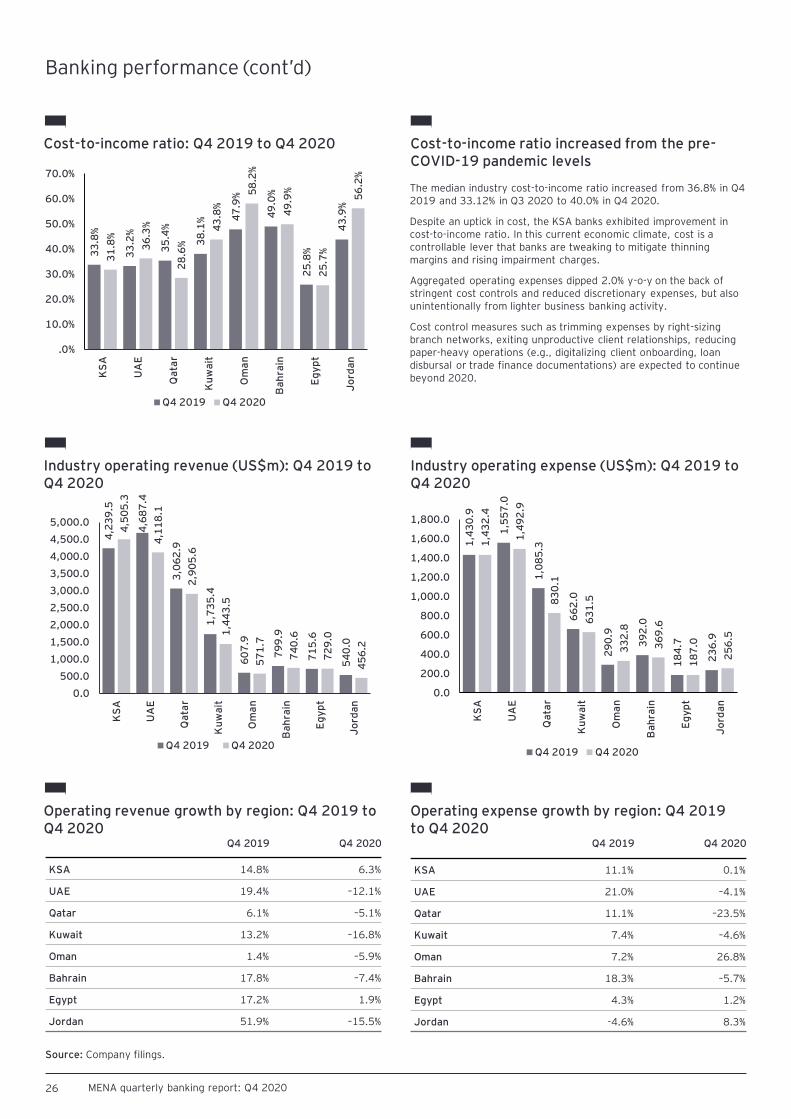
Cost-to-income ratio: Q4 2019 to Q4 2020
The median industry cost-to-income ratio increased from 36.8% in Q4 2019 and 33.12% in Q3 2020 to 40.0% in Q4 2020.
Despite an uptick in cost, the KSA banks exhibited improvement in cost-to-income ratio. In this current economic climate, cost is a controllable lever that banks are tweaking to mitigate thinning margins and rising impairment charges.
Aggregated operating expenses dipped 2.0% y-o-y on the back of stringent cost controls and reduced discretionary expenses, but also unintentionally from lighter business banking activity.
Cost control measures such as trimming expenses by right-sizing branch networks, exiting unproductive client relationships, reducing paper-heavy operations (e.g., digitalizing client onboarding, loan disbursal or trade finance documentations) are expected to continue beyond 2020.
Cost-to-income ratio increased from the pre-COVID-19 pandemic levels
Source: Company filings.
33
.8%
33
.2%
35
.4%
38
.1% 4
7.9
%
49
.0%
25
.8%
43
.9%
31
.8%
36
.3%
28
.6%
43
.8%
58
.2%
49
.9%
25
.7%
56
.2%
.0%
10.0%
20.0%
30.0%
40.0%
50.0%
60.0%
70.0%
KS
A
UA
E
Qa
tar
Ku
wa
it
Om
an
Ba
hra
in
Eg
yp
t
Jo
rda
n
Q4 2019 Q4 2020
Industry operating revenue (US$m): Q4 2019 toQ4 2020
Industry operating expense (US$m): Q4 2019 toQ4 2020
4,2
39
.5
4,6
87
.4
3,0
62
.9
1,7
35
.4
60
7.9
79
9.9
71
5.6
54
0.0
4,5
05
.3
4,1
18
.1
2,9
05
.6
1,4
43
.5
57
1.7
74
0.6
72
9.0
45
6.2
0.0
500.0
1,000.0
1,500.0
2,000.0
2,500.0
3,000.0
3,500.0
4,000.0
4,500.0
5,000.0
KS
A
UA
E
Qa
tar
Ku
wa
it
Om
an
Ba
hra
in
Eg
yp
t
Jo
rda
n
Q4 2019 Q4 2020
1,4
30
.9
1,5
57
.0
1,0
85
.3
66
2.0
29
0.9
39
2.0
18
4.7
23
6.9
1,4
32
.4
1,4
92
.9
83
0.1
63
1.5
33
2.8
36
9.6
18
7.0
25
6.5
0.0
200.0
400.0
600.0
800.0
1,000.0
1,200.0
1,400.0
1,600.0
1,800.0
KS
A
UA
E
Qa
tar
Ku
wa
it
Om
an
Ba
hra
in
Eg
yp
t
Jo
rda
n
Q4 2019 Q4 2020
Operating revenue growth by region: Q4 2019 toQ4 2020
Operating expense growth by region: Q4 2019 to Q4 2020
Q4 2019 Q4 2020
KSA 14.8% 6.3%
UAE 19.4% –12.1%
Qatar 6.1% –5.1%
Kuwait 13.2% –16.8%
Oman 1.4% –5.9%
Bahrain 17.8% –7.4%
Egypt 17.2% 1.9%
Jordan 51.9% –15.5%
Q4 2019 Q4 2020
KSA 11.1% 0.1%
UAE 21.0% –4.1%
Qatar 11.1% –23.5%
Kuwait 7.4% –4.6%
Oman 7.2% 26.8%
Bahrain 18.3% –5.7%
Egypt 4.3% 1.2%
Jordan -4.6% 8.3%
Banking performance (cont’d)
27 MENA quarterly banking report: Q4 2020
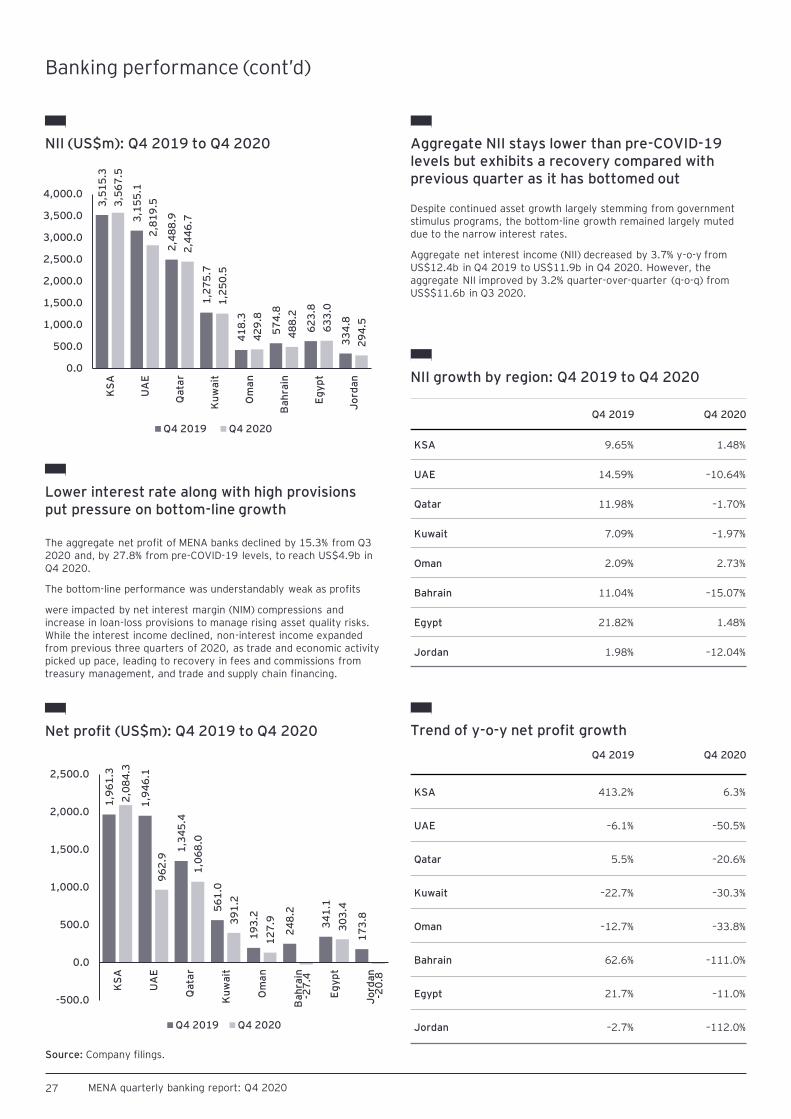
NII (US$m): Q4 2019 to Q4 2020
Despite continued asset growth largely stemming from government stimulus programs, the bottom-line growth remained largely muted due to the narrow interest rates.
Aggregate net interest income (NII) decreased by 3.7% y-o-y from US$12.4b in Q4 2019 to US$11.9b in Q4 2020. However, the aggregate NII improved by 3.2% quarter-over-quarter (q-o-q) from US$$11.6b in Q3 2020.
Aggregate NII stays lower than pre-COVID-19 levels but exhibits a recovery compared with previous quarter as it has bottomed out
Lower interest rate along with high provisions put pressure on bottom-line growth
3,5
15
.3
3,1
55
.1
2,4
88
.9
1,2
75
.7
41
8.3
57
4.8
62
3.8
33
4.8
3,5
67
.5
2,8
19
.5
2,4
46
.7
1,2
50
.5
42
9.8
48
8.2
63
3.0
29
4.5
0.0
500.0
1,000.0
1,500.0
2,000.0
2,500.0
3,000.0
3,500.0
4,000.0
KS
A
UA
E
Qa
tar
Ku
wa
it
Om
an
Ba
hra
in
Eg
yp
t
Jo
rda
n
Q4 2019 Q4 2020
The aggregate net profit of MENA banks declined by 15.3% from Q3 2020 and, by 27.8% from pre-COVID-19 levels, to reach US$4.9b in Q4 2020.
The bottom-line performance was understandably weak as profits
were impacted by net interest margin (NIM) compressions and increase in loan-loss provisions to manage rising asset quality risks. While the interest income declined, non-interest income expanded from previous three quarters of 2020, as trade and economic activity picked up pace, leading to recovery in fees and commissions from treasury management, and trade and supply chain financing.
Net profit (US$m): Q4 2019 to Q4 2020
1,9
61
.3
1,9
46
.1
1,3
45
.4
56
1.0
19
3.2
24
8.2
34
1.1
17
3.8
2,0
84
.3
96
2.9
1,0
68
.0
39
1.2
12
7.9
-27
.4
30
3.4
-20
.8
-500.0
0.0
500.0
1,000.0
1,500.0
2,000.0
2,500.0
KS
A
UA
E
Qa
tar
Ku
wa
it
Om
an
Ba
hra
in
Eg
yp
t
Jo
rda
n
Q4 2019 Q4 2020
NII growth by region: Q4 2019 to Q4 2020
Q4 2019 Q4 2020
KSA 9.65% 1.48%
UAE 14.59% –10.64%
Qatar 11.98% –1.70%
Kuwait 7.09% –1.97%
Oman 2.09% 2.73%
Bahrain 11.04% –15.07%
Egypt 21.82% 1.48%
Jordan 1.98% –12.04%
Q4 2019 Q4 2020
KSA 413.2% 6.3%
UAE –6.1% –50.5%
Qatar 5.5% –20.6%
Kuwait –22.7% –30.3%
Oman –12.7% –33.8%
Bahrain 62.6% –111.0%
Egypt 21.7% –11.0%
Jordan –2.7% –112.0%
Trend of y-o-y net profit growth
Banking performance (cont’d)
Source: Company filings.
28 MENA quarterly banking report: Q4 2020
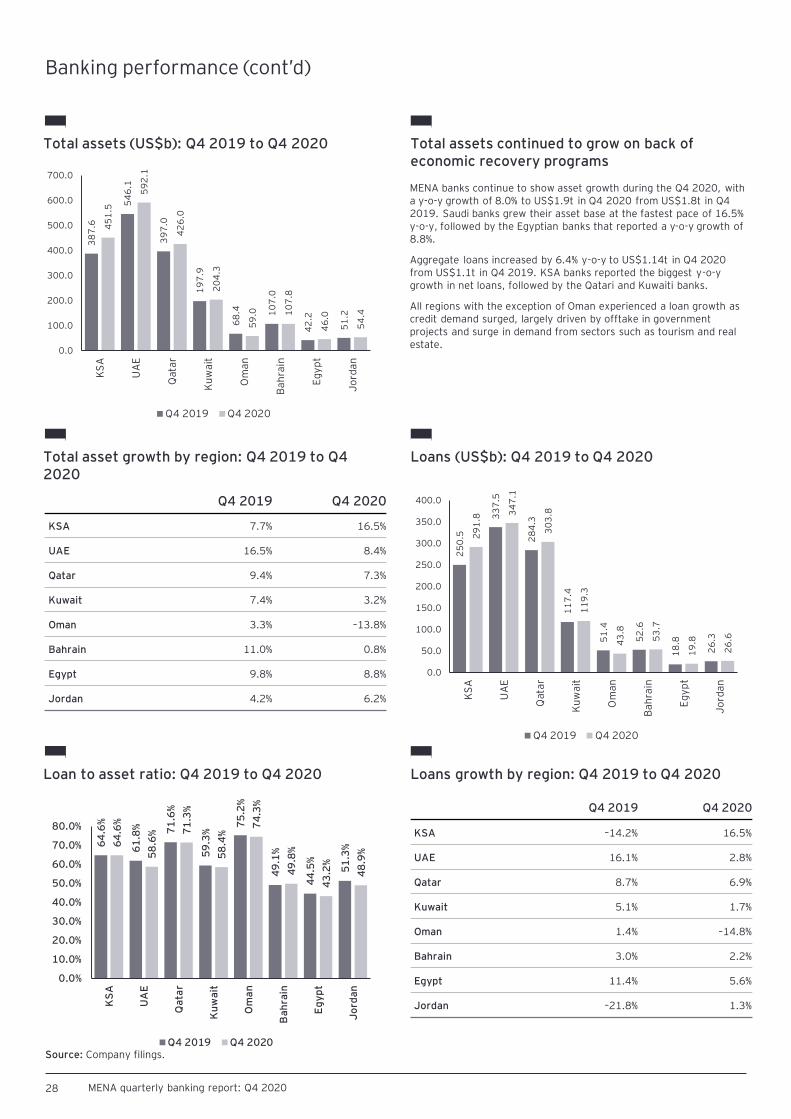
Total assets (US$b): Q4 2019 to Q4 2020
MENA banks continue to show asset growth during the Q4 2020, with a y-o-y growth of 8.0% to US$1.9t in Q4 2020 from US$1.8t in Q4 2019. Saudi banks grew their asset base at the fastest pace of 16.5% y-o-y, followed by the Egyptian banks that reported a y-o-y growth of 8.8%.
Aggregate loans increased by 6.4% y-o-y to US$1.14t in Q4 2020 from US$1.1t in Q4 2019. KSA banks reported the biggest y-o-y growth in net loans, followed by the Qatari and Kuwaiti banks.
All regions with the exception of Oman experienced a loan growth as credit demand surged, largely driven by offtake in government projects and surge in demand from sectors such as tourism and real estate.
Total assets continued to grow on back of economic recovery programs
Loans (US$b): Q4 2019 to Q4 2020
38
7.6
54
6.1
39
7.0
19
7.9
68
.4 10
7.0
42
.2
51
.2
45
1.5
59
2.1
42
6.0
20
4.3
59
.0 10
7.8
46
.0
54
.40.0
100.0
200.0
300.0
400.0
500.0
600.0
700.0
KS
A
UA
E
Qata
r
Ku
wa
it
Om
an
Ba
hra
in
Eg
yp
t
Jo
rda
n
Q4 2019 Q4 2020
Total asset growth by region: Q4 2019 to Q4 2020
Q4 2019 Q4 2020
KSA 7.7% 16.5%
UAE 16.5% 8.4%
Qatar 9.4% 7.3%
Kuwait 7.4% 3.2%
Oman 3.3% –13.8%
Bahrain 11.0% 0.8%
Egypt 9.8% 8.8%
Jordan 4.2% 6.2%
25
0.5
33
7.5
28
4.3
11
7.4
51
.4
52
.6
18
.8
26
.3
29
1.8
34
7.1
30
3.8
11
9.3
43
.8
53
.7
19
.8
26
.6
0.0
50.0
100.0
150.0
200.0
250.0
300.0
350.0
400.0
KS
A
UA
E
Qata
r
Ku
wa
it
Om
an
Ba
hra
in
Eg
yp
t
Jo
rda
n
Q4 2019 Q4 2020
Loans growth by region: Q4 2019 to Q4 2020Loan to asset ratio: Q4 2019 to Q4 2020
64
.6%
61
.8% 71
.6%
59
.3%
75
.2%
49
.1%
44
.5%
51
.3%6
4.6
%
58
.6% 7
1.3
%
58
.4%
74
.3%
49
.8%
43
.2%
48
.9%
0.0%
10.0%
20.0%
30.0%
40.0%
50.0%
60.0%
70.0%
80.0%
KS
A
UA
E
Qa
tar
Ku
wa
it
Om
an
Ba
hra
in
Eg
yp
t
Jo
rda
n
Q4 2019 Q4 2020
Q4 2019 Q4 2020
KSA –14.2% 16.5%
UAE 16.1% 2.8%
Qatar 8.7% 6.9%
Kuwait 5.1% 1.7%
Oman 1.4% –14.8%
Bahrain 3.0% 2.2%
Egypt 11.4% 5.6%
Jordan –21.8% 1.3%
Banking performance (cont’d)
Source: Company filings.
29 MENA quarterly banking report: Q4 2020
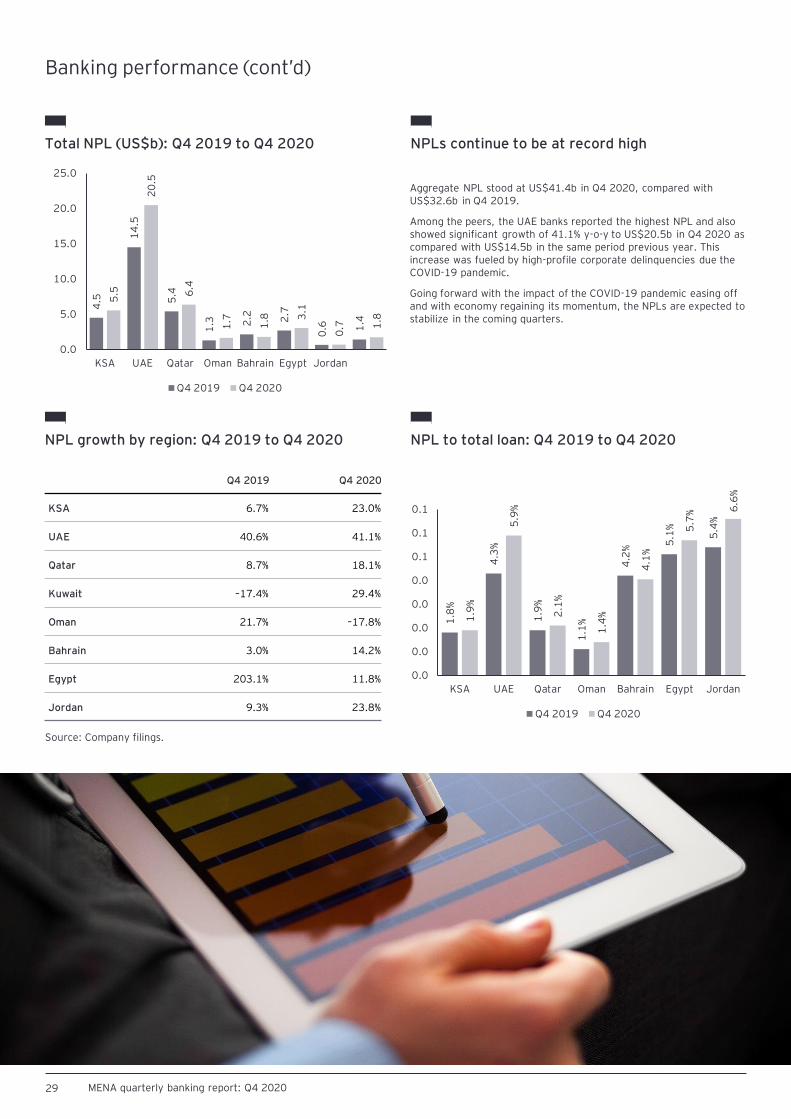
Total NPL (US$b): Q4 2019 to Q4 2020
Aggregate NPL stood at US$41.4b in Q4 2020, compared with US$32.6b in Q4 2019.
Among the peers, the UAE banks reported the highest NPL and also showed significant growth of 41.1% y-o-y to US$20.5b in Q4 2020 as compared with US$14.5b in the same period previous year. This increase was fueled by high-profile corporate delinquencies due the COVID-19 pandemic.
Going forward with the impact of the COVID-19 pandemic easing off and with economy regaining its momentum, the NPLs are expected to stabilize in the coming quarters.
NPLs continue to be at record high
4.5
14
.5
5.4
1.3 2
.2 2.7
0.6 1
.4
5.5
20
.5
6.4
1.7
1.8 3
.1
0.7 1
.8
0.0
5.0
10.0
15.0
20.0
25.0
KSA UAE Qatar Oman Bahrain Egypt Jordan
Q4 2019 Q4 2020
NPL growth by region: Q4 2019 to Q4 2020 NPL to total loan: Q4 2019 to Q4 2020
Q4 2019 Q4 2020
KSA 6.7% 23.0%
UAE 40.6% 41.1%
Qatar 8.7% 18.1%
Kuwait –17.4% 29.4%
Oman 21.7% –17.8%
Bahrain 3.0% 14.2%
Egypt 203.1% 11.8%
Jordan 9.3% 23.8%
1.8
%
4.3
%
1.9
%
1.1
%
4.2
%
5.1
%
5.4
%
1.9
%
5.9
%
2.1
%
1.4
%
4.1
%
5.7
% 6.6
%
0.0
0.0
0.0
0.0
0.0
0.1
0.1
0.1
KSA UAE Qatar Oman Bahrain Egypt Jordan
Q4 2019 Q4 2020
Banking performance (cont’d)
Source: Company filings.
30 MENA quarterly banking report: Q4 2020
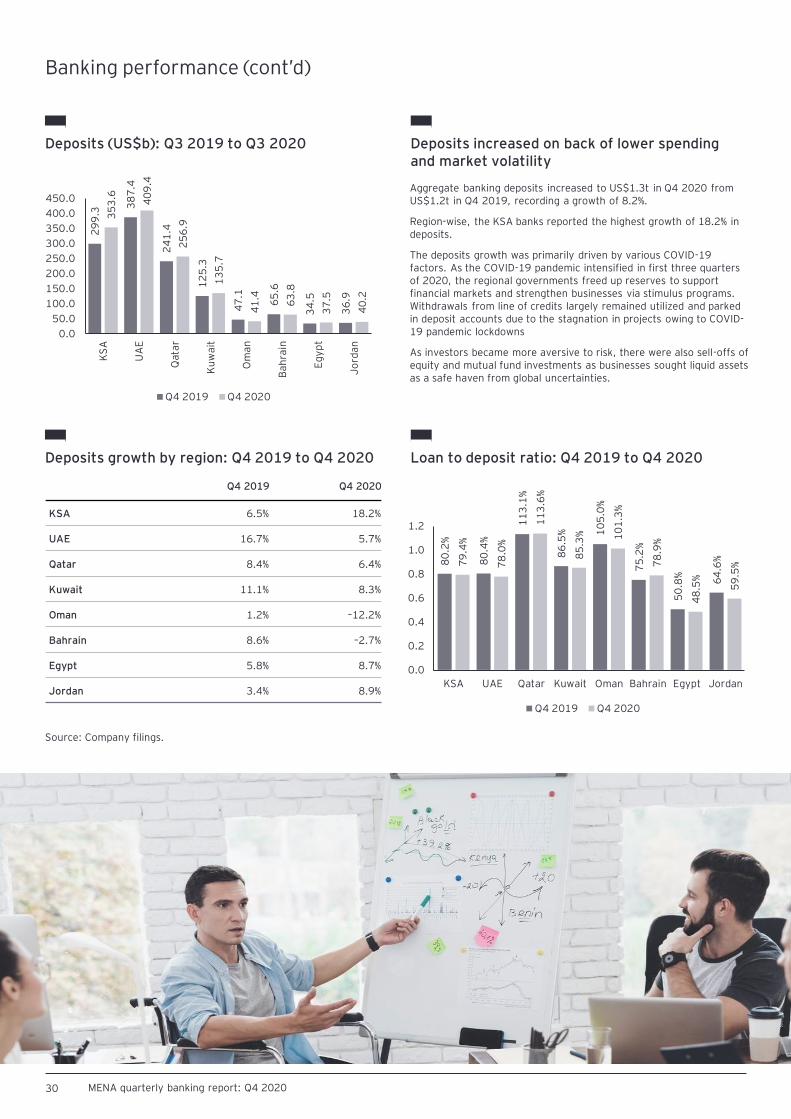
Deposits (US$b): Q3 2019 to Q3 2020
Aggregate banking deposits increased to US$1.3t in Q4 2020 from US$1.2t in Q4 2019, recording a growth of 8.2%.
Region-wise, the KSA banks reported the highest growth of 18.2% in deposits.
The deposits growth was primarily driven by various COVID-19 factors. As the COVID-19 pandemic intensified in first three quarters of 2020, the regional governments freed up reserves to support financial markets and strengthen businesses via stimulus programs. Withdrawals from line of credits largely remained utilized and parked in deposit accounts due to the stagnation in projects owing to COVID-19 pandemic lockdowns
As investors became more aversive to risk, there were also sell-offs of equity and mutual fund investments as businesses sought liquid assets as a safe haven from global uncertainties.
Deposits increased on back of lower spending and market volatility
29
9.3
38
7.4
24
1.4
12
5.3
47
.1
65
.6
34
.5
36
.9
35
3.6 40
9.4
25
6.9
13
5.7
41
.4
63
.8
37
.5
40
.2
0.0
50.0
100.0
150.0
200.0
250.0
300.0
350.0
400.0
450.0
KS
A
UA
E
Qata
r
Ku
wa
it
Om
an
Ba
hra
in
Eg
yp
t
Jo
rda
n
Q4 2019 Q4 2020
Deposits growth by region: Q4 2019 to Q4 2020 Loan to deposit ratio: Q4 2019 to Q4 2020
Q4 2019 Q4 2020
KSA 6.5% 18.2%
UAE 16.7% 5.7%
Qatar 8.4% 6.4%
Kuwait 11.1% 8.3%
Oman 1.2% –12.2%
Bahrain 8.6% –2.7%
Egypt 5.8% 8.7%
Jordan 3.4% 8.9%
80
.2%
80
.4%
11
3.1
%
86
.5% 1
05
.0%
75
.2%
50
.8%
64
.6%79
.4%
78
.0%
11
3.6
%
85
.3% 10
1.3
%
78
.9%
48
.5%
59
.5%
0.0
0.2
0.4
0.6
0.8
1.0
1.2
KSA UAE Qatar Kuwait Oman Bahrain Egypt Jordan
Q4 2019 Q4 2020
Source: Company filings.
Banking performance (cont’d)


32 MENA quarterly banking report: Q3 2020
Glossary
33 MENA quarterly banking report: Q4 2020
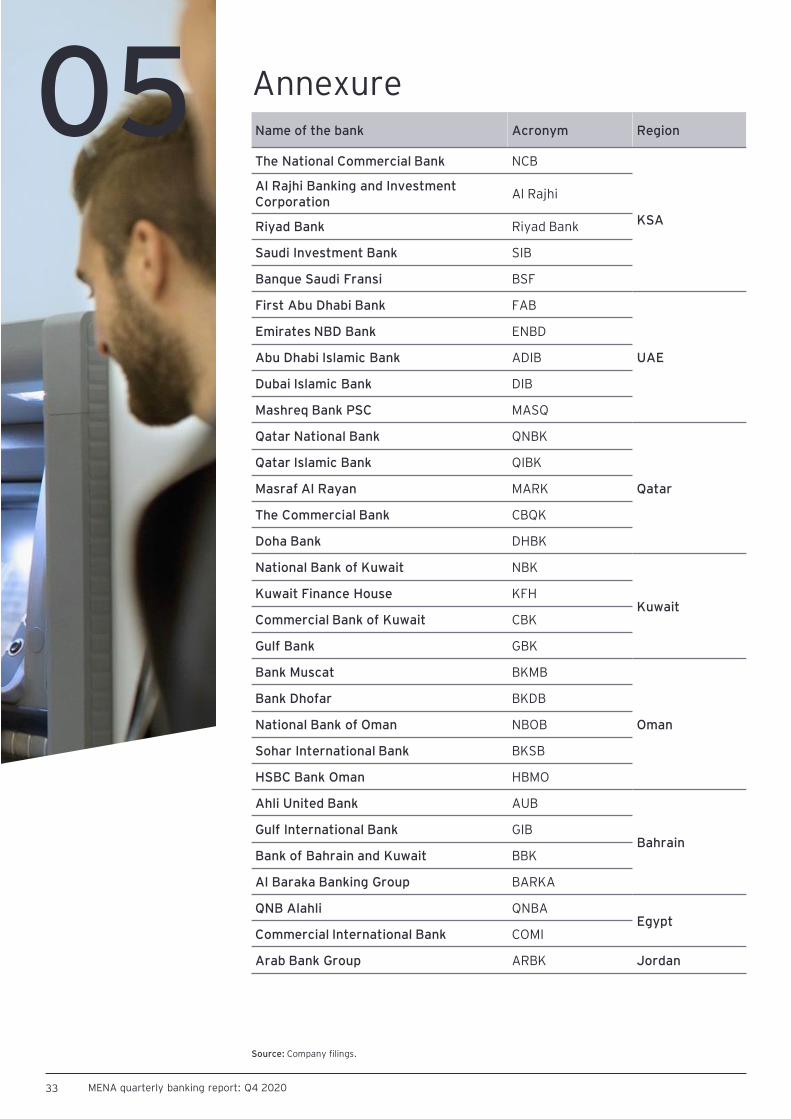
Name of the bank Acronym Region
The National Commercial Bank NCB
KSA
Al Rajhi Banking and Investment Corporation
Al Rajhi
Riyad Bank Riyad Bank
Saudi Investment Bank SIB
Banque Saudi Fransi BSF
First Abu Dhabi Bank FAB
UAE
Emirates NBD Bank ENBD
Abu Dhabi Islamic Bank ADIB
Dubai Islamic Bank DIB
Mashreq Bank PSC MASQ
Qatar National Bank QNBK
Qatar
Qatar Islamic Bank QIBK
Masraf Al Rayan MARK
The Commercial Bank CBQK
Doha Bank DHBK
National Bank of Kuwait NBK
KuwaitKuwait Finance House KFH
Commercial Bank of Kuwait CBK
Gulf Bank GBK
Bank Muscat BKMB
Oman
Bank Dhofar BKDB
National Bank of Oman NBOB
Sohar International Bank BKSB
HSBC Bank Oman HBMO
Ahli United Bank AUB
BahrainGulf International Bank GIB
Bank of Bahrain and Kuwait BBK
Al Baraka Banking Group BARKA
QNB Alahli QNBAEgypt
Commercial International Bank COMI
Arab Bank Group ARBK Jordan
Annexure05
Source: Company filings.
34 MENA quarterly banking report: Q4 2020
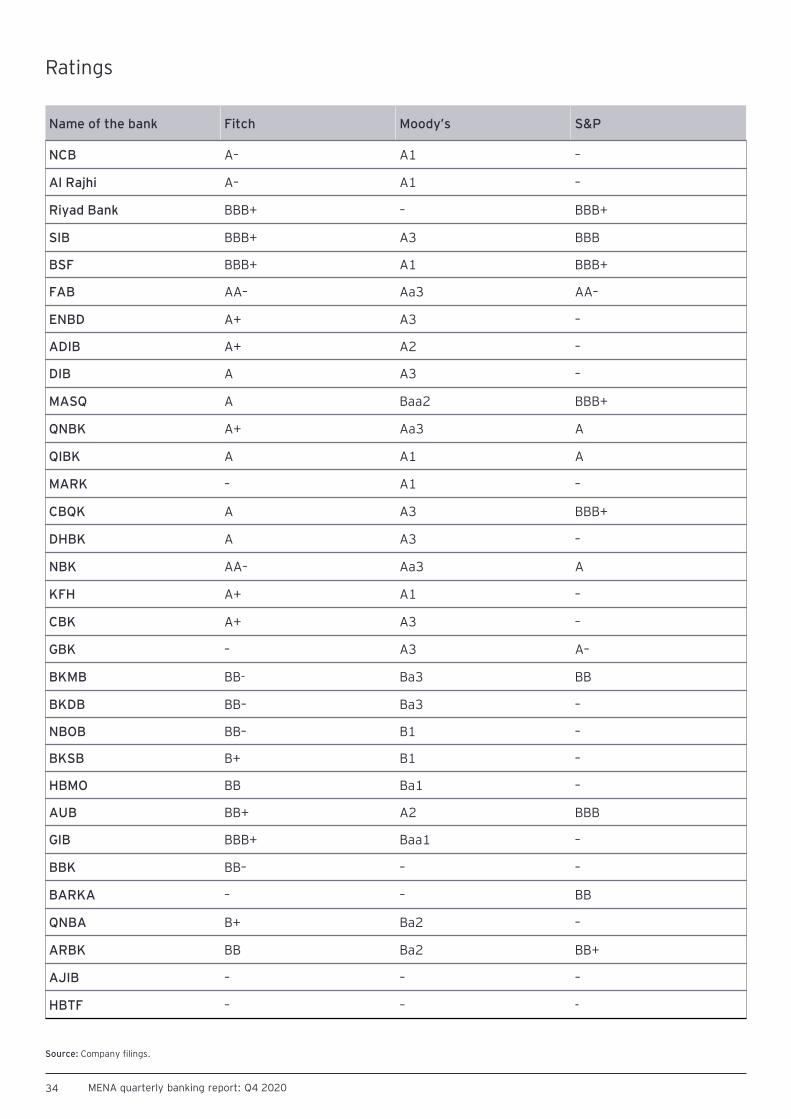
Ratings
Name of the bank Fitch Moody’s S&P
NCB A– A1 –
Al Rajhi A– A1 –
Riyad Bank BBB+ – BBB+
SIB BBB+ A3 BBB
BSF BBB+ A1 BBB+
FAB AA– Aa3 AA–
ENBD A+ A3 –
ADIB A+ A2 –
DIB A A3 –
MASQ A Baa2 BBB+
QNBK A+ Aa3 A
QIBK A A1 A
MARK – A1 –
CBQK A A3 BBB+
DHBK A A3 –
NBK AA– Aa3 A
KFH A+ A1 –
CBK A+ A3 –
GBK – A3 A–
BKMB BB- Ba3 BB
BKDB BB– Ba3 –
NBOB BB– B1 –
BKSB B+ B1 –
HBMO BB Ba1 –
AUB BB+ A2 BBB
GIB BBB+ Baa1 –
BBK BB– – –
BARKA – – BB
QNBA B+ Ba2 –
ARBK BB Ba2 BB+
AJIB – – –
HBTF – – -
Source: Company filings.
35 MENA quarterly banking report: Q4 2020
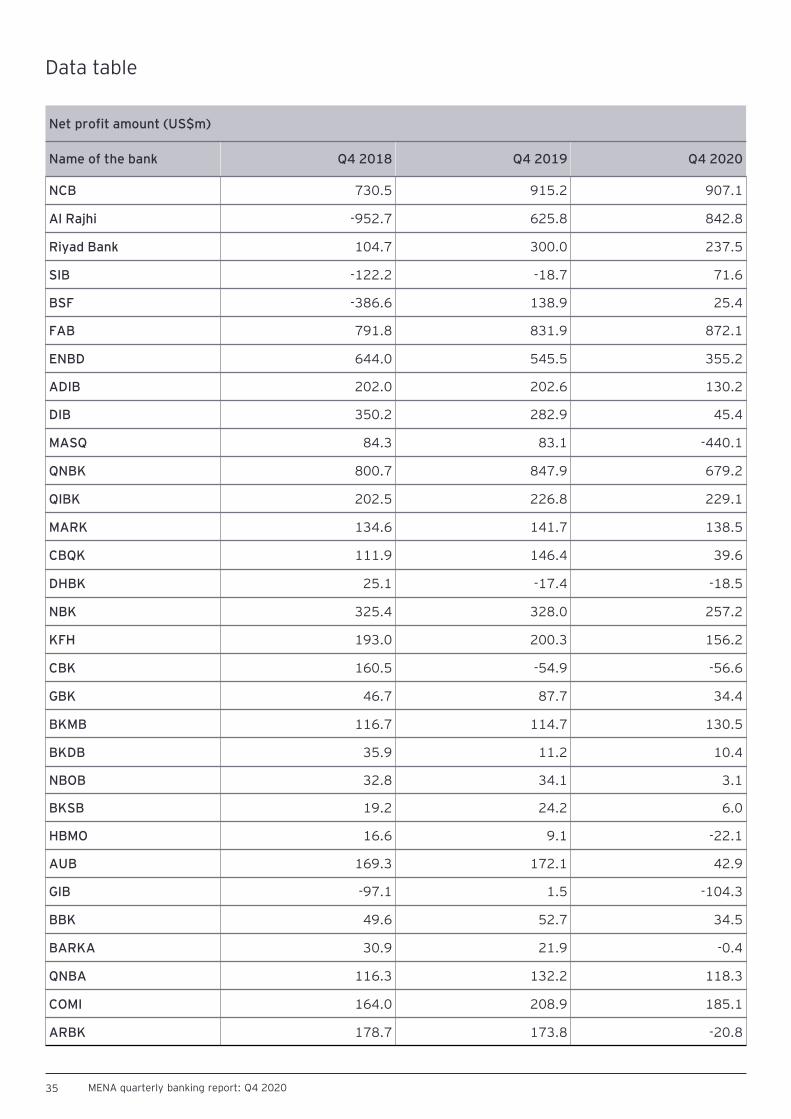
Data table
Net profit amount (US$m)
Name of the bank Q4 2018 Q4 2019 Q4 2020
NCB 730.5 915.2 907.1
Al Rajhi -952.7 625.8 842.8
Riyad Bank 104.7 300.0 237.5
SIB -122.2 -18.7 71.6
BSF -386.6 138.9 25.4
FAB 791.8 831.9 872.1
ENBD 644.0 545.5 355.2
ADIB 202.0 202.6 130.2
DIB 350.2 282.9 45.4
MASQ 84.3 83.1 -440.1
QNBK 800.7 847.9 679.2
QIBK 202.5 226.8 229.1
MARK 134.6 141.7 138.5
CBQK 111.9 146.4 39.6
DHBK 25.1 -17.4 -18.5
NBK 325.4 328.0 257.2
KFH 193.0 200.3 156.2
CBK 160.5 -54.9 -56.6
GBK 46.7 87.7 34.4
BKMB 116.7 114.7 130.5
BKDB 35.9 11.2 10.4
NBOB 32.8 34.1 3.1
BKSB 19.2 24.2 6.0
HBMO 16.6 9.1 -22.1
AUB 169.3 172.1 42.9
GIB -97.1 1.5 -104.3
BBK 49.6 52.7 34.5
BARKA 30.9 21.9 -0.4
QNBA 116.3 132.2 118.3
COMI 164.0 208.9 185.1
ARBK 178.7 173.8 -20.8
36 MENA quarterly banking report: Q4 2020
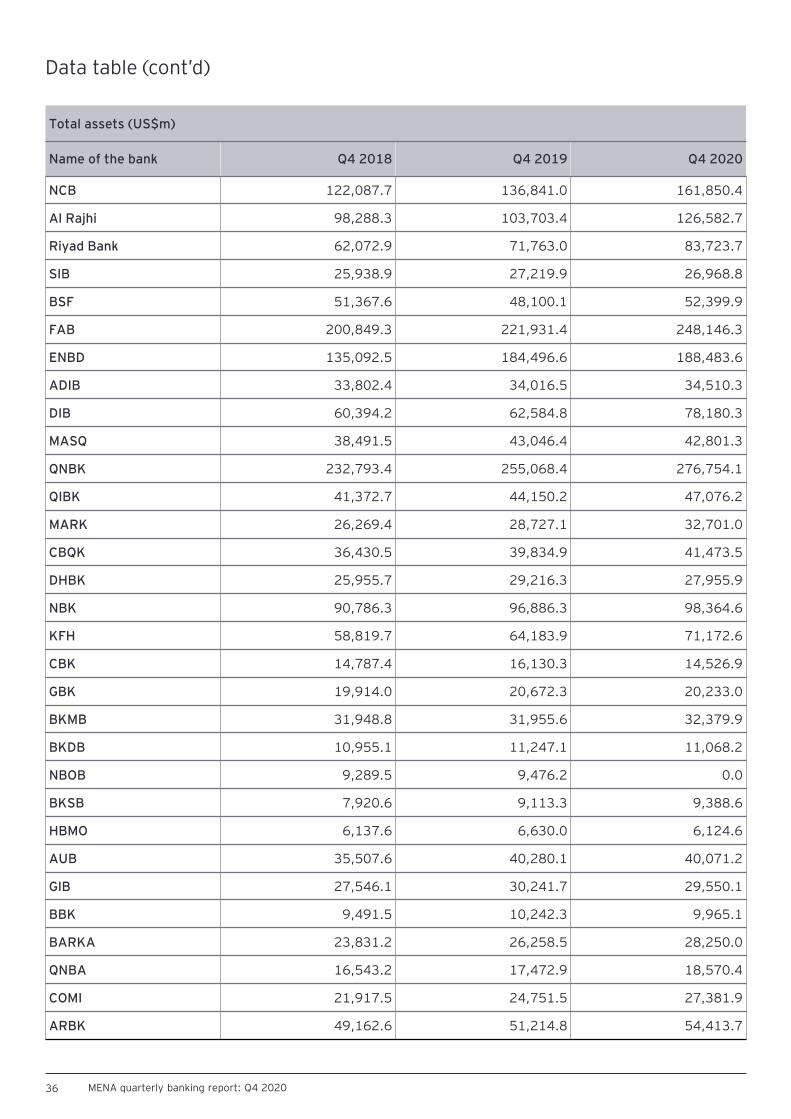
Data table (cont’d)
Total assets (US$m)
Name of the bank Q4 2018 Q4 2019 Q4 2020
NCB 122,087.7 136,841.0 161,850.4
Al Rajhi 98,288.3 103,703.4 126,582.7
Riyad Bank 62,072.9 71,763.0 83,723.7
SIB 25,938.9 27,219.9 26,968.8
BSF 51,367.6 48,100.1 52,399.9
FAB 200,849.3 221,931.4 248,146.3
ENBD 135,092.5 184,496.6 188,483.6
ADIB 33,802.4 34,016.5 34,510.3
DIB 60,394.2 62,584.8 78,180.3
MASQ 38,491.5 43,046.4 42,801.3
QNBK 232,793.4 255,068.4 276,754.1
QIBK 41,372.7 44,150.2 47,076.2
MARK 26,269.4 28,727.1 32,701.0
CBQK 36,430.5 39,834.9 41,473.5
DHBK 25,955.7 29,216.3 27,955.9
NBK 90,786.3 96,886.3 98,364.6
KFH 58,819.7 64,183.9 71,172.6
CBK 14,787.4 16,130.3 14,526.9
GBK 19,914.0 20,672.3 20,233.0
BKMB 31,948.8 31,955.6 32,379.9
BKDB 10,955.1 11,247.1 11,068.2
NBOB 9,289.5 9,476.2 0.0
BKSB 7,920.6 9,113.3 9,388.6
HBMO 6,137.6 6,630.0 6,124.6
AUB 35,507.6 40,280.1 40,071.2
GIB 27,546.1 30,241.7 29,550.1
BBK 9,491.5 10,242.3 9,965.1
BARKA 23,831.2 26,258.5 28,250.0
QNBA 16,543.2 17,472.9 18,570.4
COMI 21,917.5 24,751.5 27,381.9
ARBK 49,162.6 51,214.8 54,413.7
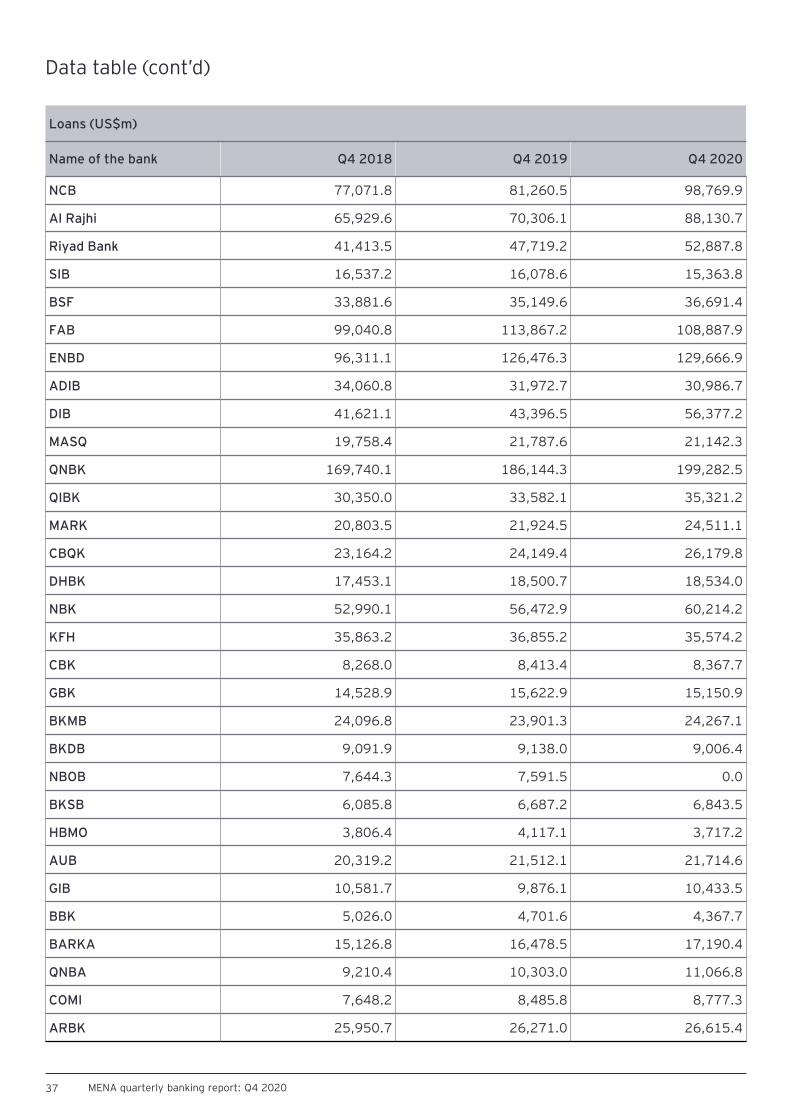
37 MENA quarterly banking report: Q4 2020
Data table (cont’d)
Loans (US$m)
Name of the bank Q4 2018 Q4 2019 Q4 2020
NCB 77,071.8 81,260.5 98,769.9
Al Rajhi 65,929.6 70,306.1 88,130.7
Riyad Bank 41,413.5 47,719.2 52,887.8
SIB 16,537.2 16,078.6 15,363.8
BSF 33,881.6 35,149.6 36,691.4
FAB 99,040.8 113,867.2 108,887.9
ENBD 96,311.1 126,476.3 129,666.9
ADIB 34,060.8 31,972.7 30,986.7
DIB 41,621.1 43,396.5 56,377.2
MASQ 19,758.4 21,787.6 21,142.3
QNBK 169,740.1 186,144.3 199,282.5
QIBK 30,350.0 33,582.1 35,321.2
MARK 20,803.5 21,924.5 24,511.1
CBQK 23,164.2 24,149.4 26,179.8
DHBK 17,453.1 18,500.7 18,534.0
NBK 52,990.1 56,472.9 60,214.2
KFH 35,863.2 36,855.2 35,574.2
CBK 8,268.0 8,413.4 8,367.7
GBK 14,528.9 15,622.9 15,150.9
BKMB 24,096.8 23,901.3 24,267.1
BKDB 9,091.9 9,138.0 9,006.4
NBOB 7,644.3 7,591.5 0.0
BKSB 6,085.8 6,687.2 6,843.5
HBMO 3,806.4 4,117.1 3,717.2
AUB 20,319.2 21,512.1 21,714.6
GIB 10,581.7 9,876.1 10,433.5
BBK 5,026.0 4,701.6 4,367.7
BARKA 15,126.8 16,478.5 17,190.4
QNBA 9,210.4 10,303.0 11,066.8
COMI 7,648.2 8,485.8 8,777.3
ARBK 25,950.7 26,271.0 26,615.4
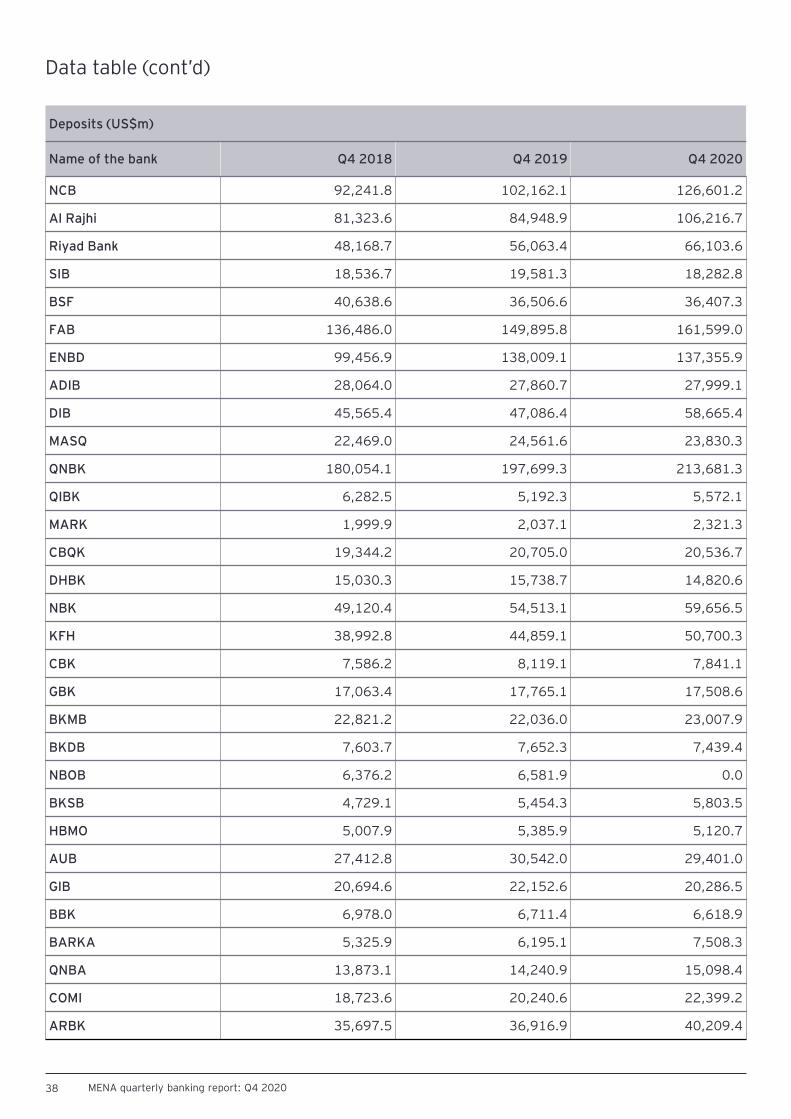
38 MENA quarterly banking report: Q4 2020
Data table (cont’d)
Deposits (US$m)
Name of the bank Q4 2018 Q4 2019 Q4 2020
NCB 92,241.8 102,162.1 126,601.2
Al Rajhi 81,323.6 84,948.9 106,216.7
Riyad Bank 48,168.7 56,063.4 66,103.6
SIB 18,536.7 19,581.3 18,282.8
BSF 40,638.6 36,506.6 36,407.3
FAB 136,486.0 149,895.8 161,599.0
ENBD 99,456.9 138,009.1 137,355.9
ADIB 28,064.0 27,860.7 27,999.1
DIB 45,565.4 47,086.4 58,665.4
MASQ 22,469.0 24,561.6 23,830.3
QNBK 180,054.1 197,699.3 213,681.3
QIBK 6,282.5 5,192.3 5,572.1
MARK 1,999.9 2,037.1 2,321.3
CBQK 19,344.2 20,705.0 20,536.7
DHBK 15,030.3 15,738.7 14,820.6
NBK 49,120.4 54,513.1 59,656.5
KFH 38,992.8 44,859.1 50,700.3
CBK 7,586.2 8,119.1 7,841.1
GBK 17,063.4 17,765.1 17,508.6
BKMB 22,821.2 22,036.0 23,007.9
BKDB 7,603.7 7,652.3 7,439.4
NBOB 6,376.2 6,581.9 0.0
BKSB 4,729.1 5,454.3 5,803.5
HBMO 5,007.9 5,385.9 5,120.7
AUB 27,412.8 30,542.0 29,401.0
GIB 20,694.6 22,152.6 20,286.5
BBK 6,978.0 6,711.4 6,618.9
BARKA 5,325.9 6,195.1 7,508.3
QNBA 13,873.1 14,240.9 15,098.4
COMI 18,723.6 20,240.6 22,399.2
ARBK 35,697.5 36,916.9 40,209.4
EY MENA
We have a long history in MENA, having opened the first office of an EY member firm in 1923. We have over 6,600 talented people in 14 countries and 21 offices, with a shared way of working and commitment to quality.
Further reading
How COVID-19 has changed global banking’s vision for 2021 and beyond
Read the complete report Read the complete report
Six strategic levers to optimize long-term cost transformation
Six implications for firms focusing on climate risk and sustainability
Read the complete report
EY locations in the Middle East
UAE
Jordan
Kuwait Oman EgyptQatarKSA Bahrain
Lebanon Palestine Iraq Iran Libya Syria
39 MENA quarterly banking report: Q4 2020

MENA FS key contacts
Robert AbboudEY MENA FS Consulting Leader
Hannah ShipleyEY MENA FS Tax Leader
Houssam ItaniEY MENA Banking &Capital Markets Leader
Mayur PauEY MENA FS Strategy & Transactions Leader
Raed AhmadEY MENA FS Assurance Leader
Gordon BennieEY MENA Financial Services Leader
Jonathan Matchett EY MENA Insurance Leader
Sarah SandersEY MENA Wealth & Asset Management Leader

EY | Building a better working world
EY exists to build a better working world, helping to create long-term value for clients, people and society and build trust in the capital markets.
Enabled by data and technology, diverse EY teams in over 150 countries provide trust through assurance and help clients grow, transform and operate.
Working across assurance, consulting, law, strategy, tax and transactions, EY teams ask better questions to find new answers for the complex issues facing our world today.
EY refers to the global organization, and may refer to one or more, of the member firms of Ernst & Young Global Limited, each of which is a separate legal entity. Ernst & Young Global Limited, a UK company limited by guarantee, does not provide services to clients. Information about how EY collects and uses personal data and a description of the rights individuals have under data protection legislation are available via ey.com/privacy. EY member firms do not practice law where prohibited by local laws. For more information about our organization, please visit ey.com.
The MENA practice of EY has been operating in the region since 1923. For over 97 years, we have grown to over 7,500 people united across 21 offices and 16 countries, sharing the same values and an unwavering commitment to quality. As an organization, we continue to develop outstanding leaders who deliver exceptional services to our clients and who contribute to our communities. We are proud of our accomplishments over the years, reaffirming our position as the largest and most established professional services organization in the region.
© 2021 EYGM Limited.All Rights Reserved.
EYG no. 002492-21Gbl
ED None
This material has been prepared for general informational purposes only and is not intended to be relied upon as accounting, tax, legal or other professional advice. Please refer to your advisors for specific advice.
ey.com