Embed Size (px)
Citation preview

Investment Climate in
Karnataka
Investment Climate in
Karnataka
N. GokulramPrincipal Secretary to Govt.,
Dept. of Commerce & Industries,Government of Karnataka.
N. GokulramPrincipal Secretary to Govt.,
Dept. of Commerce & Industries,Government of Karnataka.
Presentation byPresentation by
Industrial Policy2001 - 2006
Industrial Policy2001 - 2006

Objectives Set out :Promote rapid industrial growth in the state keeping
in mind the state's priorities and socio economic objectives :
Bring about balanced regional development.Create the much needed jobs for the locals.Make optimal utilisation of resources locally and
enhance value addition.
Objectives Set out :Promote rapid industrial growth in the state keeping
in mind the state's priorities and socio economic objectives :
Bring about balanced regional development.Create the much needed jobs for the locals.Make optimal utilisation of resources locally and
enhance value addition.
Industrial Policy 2001 – 2006Industrial Policy 2001 – 2006
Provide access to hi-quality Infrastructure.Provide an enabling environment for growth of industries.
Enhance productivity & competitiveness of industries in the state.
Enable industries to access new markets.
Provide access to hi-quality Infrastructure.Provide an enabling environment for growth of industries.
Enhance productivity & competitiveness of industries in the state.
Enable industries to access new markets.

The target was to achieve an average industrial growth rate of 10% to 12 % per year.
Attract investments of at least Rs. 20,000 crores per year and create on an average employment of at least 1.5 lakhs per year.
These objectives and targets were to be achieved through a combination of policies & projects.
Incentives and concessions also offered to new investments.
Industrial Policy 2001 – 2006Industrial Policy 2001 – 2006

Sector Weight 01 – 02 02 – 03 03 – 04 04 – 05 05 – 06 (Forecast)
Mining & Quarrying 10.47 0.5 5.8 5.3 4.2 5.5
Electricity 10.17 3.1 3.2 5.0 5.1 5.5
Manufacturing 79.36 2.9 6.0 7.4 8.8 8.0
Index of Industrial Production 100 2.6 5.8 7.0 8.1 7.5
Source: CMIE
Index of Industrial Production : Growth Forecast (%) (Indian Industry)
Index of Industrial Production : Growth Forecast (%) (Indian Industry)

Division / Sector Weight 2001 – 02 2002 – 03 2003 – 04*
Mining 2.3550 21.40 10.50 23.81
Manufacturing 89.3083 3.30 10.18 7.15
Electricity 8.3367 5.87 -3.22 3.89
General Index 100 3.89 5.88 7.29
Note: 1) * Provisional figures.
Source: Directorate of Economics & Statistics, Bangalore.
Note: 1) * Provisional figures.
Source: Directorate of Economics & Statistics, Bangalore.
Index of Industrial Production of Karnataka2001 – 02 to 2003 – 04
Index of Industrial Production of Karnataka2001 – 02 to 2003 – 04

State IEMs filed % Share in total Investment (Rs. Cr.) % Share in totalAndhra Pradesh 3703 6.69 137973 10.03
Assam 319 0.58 5807 0.42
Bihar 149 0.27 3055 0.22
Delhi 484 0.87 6507 0.47
Gujarat 6849 12.38 215062 15.64
Haryana 3193 5.77 39078 2.84
Jammu & Kashmir 251 0.45 3638 0.26
KARNATAKA 2179 3.94 69983 5.09Kerala 502 0.91 8390 0.61
Madhya Pradesh 2110 3.81 45360 3.30
Maharashtra 10833 19.58 243027 17.67
Orissa 664 1.20 73517 5.35
Punjab 2337 4.22 53680 3.90
Rajasthan 2638 4.77 41414 3.01
Tamil Nadu 4556 8.23 114469 8.32
Uttar Pradesh 4788 8.65 82261 5.98
Uttaranchal 558 1.01 9251 0.67
West Bengal 3115 5.63 53658 3.90
All India 55335 100.00 1375152 100.00
IEMs Filed : August 1991 – October 2004IEMs Filed : August 1991 – October 2004

IEMs Filed : August 1991 – October 2004IEMs Filed : August 1991 – October 2004
17.67
15.64
10.03
8.32
5.985.35 5.09
3.90 3.90 3.30 3.01 2.84
0.00
2.00
4.00
6.00
8.00
10.00
12.00
14.00
16.00
18.00
MH GU AP TN UP OR KA WB PU MP RA HA
(% of investment share)(% of investment share)

State Rs. Crore % Share RankAndhra Pradesh 14608.75 7.13 4
Bihar 96.62 0.05 19
Delhi 11982.43 5.85 6
Gujarat 12960.95 6.33 5
Haryana 2456.06 1.20 10
Jammu & Kashmir 0.40 0.00 30
KARNATAKA 22628.72 11.05 2Kerala 762.32 0.37 16
Madhya Pradesh 2168.70 1.06 11
Maharashtra 35436.26 17.30 1
Orissa 1717.44 0.84 14
Punjab 5831.15 2.85 7
Rajasthan 2117.50 1.03 13
Tamil Nadu 15234.14 7.44 3
Uttar Pradesh 2158.20 1.05 12
Uttaranchal 21.67 0.01 25
West Bengal 3577.42 1.75 8
All India 204841.98 100.00
Foreign Direct Investment Approvals : Jan 1997 to Oct 2004
Foreign Direct Investment Approvals : Jan 1997 to Oct 2004

17.30
11.05
7.44 7.136.33 5.85
2.851.75 1.20 1.06 1.05 1.03
0.00
2.00
4.00
6.00
8.00
10.00
12.00
14.00
16.00
18.00
MH KA TN AP GU DL PU WB HA MP UP RA
Foreign Direct Investment Approvals : Jan 1997 to Oct 2004
Foreign Direct Investment Approvals : Jan 1997 to Oct 2004
FDI approvals(% of investment share)
FDI approvals(% of investment share)

207 197177
264
304342
312 306*
0
50
100
150
200
250
300
35019
97
1998
1999
2000
2001
2002
2003
2004
No. of ProjectsNo. of Projects- uptoOct 2004
FDI Approvals by GOI for Karnataka : Jan 1997 – Oct 2004
FDI Approvals by GOI for Karnataka : Jan 1997 – Oct 2004

29643264
5509
2198
4731
961
2419
582
0
1000
2000
3000
4000
5000
600019
97
1998
1999
2000
2001
2002
2003
2004
Amount approved in Rs. CroresAmount approved in Rs. Crores
FDI Approvals by GOI for Karnataka : Jan 1997 – Oct 2004
FDI Approvals by GOI for Karnataka : Jan 1997 – Oct 2004
- uptoOct 2004

5630
19271519 1319 1222
534 472
0
1000
2000
3000
4000
5000
6000
Softw
are /
Har
dwar
e
Electro
nics
/ Elec
trcals
Autom
obile
Engine
ering
Power
Pro
jects
Softw
are T
ech
Paks
Text
ile
Amount approved in Rs. CroresAmount approved in Rs. Crores
FDI Approvals by GOI for Karnataka : – Product wise details : Jan 1997 to Oct 2004
FDI Approvals by GOI for Karnataka : – Product wise details : Jan 1997 to Oct 2004

FDI Approvals by GOI for Karnataka : – Country wise details : Jan 1997 to Oct 2004
FDI Approvals by GOI for Karnataka : – Country wise details : Jan 1997 to Oct 2004
Name of Country Nos. Investment (in Crores)
1.2.3. Japan 159 20974. Mauritius 174 18365.6.7.8.9.10. Switzerland 50 12211. Italy 25 8812. Korea ( South ) 20 5813. Others 312 6952
Total 2109 22628
Belgium 21 3767USA 705 3418
U.K. 128 1674NRI 187 1076Singapore 120 707Germany 153 576Netherlands 55 257

1. 2001 – 02 16964 479 731952. 408
371385
Total 52446 1643 237354
3. 2003 – 04 122205737156790
4. 2004 – 05 11233 49998
2002 – 03 12029
Industrial Investments approved in Karnataka : 2001 – 02 to 2004 – 05
Industrial Investments approved in Karnataka : 2001 – 02 to 2004 – 05
SSISSI29856012284564Total
4525389318232043
1090281114533207246007
2022004 – 05 4.1642003 – 04 3.
2.1.
952002 – 03 1032001 – 02SLSWCCSLSWCC 2791604821487Total
32418874511795872
Investment (Rs. in Crores)
137676101264
953230688
Employment (in Nos.)
302004 – 05 4.302003 – 04 3.
2.1.
72002 – 03 202001 – 02
No. of ProjectsPeriod
SLHCCSLHCC
81507462141Grand Total

Project Approvals SHLCCDistrict Wise : 2001 to 2005Project Approvals SHLCC
District Wise : 2001 to 2005PROJECTS CLEARED PROJECTS IMPLEMENTED Nos. Investment
(Rs. in crores)Nos. Investment
(Rs. in crores) 1 Bangalore Rural 7 2142.13 2 464.552 Bangalore Urban 45 12235.19 21 2694.483 Belgaum 2 118.00 0 04 Bellary 11 6250.78 1 51.005 Bidar 1 550.00 0 06 Bijapur 1 189.92 0 07 Dakshina Kannada 6 22024.84 0 08 Davanagere 1 247.00 0 09 Dharwad 2 248.00 0 010 Gulbarga 1 432.50 0 011 Hassan 3 731.34 0 012 Koppal 2 639.50 0 013 Mysore 2 585.00 0 014 Shimoga 2 198.00 0 015 Udupi 1 1838.20 0 0
TOTAL 87 48213.40 25 3710.03
Sl.No.
District

Project Approvals SHLCCProduct Wise : 2001 to 2005Project Approvals SHLCC
Product Wise : 2001 to 2005PROJECTS CLEARED PROJECTS IMPLEMENTED
Nos. Investment (Rs. in crores)
Nos. Investment (Rs. in crores)
1 Electronics / Telecom. 6 2451.10 3 1591.00
2 Software / Hardware 9 3145.61 3 457.86
3 Engineering 9 6464.98 0 0
4 Automobile 2 860.00 2 860.00
5 Food Processing 1 141.60 0 0
6 Textiles 4 580.63 0 0
7 Drugs / Chemicals 8 2020.62 3 506.62
8 Cement 2 109.00 0 0
9 Sugar (Inc. Co-gen) 5 645.92 0 0
10 Petroleum Process 6 13999.50 0 0
11 Hotel / Tourism 3 654.50 0 0
12 Research & Development 2 130.67 2 130.67
13 Infrastructure 5 1804.84 2 106.00
14 Power Project 8 11617.34 0 0
15 Software Tech. Park 14 3116.98 8 1095.62
16 Others 3 206.61 1 77.61
TOTAL 87 48213.40 25 3710.03
Sl.No.
Product
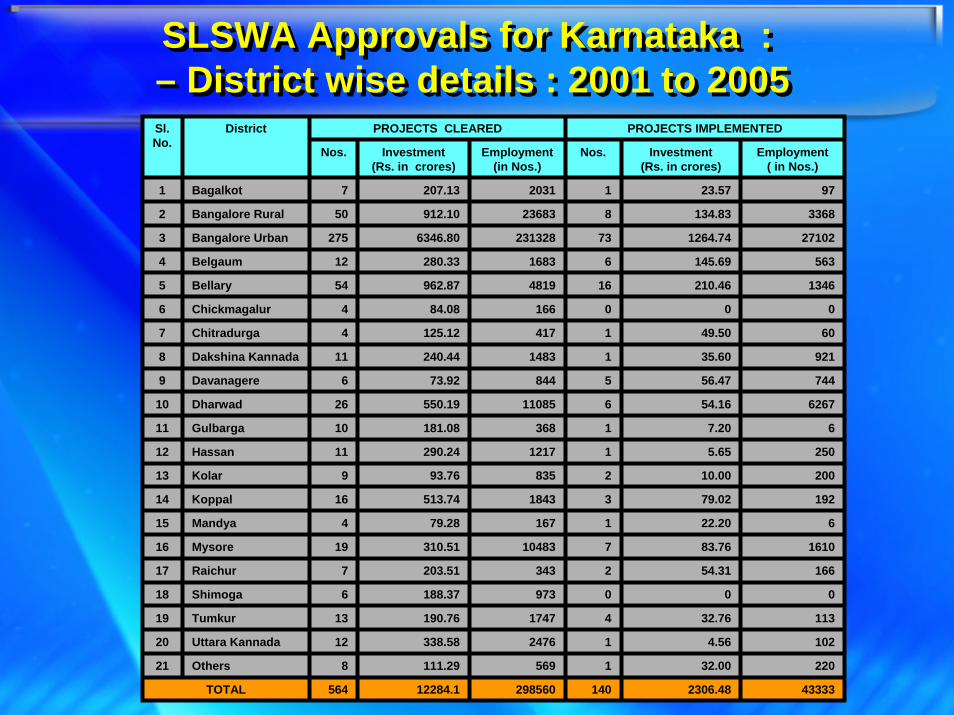
SLSWA Approvals for Karnataka : – District wise details : 2001 to 2005SLSWA Approvals for Karnataka : – District wise details : 2001 to 2005
PROJECTS CLEARED PROJECTS IMPLEMENTED
Nos. Investment(Rs. in crores)
Employment(in Nos.)
Nos. Investment (Rs. in crores)
Employment ( in Nos.)
23.57 97
3368
27102
563
1346
0
60
921
744
6267
6
250
200
192
6
1610
166
0
113
102
220
43333
134.83
1264.74
145.69
210.46
0
49.50
35.60
56.47
54.16
7.20
5.65
10.00
79.02
22.20
83.76
54.31
0
32.76
4.56
32.00
2306.48
1
8
73
6
16
0
1
1
5
6
1
1
2
3
1
7
2
0
4
1
1
140
1 Bagalkot 7 207.13 2031
2 Bangalore Rural 50 912.10 23683
3 Bangalore Urban 275 6346.80 231328
4 Belgaum 12 280.33 1683
5 Bellary 54 962.87 4819
6 Chickmagalur 4 84.08 166
7 Chitradurga 4 125.12 417
8 Dakshina Kannada 11 240.44 1483
9 Davanagere 6 73.92 844
10 Dharwad 26 550.19 11085
11 Gulbarga 10 181.08 368
12 Hassan 11 290.24 1217
13 Kolar 9 93.76 835
14 Koppal 16 513.74 1843
15 Mandya 4 79.28 167
16 Mysore 19 310.51 10483
17 Raichur 7 203.51 343
18 Shimoga 6 188.37 973
19 Tumkur 13 190.76 1747
20 Uttara Kannada 12 338.58 2476
21 Others 8 111.29 569
TOTAL 564 12284.1 298560
Sl.No.
District

SLSWA Approvals for Karnataka : – Product wise details : 2001 to 2005SLSWA Approvals for Karnataka :
– Product wise details : 2001 to 2005PROJECTS CLEARED PROJECTS IMPLEMENTED
Nos. Invest. (Rs. in crores)
Employ.(in Nos.)
Nos. Invest. (Rs. in crores)
Employ.( in Nos.)
52.40 543
6885
2071
6999
350
2129
50
7202
394
1215
101
397
268
97
300
1228
0
255
19 Software Tech. Park 81 2554.98 147315 9 315.92 11804
20 Others 29 506.71 3878 7 84.70 1045
43333
200.99
271.72
118.47
12.50
204.96
8.88
304.15
30.52
105.26
7.25
80.86
83.97
2.30
49.46
151.51
0
220.67
2306.49
3
8
28
10
2
16
1
16
6
7
2
2
3
1
4
6
0
9
140
1 Electronics / Telecom. 11 178.30 2255
2 Software / Hardware 46 1149.64 49758
3 Engineering 109 2200.74 15224
4 Automobile 17 198.95 8017
5 Floriculture / Agriculture 5 38.30 2980
6 Food Processing 38 471.49 4512
7 Granites / Marble 3 24.78 121
8 Textiles 38 723.90 29786
9 Plastic / Rubber 15 190.37 1312
10 Drugs / Chemicals 31 574.94 4047
11 Cement 6 121.22 544
12 Sugar (Inc. Co-gen) 6 256.95 2195
13 Distilleries / Breweries 5 98.76 415
14 Petroleum Process 12 244.72 5500
15 Hotel / Tourism 52 1060.03 9656
TOTAL 564 12284.12 298560
16 Research Development 6 151.51 1228
17 Infrastructure 6 155.60 7174
19 Power Project 48 1382.23 2643
Sl.No.
Product
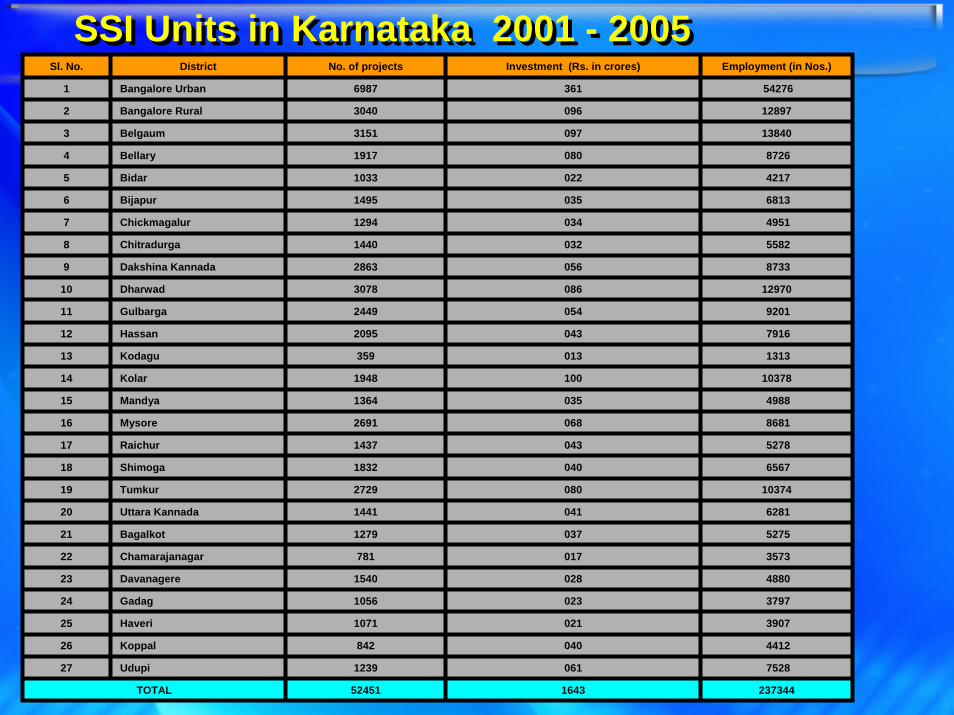
SSI Units in Karnataka 2001 - 2005SSI Units in Karnataka 2001 - 2005Sl. No. District No. of projects Investment (Rs. in crores) Employment (in Nos.)
1 Bangalore Urban 6987 361 54276
2 Bangalore Rural 3040 096 12897
3 Belgaum 3151 097 13840
4 Bellary 1917 080 8726
5 Bidar 1033 022 4217
6 Bijapur 1495 035 6813
7 Chickmagalur 1294 034 4951
8 Chitradurga 1440 032 5582
9 Dakshina Kannada 2863 056 8733
10 Dharwad 3078 086 12970
11 Gulbarga 2449 054 9201
12 Hassan 2095 043 7916
13 Kodagu 359 013 1313
14 Kolar 1948 100 10378
15 Mandya 1364 035 4988
16 Mysore 2691 068 8681
17 Raichur 1437 043 5278
18 Shimoga 1832 040 6567
19 Tumkur 2729 080 10374
20 Uttara Kannada 1441 041 6281
21 Bagalkot 1279 037 5275
22 Chamarajanagar 781 017 3573
23 Davanagere 1540 028 4880
24 Gadag 1056 023 3797
25 Haveri 1071 021 3907
26 Koppal 842 040 4412
27 Udupi 1239 061 7528
TOTAL 52451 1643 237344

Classification of SSIs : 2001 – 2005Classification of SSIs : 2001 – 2005
Sl. No. Product No. of projects
1 Food and Bewerage 6356
2 Textile and Garments 8997
3 Wood Based 6299
4 Printing and Stationery 1300
5 Leather and Leather Products 1799
6 Rubber and Plastics 921
7 Chemicals 1206
8 Glass and Ceramics 1000
9 Basic Metal 1245
10 General Engineering 3747
11 Elec. & Electronics 1523
12 Automobile 500
13 Transport 16
14 Ferrous and Non- Ferrous 255
15 Job Work 5691
16 Misc. products 5790
17 Others 5806
TOTAL 52451

60931.6941670.2429897.9920145.58Total
775.131053.251016.55615.03Miscellaneous & Others19
109.4089.2576.8044.46Wool & Woollen Products18
109.5499.5891.6569.12Spices17
2779.10749.0796.8483.07Plastic Goods16
91.6581.5896.9185.76Marine Products15
340.52338.62215.36201.22Chemicals & Allied Products14
186.75276.51221.58237.64Leather Products13
324.28*324.28260.5848.59Handicrafts*12
518.35265.72279.83163.54Cashew and Cashew Kernals11
4644.002631.00295.85281.05Gem and Jewellery10
362.41361.25366.99349.51Agriculture & Processed Food Products9
746.03649.22413.33320.24Basic Chemicals, Pharmaceuticals & Cosmetics8
705.65757.57730.65881.42Coffee Products7
898.80967.99746.09672.24Silk Products6
4480.002093.431524.10691.56Iron Ore and Minerals (incl. granites)5
2147.351899.491650.111048.07Engineering4
6186.004472.151915.00NAPetroleum & Petroleum Products3
4038.00*4038.004000.002820.00Readymade Garments*2
31488.7320522.2815899.7711533.06Electronics & Computer Software1
2004-05(Prov)
2003-042002-032001-02CommoditySl. No.
•- Figures awaited from the Councils / Associations. Last year figures adopted.
Note: State wise Export Statistics is not available. An attempt is made to compile export statistics of Karnataka from various sources like Directorate General of Commercial Intelligence & Statistics / Export Promotion Councils / Commodity Boards etc.
Export performance of Karnataka StateExport performance of Karnataka State(Rs. in crores)(Rs. in crores)

23%430888.00349581.93299289.96245517.97Total
22%356068.00291581.93252789.96209017.97Product Exports
29%74820.0058000.0046500.0038500.00Computer Software
% Growth2004-052003-042002-032001-02INDIA
46%60931.6941670.2429897.9920145.58Total
41%33331.6923570.2416559.9910242.58Product Export
52%27600.0018100.0013338.009903.00Computer Software
% Growth2004-052003-042002-032001-02KARNATAKA
14.14%11.92%9.99%8.21%
2004-052003-042002-032001-02Karnataka’s %age share in all India Exports
Comparison of Karnataka with Country's ExportsComparison of Karnataka with Country's Exports
(Rs. In Crores)(Rs. In Crores)

Infrastructure SupportInfrastructure Support

It was recognized that quality infrastructure at competitive prices should be offered to industries.
Sector specific and location specific technology parks / industrial areas / estates and corridors to be established through public - private partnership approach.
Industrial townships to be established in major industrial locations to manage basic infrastructure like roads, water supply, etc…
Ensure uninterrupted and quality power.
Infrastructure SupportInfrastructure Support

1. Five agro food processing parks at Malur, Bagalkot, Belgaum, Chitradurga & Maddur.
2. Two apparel parks : one each in Bangalore & Bellary.
3. SEZ in Hassan.
4. An export promotion industrial park in Mangalore.
5. Three auto parks : one each at Bidadi, Shimoga & Dharwad
1. Five agro food processing parks at Malur, Bagalkot, Belgaum, Chitradurga & Maddur.
2. Two apparel parks : one each in Bangalore & Bellary.
3. SEZ in Hassan.
4. An export promotion industrial park in Mangalore.
5. Three auto parks : one each at Bidadi, Shimoga & Dharwad
Sector Specific, Location Specific Industrial Park proposed over the policy period
Sector Specific, Location Specific Industrial Park proposed over the policy period

Govt. actively persuing the task of setting up 6 food parks ( Jewargi being the 6th location) as part of government`s strategy to develop food processing industry.Capital subsidy of Rs. 8 crores availabe for investment in capital intensive activites such as : Cold Storage, Warehouse, Quality Control Labs, ETP, Training / Conference facilities, etc…Parks to come up as clusters with an anchor industry.Parks being facilitated by Food Karnataka Ltd, through JV companies.JV companies incorporated and lands acquired for the purpose in all cases except in Belgaum.
Govt. actively persuing the task of setting up 6 food parks ( Jewargi being the 6th location) as part of government`s strategy to develop food processing industry.Capital subsidy of Rs. 8 crores availabe for investment in capital intensive activites such as : Cold Storage, Warehouse, Quality Control Labs, ETP, Training / Conference facilities, etc…Parks to come up as clusters with an anchor industry.Parks being facilitated by Food Karnataka Ltd, through JV companies.JV companies incorporated and lands acquired for the purpose in all cases except in Belgaum.
Food ParksFood Parks

With the phasing out of quota regime with effect from 1-1-2005, need to provide an enabling environment to integrate textile sector with global market.Based on demand survey and the availability of skills and resources textile parks are planned in the following places :
1. Doddaballapur – 2nd phase land acquisation in progress (1st phase almost completed except for ETP).
2. Bellary jeans park (land acquisition completed)3. Kanakpura apparel SEZ (land acquisition in progress)4. Anekal silk hi-tech park (land acquisition in progress)5. Mysore textile park6. Ramanagar textile park7. Belgaum textile park8. Davanagere textile park
Textile ParksTextile Parks
Power subsidy being provided to powerlooms.Power subsidy being provided to powerlooms.

Initiated by the GOI to enhance the competitiveness of domestic industry by providing quality infrastructure through PPP approach.
Selection of clusters based on the number of units, persons employed and growth & export potential.
User driven and implementation by SPV at the individual cluster level.
Sustainability of assets through revenue generation
2 project proposals approved by GOI.
Industrial Infrastructure Up-gradation SchemeIndustrial Infrastructure Up-gradation Scheme

Proposals under Industrial Infrastructure Upgradation Scheme (Cluster Development)
Proposals under Industrial Infrastructure Upgradation Scheme (Cluster Development)
Sl.No.
Particulars Cost of Project
Share of GOI
Amount released by
GOI
Share of Stake
Holders & GOK
Amount Released by GOK
1. Machine Tool Industrial Cluster, Peenya
135.50 49.12 16.37 86.38 0.97
2. Foundry Cluster, Belgaum 24.78 18.58 6.19 6.20 0.92
3. Industrial Valve Cluster, Hubli / Dharwad
40.00 30.00 -- 10.00 --
4. Auto Components Cluster, Shimoga
58.36 43.77 -- 14.59 --
(Rs. in crores)

1. General purpose SEZ at Hassan (RFP issued).
2. Sector specific SEZs at :a.) Mangalore – IT / ITESb.) Hassan – textilesc.) Mangalore – petrochemicals
3. Also proposed Bio Park / Hardware Park in Bangalore & a SEZ for apparels in Kanakapura.
1. General purpose SEZ at Hassan (RFP issued).
2. Sector specific SEZs at :a.) Mangalore – IT / ITESb.) Hassan – textilesc.) Mangalore – petrochemicals
3. Also proposed Bio Park / Hardware Park in Bangalore & a SEZ for apparels in Kanakapura.
SEZs approved for the following locations :SEZs approved for the following locations :

Streamlining Single Window Mechanism & Deregulation of Business Environment
Streamlining Single Window Mechanism & Deregulation of Business Environment
1. Karnataka Industries (Facilitation) Act 2002 in place. Single Window Mechanism for Industry / Tourism / IT / BT / Agro Food Processing & Infrastructure.
2. Rules published in August, 2004.3. This legislation provides for :
a) First contact point for investors.b) Combined application form.c) Single window clearance.d) Rationalization of inspections.
4. Promotes investor friendly & transparent administration5. SEZ legislation. 4. Promotes investor friendly & transparent administration5. SEZ legislation.

After rigorous scrutiny, incentives & concessions limited to :1. Subsidy2. Entry tax exemptions3. Spl. concessions for exports / EOUs / SEZs.4. Waiver of conversion fee. 5. Relief for sick industries.6. VAT introduced in the state with effect from 1-04-2005.
After rigorous scrutiny, incentives & concessions limited to :1. Subsidy2. Entry tax exemptions3. Spl. concessions for exports / EOUs / SEZs.4. Waiver of conversion fee. 5. Relief for sick industries.6. VAT introduced in the state with effect from 1-04-2005.
Incentives & ConcessionsIncentives & Concessions

The way forward...The way forward...
A vibrant manufacturing sector essential for rapid economic growth.
Manufacturing sector is showing buoyancy.
India`s exports have been rising.
Emerging as an important supplier of skill intensive products – auto components, pharmaceuticals, speciality chemicals, apparel, leather, jewellery, iron & steel and aluminium.

The way forward...The way forward...
1. Investments in transport infrastructure –- railways, - roads, - ports & - airports.
Infrastructure plan related to needs of this sector to remove bottlenecks.
1. Quality electric power at reasonable rates.3. World class industrial areas including maintenance &
up-gradation of existing industrial areas.4. Establishment of industrial townships and delegation
of powers.5. Rationalization and simplification of Labour Laws.

6. Employment to locals – quality education / demand driven.
7. Amendments to APMC Act & release of barren land for raising industrial plantations.
8. Rational Policy on incentives & concessions.9. Competitiveness of SMEs
– increased credit flow, – problem of multiple inpections– reduction in transcation costs – sickness
10. Environmental concerns – EIA / EMP for industrial areas / minning areas – CETP & sites for disposal of hazardous waste
The way forward...The way forward...

11. Mineral Sector– procedural simplification – transparency– transportation needs
12.Problems of Bangalore city.13.Trade facilitation & export promotion
(exports of US$ 500 billion by 2010)14.Realiability of trade & industrial
production data
11. Mineral Sector– procedural simplification – transparency– transportation needs
12.Problems of Bangalore city.13.Trade facilitation & export promotion
(exports of US$ 500 billion by 2010)14.Realiability of trade & industrial
production data
The way forward...The way forward...

15. Strategy for industrialization of 39 most backward taluks as identified by the High Power Committee for Redressal of Regional Imbalances
1. Create new investment opportunities based on local resources, local skills and demand.
2. Provide ready-to-use infrastructure like developed industrial land, shed, plots for industries at subsidized cost.
3. Provide adequate and uninterrupted power for industries through strengthening distribution system.
4. Human resource development.5. Attract atleast one anchor industry to each taluk
The way forward...The way forward...

6. Develop industries on cluster basis with more focus on local artisans with technology and design inputs.
7. Provide need based and production linked incentives and concessions like capital subsidy & interest subsidy on term / working capital loan, exemption from entry tax etc.
8. Market intervention through sector-specific Boards / Corporations.
9. Identification of viable sick industries in the talukas and rehabilitation of such units through special packages.
10. Improvement of roads.
The way forward...The way forward...

New industrial policy due in April 2006.
- Task force to formulate the policy- Examine effectiveness of existing policy- Evolve a strategy for industrialization.
New industrial policy due in April 2006.
- Task force to formulate the policy- Examine effectiveness of existing policy- Evolve a strategy for industrialization.
The way forward...The way forward...