Embed Size (px)
Citation preview

Investment Thesis I am initiating coverage with a rating of “HOLD” and a twelve-month price target of $37.50. This target represents a potential return of 7.36%, without considering dividends. National Oilwell Varco is a market share leader in the oil and gas machinery manufacturing sector. The company has a wide range of products and services that are available to customers around the world. However, low oil prices and a strong US dollar will continue to affect the company in the near term. Management is cautious for 2016 as energy prices continue to fluctuate with rumors affecting both supply and demand.
Opportunities: Solid liquidity and relatively low leverage gives management resources to pursue potential acquisitions in this current environment. Cost reduction strategies could help improve overall efficiencies. Oil prices could have or are close to reaching bottom.
Threats: Oil prices remain low for longer. Increase in default rates from oil companies could result in
further order cancellations. Foreign exchange volatility impacts revenues from abroad. Deteriorating market conditions results in asset impairment charges which, in turn, reduce earnings.

2
Table of Contents
Business Description………………………………………………….3
Macroeconomic Analysis…………………………………………….5
Industry Overview……………………………………………………..6
Sector Overview………………………………………………………8
Company Analysis……………………………………………………9
Valuation………………………………………………………………11
Conclusion…………………………………………………………...12
Investment Risks……..……………………………………………..13
Works Cited…………………………….…………………………....13
Appendix….………………………………………………………....14
Technical Analysis…………………………………………………20

3
Business Description
National Oilwell Varco (NOV) is a leading worldwide provider of goods and services to exploration and production companies in the oil and gas industry. The company has a substantially wide range of products and services, which are offered to different segments within the oil and gas industry. NOV operates 835 locations across six continents, including a network of 400 service centers and 300 repairs and manufacturing facilities. The company’s international operations generated more than 75% of total revenue in 2015. NOV’s operating segments are Rig Systems, Rig Aftermarket, Wellbore Technologies, and Completion & Production Solutions.
The company, headquartered in Houston TX, was founded in 1987 and has more than 50,000 employees. Some of its products include: land rigs and offshore drilling equipment (Rig Systems); spare parts and technical support (Rig Aftermarket); drill pipe products and waste management services (Wellbore Technologies); and process & production technologies (Completion & Production Solutions).
National Oilwell has grown into an industry leader, with an estimated 15.5% market share in the US oil drilling equipment manufacturing industry in 2015. Over the years, the company has acquired more than 300 firms and, because of this aggressive expansion, was able to develop and accumulate more than 20 brands such as Gaso, Ameron, Baylor, Wheatley, and IntelliServ.
NOV’s main customers are oil & gas companies, drilling contractors, oilfield service companies, shipyards, and rig fabricators. Sales are mainly made through the company’s direct sales force and, to a less extent, through agent or commissioned representatives. In 2015, total sales amounted to almost $15 billion; from which 25% was generated in the US, 12% in South Korea, 11% in China, and 52% in other countries. In terms of segments, total sales breakdown was dominated by Rig Systems with 44%, followed by Wellbore Technologies with 22% and Completion & Production Solutions with 20%. The laggard in 2015 was Rig Aftermarket with only 14% of total sales.
The key driver of demand for National Oilwell’s products and services is the level of activity in the oil and gas industry; which, in turn, is heavily influenced by oil and gas prices worldwide. In terms of costs, the company’s bottom line is sensitive to changes in steel prices. However, like most commodities, steel is also trading at historical low levels, which helps offset the decrease in revenue from lower oil and gas prices.
25%
12%
11% 7%
45%
Sales % by Country
United States
South Korea
China
Singapore
Others
44%
14%
22%
20%
Sales % by Segment
Rig Systems
Rig Aftermarket
WellboreTechnologies
Completion &Production
4
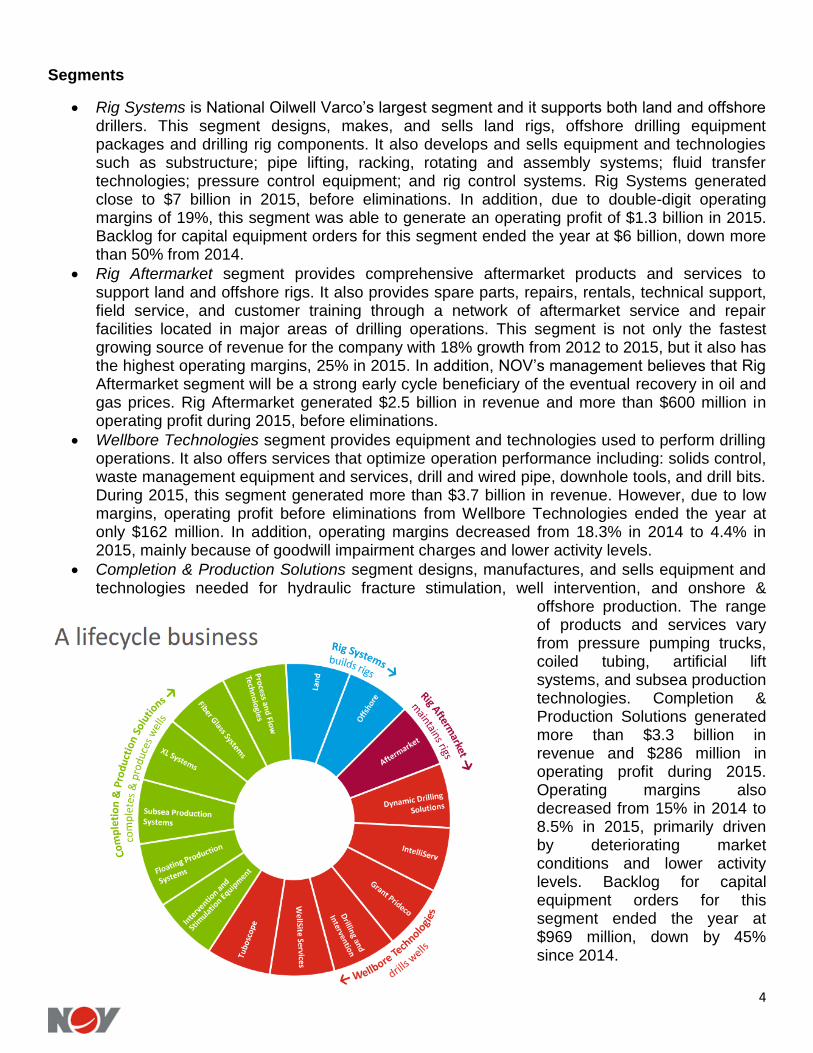
Segments
Rig Systems is National Oilwell Varco’s largest segment and it supports both land and offshore drillers. This segment designs, makes, and sells land rigs, offshore drilling equipment packages and drilling rig components. It also develops and sells equipment and technologies such as substructure; pipe lifting, racking, rotating and assembly systems; fluid transfer technologies; pressure control equipment; and rig control systems. Rig Systems generated close to $7 billion in 2015, before eliminations. In addition, due to double-digit operating margins of 19%, this segment was able to generate an operating profit of $1.3 billion in 2015. Backlog for capital equipment orders for this segment ended the year at $6 billion, down more than 50% from 2014.
Rig Aftermarket segment provides comprehensive aftermarket products and services to support land and offshore rigs. It also provides spare parts, repairs, rentals, technical support, field service, and customer training through a network of aftermarket service and repair facilities located in major areas of drilling operations. This segment is not only the fastest growing source of revenue for the company with 18% growth from 2012 to 2015, but it also has the highest operating margins, 25% in 2015. In addition, NOV’s management believes that Rig Aftermarket segment will be a strong early cycle beneficiary of the eventual recovery in oil and gas prices. Rig Aftermarket generated $2.5 billion in revenue and more than $600 million in operating profit during 2015, before eliminations.
Wellbore Technologies segment provides equipment and technologies used to perform drilling operations. It also offers services that optimize operation performance including: solids control, waste management equipment and services, drill and wired pipe, downhole tools, and drill bits. During 2015, this segment generated more than $3.7 billion in revenue. However, due to low margins, operating profit before eliminations from Wellbore Technologies ended the year at only $162 million. In addition, operating margins decreased from 18.3% in 2014 to 4.4% in 2015, mainly because of goodwill impairment charges and lower activity levels.
Completion & Production Solutions segment designs, manufactures, and sells equipment and technologies needed for hydraulic fracture stimulation, well intervention, and onshore &
offshore production. The range of products and services vary from pressure pumping trucks, coiled tubing, artificial lift systems, and subsea production technologies. Completion & Production Solutions generated more than $3.3 billion in revenue and $286 million in operating profit during 2015. Operating margins also decreased from 15% in 2014 to 8.5% in 2015, primarily driven by deteriorating market conditions and lower activity levels. Backlog for capital equipment orders for this segment ended the year at $969 million, down by 45% since 2014.

5
Recent Developments
On May 30, 2014, National Oilwell Varco completed the spin-off of its distribution business into an independent public company name NOW, which trades on the NYSE under the symbol “DNOW”. The company’s shareholders received one share of NOW, common stock, for every four NOV common shares they held as of the record date.
In 2015, the company completed its $3 billion share repurchase program. During that year, NOV purchased 44 million shares for an average price of $50 dollars. In the previous year, the company had repurchased 11.6 million shares for an average price of $67 dollars. In addition, NOV distributed $710 million in dividends to its shareholders in 2015, which is an increase from $703 million in 2014. Finally, the company completed seven acquisitions and other investments for a total of $86 million in 2015, a decrease from $291 million in the previous year.
In December 2015, the company consummated a settlement with a shipyard customer concerning seven contracts for the supply of drilling equipment packages for drillship construction projects in Brazil. NOV did not take any charges as a result of the settlement; however, it did reduce Rig Systems segment backlog by $1.2 billion. According to management, at the end of 2015, the company had close to $1.8 billion in backlog for the remaining 15 rigs across three shipyards in Brazil. In addition, the on-going investigations in this country have led to, and are expected to continue to lead to, delays in deliveries to NOV’s shipyards customers in Brazil.
In 2015, the Drilling & Intervention and Drill Pipe reporting units within the company’s Wellbore Technologies segment had calculated fair values below carrying value, resulting in a $1.5 billion write-down in goodwill. This impairment charge was primarily the result of a substantial decline in oil prices, a decline in rig activity, and a decline in the revenue for the Wellbore Technologies segment in 2015.
Macroeconomic Analysis
Because approximately 25% of NOV’s sales came from the United States in 2015, I believe it is important to analyze this country’s economy and, potentially, attempt to forecast how it will perform going forward. At the same time, however, since more than 75% of the company’s sales came from abroad during that year, it is also important to consider the effects of volatility of foreign currency on National Oilwell’s revenues.
The US economy is doing relatively well, especially when compared to other countries in Europe or Asia. The country’s GDP has been growing at a slow but consistent pace since the mortgage crisis and it is expected to continue to grow at around 2% per year going forward. The domestic job market is in good shape, with an unemployment rate close to 5%. However, labor participation rate isn’t as positive due to structural changes in the labor force, as baby boomers continue to retire. Therefore, these retirees aren’t necessarily looking for jobs, which makes unemployment figures somewhat misleading. At the same time, job openings rate has increased this year and a greater percentage of those jobs were taken by millennials, which could help increase labor participation rate going forward. Inflation in the United States has remained low in the past few years, which is one of the reasons why the Fed is so reluctant to increase interest rates. Personal consumption expenditures, which exclude food and energy prices, are expected to increase at a 1-2% range in the near future. Interest rates are also expected to remain low going forward, not only because of inflation but also because of rising capital inflows from a stronger dollar. Overall, the US population has become wealthier in recent years with both housing and stock market continuing to increase in value. Finally, personal savings rate has increased among Americans, who are not as leveraged as they used to be.

6
As you can see in this chart on the trade-weighted value of the US dollar against major currencies from the Federal Reserve Board, the dollar has been appreciating in value since 2011. However, this appreciation has gain momentum more recently due to divergent policies among central banks worldwide. Both ECB and BOJ continue to pursue aggressive monetary policies as they attempt to do whatever it takes to avoid deflation, which is why they have reached negative interest rates. At the same time, the US is going in the opposite direction and, even though rates are still low, the Fed has ended QE and it is now starting to slowly increase interest rates. This divergence in central banks’ policies, along with the fact that the US economy is stronger than most countries, will continue to add upward pressure on the US dollar going forward.
In the past, low oil prices due to a positive supply shock have resulted in higher growth rates in the US and abroad. The negative impacts occur first with lower oil employment and reduced capital expenditures. However, positive impacts on consumer spending increasingly occur over time as the price drop is viewed as somewhat permanent. In theory, a long period of low oil prices should benefit the global economy as consumers gain from oil producers’ loss. Therefore, because of the current environment, the economies that have enjoyed the strongest growth last year were major oil importers like India. Other major economies such as Germany, China and Britain are also expected to benefit from this low oil environment. Even though these economies have been struggling more recently, they are all net oil importers.
Industry Overview
Demand for NOV’s products and services depend primarily on the general level of activity in the oil and gas industry worldwide, which has experienced significant volatility over the years. Major drivers of demand for the company include the number of drilling rigs in operation, the number of oil and gas wells being drilled, the depth and drilling conditions of these wells, and the overall volume of production. All these factors are heavily influenced by energy prices. Therefore, the key factor when analyzing National Oilwell Varco is mainly the supply and demand for oil, which the company has no control over.
Throughout the years, oil markets have continuously surprised investors as its volatility increases due to supply or demand shocks. Less than a decade ago, the world was searching for oil in order to fuel China’s commodity-hungry economy, which drove prices to over $140 a barrel. Oil and gas companies were investing in expensive projects to access oil reserves in the most remote regions of the world. However, this environment has changed since 2014 and now the fear for producers is of a supply glut, rather than a shortage. In 2015, the world produced an average of 96.3 million barrels per day, of which it consumed only 94.5 million. Therefore, even though storage capacity has increased over the years, inventory levels have risen at a faster pace, especially in the United States. US crude inventories have reached their highest levels in more than 80 years and some storage hubs have little room left to store oil.
Trade-weighted value of the US dollar against major currencies
Source: Federal Reserve Board

7
The current drop in oil prices, as you can see in the exhibit below from the International Energy Agency, is mainly driven by a positive supply shock. Oil production has reached record levels in countries like Saudi Arabia and Russia. In addition, Iran is back in the global oil market and it has been increasing production to regain market share since sanctions against the country were lifted more recently. The US, after years of increasing production due to the shale boom, is finally being negatively affected by low oil prices and, therefore, reducing output levels due to high costs of extraction. The International Energy Agency has forecasted a decrease in US shale output by 600,000 barrels a day in 2016 and by 200,000 in 2017. Also, at least 48 North American oil and gas producers have filed for bankruptcy protection since the beginning of 2015.
The worldwide overflow of oil has resulted in rumors of a potential commitment among major producers to freeze output levels in order to control the supply and stabilize oil prices. However, OPEC members are failing to commit as they continue to “drown” the market with cheap oil in order to fight for market share. These countries are also aiming to reduce competition in the global market, especially from North America, by keeping prices low and forcing high-cost producers to file for bankruptcy. Therefore, in my opinion, any rumor in regards to commitment among oil producers can’t be thought of as anything more than just a rumor. Russia has recently announced, through its own president, that it is committed to control production which has reached levels not seen since the
Soviet Union. However, Russia has made similar promises in the past and, as expected, it didn’t follow through. Saudi Arabia is also in talks with other countries such as Venezuela to ensure a consensus among oil producers to stabilize supply, especially when it comes to Iran. However, Saudi Arabia and Iran have been on opposite sides in many different “battlefields”, which is why any sort of commitment between them is highly unlikely. Finally, even if OPEC and Russia do decide to limit output, demand for oil isn’t expected to catch up with supply until late 2016.
Concerns from the demand side are mainly driven by lower growth forecasts, especially from China. In addition, countries like Russia and Brazil are facing deep recessions, while Venezuela is fighting against extremely high inflation. Europe and Japan continue to combat deflation risk and low growth by pursuing expansionary policies, including negative interest rates. In the US, refineries are decreasing their oil purchase levels due to lack of storage capacity. Also, lower gas prices at the pumps reduce their incentive to produce and distribute such products. Nonetheless, many industry players expect activity to pick up in the summer as cheap gasoline spurs Americans to take more road trips.
China’s economic expansion created a ripple effect across the globe and resulted in higher growth rates for several countries. More recently, however, China’s economy has been slowing down, mainly due to its transition from a producer to a consumer-focused economy. As a result, trade activity in countries like Brazil has significantly deteriorated in recent years which, in turn, add further down pressure on global growth. However, it is important to notice that slower growth in China has only a small impact on the US economy because of its lower trade dependence. Finally, even though China’s GDP growth has been decreasing, it is still growing at a relatively high pace when compared to other countries, at anywhere from 6 to 7% per year.
Volatility in oil prices since the 1950s - Source: International Energy Agency
8
Therefore, the main question here is when will we see oil and gas prices reach their bottom or, in another words, when will supply adjust to demand? These questions are extremely difficult to accurately predict. However, if one looks at the breakeven price for major oil producing countries, only four can sustain prices below $35 dollars a barrel in the long term - Kuwait, Saudi Arabia, Iraq and Iran. In addition, as oil prices dipped into the $20-30 price range, rumors of freezing output levels intensified in the media, which ended up bringing prices back into the $30-35 price range. Finally, there has been an increase in the demand for energy companies’ equity and debt in the past few weeks. Hedge fund managers have started to buy oil and gas companies’ bonds betting on a stabilization of prices around $30-40 dollars a barrel. Even famous investor Warren Buffet has recently increased his position in Kinder Morgan, an energy company, which could be signaling a potential bottom for oil prices.
Sector Overview
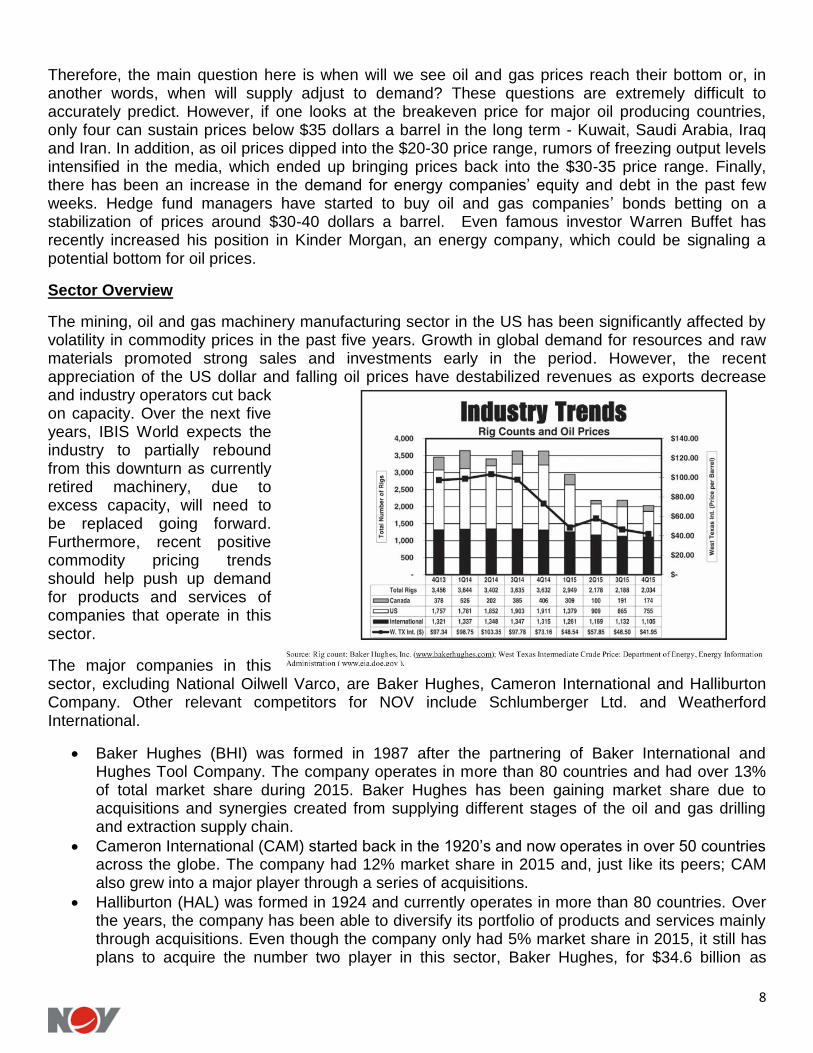
The mining, oil and gas machinery manufacturing sector in the US has been significantly affected by volatility in commodity prices in the past five years. Growth in global demand for resources and raw materials promoted strong sales and investments early in the period. However, the recent appreciation of the US dollar and falling oil prices have destabilized revenues as exports decrease and industry operators cut back on capacity. Over the next five years, IBIS World expects the industry to partially rebound from this downturn as currently retired machinery, due to excess capacity, will need to be replaced going forward. Furthermore, recent positive commodity pricing trends should help push up demand for products and services of companies that operate in this sector.
The major companies in this sector, excluding National Oilwell Varco, are Baker Hughes, Cameron International and Halliburton Company. Other relevant competitors for NOV include Schlumberger Ltd. and Weatherford International.
Baker Hughes (BHI) was formed in 1987 after the partnering of Baker International and Hughes Tool Company. The company operates in more than 80 countries and had over 13% of total market share during 2015. Baker Hughes has been gaining market share due to acquisitions and synergies created from supplying different stages of the oil and gas drilling and extraction supply chain.
Cameron International (CAM) started back in the 1920’s and now operates in over 50 countries across the globe. The company had 12% market share in 2015 and, just like its peers; CAM also grew into a major player through a series of acquisitions.
Halliburton (HAL) was formed in 1924 and currently operates in more than 80 countries. Over the years, the company has been able to diversify its portfolio of products and services mainly through acquisitions. Even though the company only had 5% market share in 2015, it still has plans to acquire the number two player in this sector, Baker Hughes, for $34.6 billion as

9
announced on November 2014. However, regulators have shown concerns about this merger as it could threaten the price and competition level within the industry.
Schlumberger (SLB) was founded in 1926 and is currently based in France. The company competes in the oil and gas equipment services and it operates in more than 85 countries across the globe. In August 2015, the company announced its plans to acquire rival Cameron International for $12.7 billion. The merger is still pending as of today; however, differently than in the Halliburton-Hughes merger, the US DOJ has granted a green signal to this deal.
Weatherford International (WFT) was founded in 1972 and is headquartered in Switzerland. The company, together with its subsidiaries, operates in several countries across the world as a multinational oilfield service enterprise.
Company Analysis
According to management, National Oilwell Varco has a long tradition of pioneering innovations that improve the cost-effectiveness, efficiency, safety and environmental impact of oil and gas operations. They believe NOV has been a leader in the development of new technology and equipment for drilling operations and servicing processes. “Through its internal development programs and certain acquisitions, National Oilwell Varco has assembled an extensive array of technologies, which are protected by a number of trade and service marks, patents and other proprietary rights.” (NOV’s 2015 Annual Report)
In my analysis, I founded hard to accurately identify how NOV differentiates itself from competitors in terms of creation of new products and services. In addition, I founded even harder to estimate how these innovations affect overall sales in the long run. Therefore, I decided to think of it as if all companies in the sector had the same R&D expertise and, because of it, no single company had any sort of competitive advantage. If this was the case, the only differential would be each company’s cash position and liquidity, which would allow them to not only survive different business cycles but also to acquire distressed competitors or partners during periods of low oil prices.
During 2015, the company enhanced its presence in places like Saudi Arabia, Abu Dhabi and Russia, both through organic growth and acquisitions. In my opinion, management’s strategy to reduce the company’s reliance on domestic customers will benefit the company in the long run. The current strength of the US dollar is an advantage for US companies when it comes to foreign acquisitions. In addition, North American producers have higher break-even prices and so, if oil prices remain low, this region will certainly be negatively affected to a greater extent than other regions like Middle East. Also, because of deteriorating market conditions, National Oilwell Varco has decided to reduce its workforce by 21% and has closed 75 facilities since mid-2014 in order to become smaller and with a more efficient footprint. Nevertheless, the company returned $2.9 billion to shareholders through dividends and share repurchases in 2015. Finally, management is focused on monetizing the profit from its backlog and on slowing down the progress on revenue recognition out of backlog to sort of match payments and minimize working capital requirements in those projects.

10
Financial Analysis
Because of the cyclicality associated with oil and gas markets and its effects on the company’s earnings, I decided to analyze the past 10 years so that I could capture the full cycle and avoid misleading averages. Looking at NOV’s numbers from 2006 until 2015, total revenue increased by 15% per year on average. During the same period, operating income grew at almost 18% and net income was able to increase annually by 18.3% on average. At the same time, however, earnings per share increased by only 3.4% year over year.
In 2015, total assets decreased by close to $7 billion, mainly due to a decrease in cash & accounts receivables and an unusually high goodwill impairment charge. Total liabilities decreased by over $2.5 billion, primarily driven by a decrease in accruals but partially offset by an increase in long term debt. Total stockholders’ equity decreased by almost $4.5 billion in 2015, which was partially due to a decline in retained earnings. Therefore, the decline in total assets ($7B) was a result of a decline in liabilities ($2.5B) as well as a decline in equity ($4.5B).
NOV’s operations generated $1.3 billion in cash during 2015, a 50% drop from 2014. Investing activities such as acquisitions and capital expenditures declined in 2015 when compared to the previous year, primarily due to uncertainty and deteriorating market conditions. Financing activities used close to $2.2 billion dollars during the same year, mainly driven by distribution of cash to shareholders through share repurchases. Therefore, the company spent and distributed close to $2.7 billion in cash and generated $1.3 billion from operations during the year. As a result, the company’s cash and cash equivalents decreased by about $1.4 billion during 2015.
Ratio Analysis
In terms of profitability, NOV clearly has an edge over its competition. Both profit and gross margins were, on a five year average, higher than its peer group. Profit margins were 8.5% from 2011 until 2015. During the same period, gross margins have reached 25.8% of total revenue. In addition, the company has generated on average higher returns over both equity and total assets when compared to its peer group, 8.3% and 5.4% respectively.
At the end of 2015, the company had cash and cash equivalents of little over $2 billion and total debt of close to $4 billion. However, it is important to notice that almost 98% of cash and cash equivalents are maintained in accounts outside the United States. Therefore, it means the company would have to pay taxes, in addition to exchanging against a strong dollar, in order to repatriate its cash. On the other hand, depending on where the cash is, it could actually facilitate potential acquisitions and investments abroad. Also, offsetting this lack of liquidity in the US, the company does have the option to borrow

11
against its revolving credit facility or its commercial paper program. In 2015, NOV exercised an option to increase aggregate borrowing capacity under its five-year unsecured revolving credit facility by an additional $1 billion, bringing the total capacity to $4.5 billion. Therefore, since the company only has $900 million in commercial paper borrowings, it means that management has access to over $3.6 billion in available funds under this revolving credit facility. However, when compared to its peer group, NOV has similar current and quick ratios, which demonstrates solid short term liquidity among top companies in this sector.
In terms of long-term solvency, the company has shown on average a healthier balance sheet than its competitors as it has been able to maintain lower leverage throughout the past five years. Debt never accounted for more than 40% of NOV’s total assets, which is the lowest percentage among its peer group. In addition, from 2011 until 2015, the company’s debt has on average accounted for almost 15% of total equity, which is also the lowest percentage among its closest competitors.
When it comes to efficiency, however, NOV has on average underperformed its peer group. The company lags on both inventory and asset turnover. One positive from this criterion is Day Sales Outstanding, which basically means how fast the company is able to collect cash from customers that purchased on credit. NOV’s DSO has averaged 77 days in the past five years, which is faster than its peer group average of 82.5 days. Therefore, the company isn’t as efficient when it comes to selling inventory; however, it does collect cash from customers faster than its competitors which, in turn, reduce overall credit risk.
SWOT Analysis
Strengths: NOV has a strong balance sheet, which gives them plenty of liquidity and solvency to survive different business cycles. The company has not only a wide range of products and services, but it also operates in an extensive geographic area through six different continents.
Weaknesses: Increasing financial leverage, mainly through additions to long term debt. Volatility in revenue due to its dependence on oil and gas prices. Also, lack of efficiency when compared to its peer group.
Opportunities: Because of a stronger balance sheet, NOV has greater capabilities in terms of new acquisitions when compared to its peers. Also, the current environment has resulted in lower valuations across the industry, which becomes an opportunity for stronger and bigger firms that can access capital and invest in further expansion.
Threats: Decline in oil and gas prices due to lower demand or further increase in supply. Changes in environmental regulations could negatively affect the company. Finally, volatility in the foreign exchange market does impact the company’s comprehensive income.
Valuation
The company’s stock value was calculated by the application of an estimated discount rate to two valuation methodologies: Discounted Free Cash Flow (DCF) & Comparable Multiples. After considering the factors involved in each valuation method, weights were assigned to each model to determine the price target for National Oilwell’s common share.
Required Return on Equity
The DCF valuation requires a required return on equity to discount the forecasted future cash flows. A 12% discount rate was calculated based on an average between the capital asset pricing model and the bond-yield-plus-premium approach. In my opinion, a 12% discount rate is a conservative estimate, which compensates for the company’s risks associated with the oil and gas industry.

12
The current risk free rate on US government bonds is assumed to be 1.85% (10 year T-Bonds). In addition, the equity risk premium for US companies is assumed to be 6.10%, as calculated from a geometric average of stock returns from 1928 to 2009. Finally, the company’s beta of 1.7 is used and, when all are combined, it yields a required return on equity of 12.2%.
National Oilwell has approximately $2.9 billion dollars in senior notes that are mainly due between 2022 and 2042. The total weighted average interest charge on this debt equals to 8.75%. An additional 3% is added to compensate for the equity risk premium, which is typical in the United States, and the result yields a required return on equity of 11.8%. Going forward the discount rate of 12% will be used as the required rate of return on equity.
Target Price
The Discounted Free Cash Flow method uses forecasted figures, which are based on assumptions including expected growth rate of revenue and operating margins. These assumptions are supported by historical averages and were used to estimate free cash flows over the next ten years. A long-term growth rate of 2% was used in this model and the result yields a price target of $37.37 for NOV’s common share.
The Comparable Multiples methodology uses a combination of five peer companies as well as five valuation ratios to estimate on average five comparable multiples, which can be further used to calculate NOV’s price target. The comparable companies used are: Baker Hughes, Halliburton Company, Cameron International, Schlumberger and Weatherford International. Finally, based on the final weighted average multiples and the 2016 forecasted figures, NOV’s common share was valued at $37.56. Therefore, National Oilwell Varco’s intrinsic value of $37.50 was calculated using a simple average of both valuation methods described previously.
Conclusion
Based on the analysis in this report, I am initiating coverage on National Oilwell Varco with a rating of HOLD and a twelve month price target of $37.50. This would give an expected appreciation of 7.4% based on the stock’s current price of $34.93 as of March 7, 2016.
The company has a diversified portfolio of products and services, which allows it to mitigate some of the risks associated with the volatility in oil and gas prices. In addition, NOV’s strong balance sheet not only helps the company survive the current downturn, but it also gives management the opportunity to continue expanding the company’s operations in promising markets. Low oil prices and a strong dollar should continue to impact NOV’s financial results in the near term. In addition, as management continues to reduce costs, it will be interesting to see if efficiency improves when compared to its peers. Finally, even though only $1.5 billion of NOV’s total debt comes due in the next five years, the company should restrict itself from adding more leverage to its operations until it sees improvement in the market conditions.

13
Investment Risks
The company is dependent upon the level of activity in the oil and gas industry. The current downturn has resulted in reduced demand for oilfield services which, in turn, negatively impacts NOV’s financial results.
Volatility in oil and gas prices affects demand for NOV’s products and services. Expectations for future prices cause many shifts in the expenditure levels of oil and gas companies and drilling contractors.
Competition within the industry could lead to lower revenue and earnings. The oilfield products and services industry is highly competitive. In addition, certain government-owned oil companies located in foreign countries like Brazil, in which NOV operates, have adopted policies or regulations that may give local nationals in these countries competitive advantages.
There are risks associated with the company’s presence in international markets. Since approximately 75% of revenue came from abroad in 2015, the company is clearly subject to risks normally associated with conducting business in foreign nations such as political instability, currency restrictions and economic sanctions.
The results of operations are subject to market risk from changes in foreign currency exchange rates. Therefore, the appreciation of the US dollar could result in further decreases in revenue from the company’s international operations.
An impairment of goodwill or other intangible assets could reduce earnings. In 2015, the company impaired $1.6 billion of goodwill and other intangible assets. Cycle downturns are usually the primary driver of asset impairment charges because, during these periods, valuations deteriorate as levels of activity decreases in the industry.
NOV’s business is exposed to environmental regulations and risks involved with potential changes in regulations in different countries. While the company does maintain liability insurance, this insurance is subject to coverage limits. Most importantly, certain policies do not provide coverage for damages resulting from environmental contamination.
Works Cited
National Oilwell Varco Financial Statements US Department of Energy IBIS World Industry Report International Energy Agency Energy Information Administration Federal Reserve Bloomberg Thompson Reuters Morningstar Yahoo Finance

14
Appendix
Exhibit 1 – Income Statement

15
Exhibit 2 – Balance Sheet

16
Exhibit 3 – Cash Flow Statement

17
Exhibit 4 – Discounted Free Cash Flow

18
Exhibit 5 – Comparable Multiples
Exhibit 6 – Historical Growth

19
Exhibit 7 – Active Drilling Rigs (Source: National Oilwell’s 2015 Annual Report)
Exhibit 8 – Oil Production: Saudi Arabia vs USA (Source: US Department of Energy)

20
Technical Analysis
In this section, I will briefly analyze NOV’s stock chart by looking at its price movement over the past 10 years. As you can see from the exhibit above, the stock has dropped significantly since August 2014. However, it appears that a correction is due, mainly because of the distance between the stock price and both its 50-day & 100-day simple moving averages, which are currently in the range between $55 and $60 per share. In addition, looking at the relative strength indicator, the stock seems to be oversold as the indicator reaches even lower levels than during the financial crisis in 2008. Finally, looking at support levels, the stock seems to be trading at just above an important support level at around $30 from June 2010. Also, there is another support level just underneath, at around $22, which was the bottom of the financial crisis for this stock. Therefore, even though the downward trend is clear, it appears to me that it might be losing momentum which could indicate a correction or, even, a potential reversal of the current trend. However, until it does show strong patterns of trend reversal, I’ll maintain my “HOLD” recommendation for this stock.