Embed Size (px)
Citation preview
Investor Conference Call
Financial Year 2013
24 April 2014
2
5
Agenda
Business Profile1
2
3
Presenter
Dr. Jörg BergmannChief Financial OfficerOpen Grid Europe GmbH
Regulatory Developments
4 Financial Performance
Refinancing
Outlook
3
DisclaimerThis presentation has been prepared solely for use at the presentation of the annual financial statement to the investors on 24 April 2014.The information in this presentation is being made available for information purposes only. It does not constitute an investment advice, anoffer, solicitation, or recommendation to subscribe, purchase or sell any securities of Vier Gas Transport GmbH, or any of its subsidiaries, inany way.
No warranty or liabilityAlthough this presentation has been arranged very meticulously concerning its content, its information and its statements, Vier GasTransport GmbH or Open Grid Europe GmbH or any of its affiliates or shareholders or any of their respective directors, officers oremployees or any other person does not provide a guarantee, express or implied, and does not assume liabilities in relation to the fairness,accuracy, completeness or reasonableness of this presentation and/or the information and statements contained herein. Also no warranty,express or implied, is or will be made and no liability is or will be accepted for any information and statements made available in this context,in writing, verbally in discussion or otherwise.In particular it is possible that the information and the statements may be incomplete, shortened and may not contain all the informationwhich might be of great value to a person receiving this presentation.
In particular no reliance on forward-looking statementsThis presentation contains forward-looking statements. By their nature, forward-looking statements involve a number of unknown risks,uncertainties and assumptions that could cause actual results, performance, achievements, outcome and financial effects of the plans andevents described in this presentation to differ materially from those expressed or implied by the forward-looking statements.
No obligation to update or to carry out transactionsThe presentation speaks only as of its date. This presentation might be subject to amendment, revision and updating without notice, butneither Vier Gas Transport GmbH nor Open Grid Europe GmbH, nor any of their respective advisers and/or agents, undertake any obligationto provide the investors with access to any additional information or to update this presentation or any additional information or to correct anyinaccuracies in any such information which may become apparent.
Nondisclosure/restrictions by lawThe distribution or possession of this presentation in or from certain jurisdictions may be restricted by law. Persons into whose possessionthis presentation comes are required to inform them about and to observe any such restrictions. Vier Gas Transport GmbH and Open GridEurope GmbH accept no liability to any person in relation to the distribution or possession of this presentation in or from any jurisdiction.
4
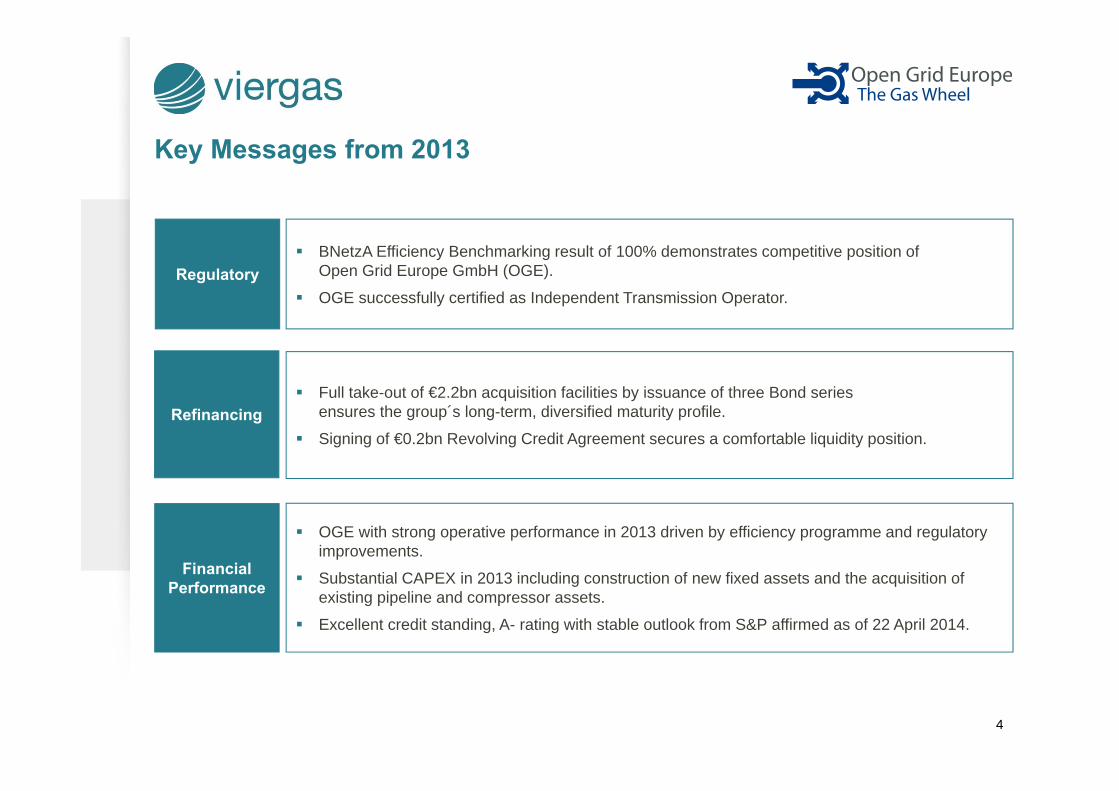
OGE with strong operative performance in 2013 driven by efficiency programme and regulatory improvements.
Substantial CAPEX in 2013 including construction of new fixed assets and the acquisition of existing pipeline and compressor assets.
Excellent credit standing, A- rating with stable outlook from S&P affirmed as of 22 April 2014.
Key Messages from 2013
Regulatory
Financial Performance
BNetzA Efficiency Benchmarking result of 100% demonstrates competitive position ofOpen Grid Europe GmbH (OGE).
OGE successfully certified as Independent Transmission Operator.
RefinancingFull take-out of €2.2bn acquisition facilities by issuance of three Bond series ensures the group´s long-term, diversified maturity profile.
Signing of €0.2bn Revolving Credit Agreement secures a comfortable liquidity position.

Business Profile
Regulatory Developments
Refinancing
Financial Performance
Outlook
1
2
3
5
4
5
6
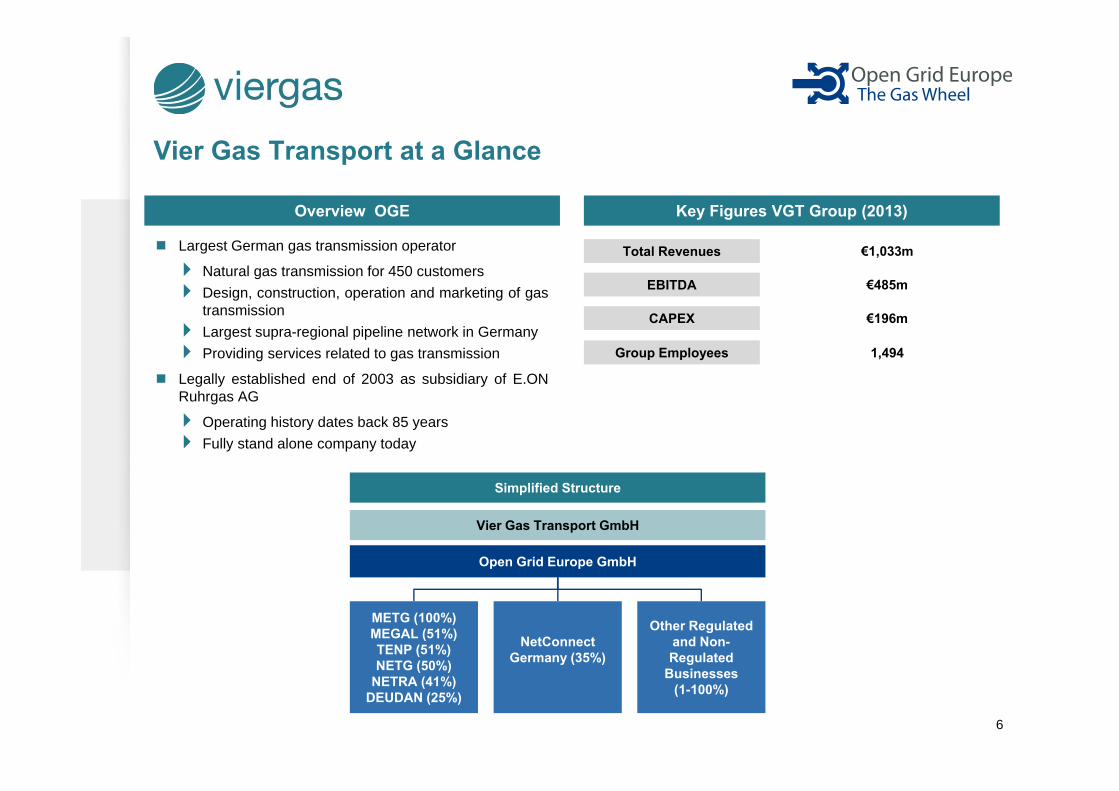
Key Figures VGT Group (2013)Overview OGE
Vier Gas Transport at a Glance
Vier Gas Transport GmbH
Open Grid Europe GmbH
METG (100%)MEGAL (51%)TENP (51%)NETG (50%)
NETRA (41%)DEUDAN (25%)
NetConnectGermany (35%)
Other Regulated and Non-Regulated
Businesses(1-100%)
Largest German gas transmission operator
Natural gas transmission for 450 customersDesign, construction, operation and marketing of gastransmissionLargest supra-regional pipeline network in GermanyProviding services related to gas transmission
Legally established end of 2003 as subsidiary of E.ONRuhrgas AG
Operating history dates back 85 yearsFully stand alone company today
EBITDA
€1,033m
€485m
Group Employees 1,494
CAPEX €196m
Total Revenues
Simplified Structure
7
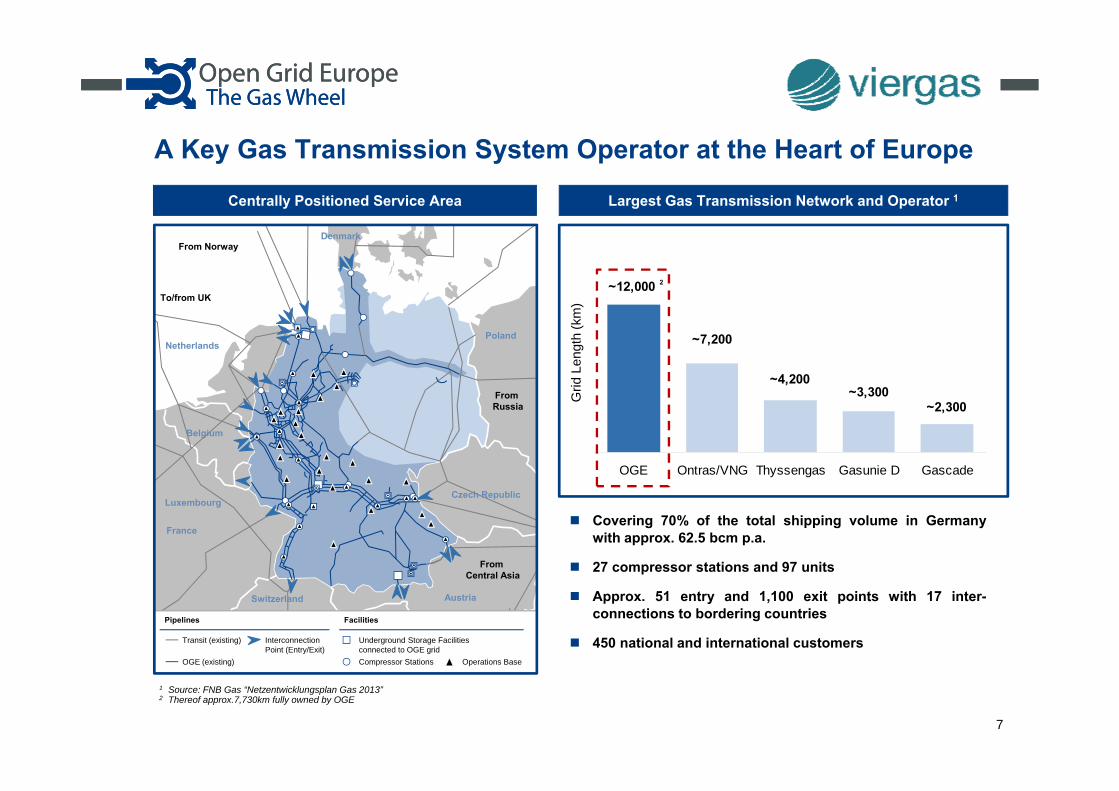
A Key Gas Transmission System Operator at the Heart of Europe
~12,000 ³
~7,200
~4,200~3,300
~2,300
OGE Ontras/VNG Thyssengas Gasunie D Gascade
Largest Gas Transmission Network and Operator 1
1 Source: FNB Gas “Netzentwicklungsplan Gas 2013” 2 Thereof approx.7,730km fully owned by OGE
Grid
Len
gth
(km
)
Centrally Positioned Service Area
Poland
Czech Republic
AustriaSwitzerland
France
Luxembourg
Belgium
Netherlands
To/from UK
From NorwayDenmark
From Russia
From Central Asia
Pipelines
Transit (existing)
OGE (existing)
Interconnection Point (Entry/Exit)
Facilities
Underground Storage Facilities connected to OGE gridCompressor Stations Operations Base
Covering 70% of the total shipping volume in Germanywith approx. 62.5 bcm p.a.
27 compressor stations and 97 units
Approx. 51 entry and 1,100 exit points with 17 inter-connections to bordering countries
450 national and international customers
2

Business Profile
Regulatory Developments
Refinancing
Financial Performance
Outlook
1
2
3
8
4
5
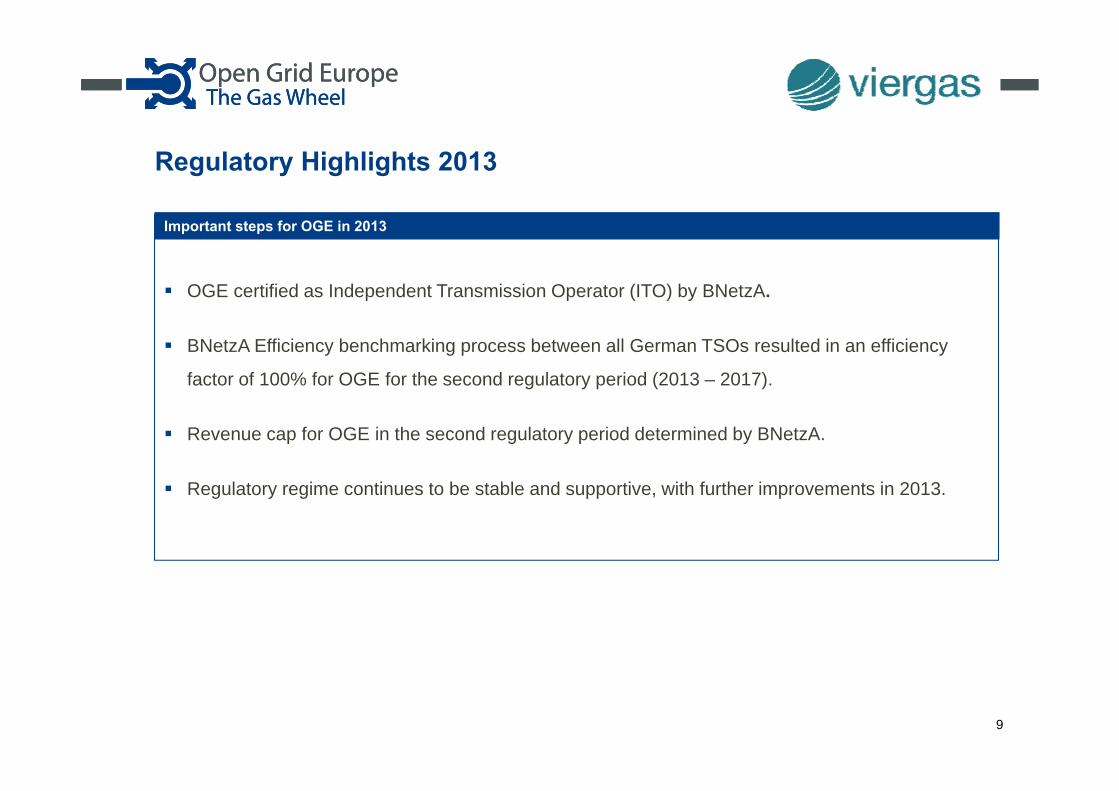
Regulatory Highlights 2013
9
OGE certified as Independent Transmission Operator (ITO) by BNetzA.
BNetzA Efficiency benchmarking process between all German TSOs resulted in an efficiency
factor of 100% for OGE for the second regulatory period (2013 – 2017).
Revenue cap for OGE in the second regulatory period determined by BNetzA.
Regulatory regime continues to be stable and supportive, with further improvements in 2013.
Important steps for OGE in 2013
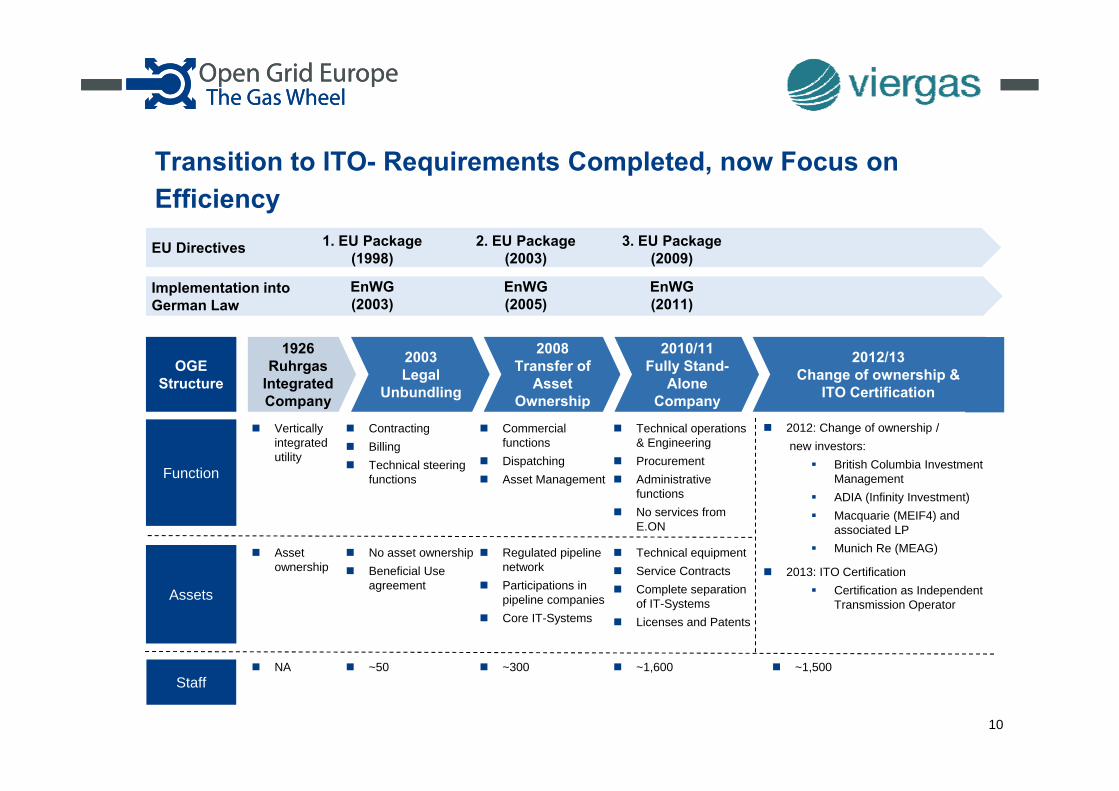
Transition to ITO- Requirements Completed, now Focus on Efficiency
ContractingBillingTechnical steering functions
Regulated pipeline networkParticipations in pipeline companiesCore IT-Systems
Commercial functionsDispatchingAsset Management
Technical equipmentService ContractsComplete separation of IT-SystemsLicenses and Patents
Technical operations & EngineeringProcurementAdministrative functionsNo services from E.ON
No asset ownershipBeneficial Use agreement
~50 ~300NA ~1,600
Verticallyintegratedutility
Assetownership
Function
Assets
Staff
OGE Structure
EU Directives 1. EU Package (1998)
2. EU Package (2003)
3. EU Package (2009)
Implementation intoGerman Law
EnWG(2003)
EnWG (2005)
EnWG(2011)
1926 Ruhrgas
Integrated Company
2003Legal
Unbundling
2008Transfer of
Asset Ownership
2010/11Fully Stand-
Alone Company
2012/13Change of ownership &
ITO Certification
~1,500
2012: Change of ownership /new investors:
British Columbia Investment ManagementADIA (Infinity Investment)Macquarie (MEIF4) and associated LPMunich Re (MEAG)
2013: ITO CertificationCertification as Independent Transmission Operator
10
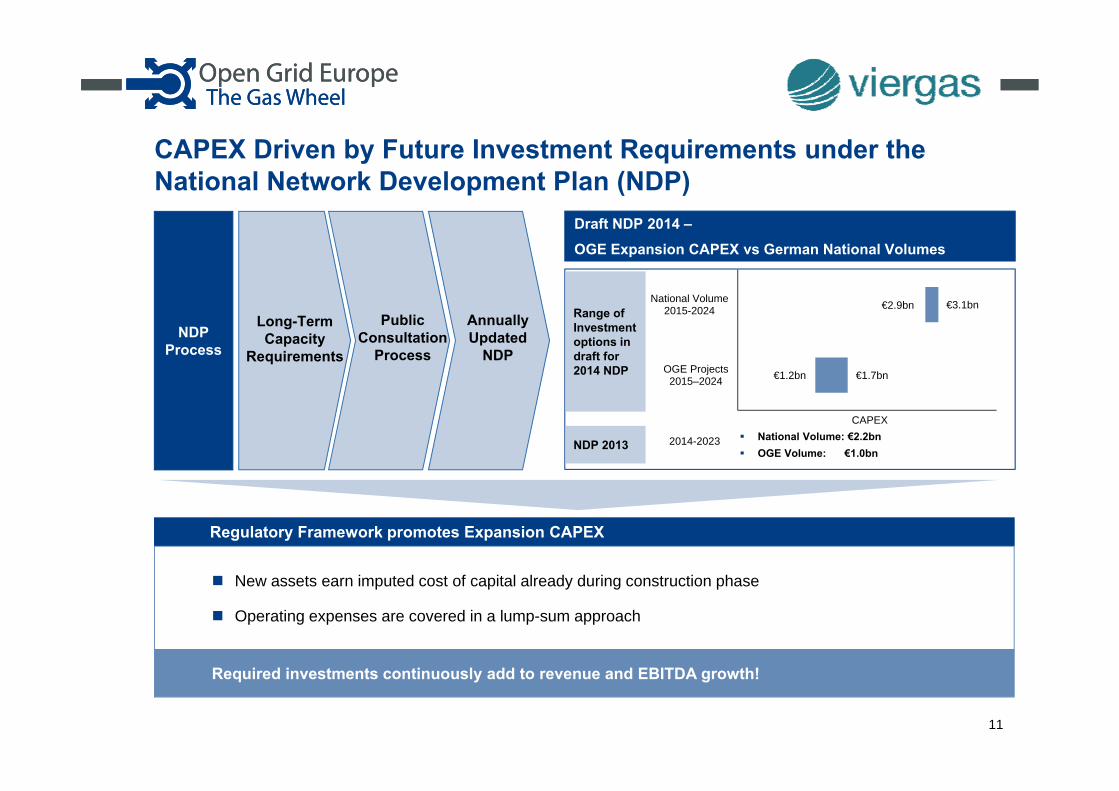
CAPEX Driven by Future Investment Requirements under the National Network Development Plan (NDP)
New assets earn imputed cost of capital already during construction phase
Operating expenses are covered in a lump-sum approach
Regulatory Framework promotes Expansion CAPEX
Required investments continuously add to revenue and EBITDA growth!
Draft NDP 2014 –
OGE Expansion CAPEX vs German National Volumes
NDP Process
€2.9bn
€1.2bn
€3.1bn
€1.7bn
National Volume 2015-2024
OGE Projects 2015–2024
CAPEX
Range of Investment options in draft for 2014 NDP
National Volume: €2.2bnOGE Volume: €1.0bn
Long-Term Capacity
Requirements
Public Consultation
Process
Annually Updated
NDP
11
NDP 2013 2014-2023

Business Profile
Regulatory Developments
Refinancing
Financial Performance
Outlook
1
2
3
12
4
5
13
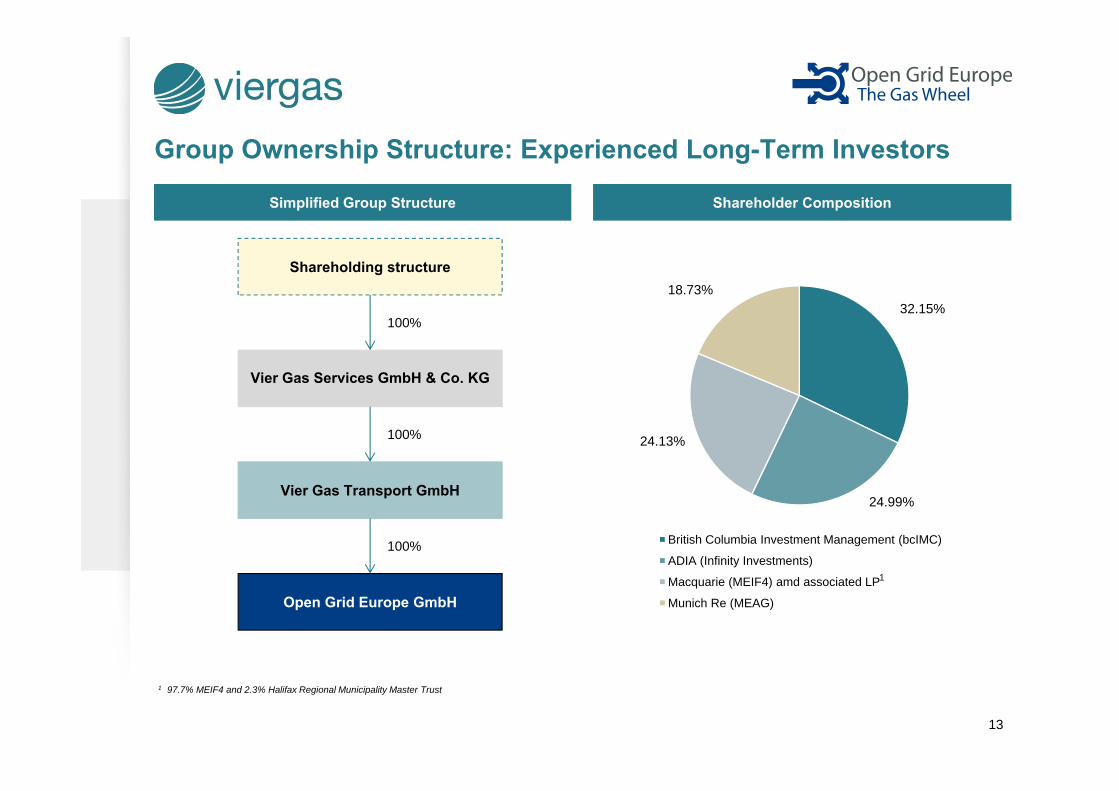
Group Ownership Structure: Experienced Long-Term Investors
1 97.7% MEIF4 and 2.3% Halifax Regional Municipality Master Trust
Open Grid Europe GmbH
Vier Gas Transport GmbH
Vier Gas Services GmbH & Co. KG
Shareholding structure
100%
100%
100%
Simplified Group Structure Shareholder Composition
32.15%
24.99%
24.13%
18.73%
British Columbia Investment Management (bcIMC)
ADIA (Infinity Investments)
Macquarie (MEIF4) amd associated LP
Munich Re (MEAG)
1
14
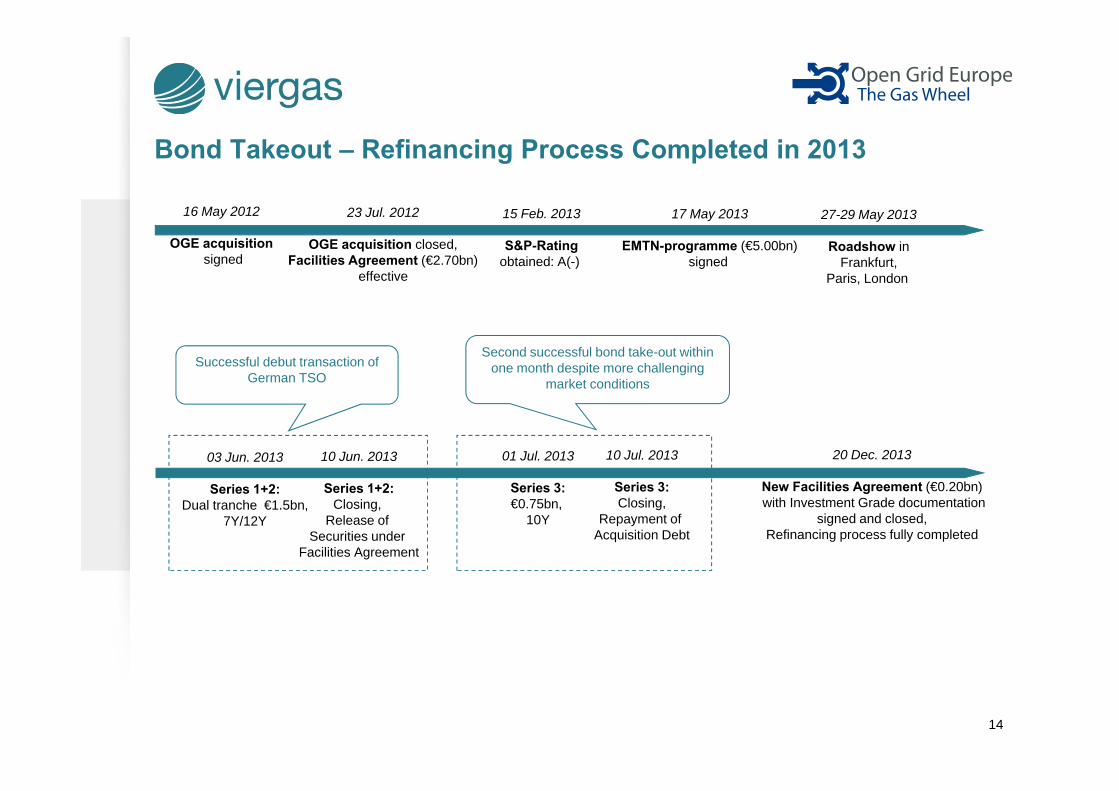
Bond Takeout – Refinancing Process Completed in 2013
23 Jul. 2012
OGE acquisition closed,Facilities Agreement (€2.70bn)
effective
15 Feb. 2013
S&P-Ratingobtained: A(-)
17 May 2013
EMTN-programme (€5.00bn)signed
27-29 May 2013
Roadshow inFrankfurt,
Paris, London
03 Jun. 2013
Series 1+2:Dual tranche €1.5bn,
7Y/12Y
10 Jun. 2013
Series 1+2:Closing,
Release ofSecurities under
Facilities Agreement
01 Jul. 2013
Series 3:€0.75bn,
10Y
10 Jul. 2013
Series 3:Closing,
Repayment ofAcquisition Debt
Successful debut transaction of German TSO
Second successful bond take-out within one month despite more challenging
market conditions
16 May 2012
OGE acquisitionsigned
20 Dec. 2013
New Facilities Agreement (€0.20bn)with Investment Grade documentation
signed and closed,Refinancing process fully completed
15
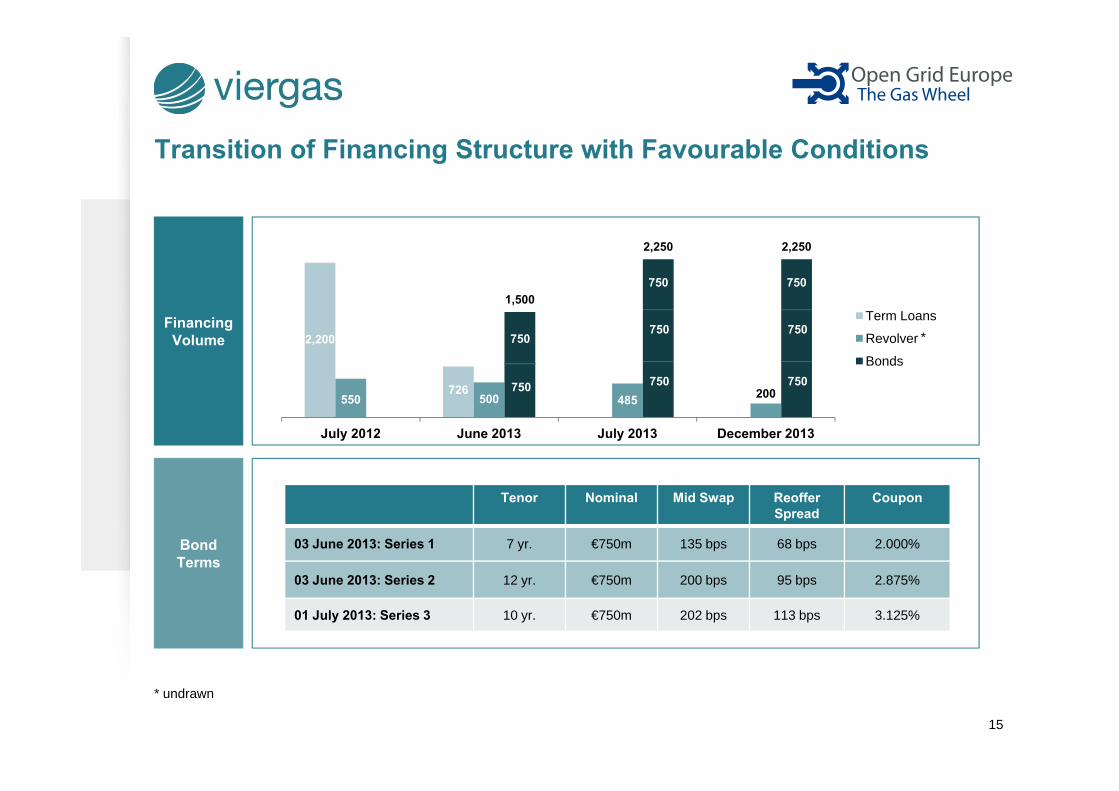
Transition of Financing Structure with Favourable Conditions
2,200
726550 500 485 200
1,500
2,250 2,250
July 2012 June 2013 July 2013 December 2013
Term Loans
Revolver
Bonds
Tenor Nominal Mid Swap ReofferSpread
Coupon
03 June 2013: Series 1 7 yr. €750m 135 bps 68 bps 2.000%
03 June 2013: Series 2 12 yr. €750m 200 bps 95 bps 2.875%
01 July 2013: Series 3 10 yr. €750m 202 bps 113 bps 3.125%
Financing Volume
Bond Terms
750
750
750
750
*
* undrawn
750
750
750
750
750
16
97
98
99
100
101
102
103
104
105
106
107
108
0
20
40
60
80
100
120
Jul‐13 Aug‐13 Sep‐13 Oct‐13 Nov‐13 Dec‐13 Jan‐14 Feb‐14 Mar‐14 Apr‐14
Bond
Price
Spread
vs. EUR m/s (bps)
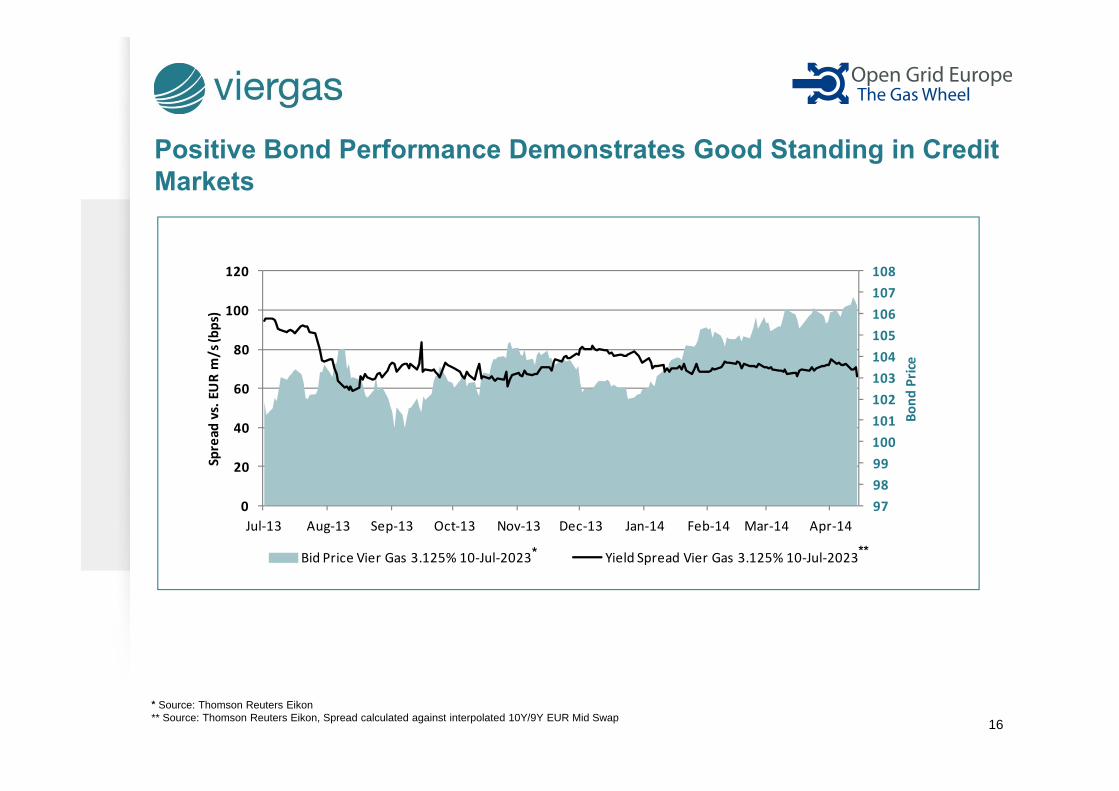
Bid Price Vier Gas 3.125% 10‐Jul‐2023 Yield Spread Vier Gas 3.125% 10‐Jul‐2023
Positive Bond Performance Demonstrates Good Standing in Credit Markets
* Source: Thomson Reuters Eikon** Source: Thomson Reuters Eikon, Spread calculated against interpolated 10Y/9Y EUR Mid Swap
* **
17
Business Profile
Regulatory Developments
Refinancing
Financial Performance
Outlook
1
2
3
4
5
18
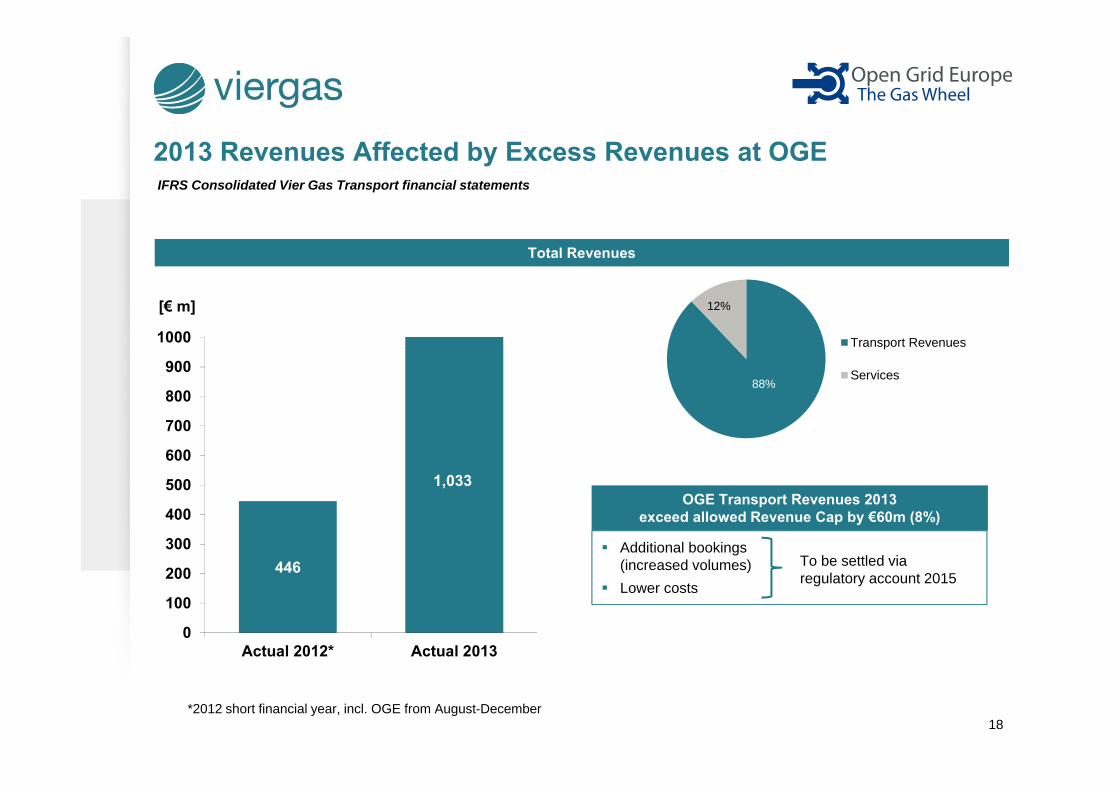
2013 Revenues Affected by Excess Revenues at OGE
Total Revenues
*2012 short financial year, incl. OGE from August-December
Additional bookings(increased volumes)Lower costs
OGE Transport Revenues 2013exceed allowed Revenue Cap by €60m (8%)
To be settled via regulatory account 2015
IFRS Consolidated Vier Gas Transport financial statements
446
1,033
0
100
200
300
400
500
600
700
800
900
1000
Actual 2012* Actual 2013
[€ m]
Transport Revenues
Services88%
12%
19
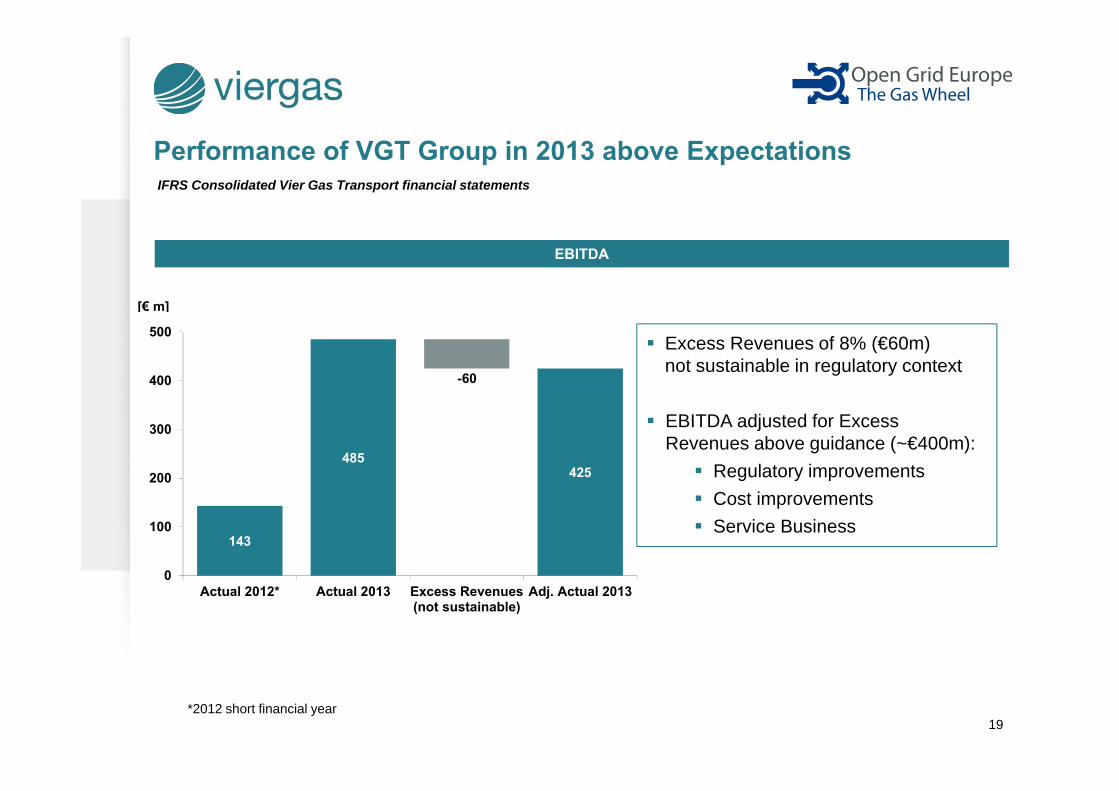
143
485425
-60
0
100
200
300
400
500
Actual 2012* Actual 2013 Excess Revenues(not sustainable)
Adj. Actual 2013
[€ m]
Performance of VGT Group in 2013 above Expectations
Excess Revenues of 8% (€60m) not sustainable in regulatory context
EBITDA adjusted for Excess Revenues above guidance (~€400m):
Regulatory improvementsCost improvementsService Business
EBITDA
*2012 short financial year
IFRS Consolidated Vier Gas Transport financial statements
20
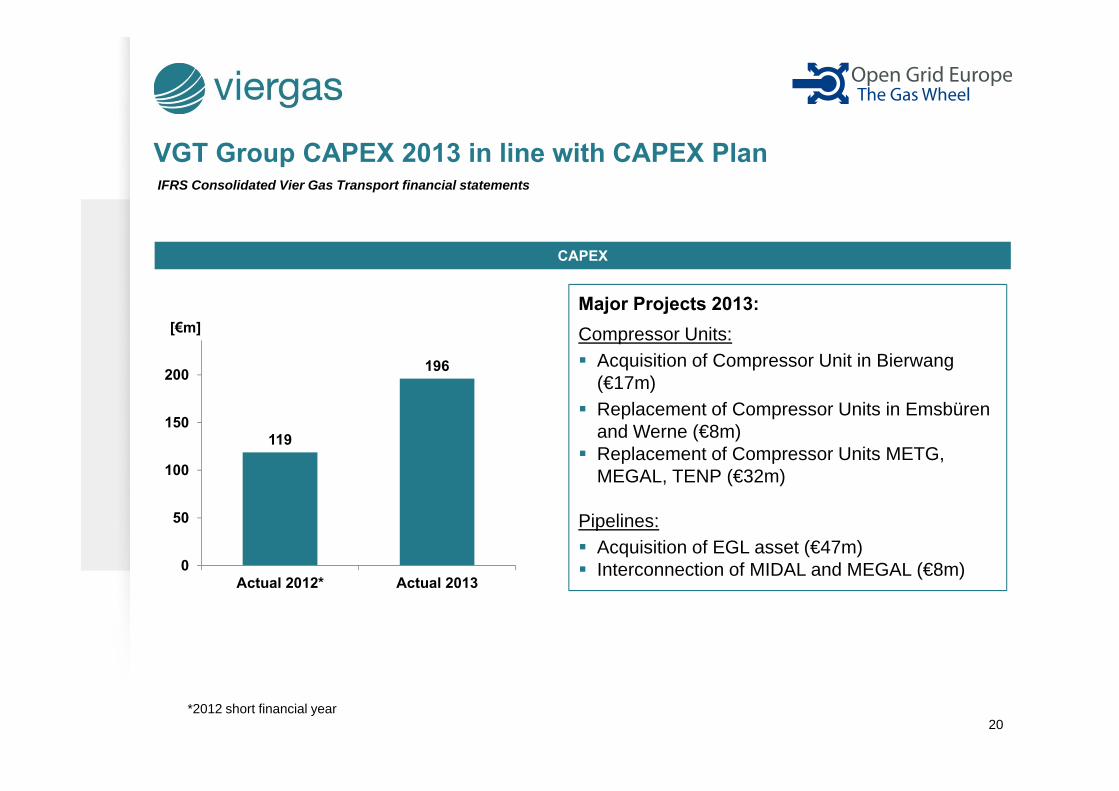
VGT Group CAPEX 2013 in line with CAPEX Plan
Major Projects 2013:Compressor Units:
Acquisition of Compressor Unit in Bierwang(€17m)Replacement of Compressor Units in Emsbürenand Werne (€8m)Replacement of Compressor Units METG, MEGAL, TENP (€32m)
Pipelines:Acquisition of EGL asset (€47m)Interconnection of MIDAL and MEGAL (€8m)
CAPEX
119
196
0
50
100
150
200
250
Actual 2012* Actual 2013
[€m]
*2012 short financial year
IFRS Consolidated Vier Gas Transport financial statements
21
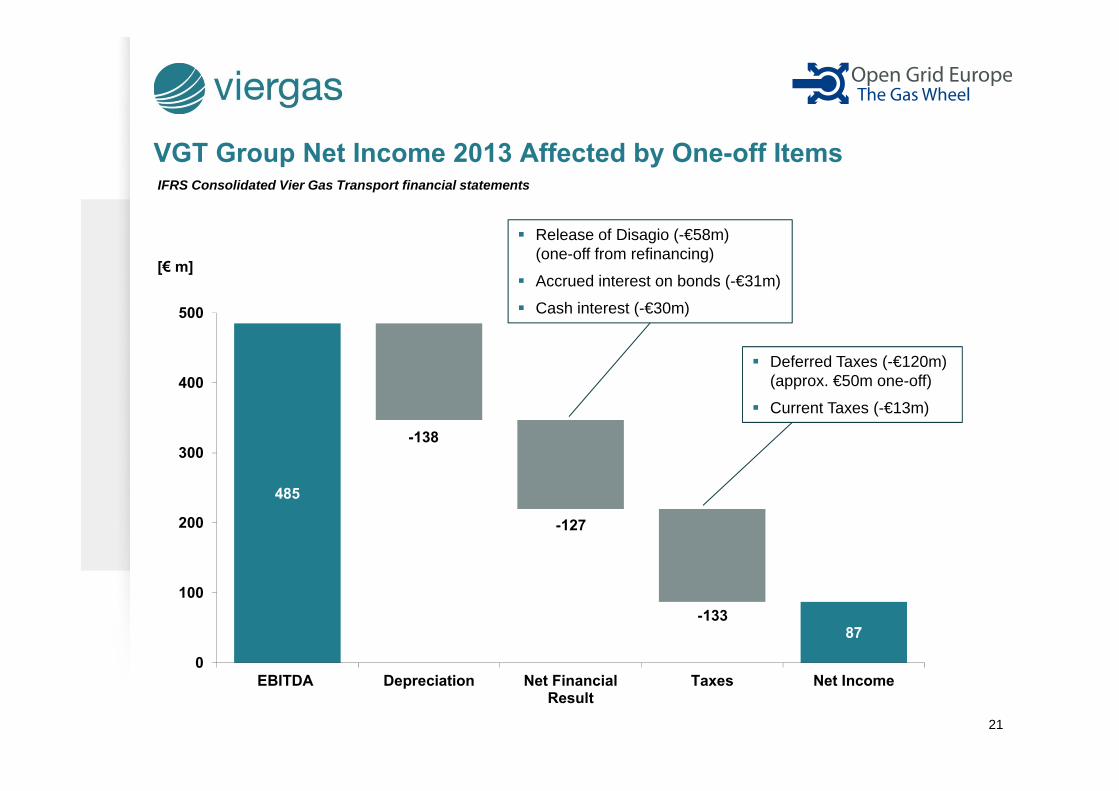
485
87
-138
-127
-133
0
100
200
300
400
500
EBITDA Depreciation Net FinancialResult
Taxes Net Income
[€ m]
VGT Group Net Income 2013 Affected by One-off Items
Release of Disagio (-€58m)(one-off from refinancing)
Accrued interest on bonds (-€31m)
Cash interest (-€30m)
Deferred Taxes (-€120m)(approx. €50m one-off)
Current Taxes (-€13m)
IFRS Consolidated Vier Gas Transport financial statements
22
Business Profile
Regulatory Developments
Refinancing
Financial Performance
Outlook
1
2
3
4
5
23
Outlook: Optimisation in Stable Environment
Adjusted for non-sustainable effects, 2014 EBITDA expected on the level of 2013
Focusing on internal growth and further optimisation of internal cost structures
Implementing investment programme in line with NDP
Preparing for 3rd regulatory period
Supporting the European gas market integration
2014 and beyond
24
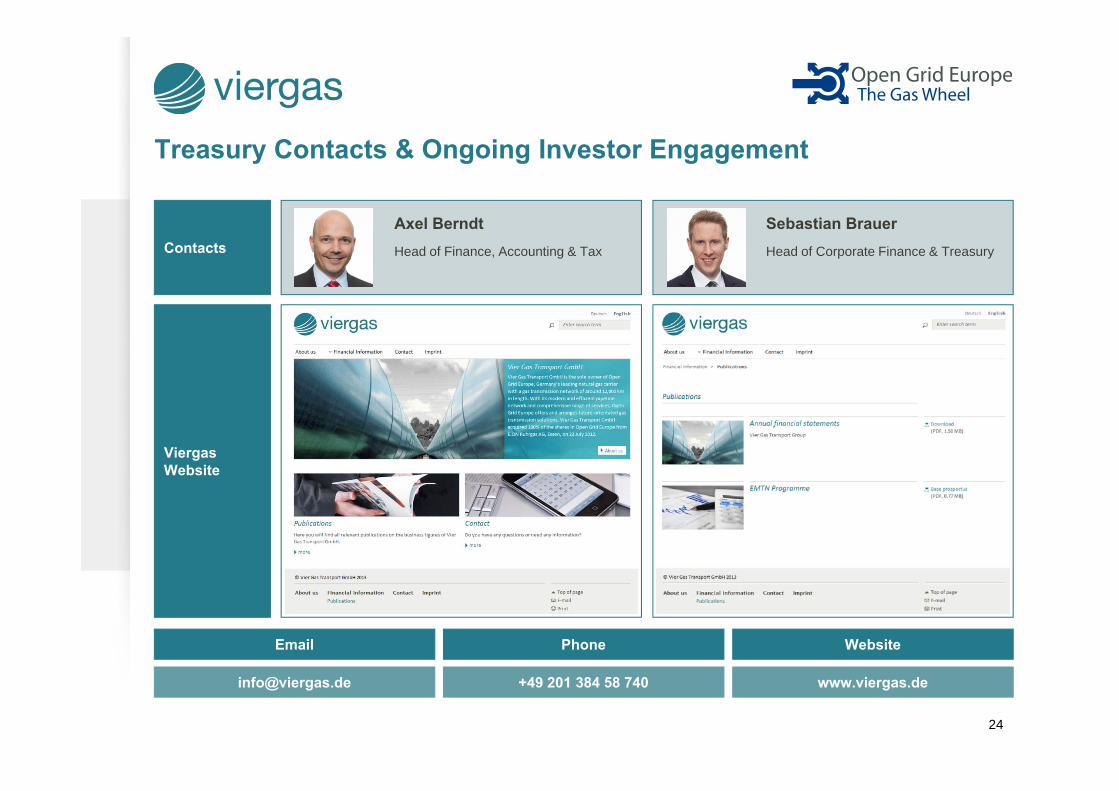
Treasury Contacts & Ongoing Investor Engagement
Axel BerndtHead of Finance, Accounting & Tax
Viergas Website
ContactsSebastian BrauerHead of Corporate Finance & Treasury
Email Phone Website
[email protected] +49 201 384 58 740 www.viergas.de
25
Appendix:
Financial Statements 2013
26
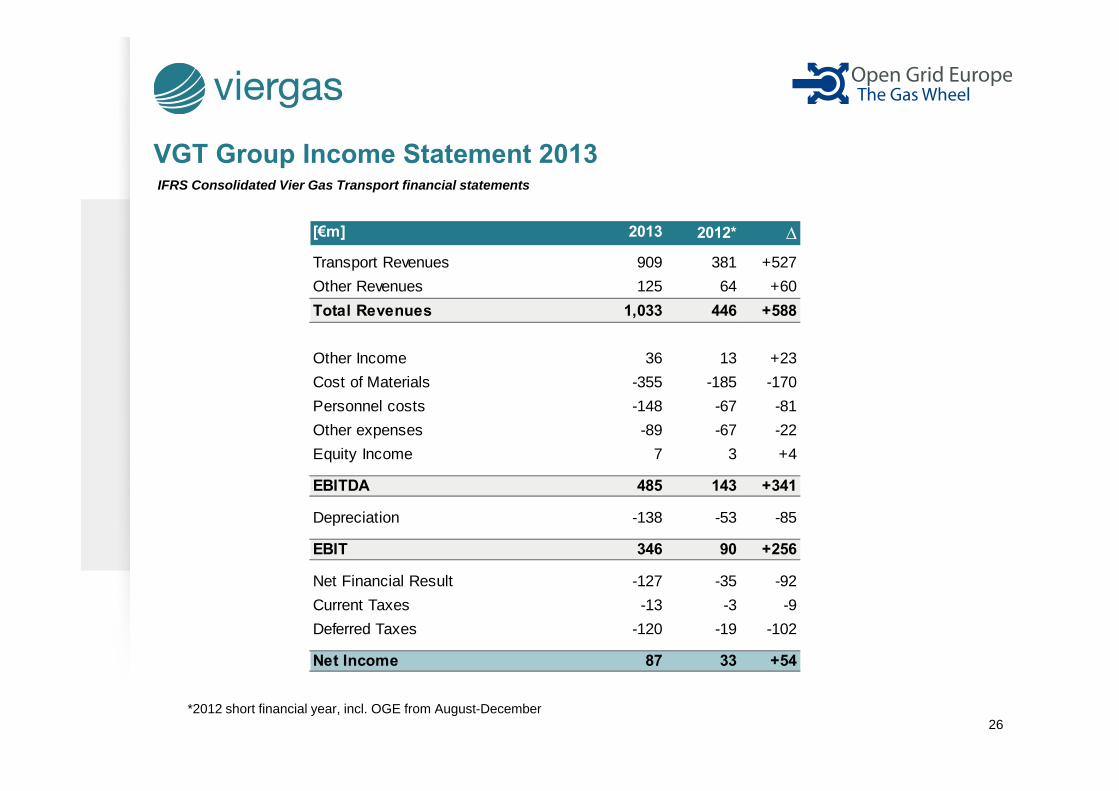
VGT Group Income Statement 2013
*
*2012 short financial year, incl. OGE from August-December
IFRS Consolidated Vier Gas Transport financial statements
[€m] 2013 2012* ∆Transport Revenues 909 381 +527Other Revenues 125 64 +60Total Revenues 1,033 446 +588
Other Income 36 13 +23Cost of Materials -355 -185 -170Personnel costs -148 -67 -81Other expenses -89 -67 -22Equity Income 7 3 +4
EBITDA 485 143 +341
Depreciation -138 -53 -85
EBIT 346 90 +256
Net Financial Result -127 -35 -92Current Taxes -13 -3 -9Deferred Taxes -120 -19 -102
Net Income 87 33 +54
27
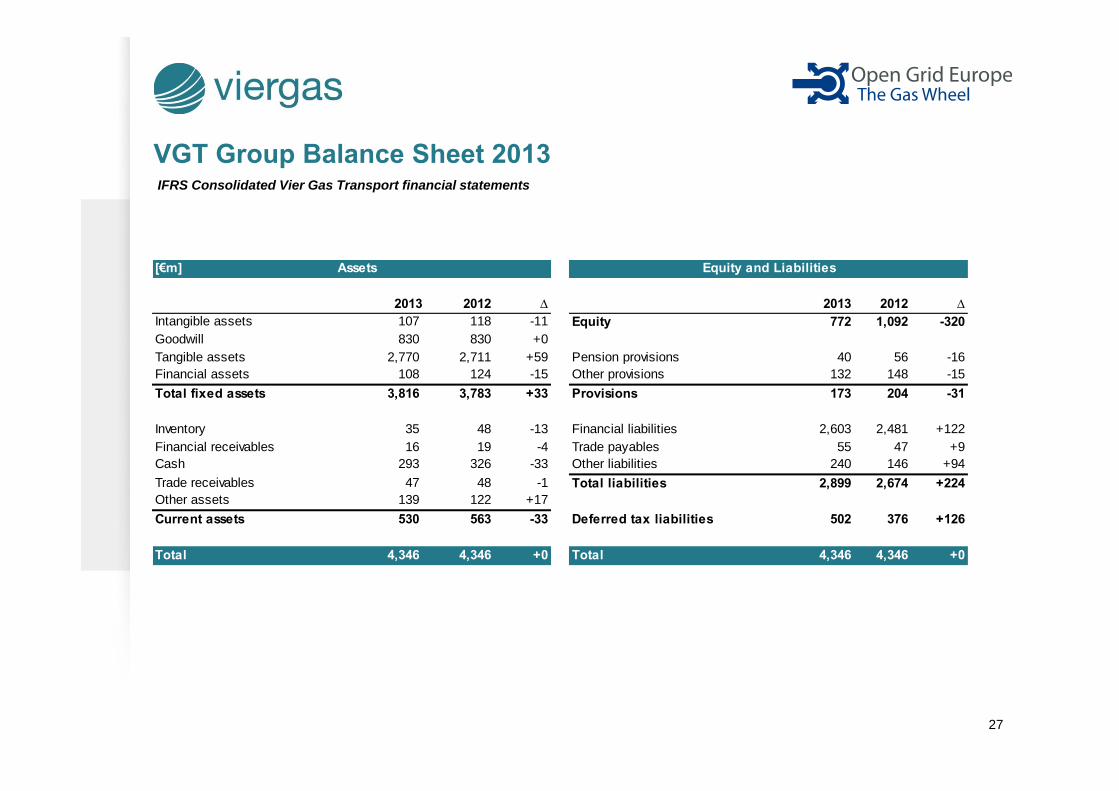
VGT Group Balance Sheet 2013IFRS Consolidated Vier Gas Transport financial statements
Intangible assets EquityGoodwillTangible assets Pension provisionsFinancial assets Other provisionsTotal fixed assets Provisions
Inventory Financial liabilitiesFinancial receivables Trade payablesCash Other liabilitiesTrade receivables Total liabilitiesOther assetsCurrent assets Deferred tax liabilities
Total Total
122139 +17
5519 -4
48 -1326 -33
530
4,346
16 293
47 +9240 146 +94
∆118 -11 1,092 -320
2012 ∆ 20122013772
[€m] Assets Equity and Liabilities
204 -31173
830 +02,711 +59 56 -16
124 -15 148 -1540
132
2,481 +1222,603
2,674 +2242,899
376 +126502
4,346 +0 4,346 +04,346
2013107 830
2,770
35
47
108 3,816
563 -33
48 -13
3,783 +33
28
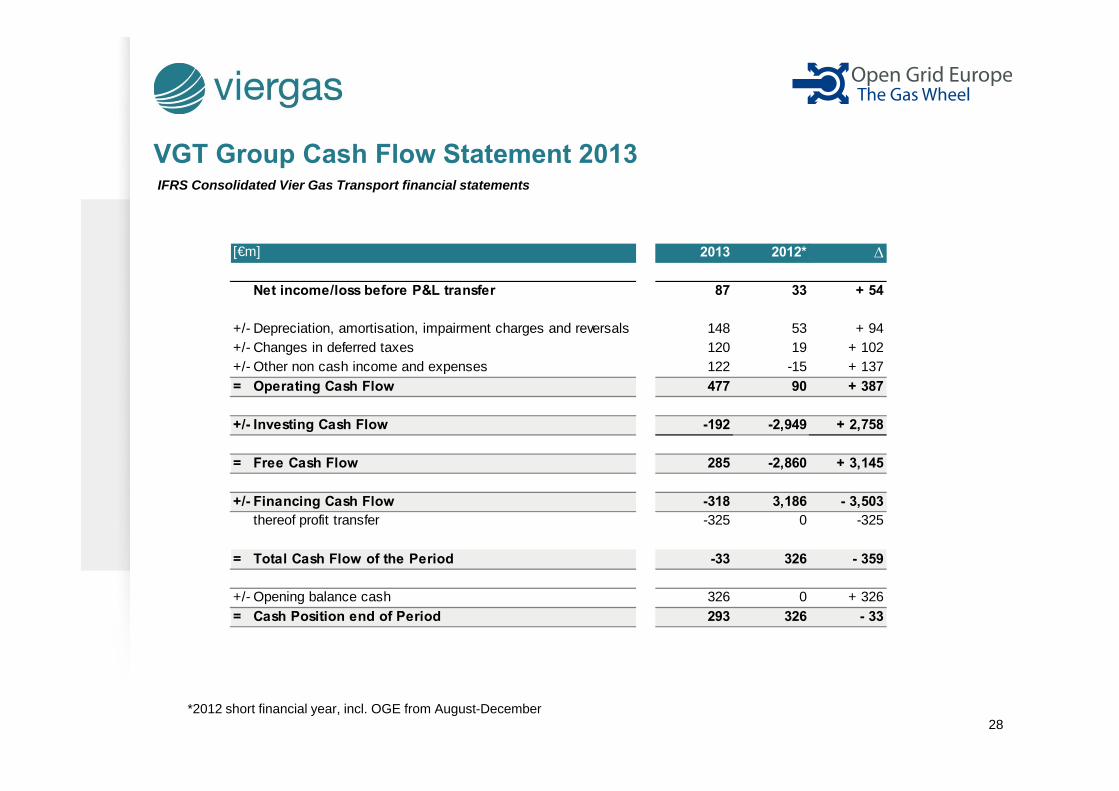
VGT Group Cash Flow Statement 2013
*2012 short financial year, incl. OGE from August-December
IFRS Consolidated Vier Gas Transport financial statements
Net income/loss before P&L transfer
+/- Depreciation, amortisation, impairment charges and reversals+/- Changes in deferred taxes+/- Other non cash income and expenses= Operating Cash Flow
+/- Investing Cash Flow
= Free Cash Flow
+/- Financing Cash Flowthereof profit transfer
= Total Cash Flow of the Period
+/- Opening balance cash= Cash Position end of Period
+ 94
[€m] 2013 2012* ∆
87 33 + 54
120 19 + 102122 -15 + 137
148 53
477 90 + 387
285 -2,860 + 3,145
-192 -2,949 + 2,758
-33 326 - 359
-318 3,186 - 3,503-325 -3250
293 326 - 33326 0 + 326
29
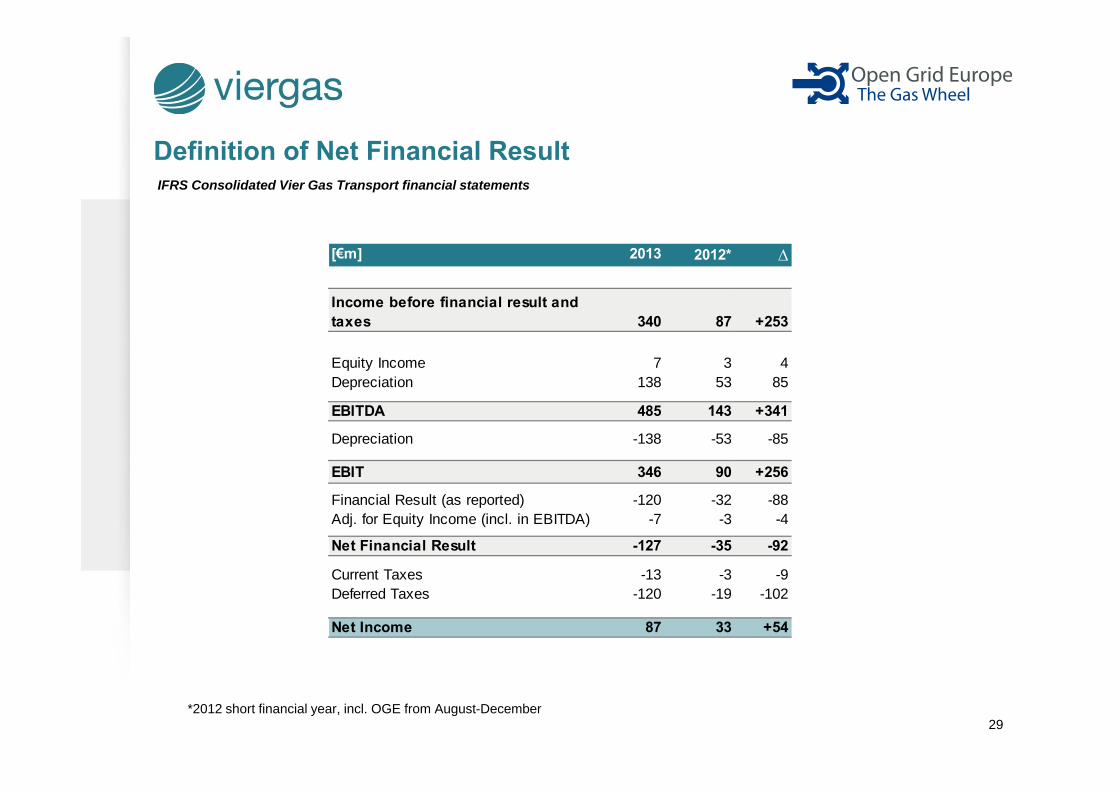
Definition of Net Financial ResultIFRS Consolidated Vier Gas Transport financial statements
[€m] 2013 2012* ∆
340 87 +253
Equity Income 7 3 4Depreciation 138 53 85
EBITDA 485 143 +341
Depreciation -138 -53 -85
EBIT 346 90 +256
Financial Result (as reported) -120 -32 -88Adj. for Equity Income (incl. in EBITDA) -7 -3 -4
Net Financial Result -127 -35 -92
Current Taxes -13 -3 -9Deferred Taxes -120 -19 -102
Net Income 87 33 +54
Income before financial result and taxes
*2012 short financial year, incl. OGE from August-December


![Transcript Analyst / Investor Conference Call [Company Update]](https://img.pdfslide.net/doc/110x75/577c7af71a28abe05496b6ec/transcript-analyst-investor-conference-call-company-update.jpg)


![Transcript of Investor Conference Call [Company Update]](https://img.pdfslide.net/doc/110x75/577c7baf1a28abe054982a4a/transcript-of-investor-conference-call-company-update.jpg)