Embed Size (px)
Citation preview

INVESTOR DAY
12 December 2017
Saint-Rémy-lès-Chevreuse

2
This document is strictly confidential. Any unauthorised access to, appropriation of,
copying, modification, use or disclosure thereof, in whole or in part, by any means, for
any purpose, infringes GTT’s rights. This document is part of GTT’s proprietary know-
how and may contain trade secrets protected worldwide by TRIPS and EU Directives
against their unlawful acquisition, use and disclosure. It is also protected by Copyright
law. The production, offering or placing on the market of, the importation, export or
storage of goods or services using GTT’s trade secrets or know-how is subject to GTT’s
prior written consent. Any violation of these obligations may give rise to civil or criminal
liability. © GTT, 2010-2017
Disclaimer

3
AGENDA
1. Introduction
Philippe Berterottière
2. Technologies: Mark V and Mark III Flex+
Frédérique Coeuille / Karim Chapot
3. LNG as Fuel
David Colson
4. M&A strategy
Philippe Berterottière / Marc Haestier
5. Conclusion
Philippe Berterottière

4
Introduction: market update Philippe Berterottière
1

5
2%
18%
43%
31%
15%
0%
10%
20%
30%
40%
50%
0
20
40
60
80
100
120
140
160
Japan S. Korea China India TOTALg
row
th
mtp
a
Jan-16 to Sept-16 Jan-17 to Sept-17 Growth YoY (rhs)
Asian LNG imports growing in 2017 vs. 2016 due to structural energy mix evolution
Main sources : National Custody Agencies and Ministries ; Wood Mackenzie
Demand of top-4 LNG importing
countries (60% of imports in
2016) grew by 15% in 2017 vs.
2016 (Jan to Sept. YoY), mainly
due to:
Coal to Gas switch, especially in
China due to environmental
considerations and LNG
competitiveness vs. coal
Lower nuclear restart, especially
in Japan due to social and legal
issues
Coal progressive slowdown in
China and South Korea
expected to strengthen in the
mid/long term
Top-4 LNG importers demand comparison 2017 vs. 2016

6
Break even
0
20 000
40 000
60 000
80 000
100 000
120 000
140 000
160 000D
ec 1
0Ja
n 1
1F
eb
11
Mar
11
Apr
11
May 1
1Ju
n 1
1Ju
l 11
Aug
11
Sep
11
Oct 11
No
v 1
1D
ec 1
1Ja
n 1
2F
eb
12
Mar
12
Apr
12
May 1
2Ju
n 1
2Ju
l 12
Aug
12
Sep
12
Oct 12
No
v 1
2D
ec 1
2Ja
n 1
3F
eb
13
Mar
13
Apr
13
May 1
3Ju
n 1
3Ju
l 13
Aug
13
Sep
13
Oct 13
No
v 1
3D
ec 1
3Ja
n 1
4F
eb
14
Mar
14
Apr
14
May 1
4Ju
n 1
4Ju
l 14
Aug
14
Sep
14
Oct 14
No
v 1
4D
ec 1
4Ja
n 1
5F
eb
15
Mar
15
Apr
15
May 1
5Ju
n 1
5Ju
l 15
Aug
15
Sep
15
Oct 15
No
v 1
5D
ec 1
5Ja
n 1
6F
eb
16
Mar
16
Apr
16
May 1
6Ju
n 1
6Ju
l 16
Aug
16
Sep
16
Oct 16
No
v 1
6D
ec 1
6Ja
n 1
7F
eb
17
Mar
17
Apr
17
May 1
7Ju
n 1
7Ju
l 17
Aug
17
Sep
17
Oct 17
No
v 1
7
$/d
D/TFDE 160k cbm Steam Turbine 145k cbm
Spot market recovering trend
Spot chart rates evolution since end-2010
Recovering trend since early-2016
Currently reaching levels not observed since 3 years; eventually above breakeven
Trend expected to continue as market is tightening with strong demand and new supply
beginning to come on stream (mainly from the US)
Source: Clarksons
74k$/j in early December 2017

7
5,5
6,0
6,5
7,0
7,5
8,0
8,5
9,0
9,5
10,0
40 45 50 55 60 65
LN
G p
rice -
$/M
btu
Oil price - $/b
US LNG competitiveness in Asia
US
LN
G f
ollo
win
g
Hen
ry H
ub
pri
ce
Asian LNG
2017 avg.
Asian LNG < US LNG US LNG < Asian LNG
Asian LNG < US LNG
US LNG vs. Asian LNG price depending on Henry Hub and Oil prices
2017 avg. : JCC = 53,3$/b and Henry Hub = 3,0$/Mbtu
US LNG ≈ 7.1$/Mbtu
Asian LNG ≈ 8.0$/Mbtu
US LNG:
• HH+15%
• Tolling Fee: 2.25$
• Shipping: 1.43$ (US East ->Japan,
174k cbm Me-GI or X-DF)
Assumptions
Asian LNG:
• Slope: 14% of JCC price
• Constant: 0.5$
Main sources: GTT analysis, EIA, Wood Mackenzie
Sp
rea
d
2016 avg.

8
Important new LNG volumes to hit the market in 2019 and 2020
0
10
20
30
40
50
60
70
80
90
2017 2018 2019 2020 2021 2022 2023
mtp
a
Cameroon GoFLNG
PETRONAS FLNG 2
Elba Island LNG Export
Coral FLNG
Prelude FLNG
Tangguh Phase 2
Freeport Train 3
Freeport Train 2
Sabine Pass Export Train 5
Cove Point Export
Freeport Train 1
Ichthys
Corpus Christi LNG
Cameron LNG Export
Yamal LNG
Contracted supply from liquefaction projects under construction
Main sources: GTT analysis, Wood Mackenzie
+12
mtpa
+31
mtpa
+25
mtpa
~ +70 Mtpa of contracted supply to come on stream by 2020
New ship orders to be placed from early 2018 to be delivered in late 2019 / early
2020

9
Overcapacity: 7 to 10 competitive LNGCs available on the market
36 36
17
10 7
22
5
1 2
1
13
13
4
4
1
0
10
20
30
40
50
60
70
80
Number of vessels of wich <30y of which ≥160k cbm of which no Steam Turbine of which BOR <0,11%/d
# L
NG
Cs
No charter / Spot Market Laid Up Idle LT Storage / Repairs Chart to finish end 2017
Main sources : GTT Analysis, Wood Mackenzie, Clarksons, IHS
Breakdown of the LNGCs currently available on the market
Competitive LNGCs
10
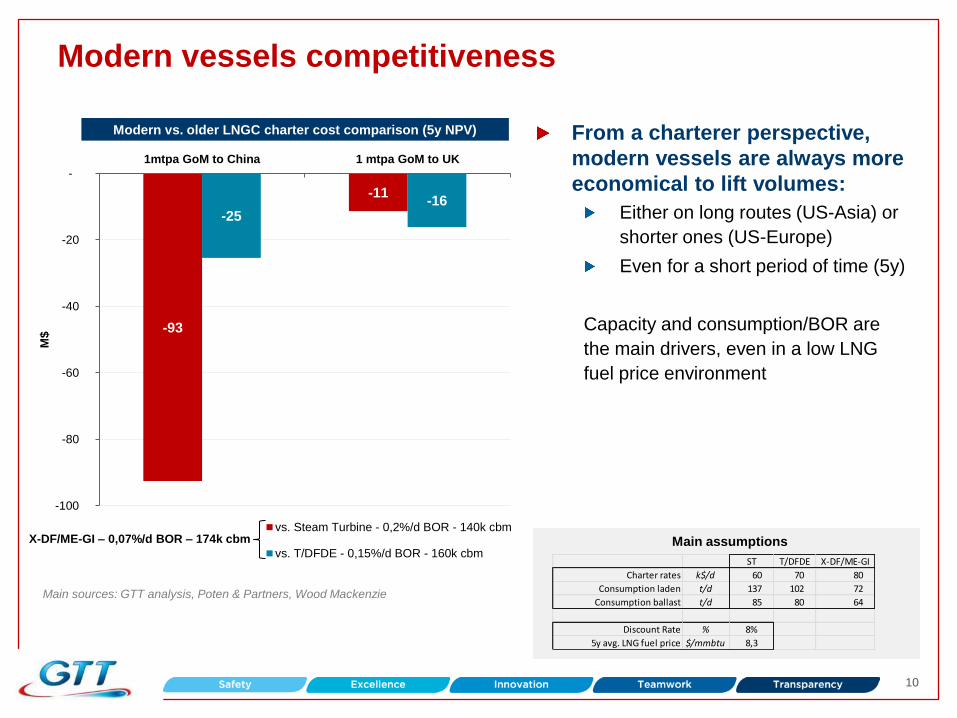
Modern vessels competitiveness
-93
-11
-25 -16
-100
-80
-60
-40
-20
-
1mtpa GoM to China 1 mtpa GoM to UK
M$
vs. Steam Turbine - 0,2%/d BOR - 140k cbm
vs. T/DFDE - 0,15%/d BOR - 160k cbm
X-DF/ME-GI – 0,07%/d BOR – 174k cbm
From a charterer perspective,
modern vessels are always more
economical to lift volumes:
Either on long routes (US-Asia) or
shorter ones (US-Europe)
Even for a short period of time (5y)
Capacity and consumption/BOR are
the main drivers, even in a low LNG
fuel price environment
Main sources: GTT analysis, Poten & Partners, Wood Mackenzie
Modern vs. older LNGC charter cost comparison (5y NPV)
Main assumptions
ST T/DFDE X-DF/ME-GI
Charter rates k$/d 60 70 80
Consumption laden t/d 137 102 72
Consumption ballast t/d 85 80 64
Discount Rate % 8%
5y avg. LNG fuel price $/mmbtu 8,3

11
LNGC supply & demand mismatch
0
20
40
60
80
100
120
140
160
LNGCs requirements for under-construction projects
Orderbook* Oversupply** Left to secure
# L
NG
Cs
– 1
74k e
qu
ivale
nt
LNGCs supply/demand balance for post-FID liquefaction projects
We believe that shipping market is short of LNGCs for liquefaction projects
currently under construction (post-FID)
Main sources : GTT analysis, Wood Mackenzie, Clarksons * Vessels on order for currently operational projects not to be counted
** Recent / Competitive vessels: ≥160k cbm, D/TFDE, <30 y.o.

12
FSRUs – The importing countries game changer is gaining momentum
Major competitive advantage vs. land-based
terminals:
Quick to build/deploy & mobile
Better local acceptability & easier permitting
Affordable / no upfront CapEx
Adapted to more volatile LNG prices
Quality controlled construction in shipyards with
available and skilled workforce
-
1
2
3
4
No. of countr
ies
FSRU FSU Conventional Source: Wood Mackenzie
Since 2008, more than half of new LNG importing countries
have chosen FSRUs instead of onshore terminals
FSRUs market outlook
Source: GasLog
More than 30 FSRUs currently
in service or under
construction
8 orders of FSRUs since
January 2017
11% of 2016 LNG imports
through FSRUs
Worldwide development
Asia (India, China, …)
Europe (Turkey, Croatia, …)
South & West Africa
LatAm & Carribeans
13
Summary
Since the beginning of 2017, the market is showing strong
recovery signs
Solid fundamentals to support this recovery in the short term
and accompany growth in the long term
Many LNGCs still expected in the short term
FSRU high dynamism will also support the LNG shipping
market

14
Mark V / Mark III Flex+ development update Frédérique Coeuille Karim Chapot
2

15
A system based on the Mark III concept A flexible metallic secondary membrane
Mark III primary membrane
R-PUF insulation panels, with thickness up to 480mm
Improved BOR compared to Mark III Flex : 0,07%
Mark V- quick reminder
HFC 245-fa
Optimized HFC 245-fa foams

16
R&D study – Mock-up
R&D mock-up (size 6,8 x 4,4m)
Mark III system without secondary
membrane
1m thick insulation

17
R&D study – Mock-up
Thermal loops developing through the insulation

18
Lessons learnt for Mark V system
Based on this mock-up
experience, complementary
investigations were launched
on Mark V design to secure
BOR guarantee and safety
Thermal assessment considering
potential convection inside insulation
spaces
Evaluation of void spaces
consequences inside corrugations &
between insulation panels

19
On-going Tests

20
Conclusion about Mark V
Mark V technology marketing on hold
During investigation for insulation panel convection
Internal convection tests & simulations are on-going
Objectives
Design & validate technical solutions to improve Mark V thermal behaviour
Improved solution both on thermal performance and cost effectiveness
Full scale tests for qualification

21
Main Characteristics of Mark III Flex+
480 mm thick insulation panels
Guaranteed BOR : 0,07%V / day
Benefitting from latest secondary barrier improvement
Already fitted on 6 vessels already delivered by SHI
Fatigue gain increased
by a factor of 10
Also supported by:
Strong technical background developed over the last 8 years
Return of experience on 47 vessels in operation and 22 vessels under
construction
Plywood
FSB
Add RSB
RSB

22
Class Approval
ABS : General Design Approval
(GDA) granted on 8th September 2017
LR : General Approval (GA) granted
on 23th October 2017
DNVGL : General Approval for Ship
Application (GASA) under progress
expected by end of 2017
BV : Design Approval (DA) under
progress expected by end of 2017

23
Conclusion about Mark III Flex+
Guaranteed BOR of 0.07%V/day
The system is based on well known and sea proven
components
The strong technical background shows:
Fatigue behaviour is enhanced by a factor of 10
Safety coefficient is increased by 75% in flexible secondary barrier

24
LNG as Fuel David Colson
3

25
LNG fuel focus – CMA CGM order
LNG integrated membrane tanks of 18,600 cbm
Space optimization
Designed for one bunkering operation per round trip
Mark III Flex (270 mm) technology for the fuel
storage system
Polyurethane Foam 130 kg/m3 and 210 kg/m3
Sea proven technology
Guaranteed Boil Off Gas
Maximal pressure: 700 mbarg
Flexibility to handle and store Boil Off Gas
Positive impact on global LNG demand
LNG Consumption of 300,000 tons per year
for the 9 vessels, i.e. eq. 0.1% of LNG global production
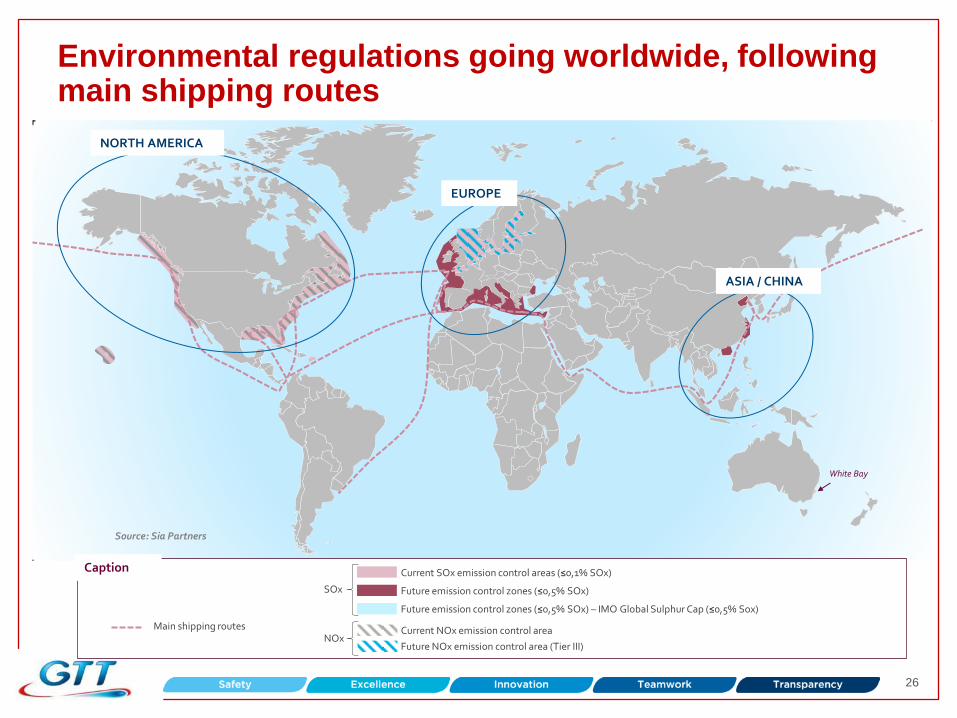
26
Environmental regulations going worldwide, following main shipping routes
White Bay
NORTH AMERICA
EUROPE
ASIA / CHINA
Source: Sia Partners
Main shipping routes
Current SOx emission control areas (≤0,1% SOx)
Future emission control zones (≤0,5% SOx)
Current NOx emission control area
Future emission control zones (≤0,5% SOx) – IMO Global Sulphur Cap (≤0,5% Sox)
Future NOx emission control area (Tier III) NOx
SOx
Caption

27
LNG offers key advantages in terms of OPEX and environmental performances
Low Sulfur Oil LNG
Scrubber
Environmental
performances Low Sulfur Oil LNG
OPEX - Fuel cost Low Sulfur Oil Scrubber LNG
OPEX - Maintenance Low Sulfur Oil Scrubber LNG
Relative attractiveness - +
Scrubber
Open-Loop
LNG is the major compliance options for shipowners
A shipowner has three main options to ensure compliance
Use Low Sulfur Oil (MDO/MGO, LSHFO) light investment but high fuel cost
Install a scrubber intermediate investment but O&M hurdles
Switch to LNG as fuel higher investment but lowest fuel cost
Noise pollution

28
LNG is the only solution allowing comprehensive environmental compliance
Pollutant Level HFO
(Heavy Fuel
Oil)
LS HFO (Low Sulfur
HFO)
ULS HFO (Ultra Low
Sulfur HFO)
MGO /
MDO1
(Marine
Gasoil/Diesel Oil)
Scrubber
+HFO LNG
SOx (Sulfur Oxides)
3,5%
0,5%
0,1%
NOx2
(Nitrogen Oxides)
Tier II
Tier III +EGR/SCR3 Except for
certain
engines
No Under condition Yes Compliance
LNG is the only mature solution directly compliant with all environmental
regulations
Implementation of NOx reduction in Northern Europe will degrade oil fuel’s and
Scrubber’s competitiveness
1) Only DMA and DMB class 2) Depends primarily on engine technology 3) EGR: Exhaust Gas Recirculation ; SCR: Selective Catalytic Reduction

29
Current LNG Fuel market situation
A recent market which has started with small ships and where Type C technology has been
preferred (tugs, ferries, PSV, … with LNG tanks up to several hundreds of m3)
Large vessel segment where GTT technologies is the most relevant is just emerging
(container ships, bulkers, … with several thousands of m3 and more)
0
500
1 000
1 500
2 000
2 500
3 000
3 500
4 000
Market avg ~750 cbm
Max
Min
Avg. Total LNG
tanks capacity
Source: DNV GL Notes: • Data available for ~70% of the 237 vessels • CMA-CGM order not counted in
Total LNG fuel tank by ship type (in service & on order)
cbm
CM
A-C
GM
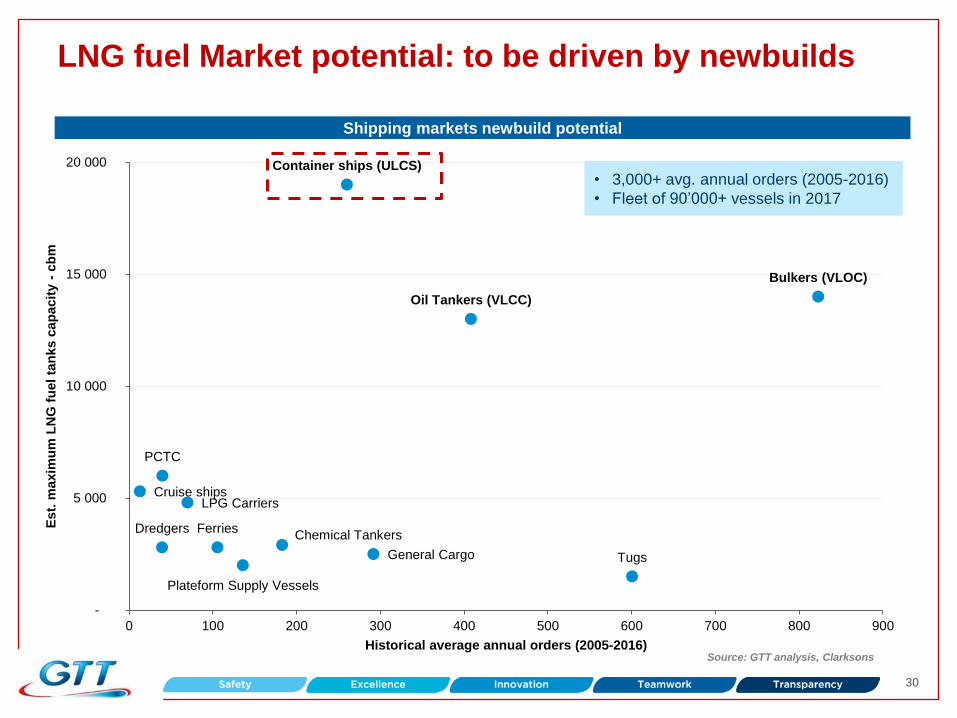
30
LNG fuel Market potential: to be driven by newbuilds
Cruise ships
Container ships (ULCS)
Ferries
PCTC
Tugs
LPG Carriers
Bulkers (VLOC)
Oil Tankers (VLCC)
Chemical Tankers
Plateform Supply Vessels
Dredgers
General Cargo
-
5 000
10 000
15 000
20 000
0 100 200 300 400 500 600 700 800 900
Est.
maxim
um
LN
G f
uel
tan
ks c
ap
acit
y -
cb
m
Historical average annual orders (2005-2016) Source: GTT analysis, Clarksons
Shipping markets newbuild potential
• 3,000+ avg. annual orders (2005-2016)
• Fleet of 90’000+ vessels in 2017

31
GTT LNG solutions offering
GTT has developed solutions for the main applications of LNG Fuel
Solutions for Container Vessels new
build and retrofit
Lean bunker barge to standardize the
market Cost effective solution for bulk carriers
Cruise Ship – optimizing the space for
additional passengers
A wide network of partnerships is being set up to benefit from these
various opportunities
32
Conclusion about LNG Fuel
GTT technologies for LNG Fuel have been validated by the
market
GTT focused on very large vessels
Expertise and services of GTT are key factors of success on
this market
GTT is working on the setting up of a wide partnership
network to accompany this development, as illustrated by the
cooperation agreement finalised recently with Wärtsilä
This market will represent a significant share of the LNG
market
33
M&A strategy Philippe Berterottière Marc Haestier
4

Ascenz transaction
Acquisition of 75% of the share capital from founders and
several investment funds
Founders to retain 25% of the share capital and continue to
manage the company
Funded in cash
No significant impact on GTT’s financial structure
Commercial and technical synergies
34

Ascenz is a dynamic EMS provider
Activities, markets & awards
Based in Singapore, founded in 2008
Provides remote fuel consumption and
bunkering monitoring solutions
Positioned on fast growing markets
Markets : Offshore Supply Vessels (OSV),
container ships, oil and crude carriers, bulk
carriers, bunker ships and gas carriers (target)
– 360+ ships equiped
Recipient of the 2016 Singapore « Enterprise
50 award » for local companies excelling in
their domain, Founders nominated as
Singapore’s EY Entrepreneurs of the year 2017
Track record in real time data acquisition for a
fleet of vessels

Ascenz’s business in brief
Installed fleet Business model & Strategy
Business Model
• 95% of sales on a non-recurring basis from systems installation
Strategy
1. Integrate further down the value chain with analytics / optimization modules
2. Transition to a service-based business model
3. Expand in EMEA starting 2017 and use ship management companies as a distribution channel
A complete smart solutions provider fitting ships with data collection and
analysis systems
(1) Total addressable market - Only ships of 20 year or less are considered
(2) Includes container ships, bulk carriers, oil tankers, crude ships and chemical carriers

Ascenz’ founders
• CEO since 2008
• 20 years of experience in technology and business management
‐ Previously founded an IT consultancy company in 1998
• Operational intelligence industry innovator
• Degrees:
- B.Sc. degree in Business Computing with Financial Management
University of Wales
- MBA
University of Southern Queensland
Chia Yoong Hui Founder, chairman, CEO &
shareholder
Sia Teck Chong Co-Founder, board member,
CTO & shareholder
• CTO since 2008: leads R&D and technical and services operations
• 15 years of experience in R&D in wireless mobile networks and wireless
communication between equipments
• Deep maritime industry expertise (Naval Senior Technical Specialist in the
Singapore Navy for 6 years)
• Degrees :
- Advanced Diploma in Information System Technology
Singapore Polytechnic
- Diploma in Electronics and Communication
Singapore Polytechnic

GTT’s strategic roadmap
Growth,
Technology,
Transformation Superior LNG
gas handling
systems
Advanced decision
support systems
Gas handling technologies
Fuel Gas handling system for vessels
Smart shipping
Framework service and
maintenance contract
(Shell Prelude)
Courtesy of Shell

Summary
Two strategic objectives
Consolidate GTT position on core business
Develop new growth areas
Means
Reinforce key internal competences
Operational or business agreements with partners
Acquisitions
39

40
Conclusion Philippe Berterottière
5
41
Q&A session

INVESTOR DAY
12 December 2017
Saint-Rémy-lès-Chevreuse