Embed Size (px)
Citation preview
Investor Education for
Credit Union Employees:
Survey Results for Wisconsin
J. Michael Collins, PhDAssistant Professor
Director, Center for Financial Security University of Wisconsin–Madison
ideas grow here
PO Box 2998
Madison, WI 53701-2998
Phone 608-665-8550
www.filene.org PUBLICATION #263 (3/12)
Research Brief
Copyright © 2012 by Filene Research Institute. All rights reserved.Printed in U.S.A.
Deeply embedded in the credit union tradition is an ongoing search for better ways to understand and serve credit union members. Open inquiry, the free flow of ideas, and debate are essential parts of the true democratic process.
The Filene Research Institute is a 501(c)(3) not-for-profit research organization dedicated to scientific and thoughtful analysis about issues affecting the future of consumer finance. Through indepen-dent research and innovation programs, the Institute examines issues vital to the future of credit unions.
Ideas grow through thoughtful and scientific analysis of top-priority consumer, public policy, and credit union competitive issues. Researchers are given considerable latitude in their exploration and studies of these high-priority issues.
Traditionally, the Filene Research Institute focuses on long-term research questions that can take months or years to research and pub-lish. Occasionally Filene also publishes Research or Innovation briefs. These briefs allow Filene to present important, time-sensitive, notori-ous, and unbiased topics to the credit union system. Oftentimes these briefs present an opportunity to distribute original research or innovation findings from Filene researchers or Fellows. We hope the “brief ” format meets your need to obtain actionable and objective information in a timely manner.
About Us

iii
We would like to thank the Center for Financial Security at the Uni-versity of Wisconsin–Madison for its generous support of this and other vital credit union research.
This project is funded by a grant from the Investor Protection Trust (IPT). Based in Washington, DC, the IPT is a nonprofit organiza-tion dedicated to investor education. Since 1993 the IPT has worked with the states to provide the independent, objective investor educa-tion needed by all Americans to make informed investment deci-sions. Visit the IPT at www.investorprotection.org.
Acknowledgments
iv
Ever since “promoting thrift” was codified as a core value in the Federal Credit Union Act of 1934, credit unions have been interested in ways to help members manage their money well. That task can extend from offering good and basic financial products all the way to offering complex financial advice and in-depth financial education.
Whereas financial education used to be easy to picture (think of a classroom, a teacher, maybe a workbook, and definitely some pamphlets), tools for reaching students have rapidly expanded. In an environment that increasingly relies on individuals to make their own financial plans, how effective is online learning?
What Is the Research About?In 2009 and 2010 researchers at the University of Wisconsin– Madison, in cooperation with the Wisconsin Credit Union League, administered a series of surveys followed by financial education modules to hundreds of employees at Wisconsin credit unions. The project is part of a larger experiment to see just how effective online education can be in improving financial knowledge and changing financial behavior. But not all financial education is created equal.
The researchers wanted to know whether a nine-part online educa-tion series—covering topics such as “Basics of Investing,” “Investing in Mutual Funds,” and “Working with Financial Advisors”—would lead to both sustained knowledge and changed behavior. Fifty-four percent of respondents reported some college, and the typical employee had between 5 and 10 years of employment experience. Most were married, and, interestingly, only 17% were male, which reflects the high proportion of women employed by credit unions.
And did the online education change knowledge and behavior? It did.
What Are the Credit Union Implications?For credit unions that want to promote thrift and make sure that employees throughout the organization help members make good financial decisions, this research is revealing. It’s particularly interest-ing for credit unions that want to emphasize investing and retirement services as part of their product offerings, because it shows credit union employees can make worthwhile knowledge gains on investing topics.
Not surprisingly, credit union employees scored quite well on ques-tions about interest and credit knowledge, especially compared to
Executive Summary and Commentary
by Ben Rogers,Research Director

v
their knowledge of stocks, bonds, and retirement investing. Their scores on interest and credit responses rose 3%–4% following the education modules. And scores among the same group rose 11% for knowledge of investing for retirement, 21% for knowledge of stocks and bonds, and 25% for knowledge of investor information available online.
More importantly, the research shows that the education corresponds to important improvements in financial behavior. Following the financial education courses, 8% of participants reported opening an individual retirement account (IRA), 6% reported establishing a written budget, and 5% each reported drafting a written financial plan and saving for three months of expenses.
More broadly, to the extent that credit union employees mirror ordinary members, this research supports the idea that remote learn-ing tools like online education can improve financial knowledge and lead to better financial behavior. That’s promising in a cultural environment that increasingly prizes on-demand information access and in which members may be less inclined to sit through traditional financial education. Granted, the time-intensive modules used in this research were given to users with some financial expertise, but if they can learn and show positive behavior changes, how much more effec-tive might similar education be for the average member?

vi
About the Author
J. Michael Collins, PhD
J. Michael Collins is faculty director of the Center for Financial Security at the University of Wisconsin–Madison. He teaches per-sonal finance and is a faculty affiliate of the Institute for Research on Poverty, the La Follette School of Public Affairs, and Wisconsin Cooperative Extension. Collins studies consumer decision mak-ing in the financial marketplace, including the role of public policy in influencing credit, savings, and investment choices. His work includes the study of financial literacy and counseling with a focus on low-income families. He is co–principal investigator of the Social Security Administration Financial Literacy Research Consortium site at Wisconsin, a multidisciplinary project focused on financial literacy for vulnerable populations. Collins brings nearly a decade of applied experience to his research. He founded PolicyLab Consulting Group, a research consulting firm that works with national foundations, and cofounded MortgageKeeper Referral Services, an online database for mortgage servicers and counselors. He also worked for Neighbor-Works America (Neighborhood Reinvestment Corporation) and the Millennial Housing Commission. He holds a master’s from the John F. Kennedy School of Government, a PhD from Cornell Uni-versity, and a BS from Miami University (Ohio).
1
IntroductionIn the spring of 2009, the Investor Protection Trust (IPT) funded the first of a series of projects titled the Investor Education in Your Workplace Program. The Wisconsin Credit Union League coor-dinated the program and subtitled the effort as “Real Progress and Pathways to Prosperity” (RP3). The goal of RP3 was to recruit credit unions in Wisconsin to enroll their employees in an online investor education program to see whether the education led to knowledge gains and behavior changes. Credit unions that took part in this project encouraged their employees to participate in the online RP3 education. The nine-module program, which was offered through the Educated Investor University (a component of the electronic library available from Precision Information LLC), took an average of 10 hours to complete and covered the following topics: (1) Get-ting Started on Investing, (2) Basics of Personal Finance, (3) Basics of Investing, (4) Basics of Investment Strategies, (5) Investment Risks, (6) Basics of Retirement Planning, (7) Investing in Mutual Funds, (8) Working with Financial Advisors, and (9) Saving for College.
Forty-five credit unions offered the online course to their employees either in the fall of 2009 or in the spring of 2010. Employees at the credit unions that offered the online investor education program in the fall constitute the treatment group. In turn, employees at the
credit unions that offered the program in the spring constitute the control group based on the assumption that employees’ investor knowledge and behav-ior are not related to a credit union’s assignment into the fall or spring cohort. Partici-
pants completed a 48-question survey concerning their self-assessed investor knowledge and self-reported investor behavior in October 2009, January 2010, and April 2010. These three surveys constitute Waves 1, 2, and 3 of the survey data. All participants completed the same surveys at the same point in time regardless of whether their employer offered the RP3 online investor education program in the fall or spring.
The treatment group, which again was made up of employees who received the RP3 offer in the fall of 2009, included 508 individuals who completed the initial survey in October. Due to nonresponse at follow-up, 323 members of the treatment group remained in the final dataset. Within the control group, 873 employees completed the initial survey in October, and 729 employees remained in the final dataset. Therefore, the total number of observations was 1,052. This report analyzes the intent to treat, meaning that employees
The nine-module program led to statistically significant improvements in employees’ self-assessed knowledge and self-reported behavior three months following the offer of online investor education.

2
in the treatment group who chose not to accept the RP3 offer are still counted as members of the treatment group in the statistical analyses, to avoid selection bias. With such high participation rates, however, the intent-to-treat estimates are quite similar to estimates of the treatment on the treated.
The statistical estimates of the effects of the RP3 program control for baseline differences between employees in the treatment and control groups that may have affected outcomes. Based on this research design, the results indicate that the offer of the nine-module program led to statistically significant improvements in employees’ self-assessed knowledge and self-reported behavior three months after the offer of online investor education. Another follow-up survey six months after the offer of the course indicated that the gains in employees’ investor literacy and behavior were sustained over time.
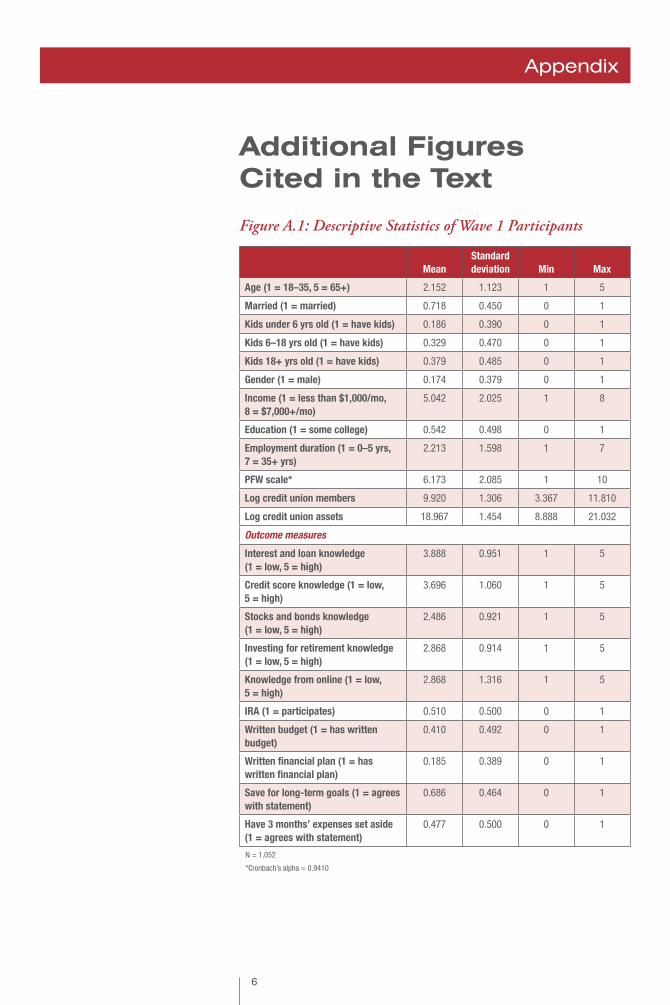
Who Participated?Figure A.1 in the appendix displays baseline (October 2009) charac-teristics for all participants. Most respondents (72%) were married. Nineteen percent of respondents had children under the age of 6, 33% had children ages 6–18, and 38% had adult children (age 18 or older). Only 17% of respondents were male, which reflects the high proportion of females employed by credit unions. Respondents earn about $4,000 each month, or $48,000 annually. Fifty-four percent of respondents reported some college. The typical employee had 5–10 years of employment experience.
A scale of personal financial well-being (PFW) derived from a scale developed by A. D. Prawitz et al. was also included in the surveys.1 The scale ranges from 0 to 10 and provides an estimate of individu-als’ financial stress and wellness. The average was 6.2 at baseline, which corresponds with moderate financial distress and moderate financial well-being.
The 10 outcome measures are listed at the bottom of Figure A.1, beginning with five questions related to investor knowledge followed by five questions on self-reported behavior. The self-assessed knowl-edge scores range from 1 to 5, where 5 is high and 1 is low. As might be expected for credit union employees, self-assessed knowledge of interest and loans and of credit scores was higher than self-assessed knowledge of stocks and bonds and investing for retirement. A mea-sure that asked employees to recall where they learned about investor issues is included as a gauge of their exposure to the online education program.
Self-reported behavior measures (IRA, written budget, written financial plan, save for long-term goals, and have three months’
3
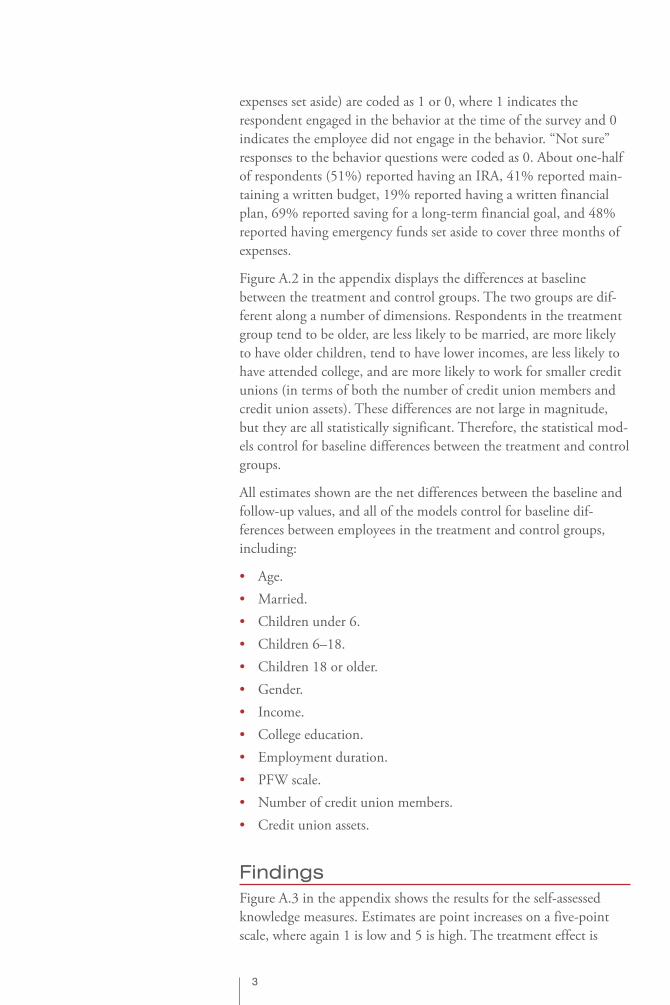
expenses set aside) are coded as 1 or 0, where 1 indicates the respondent engaged in the behavior at the time of the survey and 0 indicates the employee did not engage in the behavior. “Not sure” responses to the behavior questions were coded as 0. About one-half of respondents (51%) reported having an IRA, 41% reported main-taining a written budget, 19% reported having a written financial plan, 69% reported saving for a long-term financial goal, and 48% reported having emergency funds set aside to cover three months of expenses.
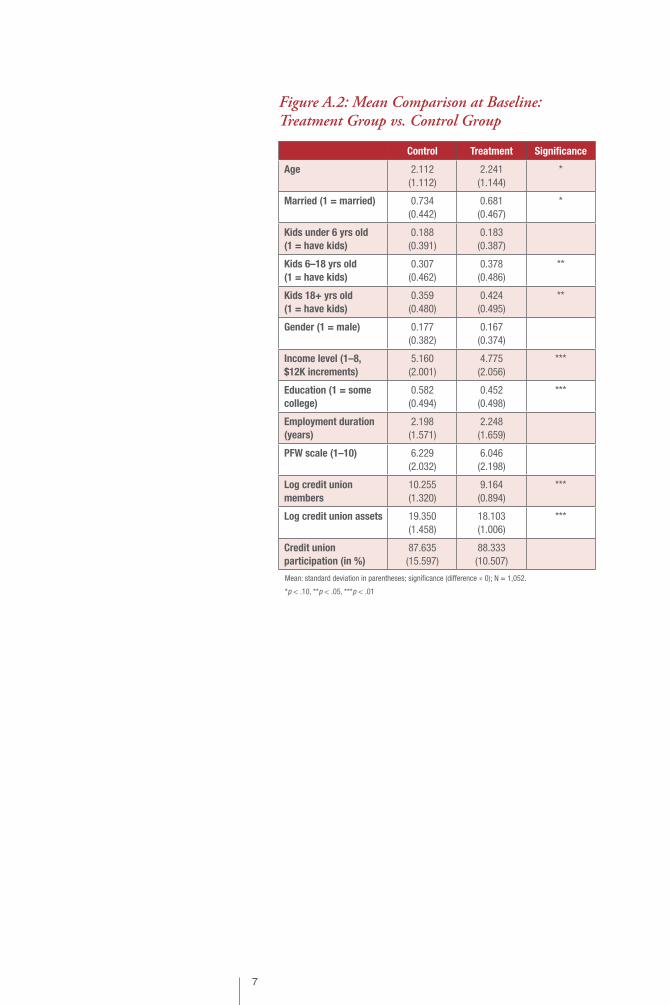
Figure A.2 in the appendix displays the differences at baseline between the treatment and control groups. The two groups are dif-ferent along a number of dimensions. Respondents in the treatment group tend to be older, are less likely to be married, are more likely to have older children, tend to have lower incomes, are less likely to have attended college, and are more likely to work for smaller credit unions (in terms of both the number of credit union members and credit union assets). These differences are not large in magnitude, but they are all statistically significant. Therefore, the statistical mod-els control for baseline differences between the treatment and control groups.
All estimates shown are the net differences between the baseline and follow-up values, and all of the models control for baseline dif-ferences between employees in the treatment and control groups, including:
• Age.• Married.• Children under 6.• Children 6–18.• Children 18 or older.• Gender.• Income.• College education.• Employment duration.• PFW scale.• Number of credit union members.• Credit union assets.
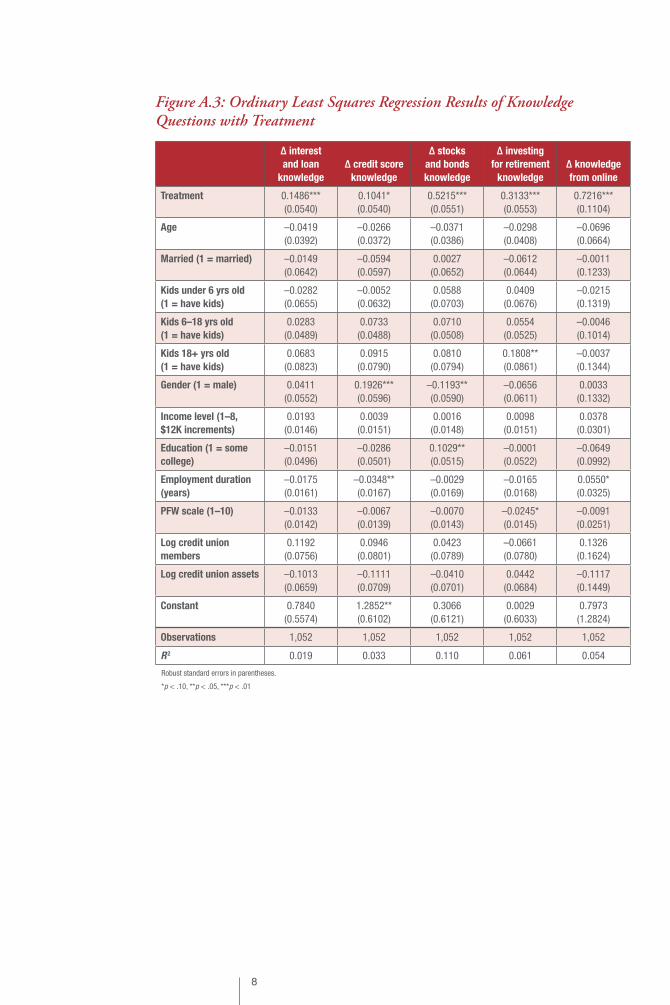
FindingsFigure A.3 in the appendix shows the results for the self-assessed knowledge measures. Estimates are point increases on a five-point scale, where again 1 is low and 5 is high. The treatment effect is
4
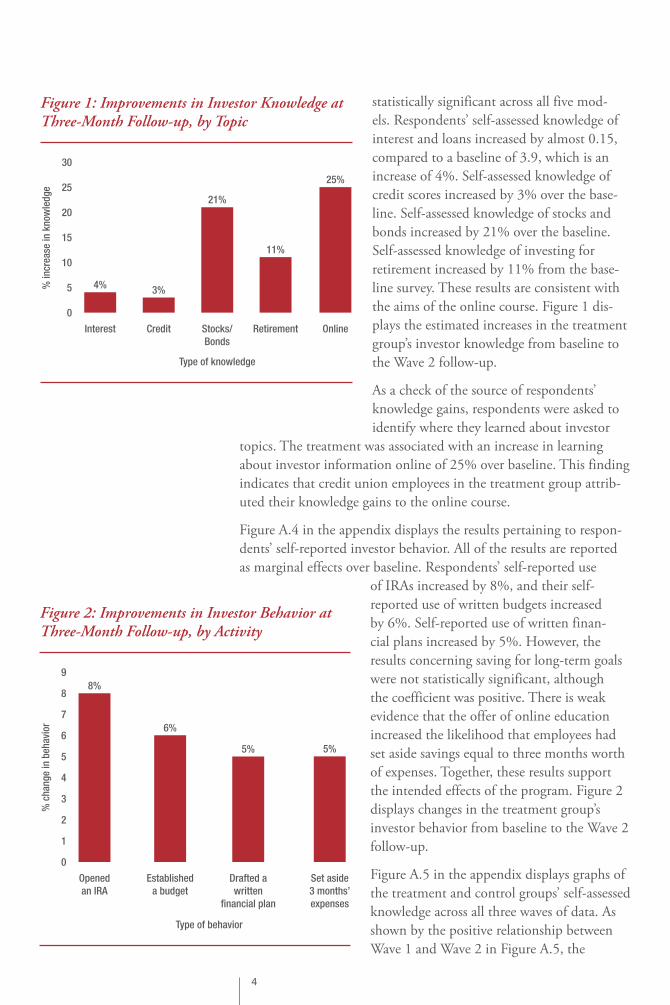
statistically significant across all five mod-els. Respondents’ self-assessed knowledge of interest and loans increased by almost 0.15, compared to a baseline of 3.9, which is an increase of 4%. Self-assessed knowledge of credit scores increased by 3% over the base-line. Self-assessed knowledge of stocks and bonds increased by 21% over the baseline. Self-assessed knowledge of investing for retirement increased by 11% from the base-line survey. These results are consistent with the aims of the online course. Figure 1 dis-plays the estimated increases in the treatment group’s investor knowledge from baseline to the Wave 2 follow-up.
As a check of the source of respondents’ knowledge gains, respondents were asked to identify where they learned about investor
topics. The treatment was associated with an increase in learning about investor information online of 25% over baseline. This finding indicates that credit union employees in the treatment group attrib-uted their knowledge gains to the online course.
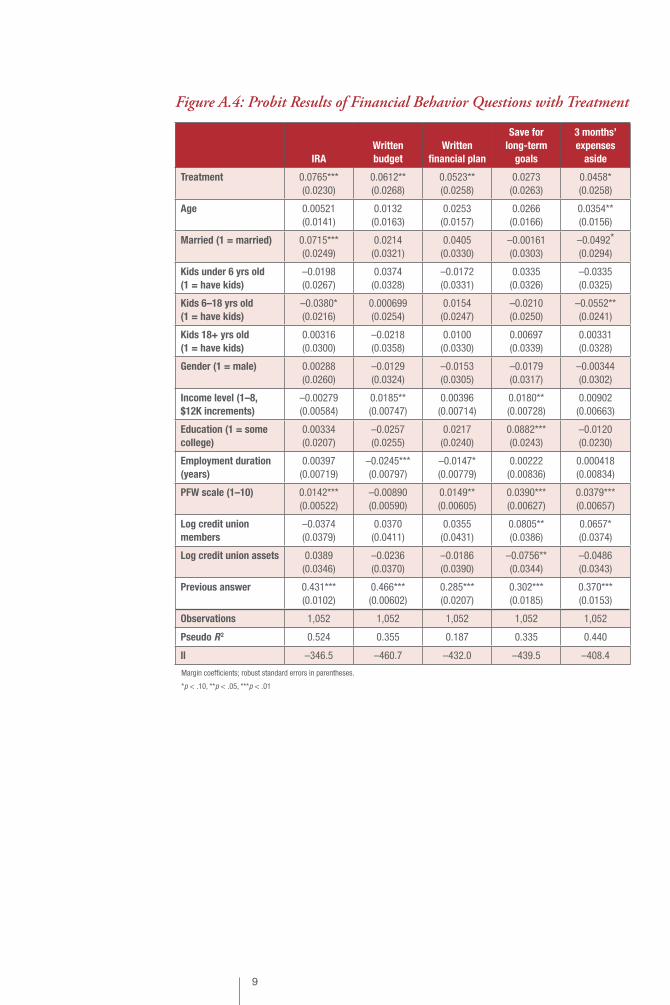
Figure A.4 in the appendix displays the results pertaining to respon-dents’ self-reported investor behavior. All of the results are reported as marginal effects over baseline. Respondents’ self-reported use
of IRAs increased by 8%, and their self-reported use of written budgets increased by 6%. Self-reported use of written finan-cial plans increased by 5%. However, the results concerning saving for long-term goals were not statistically significant, although the coefficient was positive. There is weak evidence that the offer of online education increased the likelihood that employees had set aside savings equal to three months worth of expenses. Together, these results support the intended effects of the program. Figure 2 displays changes in the treatment group’s investor behavior from baseline to the Wave 2 follow-up.
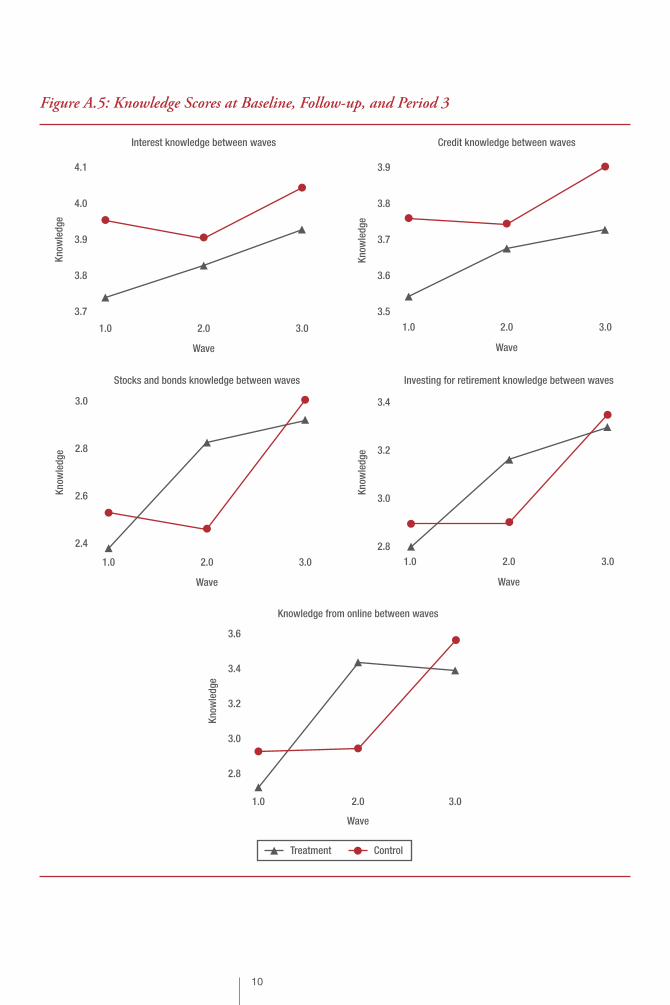
Figure A.5 in the appendix displays graphs of the treatment and control groups’ self-assessed knowledge across all three waves of data. As shown by the positive relationship between Wave 1 and Wave 2 in Figure A.5, the
0
5
10
15
20
25
30
4% 3%
21%
11%
25%
Interest Credit Stocks/Bonds
Retirement
Type of knowledge
% in
crea
se in
kno
wle
dge
Online
Figure 1: Improvements in Investor Knowledge at Three-Month Follow-up, by Topic
0
1
2
3
4
5
6
7
8
98%
Openedan IRA
6%
Establisheda budget
5%
Drafted awritten
�nancial plan
Type of behavior
% c
hang
e in
beh
avio
r
5%
Set aside3 months’expenses
Figure 2: Improvements in Investor Behavior at Three-Month Follow-up, by Activity
5
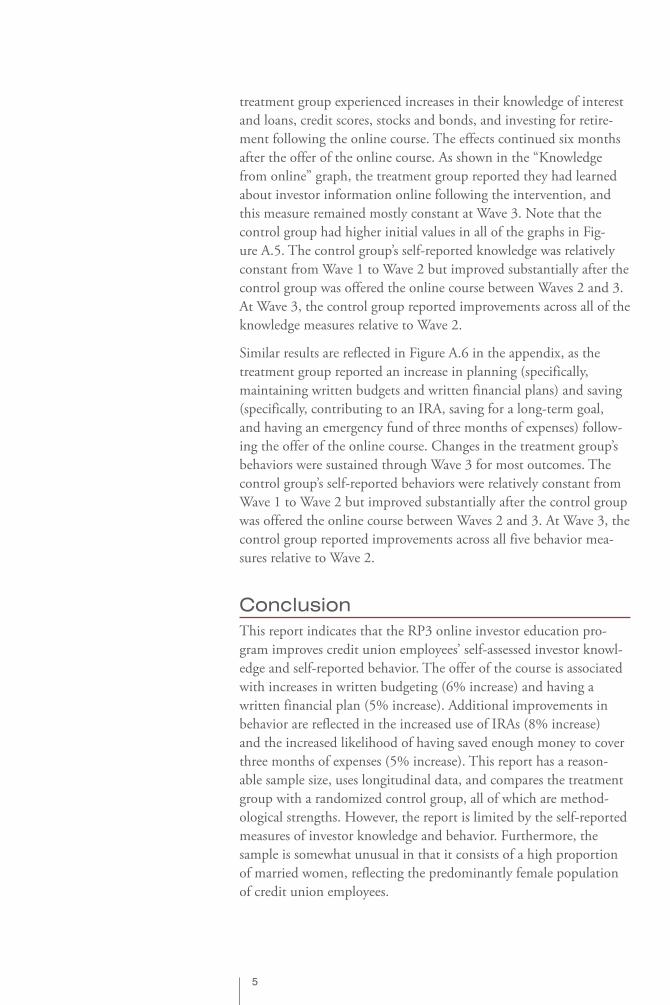
treatment group experienced increases in their knowledge of interest and loans, credit scores, stocks and bonds, and investing for retire-ment following the online course. The effects continued six months after the offer of the online course. As shown in the “Knowledge from online” graph, the treatment group reported they had learned about investor information online following the intervention, and this measure remained mostly constant at Wave 3. Note that the control group had higher initial values in all of the graphs in Fig-ure A.5. The control group’s self-reported knowledge was relatively constant from Wave 1 to Wave 2 but improved substantially after the control group was offered the online course between Waves 2 and 3. At Wave 3, the control group reported improvements across all of the knowledge measures relative to Wave 2.
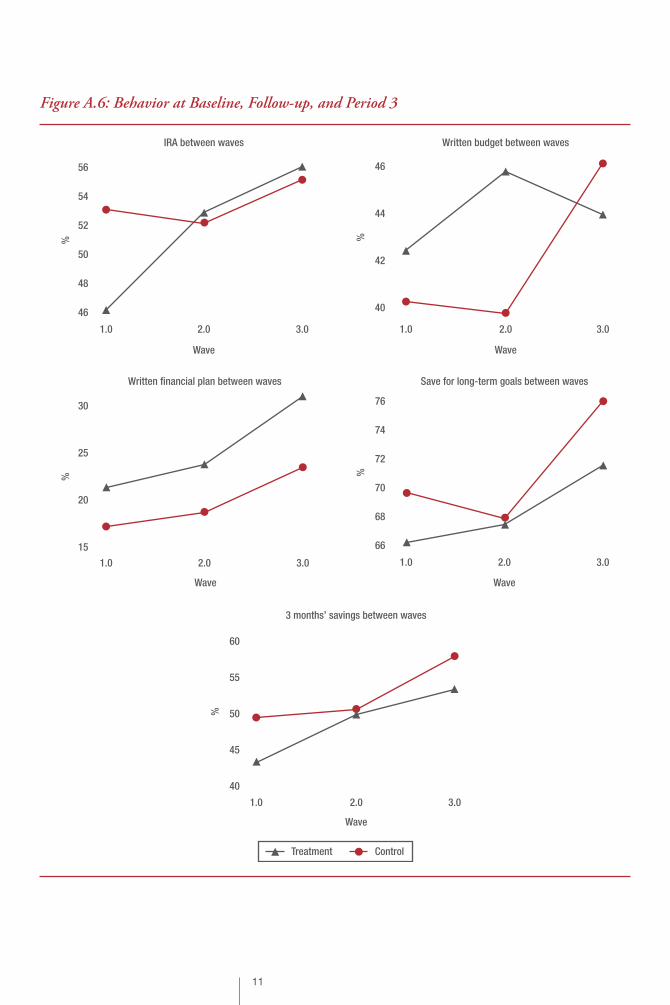
Similar results are reflected in Figure A.6 in the appendix, as the treatment group reported an increase in planning (specifically, maintaining written budgets and written financial plans) and saving (specifically, contributing to an IRA, saving for a long-term goal, and having an emergency fund of three months of expenses) follow-ing the offer of the online course. Changes in the treatment group’s behaviors were sustained through Wave 3 for most outcomes. The control group’s self-reported behaviors were relatively constant from Wave 1 to Wave 2 but improved substantially after the control group was offered the online course between Waves 2 and 3. At Wave 3, the control group reported improvements across all five behavior mea-sures relative to Wave 2.
ConclusionThis report indicates that the RP3 online investor education pro-gram improves credit union employees’ self-assessed investor knowl-edge and self-reported behavior. The offer of the course is associated with increases in written budgeting (6% increase) and having a written financial plan (5% increase). Additional improvements in behavior are reflected in the increased use of IRAs (8% increase) and the increased likelihood of having saved enough money to cover three months of expenses (5% increase). This report has a reason-able sample size, uses longitudinal data, and compares the treatment group with a randomized control group, all of which are method-ological strengths. However, the report is limited by the self-reported measures of investor knowledge and behavior. Furthermore, the sample is somewhat unusual in that it consists of a high proportion of married women, reflecting the predominantly female population of credit union employees.
6
Appendix
Additional Figures Cited in the Text
Figure A.1: Descriptive Statistics of Wave 1 Participants
MeanStandard deviation Min Max
Age (1 = 18–35, 5 = 65+) 2.152 1.123 1 5
Married (1 = married) 0.718 0.450 0 1
Kids under 6 yrs old (1 = have kids) 0.186 0.390 0 1
Kids 6–18 yrs old (1 = have kids) 0.329 0.470 0 1
Kids 18+ yrs old (1 = have kids) 0.379 0.485 0 1
Gender (1 = male) 0.174 0.379 0 1
Income (1 = less than $1,000/mo, 8 = $7,000+/mo)
5.042 2.025 1 8
Education (1 = some college) 0.542 0.498 0 1
Employment duration (1 = 0–5 yrs, 7 = 35+ yrs)
2.213 1.598 1 7
PFW scale* 6.173 2.085 1 10
Log credit union members 9.920 1.306 3.367 11.810
Log credit union assets 18.967 1.454 8.888 21.032
Outcome measures
Interest and loan knowledge (1 = low, 5 = high)
3.888 0.951 1 5
Credit score knowledge (1 = low, 5 = high)
3.696 1.060 1 5
Stocks and bonds knowledge (1 = low, 5 = high)
2.486 0.921 1 5
Investing for retirement knowledge (1 = low, 5 = high)
2.868 0.914 1 5
Knowledge from online (1 = low, 5 = high)
2.868 1.316 1 5
IRA (1 = participates) 0.510 0.500 0 1
Written budget (1 = has written budget)
0.410 0.492 0 1
Written financial plan (1 = has written financial plan)
0.185 0.389 0 1
Save for long-term goals (1 = agrees with statement)
0.686 0.464 0 1
Have 3 months’ expenses set aside (1 = agrees with statement)
0.477 0.500 0 1
N = 1,052
*Cronbach’s alpha = 0.9410
7
Figure A.2: Mean Comparison at Baseline: Treatment Group vs. Control Group
Control Treatment Significance
Age 2.112(1.112)
2.241(1.144)
*
Married (1 = married) 0.734(0.442)
0.681(0.467)
*
Kids under 6 yrs old (1 = have kids)
0.188(0.391)
0.183(0.387)
Kids 6–18 yrs old (1 = have kids)
0.307(0.462)
0.378(0.486)
**
Kids 18+ yrs old (1 = have kids)
0.359(0.480)
0.424(0.495)
**
Gender (1 = male) 0.177(0.382)
0.167(0.374)
Income level (1–8, $12K increments)
5.160(2.001)
4.775(2.056)
***
Education (1 = some college)
0.582(0.494)
0.452(0.498)
***
Employment duration (years)
2.198(1.571)
2.248(1.659)
PFW scale (1–10) 6.229(2.032)
6.046(2.198)
Log credit union members
10.255(1.320)
9.164(0.894)
***
Log credit union assets 19.350(1.458)
18.103(1.006)
***
Credit union participation (in %)
87.635(15.597)
88.333(10.507)
Mean: standard deviation in parentheses; significance (difference ≠ 0); N = 1,052.
*p < .10, **p < .05, ***p < .01
8
Figure A.3: Ordinary Least Squares Regression Results of Knowledge Questions with Treatment
∆ interest and loan
knowledge∆ credit score
knowledge
∆ stocks and bonds knowledge
∆ investing for retirement
knowledge∆ knowledge from online
Treatment 0.1486***(0.0540)
0.1041*(0.0540)
0.5215***(0.0551)
0.3133***(0.0553)
0.7216***(0.1104)
Age –0.0419(0.0392)
–0.0266(0.0372)
–0.0371(0.0386)
–0.0298(0.0408)
–0.0696(0.0664)
Married (1 = married) –0.0149(0.0642)
–0.0594(0.0597)
0.0027(0.0652)
–0.0612(0.0644)
–0.0011(0.1233)
Kids under 6 yrs old (1 = have kids)
–0.0282(0.0655)
–0.0052(0.0632)
0.0588(0.0703)
0.0409(0.0676)
–0.0215(0.1319)
Kids 6–18 yrs old (1 = have kids)
0.0283(0.0489)
0.0733(0.0488)
0.0710(0.0508)
0.0554(0.0525)
–0.0046(0.1014)
Kids 18+ yrs old (1 = have kids)
0.0683(0.0823)
0.0915(0.0790)
0.0810(0.0794)
0.1808**(0.0861)
–0.0037(0.1344)
Gender (1 = male) 0.0411(0.0552)
0.1926***(0.0596)
–0.1193**(0.0590)
–0.0656(0.0611)
0.0033(0.1332)
Income level (1–8, $12K increments)
0.0193(0.0146)
0.0039(0.0151)
0.0016(0.0148)
0.0098(0.0151)
0.0378(0.0301)
Education (1 = some college)
–0.0151(0.0496)
–0.0286(0.0501)
0.1029**(0.0515)
–0.0001(0.0522)
–0.0649(0.0992)
Employment duration (years)
–0.0175(0.0161)
–0.0348**(0.0167)
–0.0029(0.0169)
–0.0165(0.0168)
0.0550*(0.0325)
PFW scale (1–10) –0.0133(0.0142)
–0.0067(0.0139)
–0.0070(0.0143)
–0.0245*(0.0145)
–0.0091(0.0251)
Log credit union members
0.1192(0.0756)
0.0946(0.0801)
0.0423(0.0789)
–0.0661(0.0780)
0.1326(0.1624)
Log credit union assets –0.1013(0.0659)
–0.1111(0.0709)
–0.0410(0.0701)
0.0442(0.0684)
–0.1117(0.1449)
Constant 0.7840(0.5574)
1.2852**(0.6102)
0.3066(0.6121)
0.0029(0.6033)
0.7973(1.2824)
Observations 1,052 1,052 1,052 1,052 1,052
R2 0.019 0.033 0.110 0.061 0.054
Robust standard errors in parentheses.
*p < .10, **p < .05, ***p < .01
9
Figure A.4: Probit Results of Financial Behavior Questions with Treatment
IRAWritten budget
Written financial plan
Save for long-term
goals
3 months’ expenses
aside
Treatment 0.0765***(0.0230)
0.0612**(0.0268)
0.0523**(0.0258)
0.0273(0.0263)
0.0458*(0.0258)
Age 0.00521(0.0141)
0.0132(0.0163)
0.0253(0.0157)
0.0266(0.0166)
0.0354**(0.0156)
Married (1 = married) 0.0715***(0.0249)
0.0214(0.0321)
0.0405(0.0330)
–0.00161(0.0303)
–0.0492*
(0.0294)
Kids under 6 yrs old (1 = have kids)
–0.0198(0.0267)
0.0374(0.0328)
–0.0172(0.0331)
0.0335(0.0326)
–0.0335(0.0325)
Kids 6–18 yrs old (1 = have kids)
–0.0380*(0.0216)
0.000699(0.0254)
0.0154(0.0247)
–0.0210(0.0250)
–0.0552**(0.0241)
Kids 18+ yrs old (1 = have kids)
0.00316(0.0300)
–0.0218(0.0358)
0.0100(0.0330)
0.00697(0.0339)
0.00331(0.0328)
Gender (1 = male) 0.00288(0.0260)
–0.0129(0.0324)
–0.0153(0.0305)
–0.0179(0.0317)
–0.00344(0.0302)
Income level (1–8, $12K increments)
–0.00279(0.00584)
0.0185**(0.00747)
0.00396(0.00714)
0.0180**(0.00728)
0.00902(0.00663)
Education (1 = some college)
0.00334(0.0207)
–0.0257(0.0255)
0.0217(0.0240)
0.0882***(0.0243)
–0.0120(0.0230)
Employment duration (years)
0.00397(0.00719)
–0.0245***(0.00797)
–0.0147*(0.00779)
0.00222(0.00836)
0.000418(0.00834)
PFW scale (1–10) 0.0142***(0.00522)
–0.00890(0.00590)
0.0149**(0.00605)
0.0390***(0.00627)
0.0379***(0.00657)
Log credit union members
–0.0374(0.0379)
0.0370(0.0411)
0.0355(0.0431)
0.0805**(0.0386)
0.0657*(0.0374)
Log credit union assets 0.0389(0.0346)
–0.0236(0.0370)
–0.0186(0.0390)
–0.0756**(0.0344)
–0.0486(0.0343)
Previous answer 0.431***(0.0102)
0.466***(0.00602)
0.285***(0.0207)
0.302***(0.0185)
0.370***(0.0153)
Observations 1,052 1,052 1,052 1,052 1,052
Pseudo R2 0.524 0.355 0.187 0.335 0.440
ll –346.5 –460.7 –432.0 –439.5 –408.4
Margin coefficients; robust standard errors in parentheses.
*p < .10, **p < .05, ***p < .01
10
Know
ledg
e
3.8
3.9
4.0
3.7
1.0 2.0 3.0
4.1
Interest knowledge between waves
Wave
Credit knowledge between waves
WaveKn
owle
dge
1.0 2.0 3.0
3.6
3.7
3.8
3.5
3.9
Know
ledg
e
Investing for retirement knowledge between waves
Wave
1.0 2.0 3.0
3.0
3.2
2.8
3.4
Know
ledg
e
Knowledge from online between waves
Wave
1.0 2.0 3.0
3.0
3.2
2.8
3.6
3.4
Treatment Control
Know
ledg
e
2.6
2.8
2.4
1.0 2.0 3.0
3.0
Stocks and bonds knowledge between waves
Wave
Figure A.5: Knowledge Scores at Baseline, Follow-up, and Period 3
11
Treatment Control
%
1.0 2.0 3.0
45
50
40
60
55
3 months’ savings between waves
Wave
%
1.0 2.0 3.0
48
50
46
56
54
52
IRA between waves
Wave%
1.0 2.0 3.0
42
44
40
46
Written budget between waves
Wave
%
1.0 2.0 3.0
20
25
15
30
Written �nancial plan between waves
Wave
%
1.0 2.0 3.0
68
72
66
76
74
70
Save for long-term goals between waves
Wave
Figure A.6: Behavior at Baseline, Follow-up, and Period 3

12
Endnote
1. A. D. Prawitz, E. T. Garman, B. Sorhaindo, B. O’Neill, J. Kim, and P. Drentea, “InCharge Financial Distress/Financial Well-Being Scale: Development, Administration, and Score Interpre-tation,” Journal of Financial Counseling and Planning 17, no. 1 (2006): 34–50.

Investor Education for
Credit Union Employees:
Survey Results for Wisconsin
J. Michael Collins, PhDAssistant Professor
Director, Center for Financial Security University of Wisconsin–Madison
ideas grow here
PO Box 2998
Madison, WI 53701-2998
Phone 608-665-8550
www.filene.org PUBLICATION #263 (3/12)
Research Brief