Embed Size (px)
Citation preview
›Investor Presentation›June 2018
Forward-looking statementsReference in this presentation, and hereafter, to the “Company” or to “SNC-Lavalin” means, as the context may require, SNC-Lavalin Group Inc. and all or some ofits subsidiaries or joint arrangements, or SNC-Lavalin Group Inc. or one or more of its subsidiaries or joint arrangements.
Statements made in this presentation that describe the Company’s or management’s budgets, estimates, expectations, forecasts, objectives, predictions,projections of the future or strategies may be “forward-looking statements”, which can be identified by the use of the conditional or forward-looking terminology suchas “aims”, “anticipates”, “assumes”, “believes”, “cost savings”, “estimates”, “expects”, “goal”, “intends”, “may”, “plans”, “projects”, “target”, “should”, “synergies”,“vision”, “will”, or the negative thereof or other variations thereon. Forward-looking statements also include any other statements that do not refer to historical facts.Forward-looking statements also include statements relating to the following: (i) future capital expenditures, revenues, expenses, earnings, economic performance,indebtedness, financial condition, losses and future prospects; and (ii) business and management strategies and the expansion and growth of the Company’soperations. All such forward-looking statements are made pursuant to the “safe-harbour” provisions of applicable Canadian securities laws. The Company cautionsthat, by their nature, forward-looking statements involve risks and uncertainties, and that its actual actions and/or results could differ materially from thoseexpressed or implied in such forward-looking statements, or could affect the extent to which a particular projection materializes. Forward-looking statements arepresented for the purpose of assisting investors and others in understanding certain key elements of the Company’s current objectives, strategic priorities,expectations and plans, and in obtaining a better understanding of the Company’s business and anticipated operating environment. Readers are cautioned thatsuch information may not be appropriate for other purposes.
Forward-looking statements made in this presentation are based on a number of assumptions believed by the Company to be reasonable as at the date hereof.The assumptions are set out throughout the Company’s 2017 Management Discussion and Analysis (MD&A) and as updated in the first quarter 2018 MD&A. The2018 outlook also assumes that the federal charges laid against the Company and its indirect subsidiaries SNC-Lavalin International Inc. and SNC-LavalinConstruction Inc. on February 19, 2015, will not have a significant adverse impact on the Company’s business in 2018. If these assumptions are inaccurate, theCompany’s actual results could differ materially from those expressed or implied in such forward-looking statements. In addition, important risk factors could causethe Company’s assumptions and estimates to be inaccurate and actual results or events to differ materially from those expressed in or implied by these forward-looking statements. These risk factors are set out in the Company’s 2017 MD&A and as updated in the first quarter 2018 MD&A.
The 2018 outlook referred to in this presentation is forward-looking information and is based on the methodology described in the Company’s 2017 MD&A underthe heading “How We Budget and Forecast Our Results” and is subject to the risks and uncertainties described in the Company’s public disclosure documents. Thepurpose of the 2018 outlook is to provide the reader with an indication of management’s expectations, at the date of this presentation, regarding the Company’sfuture financial performance and readers are cautioned that this information may not be appropriate for other purposes.
Non-IFRS financial measures and additional IFRS measuresThe Company reports its financial results in accordance with IFRS. However, the following non-IFRS measures and additional IFRS measures are used by theCompany: Adjusted net income from E&C, Adjusted diluted EPS from E&C, Adjusted net income from Capital, Adjusted diluted EPS from Capital, Adjustedconsolidated diluted EPS, EBITDA, Adjusted E&C EBITDA, Segment EBIT and Revenue backlog. Additional details for these non-IFRS measures and additionalmeasures can be found below and in SNC-Lavalin’s MD&A, which is available in the Investors section of the Company’s website at www.snclavalin.com. Non-IFRSfinancial measures do not have any standardized meaning under IFRS and therefore may not be comparable to similar measures presented by other issuers.Management believes that, in addition to conventional measures prepared in accordance with IFRS, these non-IFRS measures provide additional insight into theCompany’s financial results and certain investors may use this information to evaluate the Company’s performance from period to period. However, these non-IFRSfinancial measures have limitations and should not be considered in isolation or as a substitute for measures of performance prepared in accordance with IFRS.
2
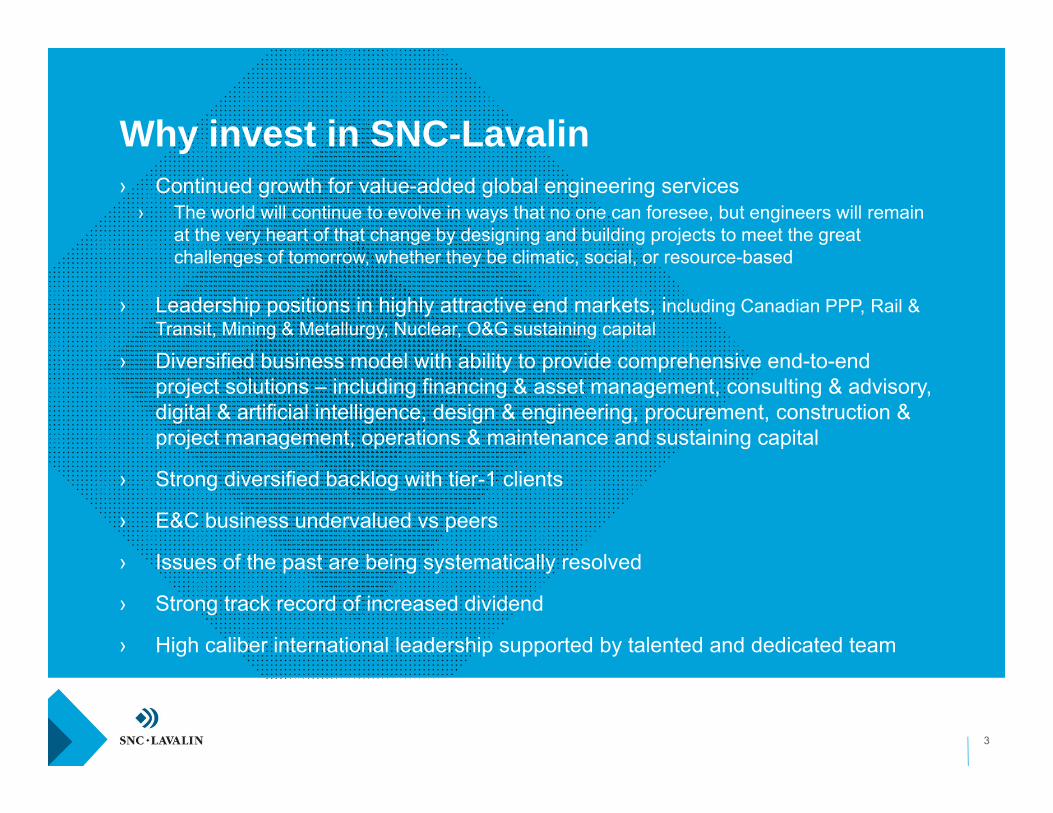
Why invest in SNC-Lavalin
3
› Continued growth for value-added global engineering services› The world will continue to evolve in ways that no one can foresee, but engineers will remain
at the very heart of that change by designing and building projects to meet the great challenges of tomorrow, whether they be climatic, social, or resource-based
› Leadership positions in highly attractive end markets, including Canadian PPP, Rail & Transit, Mining & Metallurgy, Nuclear, O&G sustaining capital
› Diversified business model with ability to provide comprehensive end-to-end project solutions – including financing & asset management, consulting & advisory, digital & artificial intelligence, design & engineering, procurement, construction & project management, operations & maintenance and sustaining capital
› Strong diversified backlog with tier-1 clients
› E&C business undervalued vs peers
› Issues of the past are being systematically resolved
› Strong track record of increased dividend
› High caliber international leadership supported by talented and dedicated team
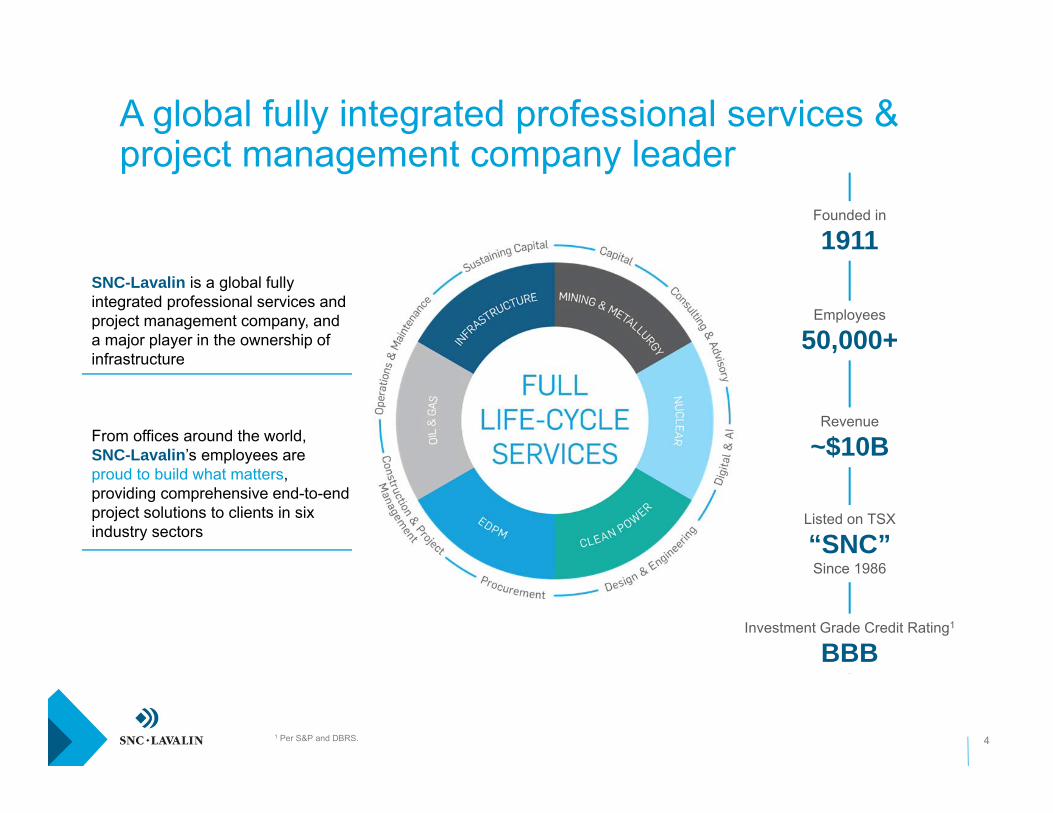
A global fully integrated professional services & project management company leader
4
SNC-Lavalin is a global fully integrated professional services and project management company, and a major player in the ownership of infrastructure
From offices around the world,SNC-Lavalin’s employees are proud to build what matters, providing comprehensive end-to-end project solutions to clients in six industry sectors
Founded in
1911
Employees
50,000+
Revenue
~$10B
Listed on TSX
“SNC”Since 1986
Investment Grade Credit Rating1
BBB
1 Per S&P and DBRS.
52%
23%
14%
11%
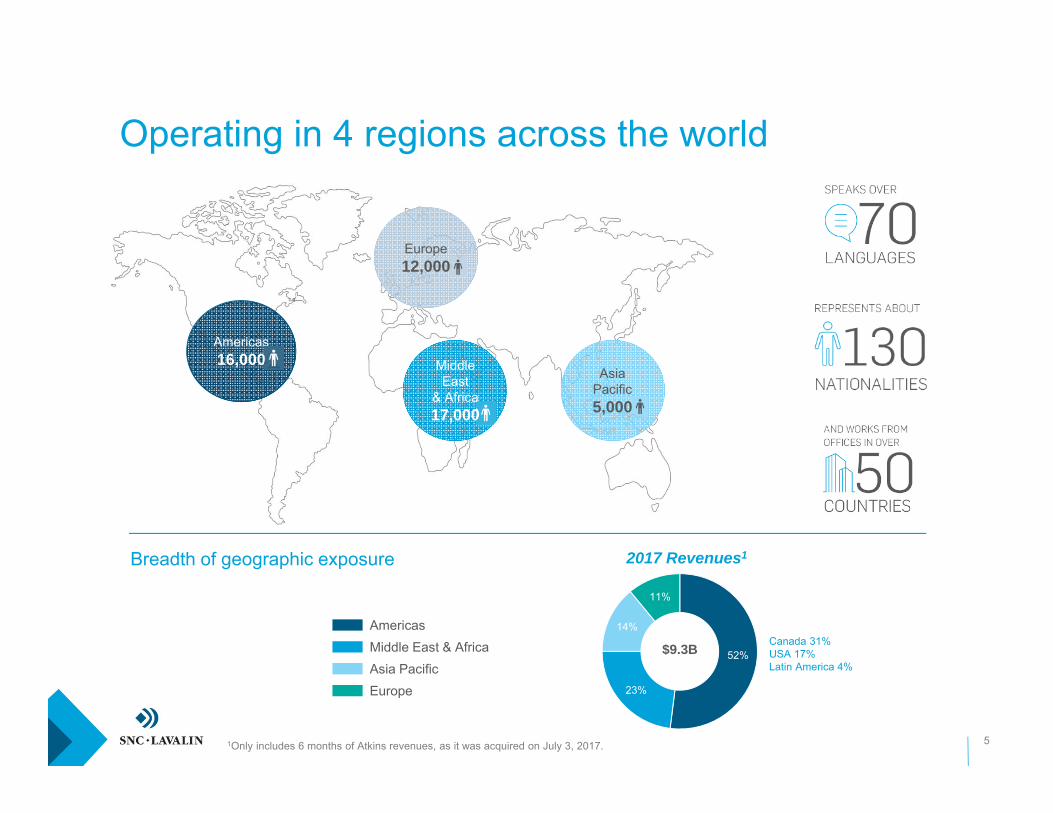
Operating in 4 regions across the world
5
Breadth of geographic exposure
Americas16,000
Europe12,000
Asia Pacific5,000
Middle East
& Africa17,000
2017 Revenues1
$9.3B
Americas Middle East & AfricaAsia PacificEurope
1Only includes 6 months of Atkins revenues, as it was acquired on July 3, 2017.
Canada 31%USA 17%Latin America 4%
26%
19%32%
10%
3%5% 2%3%
Nuclear
EDPM
Clean Power
37%
21%
18%
8%
5%4%
4% 3%
Nuclear
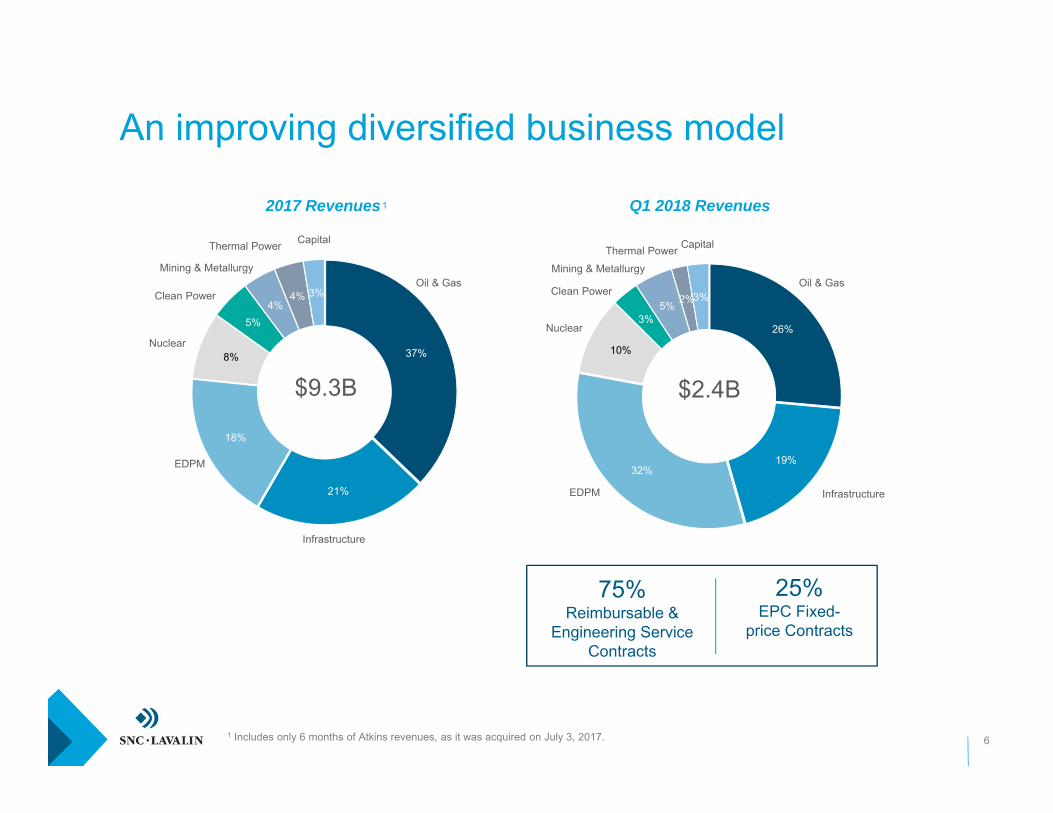
An improving diversified business model
6
2017 Revenues
Oil & Gas
Infrastructure
EDPM
Mining & Metallurgy
Capital
$9.3B
1
1 Includes only 6 months of Atkins revenues, as it was acquired on July 3, 2017.
75%Reimbursable &
Engineering Service Contracts
25%EPC Fixed-
price Contracts
Clean Power
Thermal Power
Q1 2018 Revenues
Oil & Gas
Infrastructure
Mining & Metallurgy
Thermal Power Capital
$2.4B
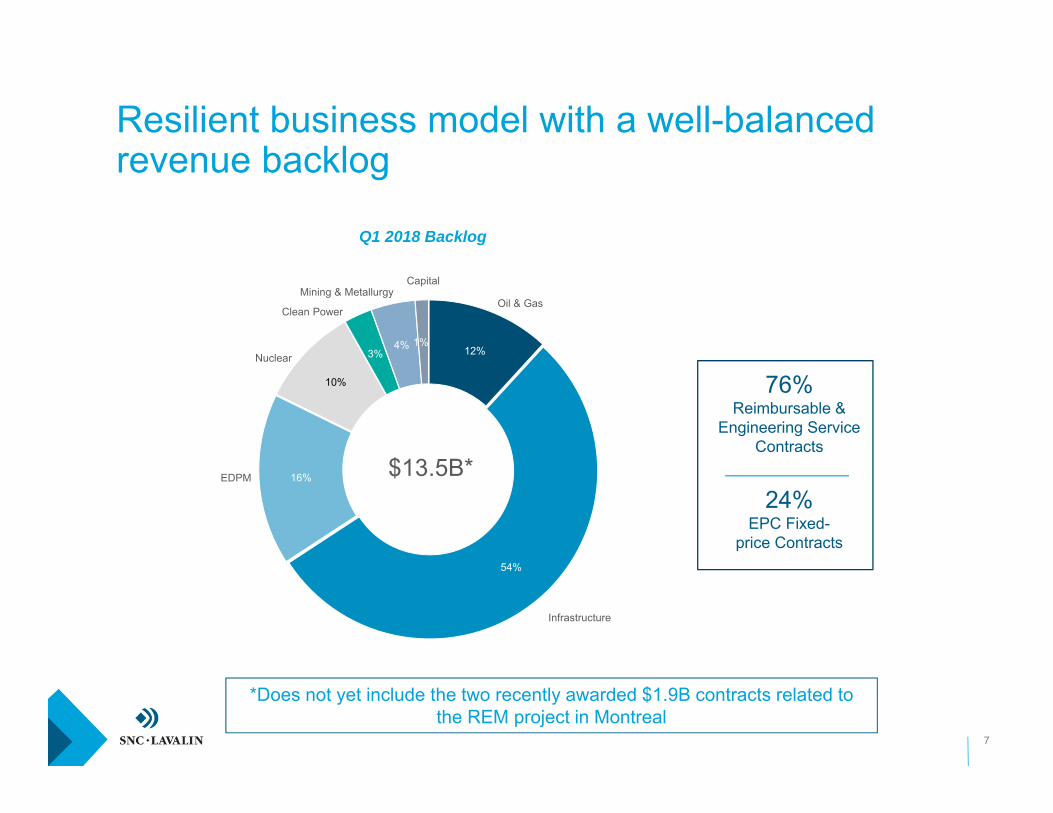
Resilient business model with a well-balancedrevenue backlog
7
12%
54%
16%
10%
3%4% 1%
Nuclear
EDPM
Clean Power
76%Reimbursable &
Engineering Service Contracts
24%EPC Fixed-
price Contracts
Q1 2018 Backlog
Oil & Gas
Infrastructure
Mining & MetallurgyCapital
$13.5B*
*Does not yet include the two recently awarded $1.9B contracts related to the REM project in Montreal
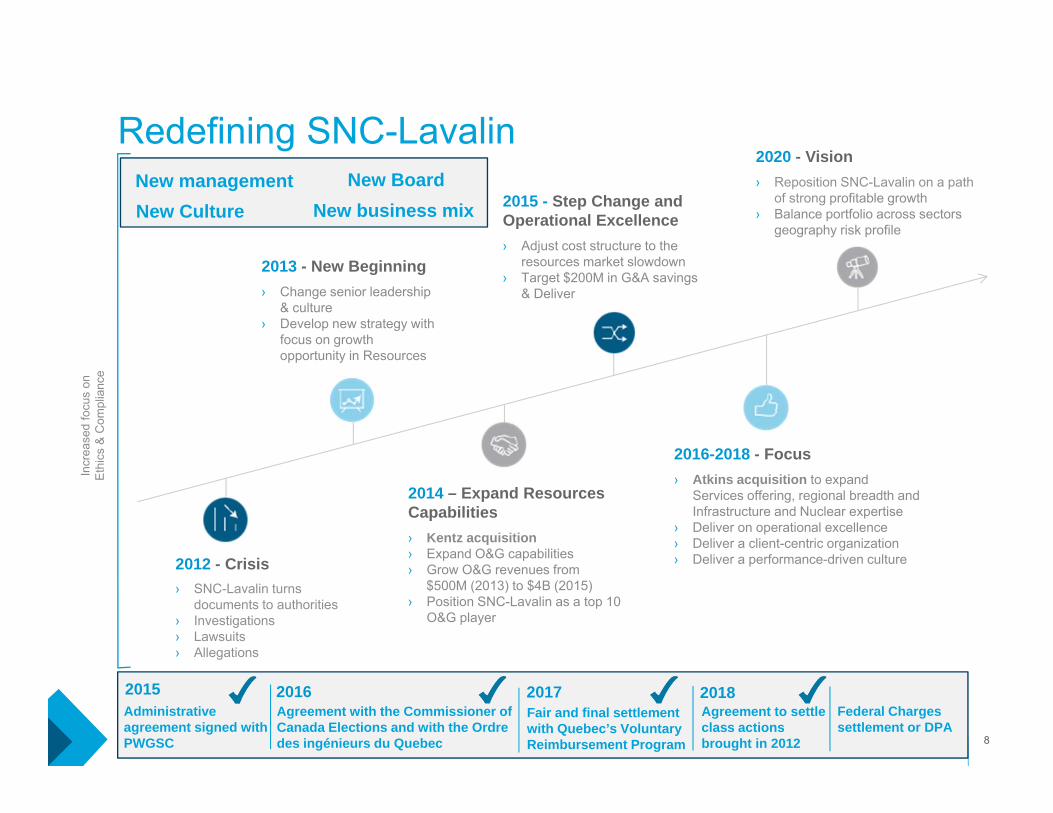
Redefining SNC-Lavalin
2012 - Crisis› SNC-Lavalin turns
documents to authorities› Investigations› Lawsuits› Allegations
2013 - New Beginning› Change senior leadership
& culture› Develop new strategy with
focus on growth opportunity in Resources
2014 – Expand Resources Capabilities› Kentz acquisition› Expand O&G capabilities› Grow O&G revenues from
$500M (2013) to $4B (2015)› Position SNC-Lavalin as a top 10
O&G player
2015 - Step Change and Operational Excellence› Adjust cost structure to the
resources market slowdown› Target $200M in G&A savings
& Deliver
2016-2018 - Focus› Atkins acquisition to expand
Services offering, regional breadth and Infrastructure and Nuclear expertise
› Deliver on operational excellence › Deliver a client-centric organization› Deliver a performance-driven culture
2020 - Vision› Reposition SNC-Lavalin on a path
of strong profitable growth› Balance portfolio across sectors
geography risk profile
8
Incr
ease
d fo
cus
on
Eth
ics
& C
ompl
ianc
e
New business mixNew management New Board New Culture
Administrative agreement signed with PWGSC
Agreement with the Commissioner of Canada Elections and with the Ordredes ingénieurs du Quebec
Fair and final settlement with Quebec’s Voluntary Reimbursement Program
2015 2016 2017Agreement to settle class actions brought in 2012
2018Federal Charges settlement or DPA
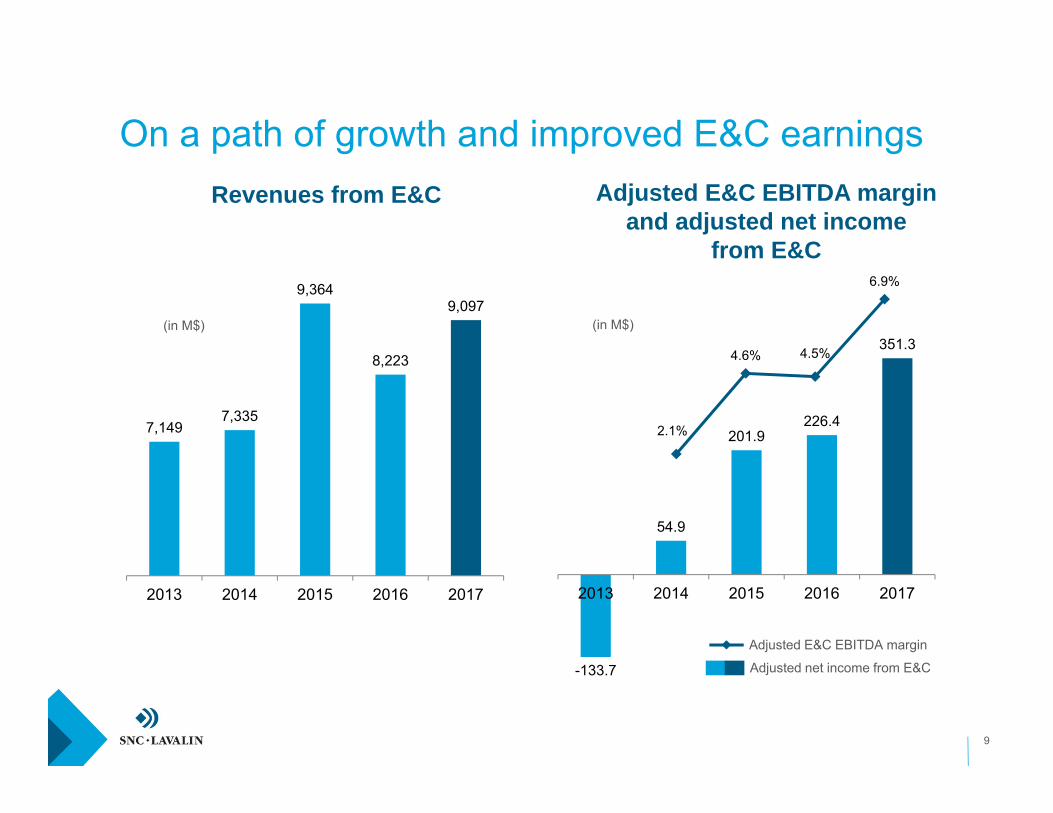
7,1497,335
9,364
8,223
9,097
2013 2014 2015 2016 2017
(in M$)
On a path of growth and improved E&C earnings
9
-133.7
54.9
201.9226.4
351.3
2013 2014 2015 2016 2017
(in M$)
Revenues from E&C Adjusted E&C EBITDA margin and adjusted net income
from E&C
2.1%
4.6% 4.5%
6.9%
Adjusted net income from E&C
Adjusted E&C EBITDA margin
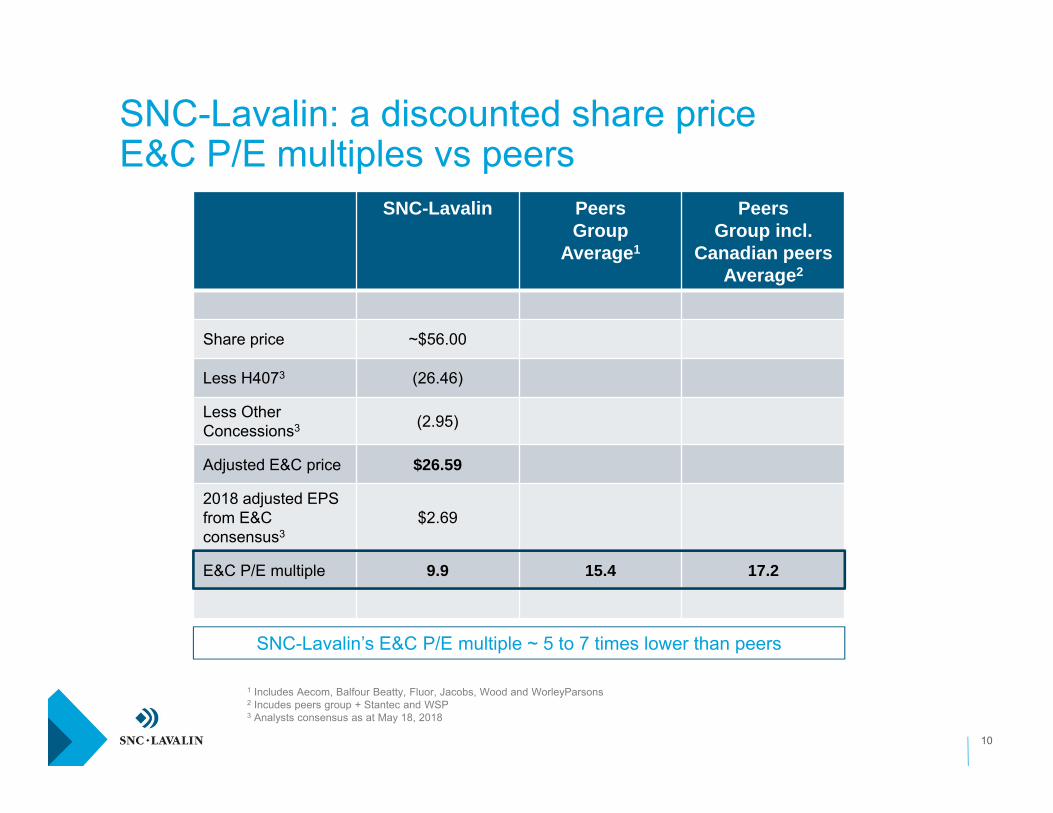
SNC-Lavalin: a discounted share priceE&C P/E multiples vs peers
SNC-Lavalin PeersGroup
Average1
PeersGroup incl.
Canadian peersAverage2
Share price ~$56.00
Less H4073 (26.46)
Less Other Concessions3 (2.95)
Adjusted E&C price $26.59
2018 adjusted EPS from E&C consensus3
$2.69
E&C P/E multiple 9.9 15.4 17.2
1 Includes Aecom, Balfour Beatty, Fluor, Jacobs, Wood and WorleyParsons2 Incudes peers group + Stantec and WSP3 Analysts consensus as at May 18, 2018
SNC-Lavalin’s E&C P/E multiple ~ 5 to 7 times lower than peers
10

SNC-Lavalin’s E&C business undervaluedE&C EV/EBITDA multiples vs peers
11
As at May 17, 2018
13.2x
12.1x
10.9x
10.0x 9.5x 9.2x 9.1x
6.9x 6.8x 6.7x
Avg: 9.8x
WorleyParsons WSP Wood Stantec Jacobs Fluor AECOM Balfour McDernmott SNC (Ex-Capital)
EV / CY2018E EBITDA
(E&C)
12
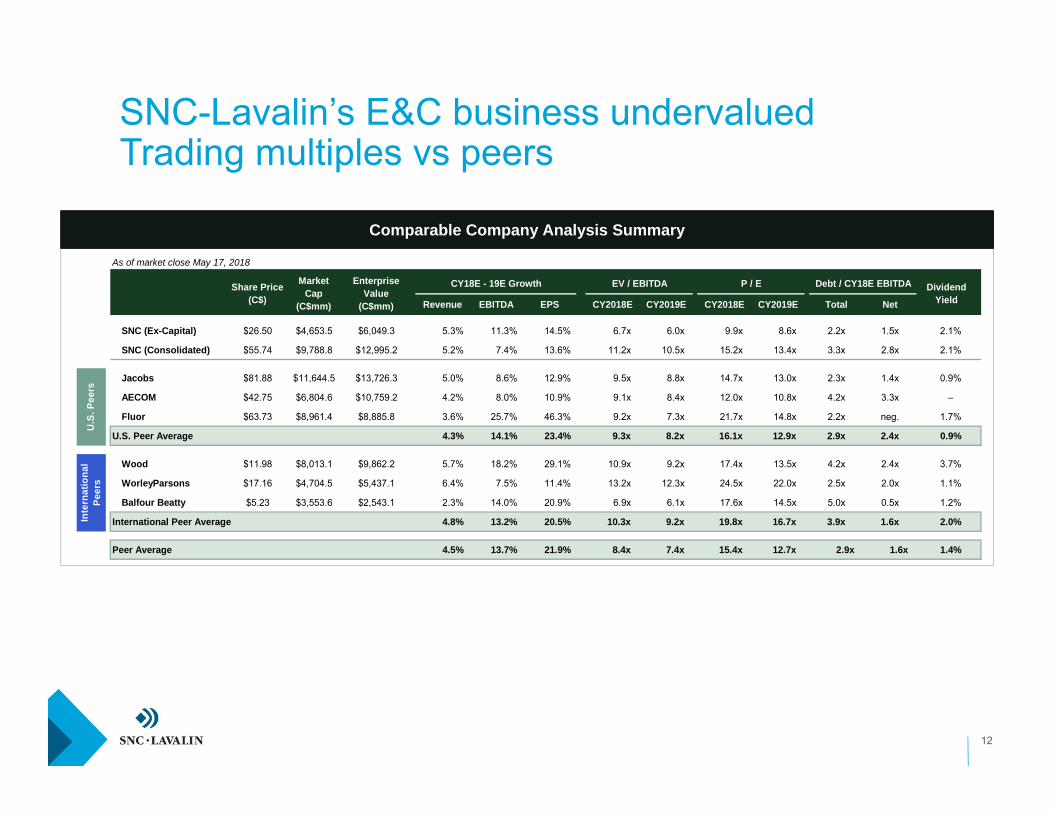
SNC-Lavalin’s E&C business undervaluedTrading multiples vs peers
Comparable Company Analysis Summary
As of market close May 17, 2018
CY18E - 19E Growth EV / EBITDA P / E Debt / CY18E EBITDA
Revenue EBITDA EPS CY2018E CY2019E CY2018E CY2019E Total Net
SNC (Ex-Capital) $26.50 $4,653.5 $6,049.3 5.3% 11.3% 14.5% 6.7x 6.0x 9.9x 8.6x 2.2x 1.5x 2.1%
SNC (Consolidated) $55.74 $9,788.8 $12,995.2 5.2% 7.4% 13.6% 11.2x 10.5x 15.2x 13.4x 3.3x 2.8x 2.1%
Jacobs $81.88 $11,644.5 $13,726.3 5.0% 8.6% 12.9% 9.5x 8.8x 14.7x 13.0x 2.3x 1.4x 0.9%
AECOM $42.75 $6,804.6 $10,759.2 4.2% 8.0% 10.9% 9.1x 8.4x 12.0x 10.8x 4.2x 3.3x –
Fluor $63.73 $8,961.4 $8,885.8 3.6% 25.7% 46.3% 9.2x 7.3x 21.7x 14.8x 2.2x neg. 1.7%
U.S. Peer Average 4.3% 14.1% 23.4% 9.3x 8.2x 16.1x 12.9x 2.9x 2.4x 0.9%
Wood $11.98 $8,013.1 $9,862.2 5.7% 18.2% 29.1% 10.9x 9.2x 17.4x 13.5x 4.2x 2.4x 3.7%
WorleyParsons $17.16 $4,704.5 $5,437.1 6.4% 7.5% 11.4% 13.2x 12.3x 24.5x 22.0x 2.5x 2.0x 1.1%
Balfour Beatty $5.23 $3,553.6 $2,543.1 2.3% 14.0% 20.9% 6.9x 6.1x 17.6x 14.5x 5.0x 0.5x 1.2%
International Peer Average 4.8% 13.2% 20.5% 10.3x 9.2x 19.8x 16.7x 3.9x 1.6x 2.0%
Peer Average 4.5% 13.7% 21.9% 8.4x 7.4x 15.4x 12.7x 2.9x 1.6x 1.4%
Share Price (C$)
MarketCap
(C$mm)
EnterpriseValue
(C$mm)
Dividend Yield
U.S
. Pee
rsIn
tern
atio
nal
Peer
s
13
Vision 2020 – Delivery ahead of schedule
2020 Objectives
› Become one of the top global, fully integrated, professional services and project management companies in profitability and profit growth
› Be recognized as a client-centric delivery-focused organization
› Strong, performance-driven culture
› Continuous focus on operational excellence
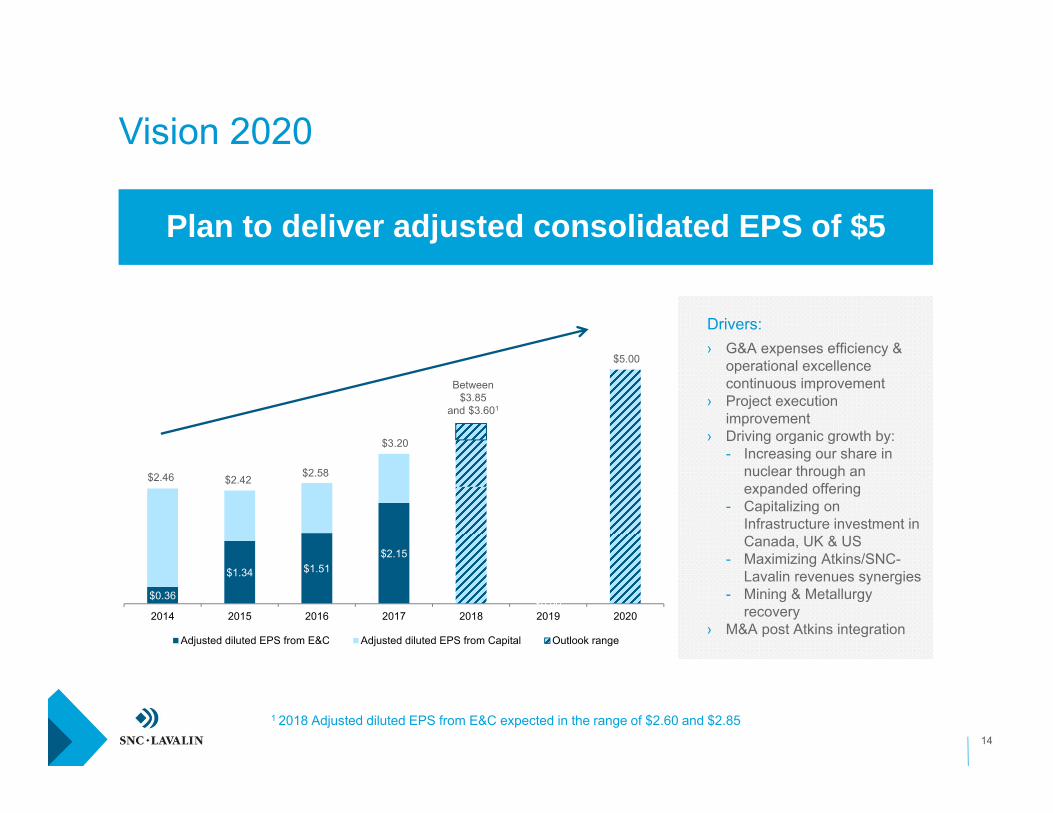
Plan to deliver adjusted consolidated EPS of $5
14
Drivers:› G&A expenses efficiency &
operational excellence continuous improvement
› Project execution improvement
› Driving organic growth by:- Increasing our share in
nuclear through an expanded offering
- Capitalizing on Infrastructure investment in Canada, UK & US
- Maximizing Atkins/SNC-Lavalin revenues synergies
- Mining & Metallurgy recovery
› M&A post Atkins integration
Vision 2020
$0.36
$1.34 $1.51$2.15
$0.002014 2015 2016 2017 2018 2019 2020
Adjusted diluted EPS from E&C Adjusted diluted EPS from Capital Outlook range
$2.46 $2.42 $2.58
$3.20
Between $3.85
and $3.601
$5.00
1 2018 Adjusted diluted EPS from E&C expected in the range of $2.60 and $2.85

15
Sector of Activity
16
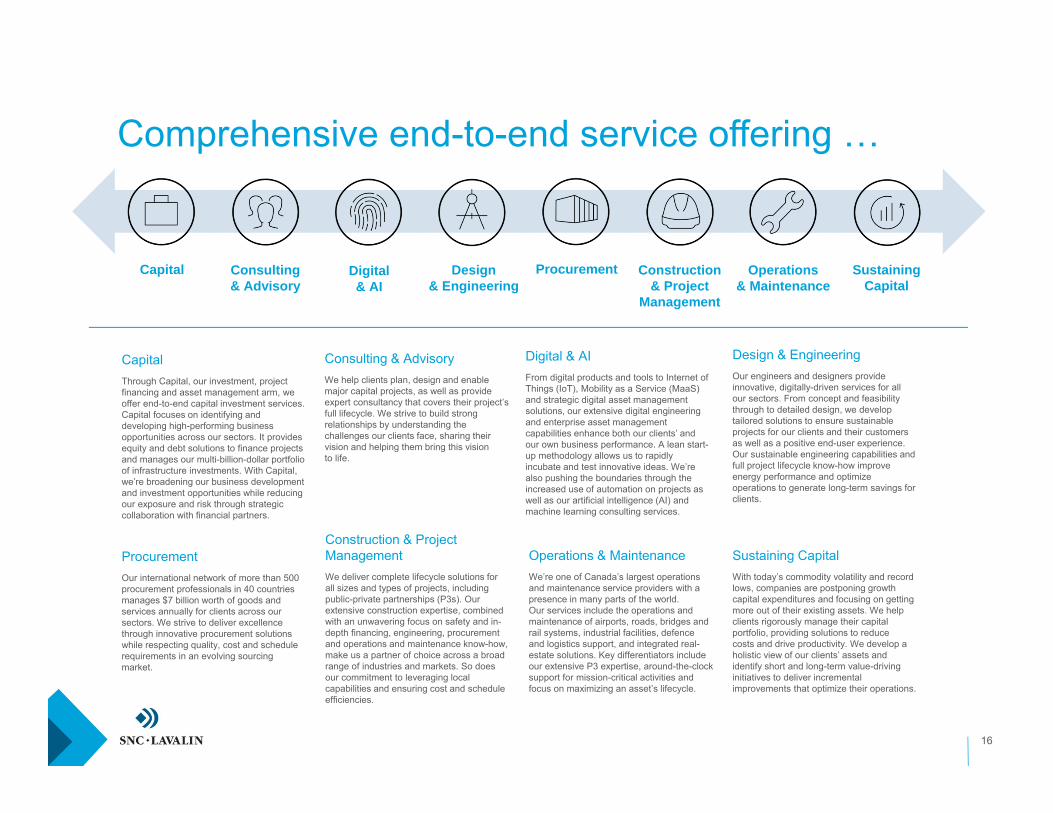
Comprehensive end-to-end service offering …
CapitalThrough Capital, our investment, project financing and asset management arm, we offer end-to-end capital investment services. Capital focuses on identifying and developing high-performing business opportunities across our sectors. It provides equity and debt solutions to finance projects and manages our multi-billion-dollar portfolio of infrastructure investments. With Capital, we’re broadening our business development and investment opportunities while reducing our exposure and risk through strategic collaboration with financial partners.
Consulting & AdvisoryWe help clients plan, design and enable major capital projects, as well as provide expert consultancy that covers their project’s full lifecycle. We strive to build strong relationships by understanding the challenges our clients face, sharing their vision and helping them bring this vision to life.
Digital & AIFrom digital products and tools to Internet of Things (IoT), Mobility as a Service (MaaS) and strategic digital asset management solutions, our extensive digital engineering and enterprise asset management capabilities enhance both our clients’ and our own business performance. A lean start-up methodology allows us to rapidly incubate and test innovative ideas. We’re also pushing the boundaries through the increased use of automation on projects as well as our artificial intelligence (AI) and machine learning consulting services.
Design & EngineeringOur engineers and designers provide innovative, digitally-driven services for all our sectors. From concept and feasibility through to detailed design, we develop tailored solutions to ensure sustainable projects for our clients and their customers as well as a positive end-user experience. Our sustainable engineering capabilities and full project lifecycle know-how improve energy performance and optimize operations to generate long-term savings for clients.
ProcurementOur international network of more than 500 procurement professionals in 40 countries manages $7 billion worth of goods and services annually for clients across our sectors. We strive to deliver excellence through innovative procurement solutions while respecting quality, cost and schedule requirements in an evolving sourcing market.
Construction & Project ManagementWe deliver complete lifecycle solutions for all sizes and types of projects, including public-private partnerships (P3s). Our extensive construction expertise, combined with an unwavering focus on safety and in-depth financing, engineering, procurement and operations and maintenance know-how, make us a partner of choice across a broad range of industries and markets. So does our commitment to leveraging local capabilities and ensuring cost and schedule efficiencies.
Operations & MaintenanceWe’re one of Canada’s largest operations and maintenance service providers with a presence in many parts of the world. Our services include the operations and maintenance of airports, roads, bridges and rail systems, industrial facilities, defenceand logistics support, and integrated real-estate solutions. Key differentiators include our extensive P3 expertise, around-the-clock support for mission-critical activities and focus on maximizing an asset’s lifecycle.
Sustaining CapitalWith today’s commodity volatility and record lows, companies are postponing growth capital expenditures and focusing on getting more out of their existing assets. We help clients rigorously manage their capital portfolio, providing solutions to reduce costs and drive productivity. We develop a holistic view of our clients’ assets and identify short and long-term value-driving initiatives to deliver incremental improvements that optimize their operations.
Capital Consulting& Advisory
Procurement Construction& Project
Management
Operations& Maintenance
Design& Engineering
Sustaining Capital
Digital& AI
Clean Power
17
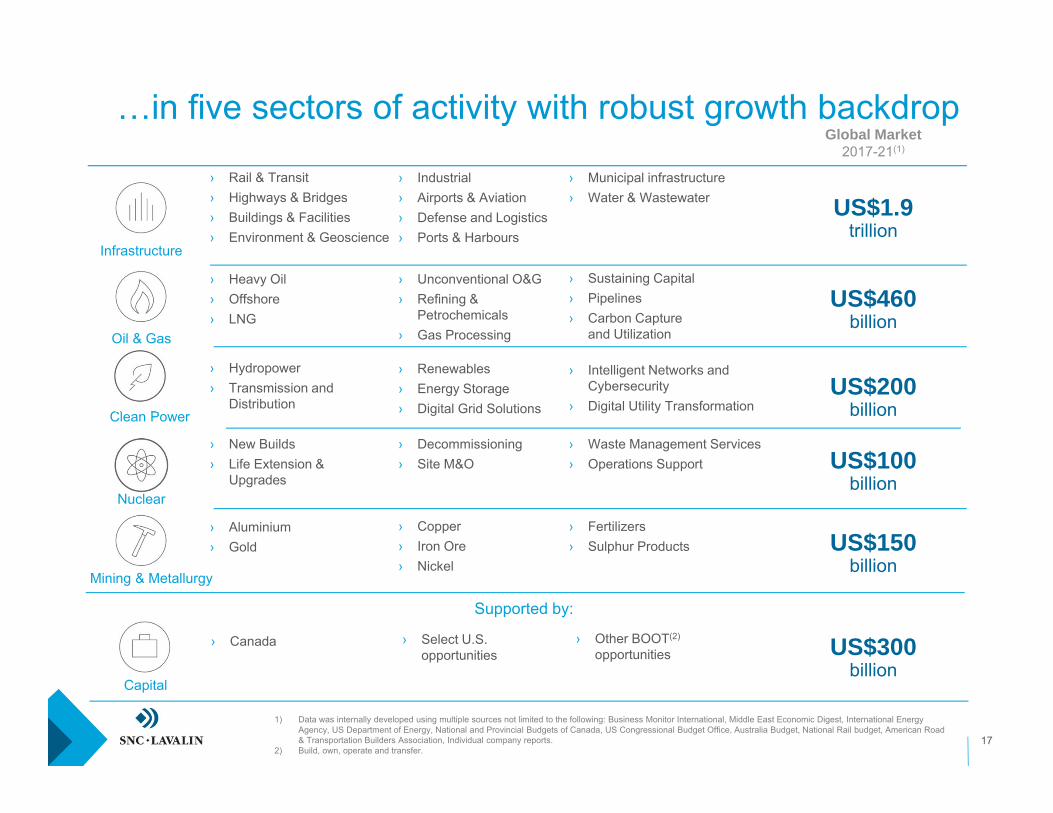
US$300billion
US$150billion
US$100billion
US$460billion
US$1.9trillion
…in five sectors of activity with robust growth backdropGlobal Market
2017-21(1)
› Rail & Transit› Highways & Bridges› Buildings & Facilities› Environment & Geoscience
› Municipal infrastructure› Water & Wastewater
› Industrial› Airports & Aviation› Defense and Logistics› Ports & Harbours
› Heavy Oil› Offshore› LNG
› Unconventional O&G› Refining &
Petrochemicals› Gas Processing
› Sustaining Capital› Pipelines› Carbon Capture
and Utilization
› New Builds› Life Extension &
Upgrades
› Hydropower› Transmission and
Distribution
› Renewables› Energy Storage› Digital Grid Solutions
› Aluminium› Gold
› Copper› Iron Ore› Nickel
› Fertilizers› Sulphur Products
› Canada
1) Data was internally developed using multiple sources not limited to the following: Business Monitor International, Middle East Economic Digest, International Energy Agency, US Department of Energy, National and Provincial Budgets of Canada, US Congressional Budget Office, Australia Budget, National Rail budget, American Road & Transportation Builders Association, Individual company reports.
2) Build, own, operate and transfer.
Infrastructure
Oil & Gas
Mining & Metallurgy
Capital
› Select U.S. opportunities
› Other BOOT(2)
opportunities
Nuclear
› Decommissioning› Site M&O
› Waste Management Services› Operations Support
US$200billion
› Intelligent Networks and Cybersecurity
› Digital Utility Transformation
Supported by:
18
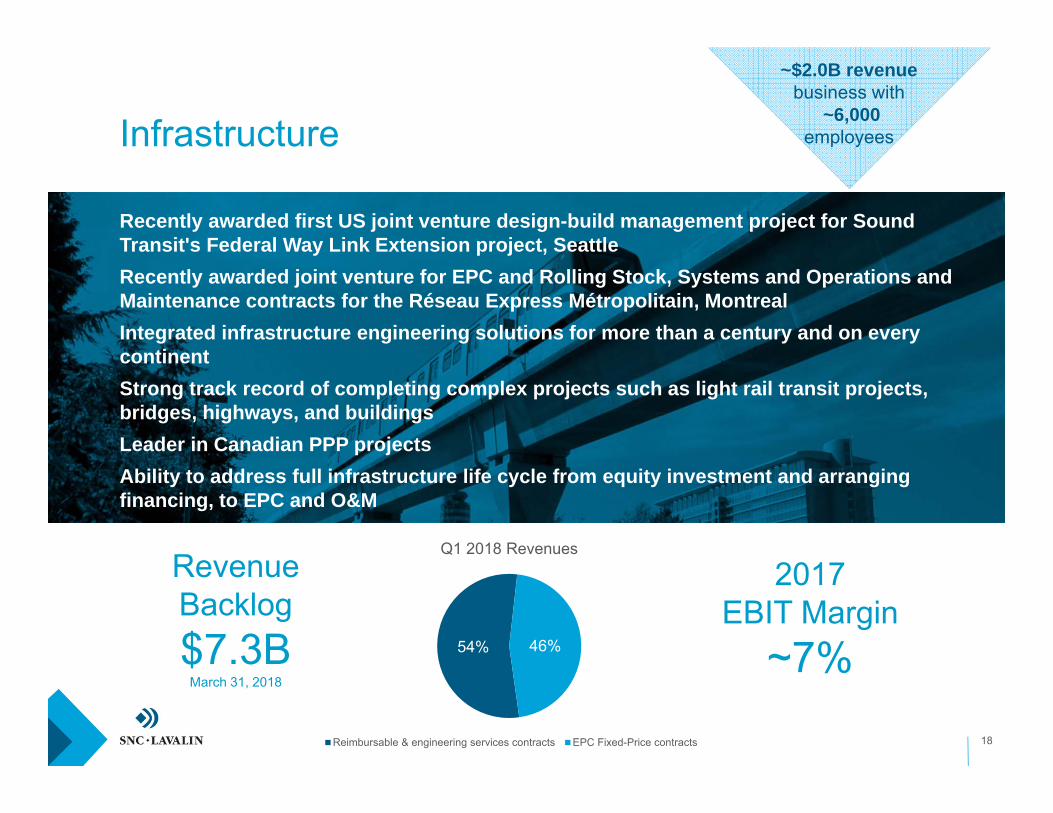
54% 46%
Q1 2018 Revenues
Reimbursable & engineering services contracts EPC Fixed-Price contracts
~$2.0B revenuebusiness with
~6,000employeesInfrastructure
Recently awarded first US joint venture design-build management project for Sound Transit's Federal Way Link Extension project, SeattleRecently awarded joint venture for EPC and Rolling Stock, Systems and Operations and Maintenance contracts for the Réseau Express Métropolitain, MontrealIntegrated infrastructure engineering solutions for more than a century and on every continentStrong track record of completing complex projects such as light rail transit projects, bridges, highways, and buildings Leader in Canadian PPP projects Ability to address full infrastructure life cycle from equity investment and arranging financing, to EPC and O&M
2017EBIT Margin
~7%
Revenue Backlog$7.3B
March 31, 2018
19
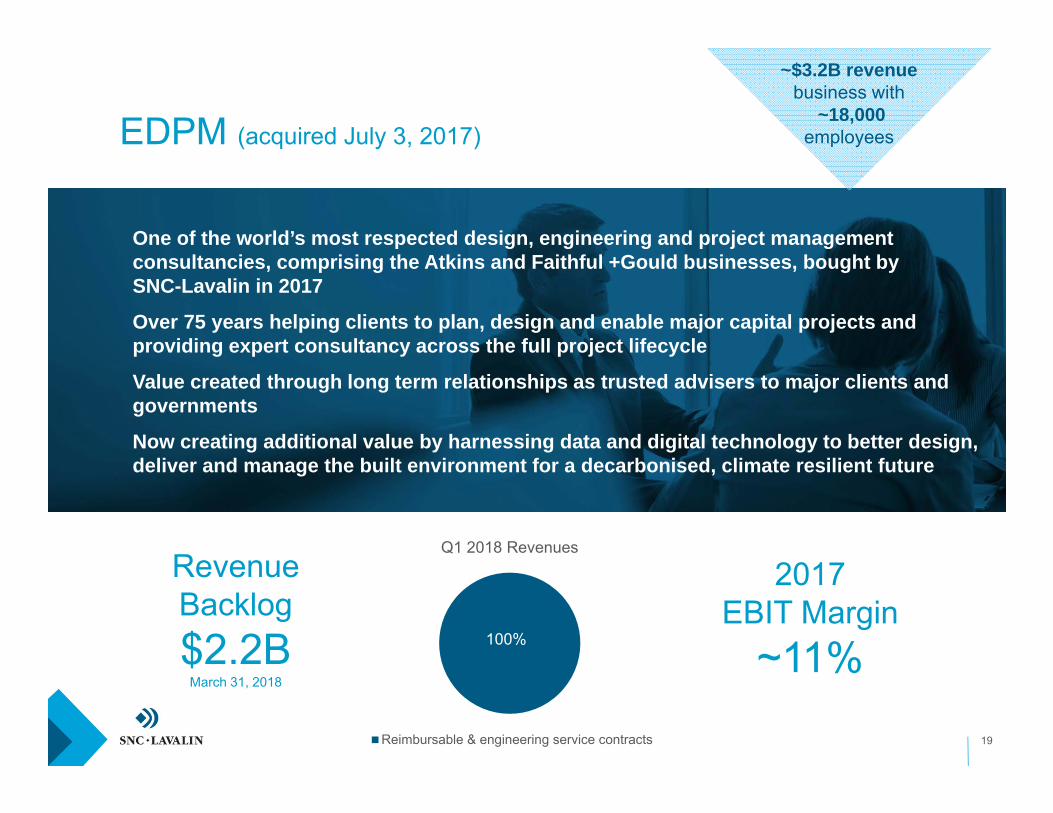
~$3.2B revenuebusiness with
~18,000employees
One of the world’s most respected design, engineering and project management consultancies, comprising the Atkins and Faithful +Gould businesses, bought bySNC-Lavalin in 2017
Over 75 years helping clients to plan, design and enable major capital projects and providing expert consultancy across the full project lifecycle
Value created through long term relationships as trusted advisers to major clients and governments
Now creating additional value by harnessing data and digital technology to better design, deliver and manage the built environment for a decarbonised, climate resilient future
Revenue Backlog$2.2B
March 31, 2018
100%
Q1 2018 Revenues
Reimbursable & engineering service contracts
EDPM (acquired July 3, 2017)
2017EBIT Margin
~11%
20
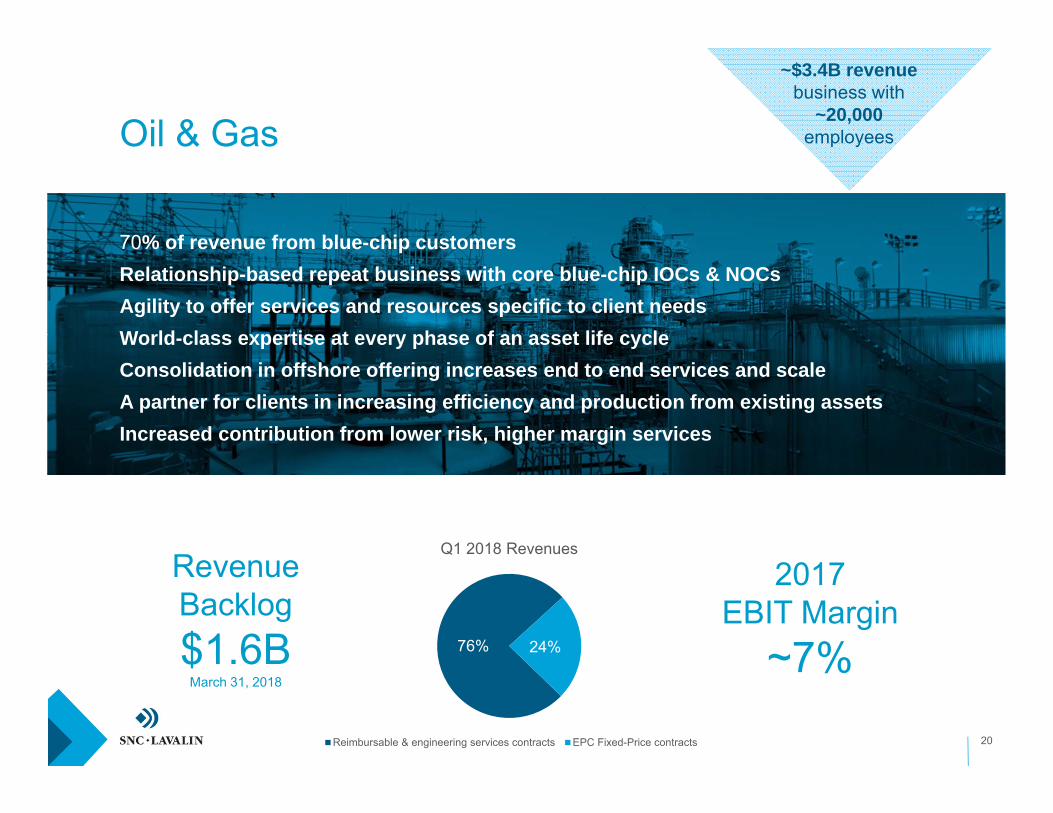
~$3.4B revenuebusiness with
~20,000employeesOil & Gas
70% of revenue from blue-chip customersRelationship-based repeat business with core blue-chip IOCs & NOCsAgility to offer services and resources specific to client needsWorld-class expertise at every phase of an asset life cycleConsolidation in offshore offering increases end to end services and scaleA partner for clients in increasing efficiency and production from existing assetsIncreased contribution from lower risk, higher margin services
Revenue Backlog$1.6B
March 31, 2018
2017EBIT Margin
~7%76% 24%
Q1 2018 Revenues
Reimbursable & engineering services contracts EPC Fixed-Price contracts
21
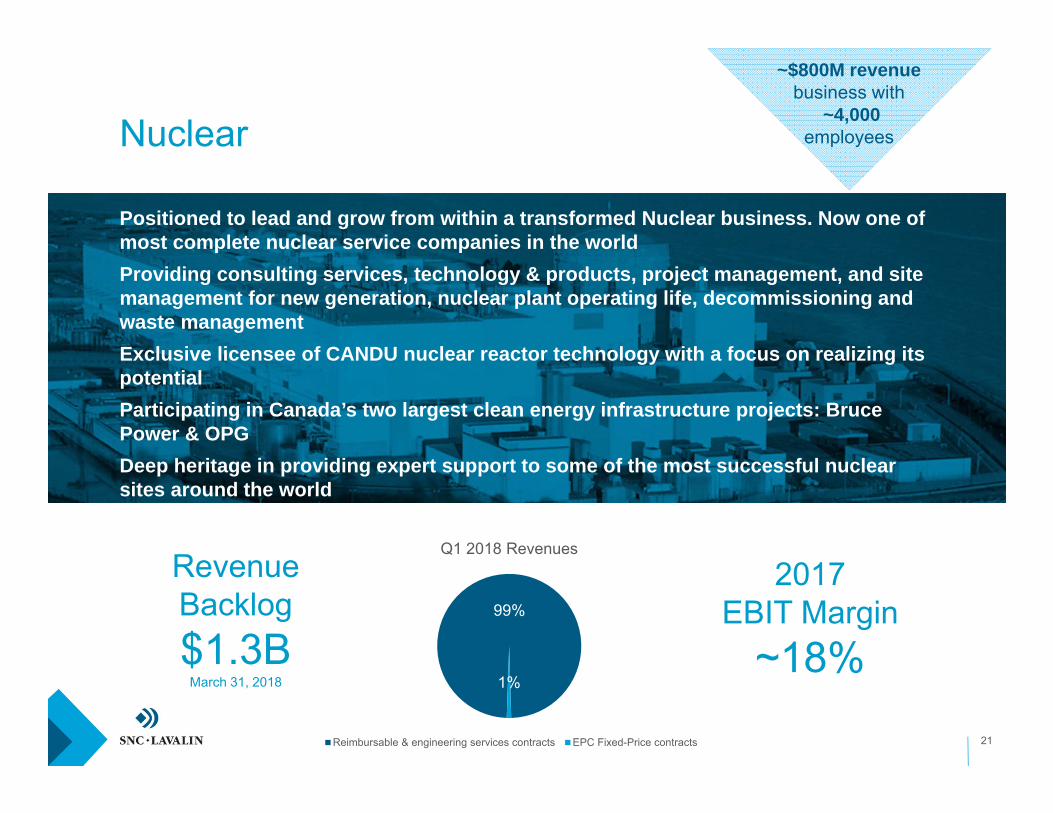
~$800M revenuebusiness with
~4,000employeesNuclear
Positioned to lead and grow from within a transformed Nuclear business. Now one of most complete nuclear service companies in the worldProviding consulting services, technology & products, project management, and site management for new generation, nuclear plant operating life, decommissioning and waste managementExclusive licensee of CANDU nuclear reactor technology with a focus on realizing its potentialParticipating in Canada’s two largest clean energy infrastructure projects: Bruce Power & OPGDeep heritage in providing expert support to some of the most successful nuclear sites around the world
Revenue Backlog$1.3B
March 31, 2018
2017EBIT Margin
~18%99%
1%
Q1 2018 Revenues
Reimbursable & engineering services contracts EPC Fixed-Price contracts
22
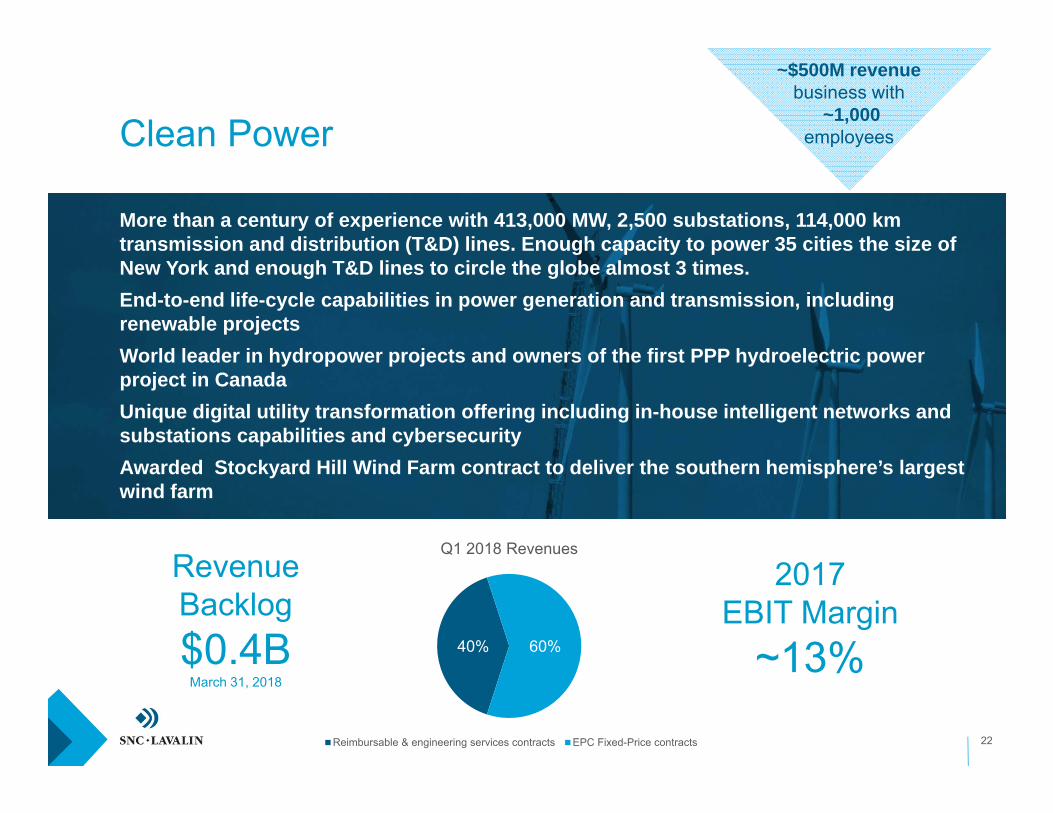
~$500M revenuebusiness with
~1,000employeesClean Power
More than a century of experience with 413,000 MW, 2,500 substations, 114,000 km transmission and distribution (T&D) lines. Enough capacity to power 35 cities the size of New York and enough T&D lines to circle the globe almost 3 times.End-to-end life-cycle capabilities in power generation and transmission, including renewable projectsWorld leader in hydropower projects and owners of the first PPP hydroelectric power project in CanadaUnique digital utility transformation offering including in-house intelligent networks and substations capabilities and cybersecurityAwarded Stockyard Hill Wind Farm contract to deliver the southern hemisphere’s largest wind farm
Revenue Backlog$0.4B
March 31, 2018
2017EBIT Margin
~13%40% 60%
Q1 2018 Revenues
Reimbursable & engineering services contracts EPC Fixed-Price contracts
23
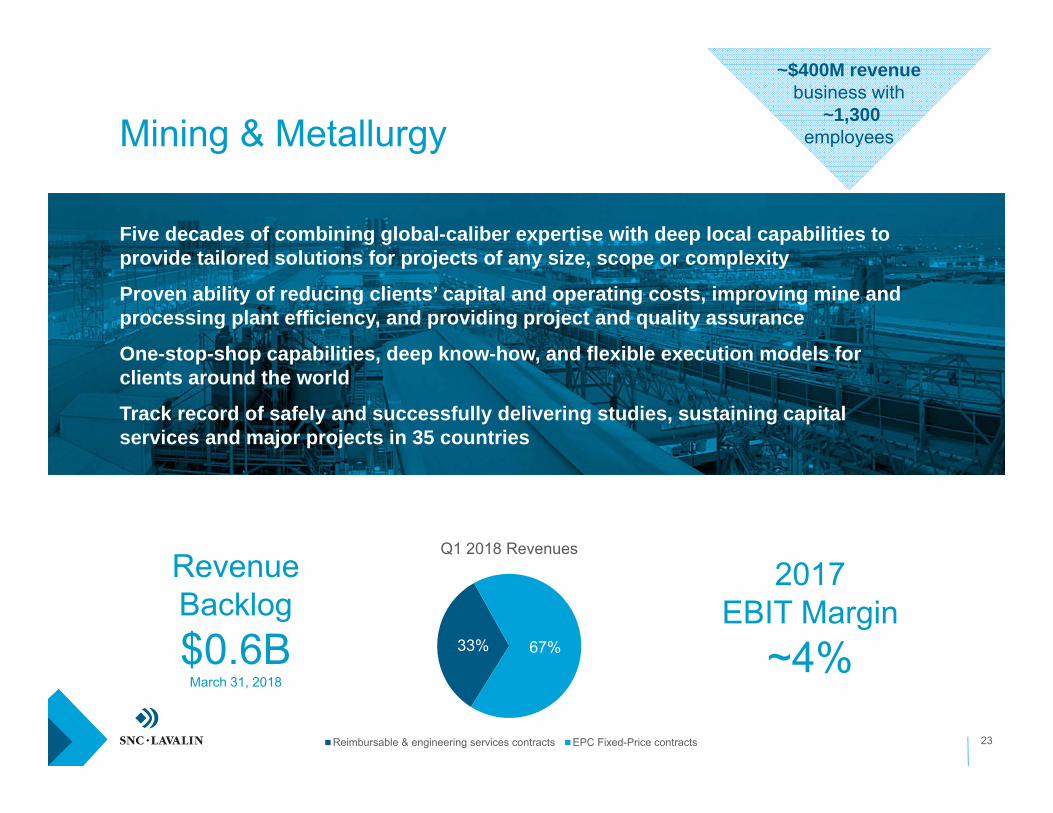
~$400M revenuebusiness with
~1,300employeesMining & Metallurgy
Five decades of combining global-caliber expertise with deep local capabilities to provide tailored solutions for projects of any size, scope or complexity
Proven ability of reducing clients’ capital and operating costs, improving mine and processing plant efficiency, and providing project and quality assurance
One-stop-shop capabilities, deep know-how, and flexible execution models for clients around the world
Track record of safely and successfully delivering studies, sustaining capital services and major projects in 35 countries
Revenue Backlog$0.6B
March 31, 2018
33% 67%
Q1 2018 Revenues
Reimbursable & engineering services contracts EPC Fixed-Price contracts
2017EBIT Margin
~4%
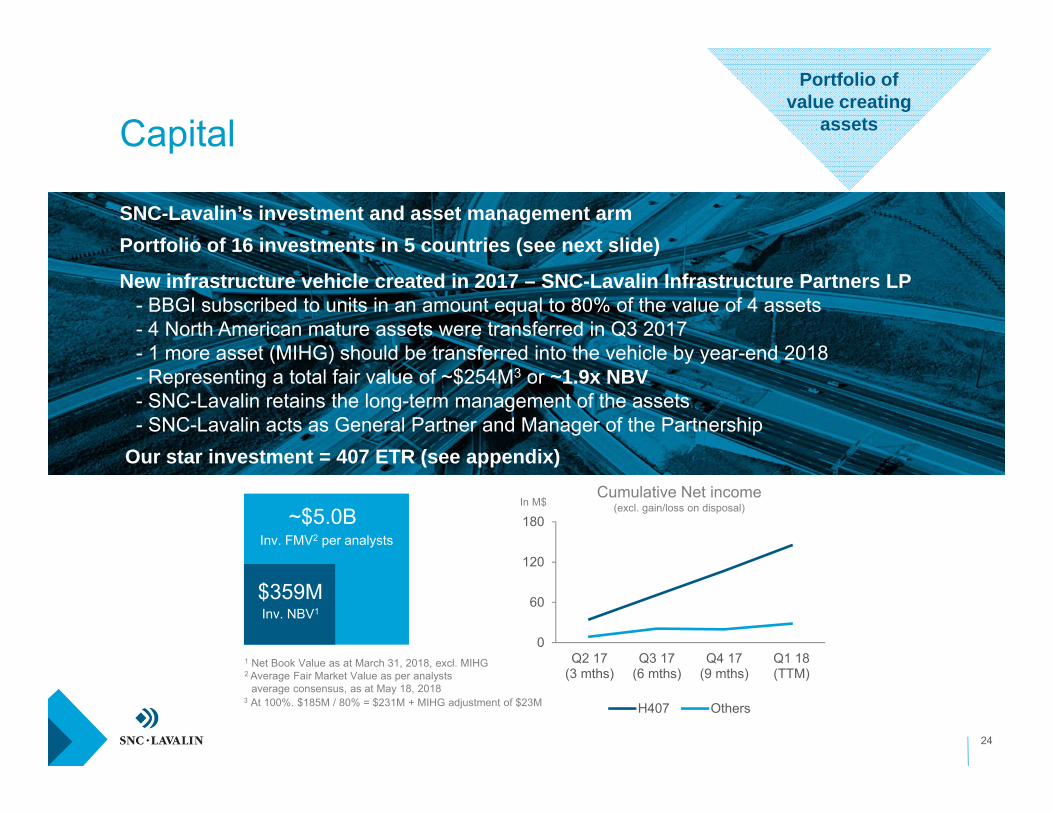
In M$
24
Cumulative Net income(excl. gain/loss on disposal)
$359MInv. NBV1
~$5.0BInv. FMV2 per analysts
Portfolio ofvalue creating
assetsCapital
SNC-Lavalin’s investment and asset management armPortfolio of 16 investments in 5 countries (see next slide)
New infrastructure vehicle created in 2017 – SNC-Lavalin Infrastructure Partners LP- BBGI subscribed to units in an amount equal to 80% of the value of 4 assets- 4 North American mature assets were transferred in Q3 2017- 1 more asset (MIHG) should be transferred into the vehicle by year-end 2018 - Representing a total fair value of ~$254M3 or ~1.9x NBV- SNC-Lavalin retains the long-term management of the assets- SNC-Lavalin acts as General Partner and Manager of the Partnership
Our star investment = 407 ETR (see appendix)
1 Net Book Value as at March 31, 2018, excl. MIHG2 Average Fair Market Value as per analysts
average consensus, as at May 18, 20183 At 100%. $185M / 80% = $231M + MIHG adjustment of $23M
0
60
120
180
Q2 17(3 mths)
Q3 17(6 mths)
Q4 17(9 mths)
Q1 18(TTM)
H407 Others
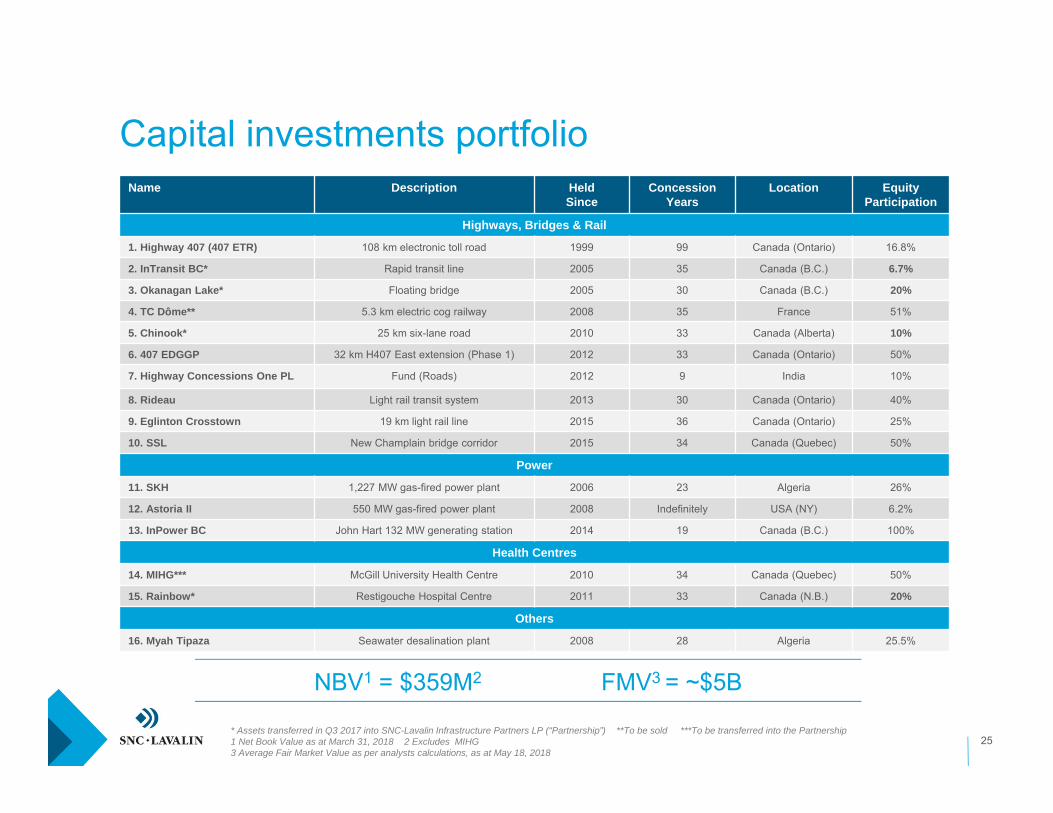
Name Description HeldSince
ConcessionYears
Location EquityParticipation
Highways, Bridges & Rail
1. Highway 407 (407 ETR) 108 km electronic toll road 1999 99 Canada (Ontario) 16.8%
2. InTransit BC* Rapid transit line 2005 35 Canada (B.C.) 6.7%
3. Okanagan Lake* Floating bridge 2005 30 Canada (B.C.) 20%
4. TC Dôme** 5.3 km electric cog railway 2008 35 France 51%
5. Chinook* 25 km six-lane road 2010 33 Canada (Alberta) 10%
6. 407 EDGGP 32 km H407 East extension (Phase 1) 2012 33 Canada (Ontario) 50%
7. Highway Concessions One PL Fund (Roads) 2012 9 India 10%
8. Rideau Light rail transit system 2013 30 Canada (Ontario) 40%
9. Eglinton Crosstown 19 km light rail line 2015 36 Canada (Ontario) 25%
10. SSL New Champlain bridge corridor 2015 34 Canada (Quebec) 50%
Power
11. SKH 1,227 MW gas-fired power plant 2006 23 Algeria 26%
12. Astoria II 550 MW gas-fired power plant 2008 Indefinitely USA (NY) 6.2%
13. InPower BC John Hart 132 MW generating station 2014 19 Canada (B.C.) 100%
Health Centres
14. MIHG*** McGill University Health Centre 2010 34 Canada (Quebec) 50%
15. Rainbow* Restigouche Hospital Centre 2011 33 Canada (N.B.) 20%
Others
16. Myah Tipaza Seawater desalination plant 2008 28 Algeria 25.5%
Capital investments portfolio
NBV1 = $359M2 FMV3 = ~$5B
* Assets transferred in Q3 2017 into SNC-Lavalin Infrastructure Partners LP (“Partnership”) **To be sold ***To be transferred into the Partnership1 Net Book Value as at March 31, 2018 2 Excludes MIHG 3 Average Fair Market Value as per analysts calculations, as at May 18, 2018
25
Appendix
26
27
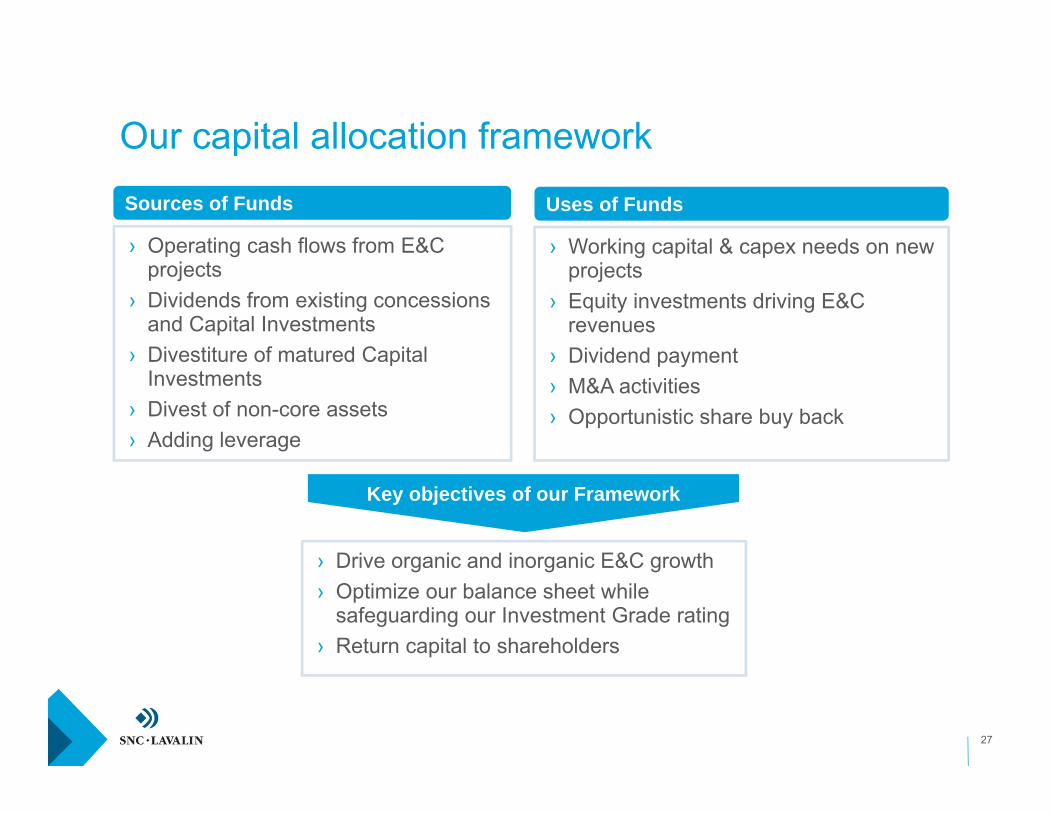
› Operating cash flows from E&C projects
› Dividends from existing concessions and Capital Investments
› Divestiture of matured Capital Investments
› Divest of non-core assets › Adding leverage
Sources of Funds
› Working capital & capex needs on new projects
› Equity investments driving E&C revenues
› Dividend payment› M&A activities› Opportunistic share buy back
Uses of Funds
› Drive organic and inorganic E&C growth› Optimize our balance sheet while
safeguarding our Investment Grade rating› Return capital to shareholders
Key objectives of our Framework
Our capital allocation framework
28
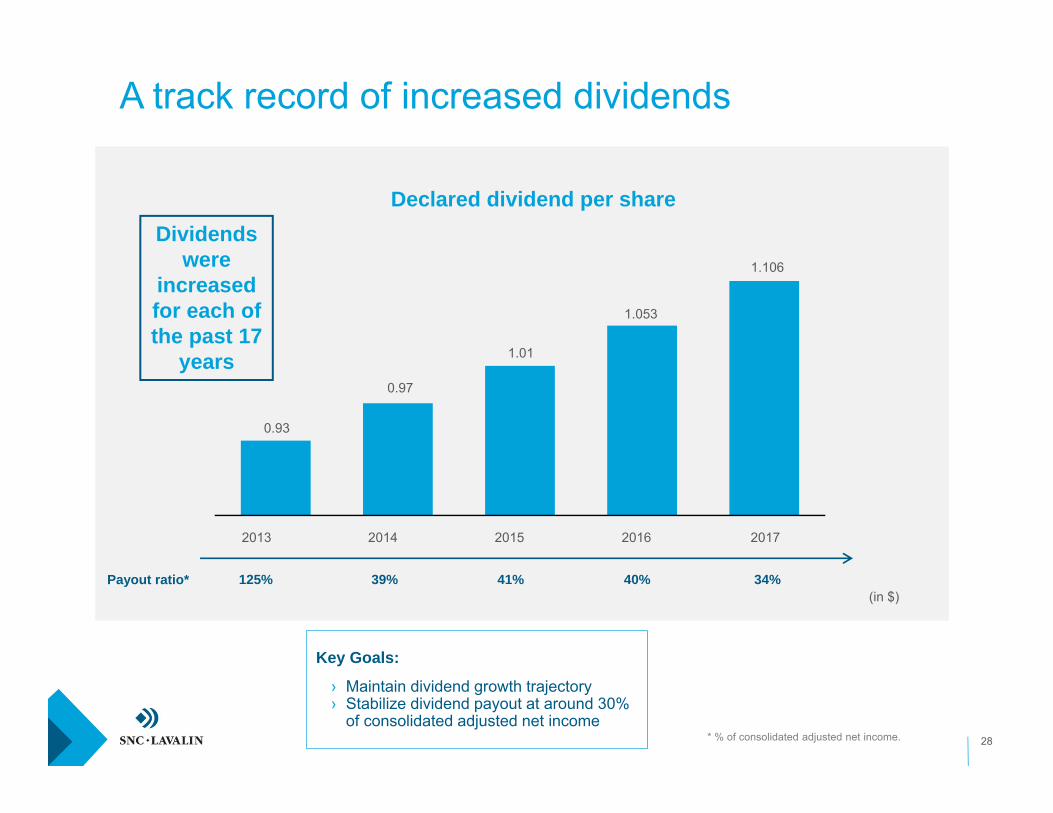
1.053
20152014
1.01
0.97
0.93
2013
1.106
20172016
Payout ratio* 125% 40%41%39% 34%(in $)
A track record of increased dividends
Dividends were
increased for each of the past 17
years
Declared dividend per share
* % of consolidated adjusted net income.
Key Goals:
› Maintain dividend growth trajectory› Stabilize dividend payout at around 30%
of consolidated adjusted net income
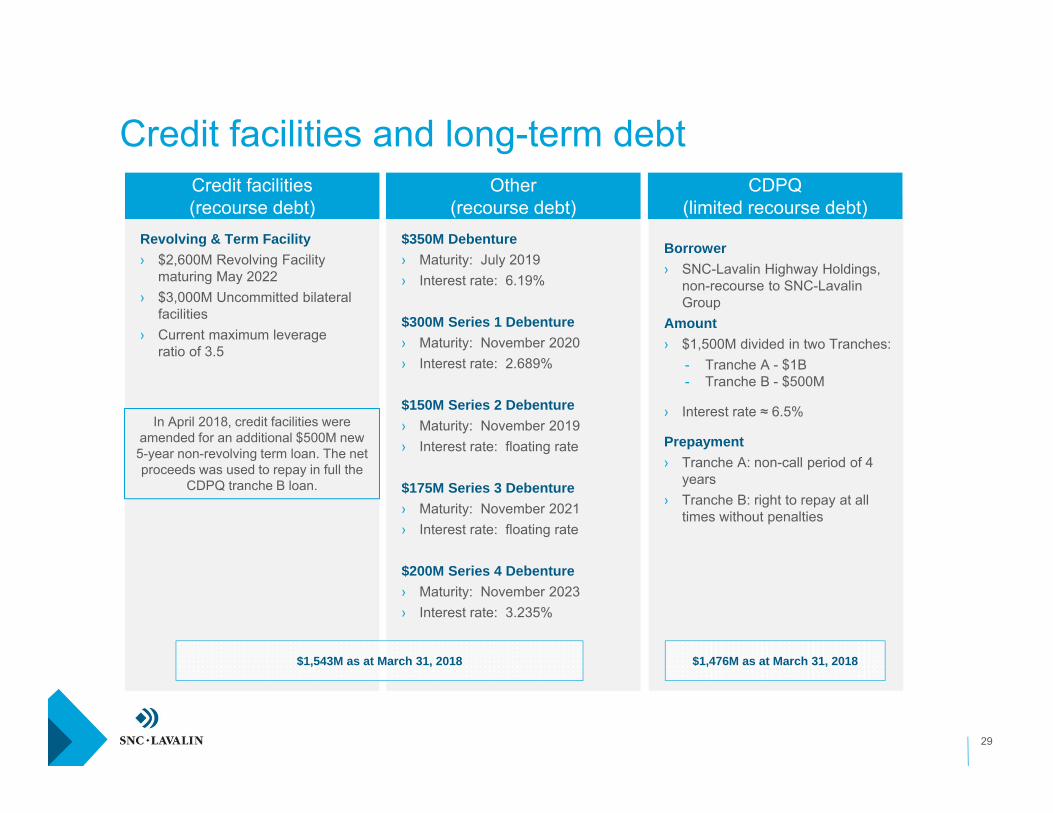
$350M Debenture› Maturity: July 2019› Interest rate: 6.19%
$300M Series 1 Debenture› Maturity: November 2020› Interest rate: 2.689%
$150M Series 2 Debenture› Maturity: November 2019› Interest rate: floating rate
$175M Series 3 Debenture› Maturity: November 2021› Interest rate: floating rate
$200M Series 4 Debenture› Maturity: November 2023› Interest rate: 3.235%
Borrower› SNC-Lavalin Highway Holdings,
non-recourse to SNC-Lavalin Group
Amount› $1,500M divided in two Tranches:
- Tranche A - $1B- Tranche B - $500M
› Interest rate ≈ 6.5%
Prepayment› Tranche A: non-call period of 4
years› Tranche B: right to repay at all
times without penalties
29
Revolving & Term Facility› $2,600M Revolving Facility
maturing May 2022› $3,000M Uncommitted bilateral
facilities› Current maximum leverage
ratio of 3.5
Credit facilities(recourse debt)
Other(recourse debt)
CDPQ(limited recourse debt)
Credit facilities and long-term debt
$1,543M as at March 31, 2018 $1,476M as at March 31, 2018
In April 2018, credit facilities were amended for an additional $500M new 5-year non-revolving term loan. The net proceeds was used to repay in full the
CDPQ tranche B loan.
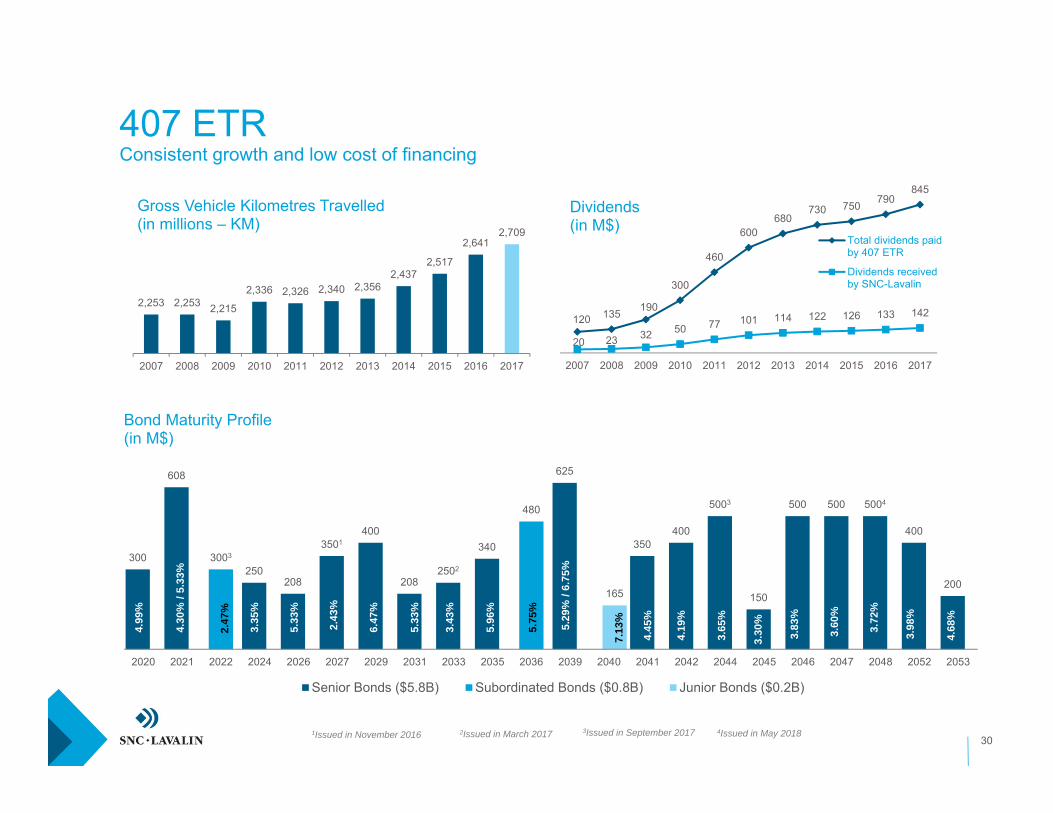
407 ETRConsistent growth and low cost of financing
30
120 135 190
300
460
600680
730 750 790845
20 23 32 50 77 101 114 122 126 133 142
2007 2008 2009 2010 2011 2012 2013 2014 2015 2016 2017
Dividends (in M$)
Total dividends paidby 407 ETR
Dividends receivedby SNC-Lavalin
300
608
250208
3501400
2082502
340
625
350400
5003
150
500 500 5004
400
200
3003
480
165
2020 2021 2022 2024 2026 2027 2029 2031 2033 2035 2036 2039 2040 2041 2042 2044 2045 2046 2047 2048 2052 2053
Bond Maturity Profile(in M$)
Senior Bonds ($5.8B) Subordinated Bonds ($0.8B) Junior Bonds ($0.2B)
3.60
%
4.99
%
4.30
% /
5.33
%
3.35
%
5.33
%
6.47
%
5.33
%
5.96
%
5.75
%
7.13
%
4.45
%
4.19
%
3.30
%
3.83
%
3.98
%
4.68
%
3.72
%
5.29
% /
6.75
%
2.43
%
2,253 2,253 2,215
2,336 2,326 2,340 2,3562,437
2,517
2,6412,709
2007 2008 2009 2010 2011 2012 2013 2014 2015 2016 2017
Gross Vehicle Kilometres Travelled(in millions – KM)
1Issued in November 2016 2Issued in March 2017
3.43
%
2.47
%
3.65
%3Issued in September 2017 4Issued in May 2018
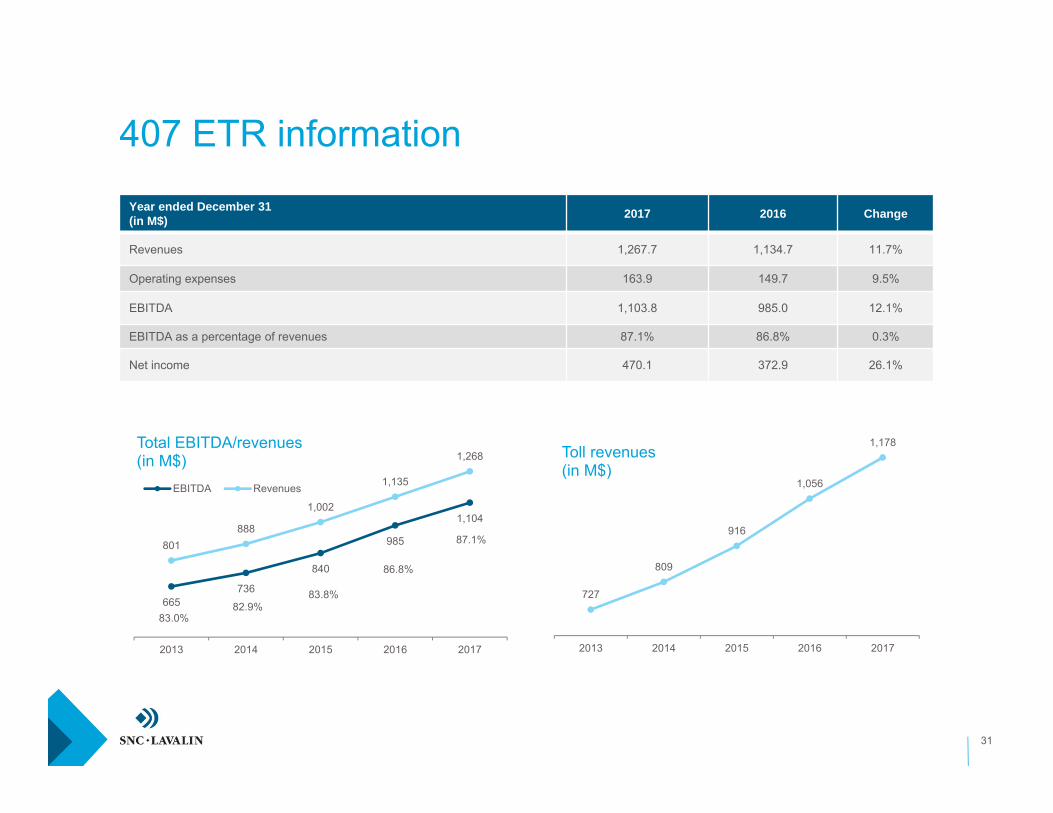
407 ETR information
31
Year ended December 31(in M$) 2017 2016 Change
Revenues 1,267.7 1,134.7 11.7%
Operating expenses 163.9 149.7 9.5%
EBITDA 1,103.8 985.0 12.1%
EBITDA as a percentage of revenues 87.1% 86.8% 0.3%
Net income 470.1 372.9 26.1%
665736
840
985
1,104
801888
1,002
1,135
1,268
2013 2014 2015 2016 2017
Total EBITDA/revenues(in M$)
EBITDA Revenues
83.0%82.9%
83.8%
86.8%
87.1%
727
809
916
1,056
1,178
2013 2014 2015 2016 2017
Toll revenues(in M$)
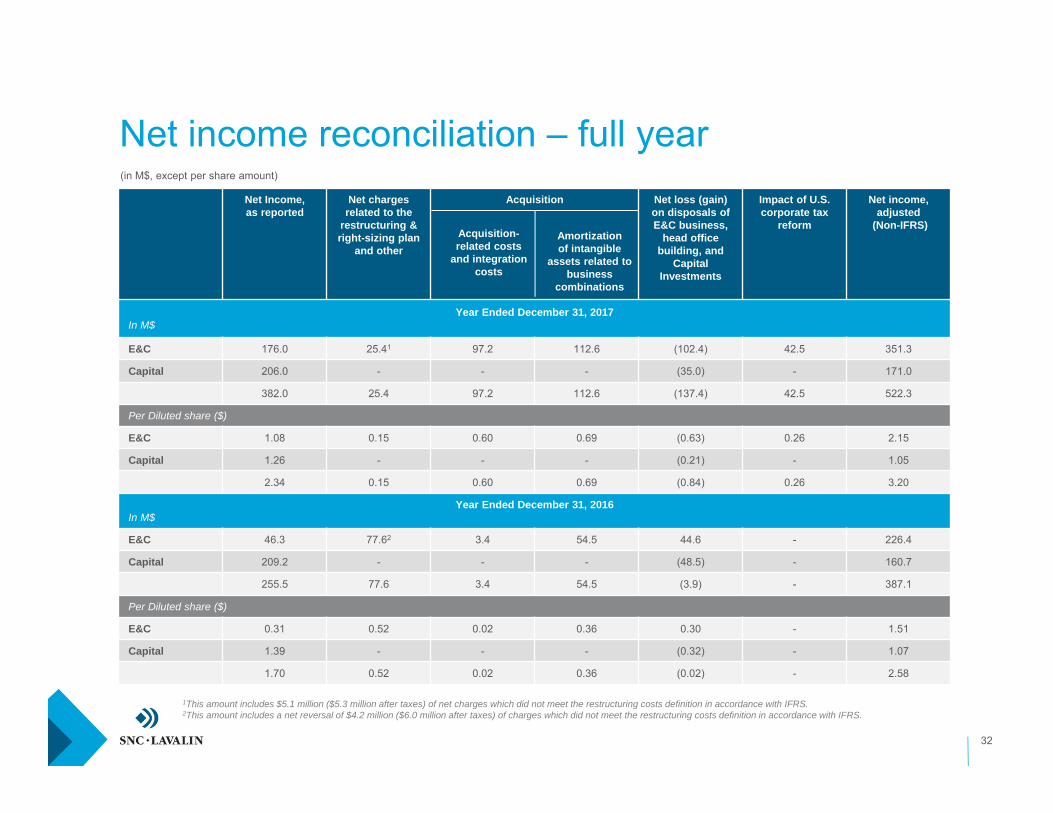
(in M$, except per share amount)
Net income reconciliation – full year Net Income,as reported
Net charges related to the
restructuring & right-sizing plan
and other
Acquisition Net loss (gain) on disposals of E&C business,
head office building, and
Capital Investments
Impact of U.S. corporate tax
reform
Net income, adjusted
(Non-IFRS)
Year Ended December 31, 2017In M$
E&C 176.0 25.41 97.2 112.6 (102.4) 42.5 351.3
Capital 206.0 - - - (35.0) - 171.0
382.0 25.4 97.2 112.6 (137.4) 42.5 522.3
Per Diluted share ($)
E&C 1.08 0.15 0.60 0.69 (0.63) 0.26 2.15
Capital 1.26 - - - (0.21) - 1.05
2.34 0.15 0.60 0.69 (0.84) 0.26 3.20
Year Ended December 31, 2016In M$
E&C 46.3 77.62 3.4 54.5 44.6 - 226.4
Capital 209.2 - - - (48.5) - 160.7
255.5 77.6 3.4 54.5 (3.9) - 387.1
Per Diluted share ($)
E&C 0.31 0.52 0.02 0.36 0.30 - 1.51
Capital 1.39 - - - (0.32) - 1.07
1.70 0.52 0.02 0.36 (0.02) - 2.58
Acquisition-related costs
and integration costs
Amortization of intangible
assets related to business
combinations
32
1This amount includes $5.1 million ($5.3 million after taxes) of net charges which did not meet the restructuring costs definition in accordance with IFRS.2This amount includes a net reversal of $4.2 million ($6.0 million after taxes) of charges which did not meet the restructuring costs definition in accordance with IFRS.
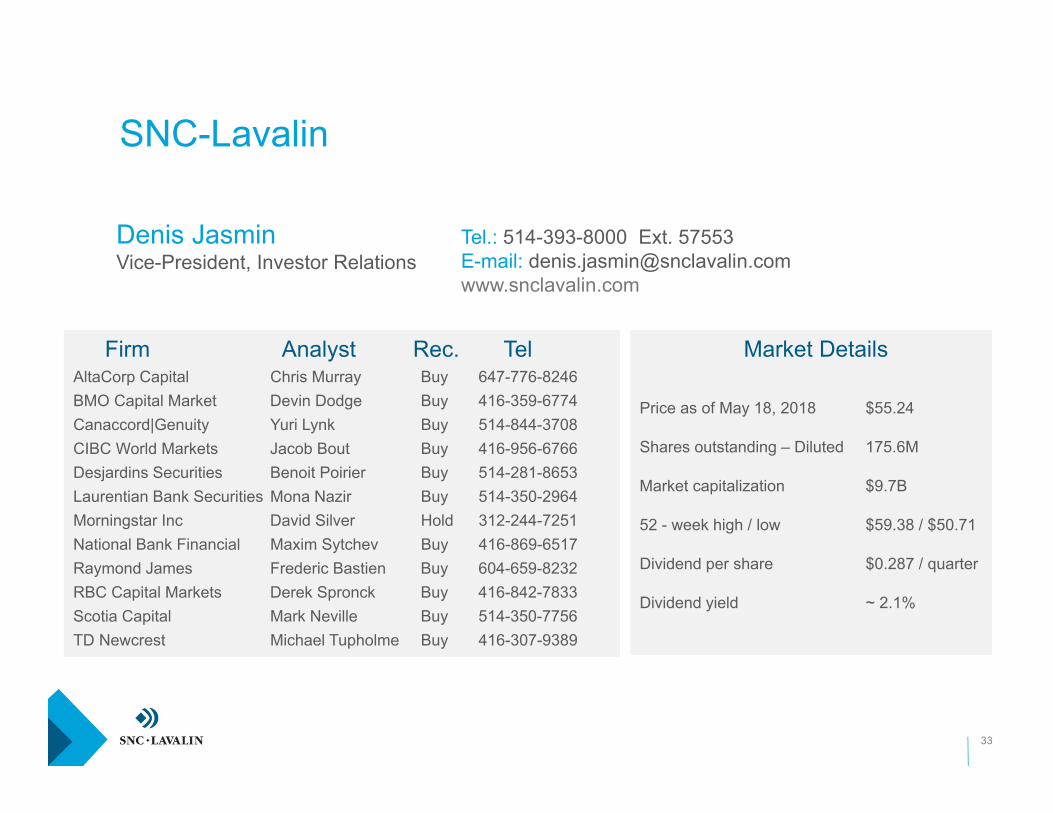
Firm Analyst Rec. TelAltaCorp Capital Chris Murray Buy 647-776-8246BMO Capital Market Devin Dodge Buy 416-359-6774Canaccord|Genuity Yuri Lynk Buy 514-844-3708CIBC World Markets Jacob Bout Buy 416-956-6766Desjardins Securities Benoit Poirier Buy 514-281-8653Laurentian Bank Securities Mona Nazir Buy 514-350-2964Morningstar Inc David Silver Hold 312-244-7251National Bank Financial Maxim Sytchev Buy 416-869-6517Raymond James Frederic Bastien Buy 604-659-8232RBC Capital Markets Derek Spronck Buy 416-842-7833Scotia Capital Mark Neville Buy 514-350-7756TD Newcrest Michael Tupholme Buy 416-307-9389
Price as of May 18, 2018 $55.24
Shares outstanding – Diluted 175.6M
Market capitalization $9.7B
52 - week high / low $59.38 / $50.71
Dividend per share $0.287 / quarter
Dividend yield ~ 2.1%
33
Tel.: 514-393-8000 Ext. 57553E-mail: [email protected]
SNC-Lavalin
Denis JasminVice-President, Investor Relations
Market Details