Embed Size (px)
Citation preview
Albemarle CorporationInvestor Presentation
February 2019
2
Forward-Looking StatementsSome of the information presented in this presentation, the earnings conference call and discussions that follow, including, without limitation,
information related to outlook and guidance, conversion capacity, acquisitions and joint ventures market trends, pricing, expected growth, earnings
and demand for our products, tax rates, stock repurchases, dividends, cash flow generation, capital projects, economic trends and all other
information relating to matters that are not historical facts may constitute forward-looking statements within the meaning of the Private Securities
Litigation Reform Act of 1995. Actual results could differ materially from the views expressed.
Factors that could cause actual results to differ materially from the outlook expressed or implied in any forward-looking statement include, without
limitation: changes in economic and business conditions; changes in financial and operating performance of our major customers and industries
and markets served by us; the timing of orders received from customers; the gain or loss of significant customers; competition from other
manufacturers; changes in the demand for our products or the end-user markets in which our products are sold; limitations or prohibitions on the
manufacture and sale of our products; availability of raw materials; increases in the cost of raw materials and energy, and our ability to pass
through such increases to our customers; changes in our markets in general; fluctuations in foreign currencies; changes in laws and government
regulation impacting our operations or our products; the occurrence of regulatory actions, proceedings, claims or litigation; the occurrence of cyber-
security breaches, terrorist attacks, industrial accidents, natural disasters or climate change; the inability to maintain current levels of product or
premises liability insurance or the denial of such coverage; regulatory approvals and the satisfaction of other closing conditions with respect to
pending acquisitions; political unrest affecting the global economy, including adverse effects form terrorism or hostilities; political instability
affecting our manufacturing operations or joint ventures; changes in accounting standards; the inability to achieve results from our global
manufacturing cost reduction initiatives as well as our ongoing continuous improvement and rationalization programs; changes in the jurisdictional
mix of our earnings and changes in tax laws and rates; changes in monetary policies, inflation or interest rates that may impact our ability to raise
capital or increase our cost of funds, impact the performance of our pension fund investments and increase our pension expense and funding
obligations; volatility and uncertainties in the debt and equity markets; technology or intellectual property infringement, including cyber-security
breaches, and other innovation risks; decisions we may make in the future; the ability to successfully execute, operate and integrate acquisitions
and divestitures; and the other factors detailed from time to time in the reports we file with the SEC, including those described under “Risk Factors”
in our Annual Report on Form 10-K and our Quarterly Reports on Form 10-Q. These forward-looking statements speak only as of the date of this
presentation. We assume no obligation to provide any revisions to any forward-looking statements should circumstances change, except as
otherwise required by securities and other applicable laws.
3
Non-GAAP Financial Measures
It should be noted that Adjusted net income attributable to Albemarle Corporation (“Adjusted earnings”), Adjusted diluted earnings per share
attributable to Albemarle Corporation, Adjusted effective income tax rates, segment operating profit, segment income, pro-forma net sales, net
sales excluding the impact of foreign exchange translation ("ex FX"), EBITDA, Adj. EBITDA, Adj. EBITDA by operating segment, EBITDA margin,
Adj. EBITDA margin, pro-forma Adj. EBITDA, pro-forma Adj. EBITDA margin, Adj. EBITDA excluding the impact of foreign exchange translation
("ex FX"), Adj. EBITDA margin excluding the impact of foreign exchange translation ("ex FX"), net debt to Adj. EBITDA, gross debt to Adj.
EBITDA, free cash flow, and Adjusted free cash flow are financial measures that are not required by, or presented in accordance with, accounting
principles generally accepted in the United States, or GAAP. These measures are presented here to provide additional useful measurements to
review our operations, provide transparency to investors and enable period-to-period comparability of financial performance. The Company’s chief
operating decision maker uses these measures to assess the ongoing performance of the Company and its segments, as well as for business and
enterprise planning purposes.
A description of these and other non-GAAP financial measures that we use to evaluate our operations and financial performance, and
reconciliation of these non-GAAP financial measures to the most directly comparable financial measures calculated and reported in accordance
with GAAP, can be found in the Appendix to this presentation. The Company does not provide a reconciliation of forward looking non-GAAP
financial measures to the most directly comparable financial measures calculated and reported in accordance with GAAP, as the Company is
unable to estimate significant non-recurring or unusual items without unreasonable effort. The amounts and timing of these items are uncertain
and could be material to the Company's results calculated in accordance with GAAP.
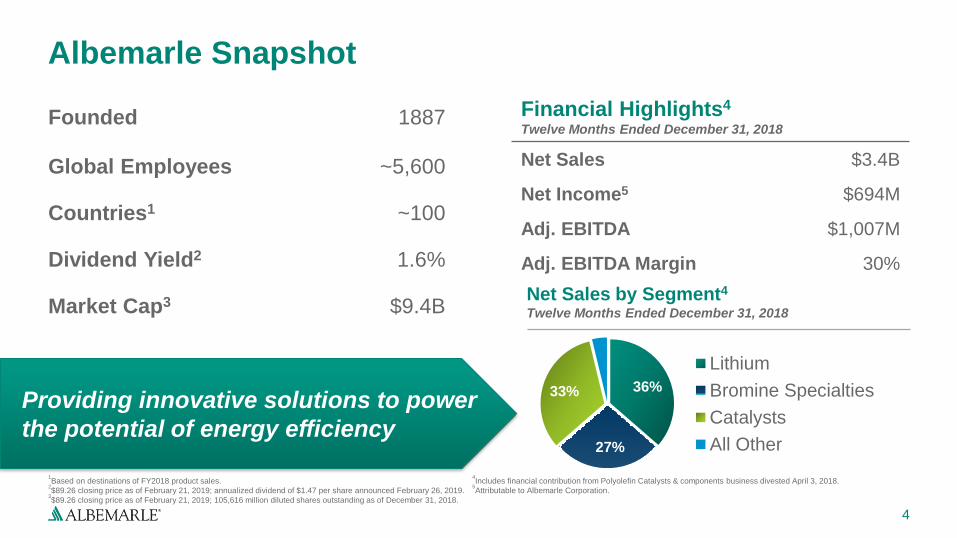
Founded 1887
Global Employees ~5,600
Countries1 ~100
Dividend Yield2 1.6%
Market Cap3 $9.4B
36%
27%
33%
Lithium
Bromine Specialties
Catalysts
All Other
Financial Highlights4
Twelve Months Ended December 31, 2018
Net Sales $3.4B
Net Income5 $694M
Adj. EBITDA $1,007M
Adj. EBITDA Margin 30%
4
Albemarle Snapshot
Net Sales by Segment4
Twelve Months Ended December 31, 2018
1Based on destinations of FY2018 product sales.
2$89.26 closing price as of February 21, 2019; annualized dividend of $1.47 per share announced February 26, 2019.
3$89.26 closing price as of February 21, 2019; 105,616 million diluted shares outstanding as of December 31, 2018.
4Includes financial contribution from Polyolefin Catalysts & components business divested April 3, 2018.
5Attributable to Albemarle Corporation.
Providing innovative solutions to power
the potential of energy efficiency
5
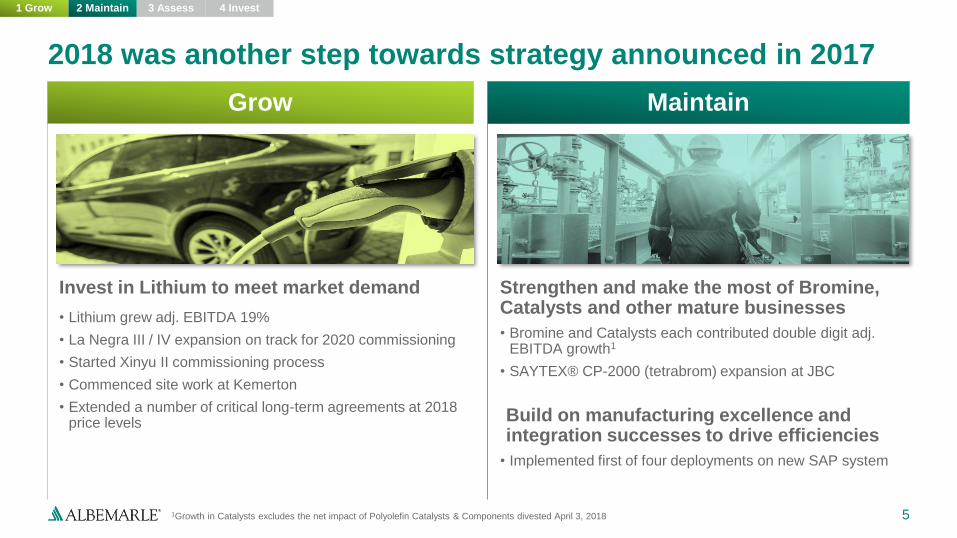
2018 was another step towards strategy announced in 2017
1Growth in Catalysts excludes the net impact of Polyolefin Catalysts & Components divested April 3, 2018
Invest in Lithium to meet market demand
• Lithium grew adj. EBITDA 19%
• La Negra III / IV expansion on track for 2020 commissioning
• Started Xinyu II commissioning process
• Commenced site work at Kemerton
• Extended a number of critical long-term agreements at 2018 price levels
Grow
Strengthen and make the most of Bromine, Catalysts and other mature businesses
• Bromine and Catalysts each contributed double digit adj. EBITDA growth1
• SAYTEX® CP-2000 (tetrabrom) expansion at JBC
Build on manufacturing excellence and integration successes to drive efficiencies
• Implemented first of four deployments on new SAP system
Maintain
1 Grow 2 Maintain 3 Assess 4 Invest
6
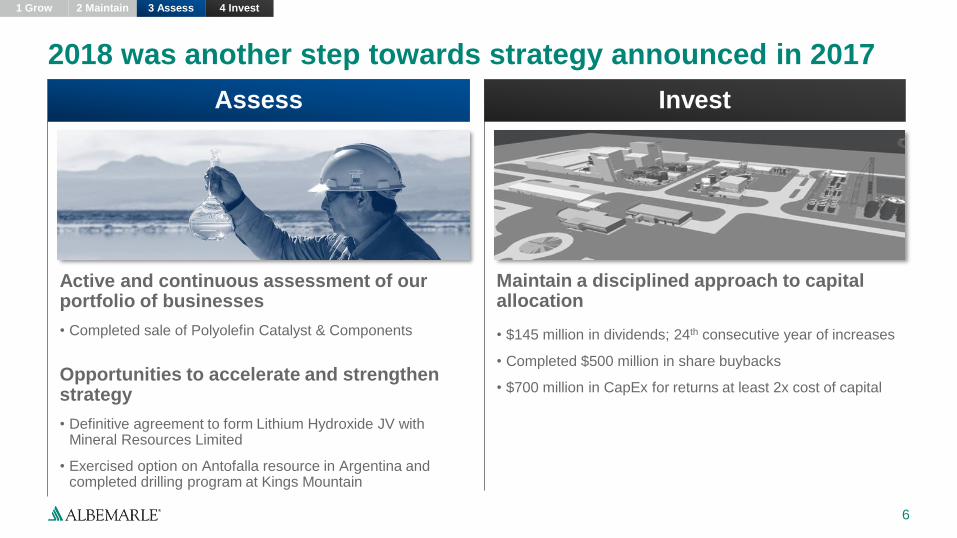
2018 was another step towards strategy announced in 2017
Active and continuous assessment of our portfolio of businesses
• Completed sale of Polyolefin Catalyst & Components
Opportunities to accelerate and strengthen strategy
• Definitive agreement to form Lithium Hydroxide JV with Mineral Resources Limited
• Exercised option on Antofalla resource in Argentina and completed drilling program at Kings Mountain
Assess
Maintain a disciplined approach to capital allocation
• $145 million in dividends; 24th consecutive year of increases
• Completed $500 million in share buybacks
• $700 million in CapEx for returns at least 2x cost of capital
Invest
1 Grow 2 Maintain 3 Assess 4 Invest
7
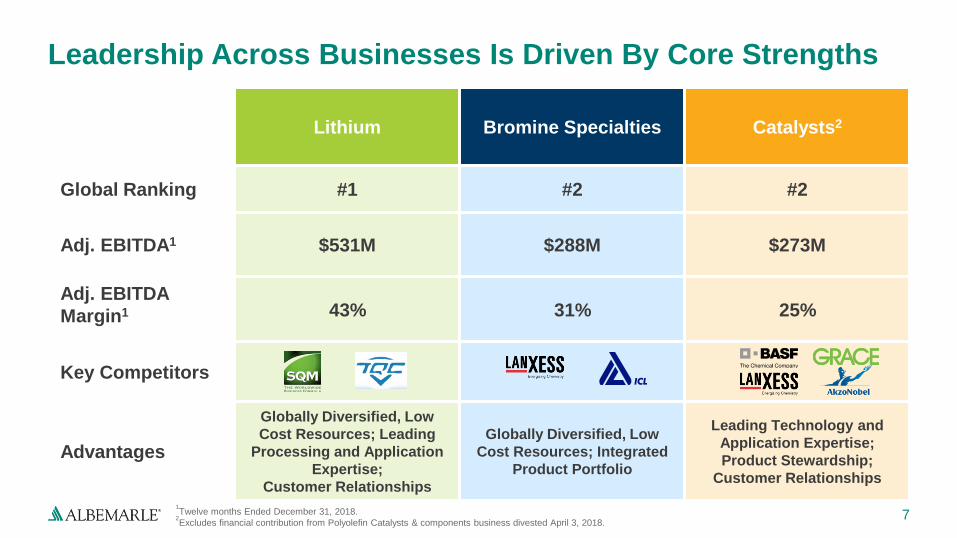
Leadership Across Businesses Is Driven By Core Strengths
Lithium Bromine Specialties Catalysts2
Global Ranking #1 #2 #2
Adj. EBITDA1 $531M $288M $273M
Adj. EBITDA
Margin1 43% 31% 25%
Key Competitors
Advantages
Globally Diversified, Low
Cost Resources; Leading
Processing and Application
Expertise;
Customer Relationships
Globally Diversified, Low
Cost Resources; Integrated
Product Portfolio
Leading Technology and
Application Expertise;
Product Stewardship;
Customer Relationships
1Twelve months Ended December 31, 2018.
2Excludes financial contribution from Polyolefin Catalysts & components business divested April 3, 2018.
Business EnvironmentApplications
8
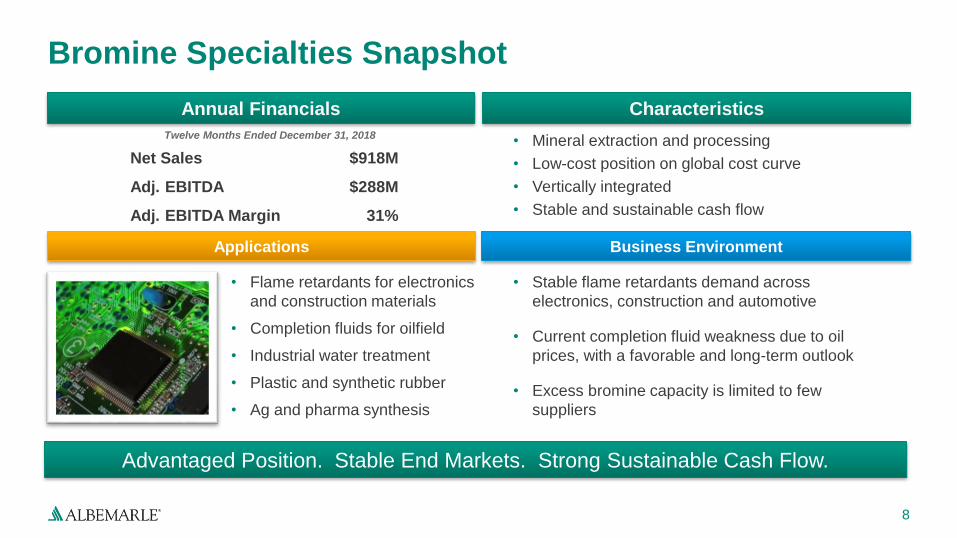
Bromine Specialties Snapshot
Characteristics
• Mineral extraction and processing
• Low-cost position on global cost curve
• Vertically integrated
• Stable and sustainable cash flow
• Stable flame retardants demand across
electronics, construction and automotive
• Current completion fluid weakness due to oil
prices, with a favorable and long-term outlook
• Excess bromine capacity is limited to few
suppliers
• Flame retardants for electronics
and construction materials
• Completion fluids for oilfield
• Industrial water treatment
• Plastic and synthetic rubber
• Ag and pharma synthesis
Advantaged Position. Stable End Markets. Strong Sustainable Cash Flow.
Annual Financials
Net Sales $918M
Adj. EBITDA $288M
Adj. EBITDA Margin 31%
Twelve Months Ended December 31, 2018
9
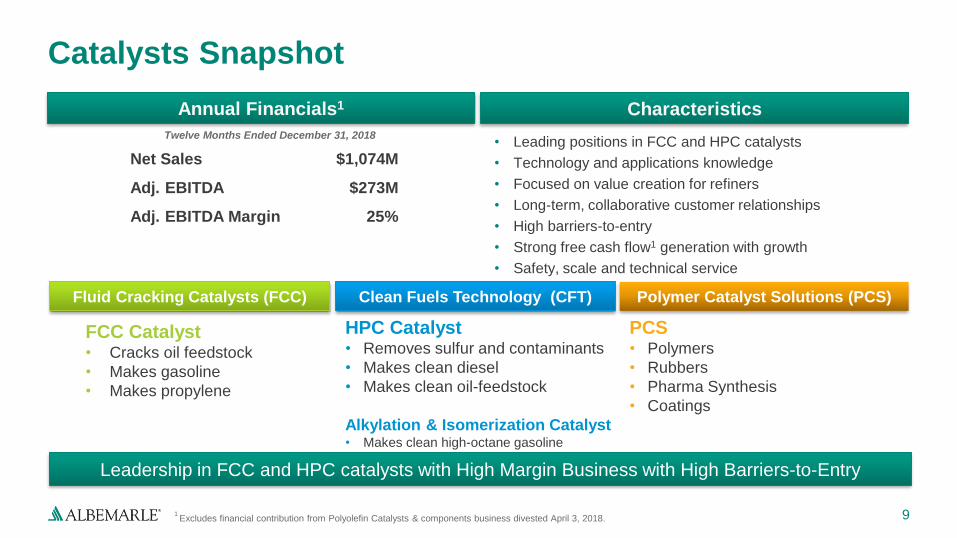
Catalysts Snapshot
Characteristics
• Leading positions in FCC and HPC catalysts
• Technology and applications knowledge
• Focused on value creation for refiners
• Long-term, collaborative customer relationships
• High barriers-to-entry
• Strong free cash flow1 generation with growth
• Safety, scale and technical service
FCC Catalyst• Cracks oil feedstock
• Makes gasoline
• Makes propylene
Fluid Cracking Catalysts (FCC) Clean Fuels Technology (CFT)
Leadership in FCC and HPC catalysts with High Margin Business with High Barriers-to-Entry
HPC Catalyst• Removes sulfur and contaminants
• Makes clean diesel
• Makes clean oil-feedstock
Alkylation & Isomerization Catalyst• Makes clean high-octane gasoline
Polymer Catalyst Solutions (PCS)
PCS• Polymers
• Rubbers
• Pharma Synthesis
• Coatings
1 Excludes financial contribution from Polyolefin Catalysts & components business divested April 3, 2018.
Annual Financials1
Net Sales $1,074M
Adj. EBITDA $273M
Adj. EBITDA Margin 25%
Twelve Months Ended December 31, 2018
10
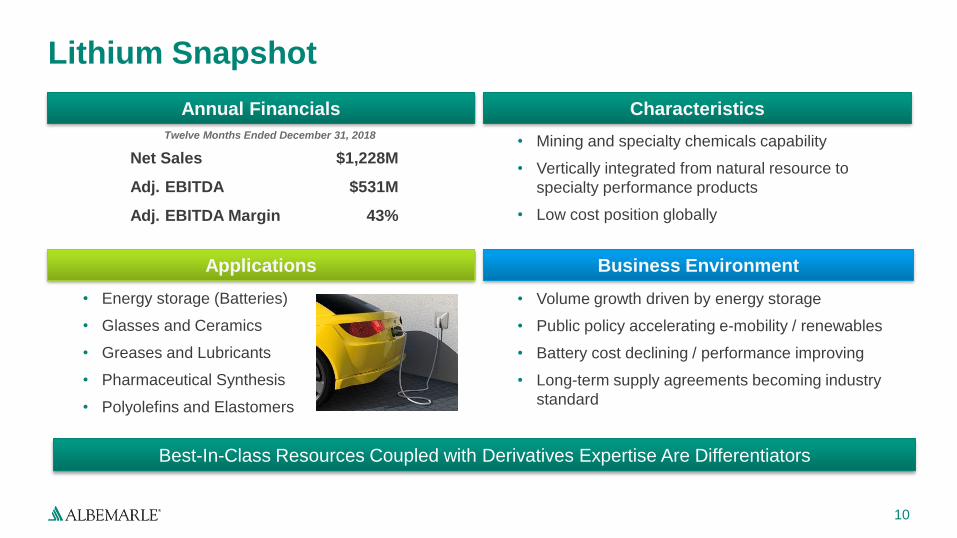
Lithium Snapshot
Characteristics
• Mining and specialty chemicals capability
• Vertically integrated from natural resource to
specialty performance products
• Low cost position globally
• Volume growth driven by energy storage
• Public policy accelerating e-mobility / renewables
• Battery cost declining / performance improving
• Long-term supply agreements becoming industry
standard
• Energy storage (Batteries)
• Glasses and Ceramics
• Greases and Lubricants
• Pharmaceutical Synthesis
• Polyolefins and Elastomers
Applications Business Environment
Best-In-Class Resources Coupled with Derivatives Expertise Are Differentiators
Annual Financials
Net Sales $1,228M
Adj. EBITDA $531M
Adj. EBITDA Margin 43%
Twelve Months Ended December 31, 2018
11
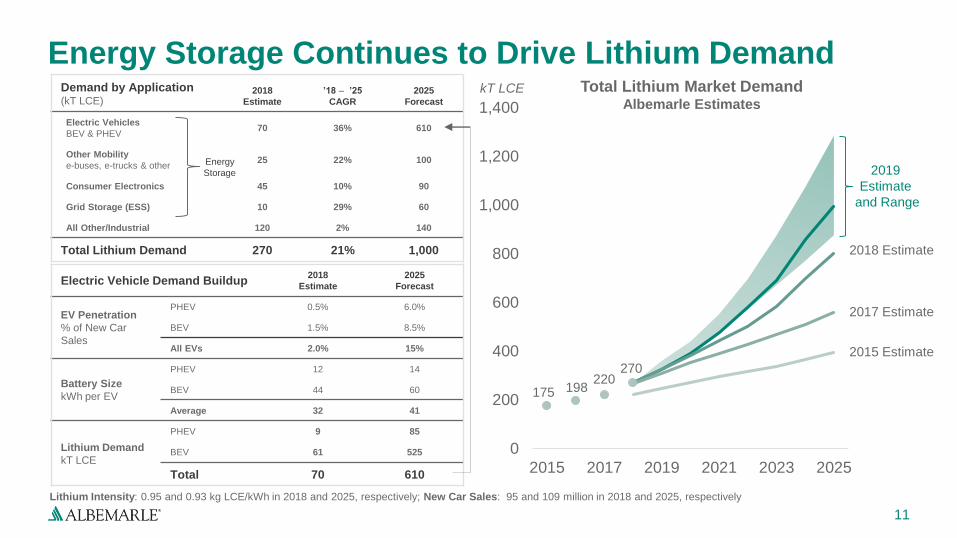
Energy Storage Continues to Drive Lithium Demand
175 198220
270
0
200
400
600
800
1,000
1,200
1,400
2015 2017 2019 2021 2023 2025
2017 Estimate
2018 Estimate
2019
Estimate
and Range
kT LCEDemand by Application(kT LCE)
2018
Estimate
’18 – ’25
CAGR
2025
Forecast
Electric Vehicles
BEV & PHEV70 36% 610
Other Mobility
e-buses, e-trucks & other25 22% 100
Consumer Electronics 45 10% 90
Grid Storage (ESS) 10 29% 60
All Other/Industrial 120 2% 140
Total Lithium Demand 270 21% 1,000
2015 Estimate
Electric Vehicle Demand Buildup2018
Estimate
2025
Forecast
EV Penetration
% of New Car
Sales
PHEV 0.5% 6.0%
BEV 1.5% 8.5%
All EVs 2.0% 15%
Battery Size
kWh per EV
PHEV 12 14
BEV 44 60
Average 32 41
Lithium Demand
kT LCE
PHEV 9 85
BEV 61 525
Total 70 610
Lithium Intensity: 0.95 and 0.93 kg LCE/kWh in 2018 and 2025, respectively; New Car Sales: 95 and 109 million in 2018 and 2025, respectively
Total Lithium Market DemandAlbemarle Estimates
Energy
Storage
-
20,000
40,000
60,000
80,000
100,000
120,000
140,000
160,000
180,000
2021 2025
Metr
ic T
on
s
12
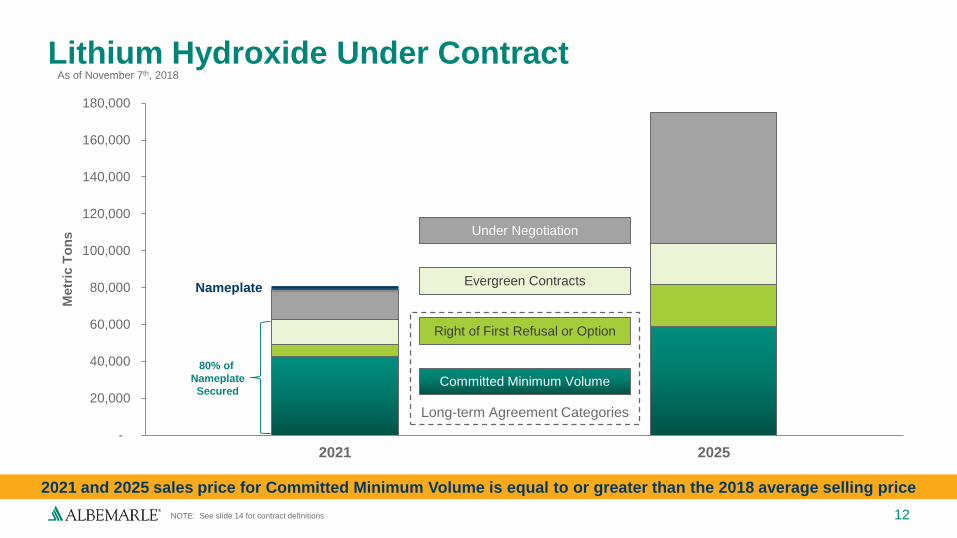
Lithium Hydroxide Under Contract
Nameplate
Committed Minimum Volume
Right of First Refusal or Option
Evergreen Contracts
Under Negotiation
80% of
Nameplate
Secured
2021 and 2025 sales price for Committed Minimum Volume is equal to or greater than the 2018 average selling price
NOTE: See slide 14 for contract definitions
Long-term Agreement Categories
As of November 7th, 2018
13
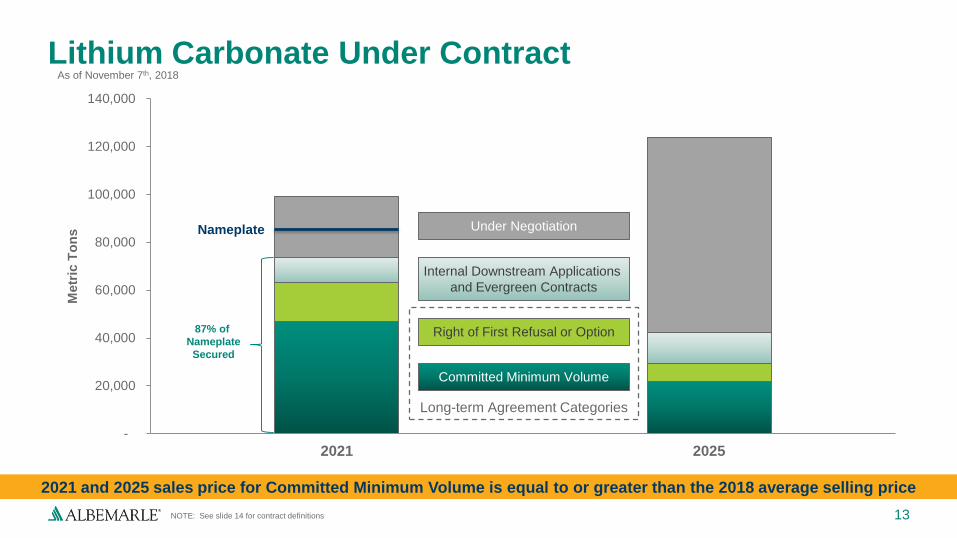
Lithium Carbonate Under Contract
-
20,000
40,000
60,000
80,000
100,000
120,000
140,000
2021 2025
Metr
ic T
on
s Nameplate
Committed Minimum Volume
Right of First Refusal or Option
Internal Downstream Applications
and Evergreen Contracts
Under Negotiation
87% of
Nameplate
Secured
Long-term Agreement Categories
2021 and 2025 sales price for Committed Minimum Volume is equal to or greater than the 2018 average selling price
As of November 7th, 2018
NOTE: See slide 14 for contract definitions
14
Lithium Contract Definitions
Committed Minimum Volume: The minimum volume that customer has committed to purchase under long-term
agreement.
Right of First Refusal (ROFR): If customer has demand above the Committed Minimum Volume, it must offer
that volume to Albemarle. Albemarle has the option, but is not required, to supply this volume.
Option: Customer demand above the Committed Minimum Volume and ROFR categories. Albemarle has the
option, but is not required, to supply this volume.
Evergreen Contracts: One to two-year contracts with customers (the majority for use in greases, ceramics and
lubricants) with evergreen provisions, many of which have already extended beyond their initial term. Contracts with
evergreen provisions are automatically renewed (rolled over) after the then expiring term until cancelled by either party.
Internal Downstream Applications: Lithium volume that is converted by Albemarle to downstream derivatives
such as lithium hydroxide, butyl lithium, lithium metal and lithium halides.
15
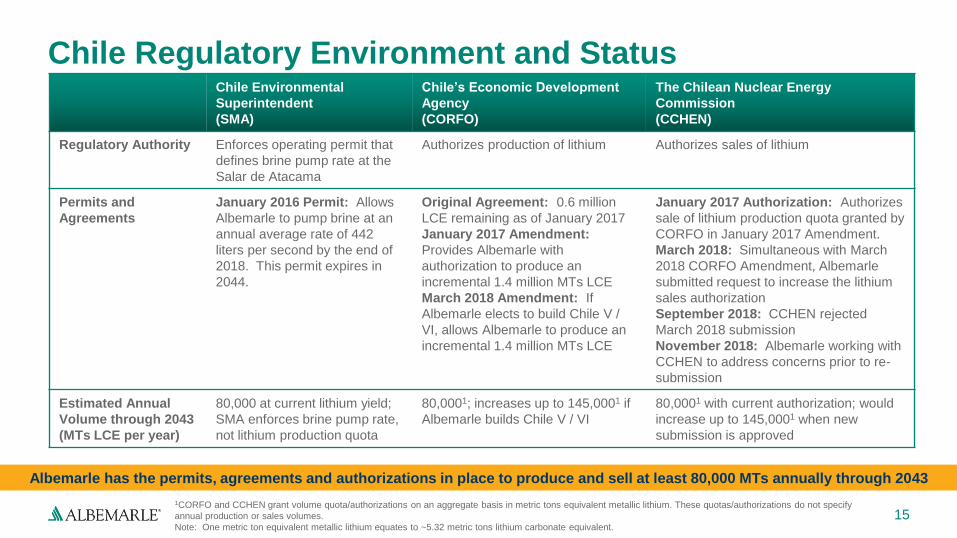
Chile Regulatory Environment and StatusChile Environmental
Superintendent
(SMA)
Chile’s Economic Development
Agency
(CORFO)
The Chilean Nuclear Energy
Commission
(CCHEN)
Regulatory Authority Enforces operating permit that
defines brine pump rate at the
Salar de Atacama
Authorizes production of lithium Authorizes sales of lithium
Permits and
Agreements
January 2016 Permit: Allows
Albemarle to pump brine at an
annual average rate of 442
liters per second by the end of
2018. This permit expires in
2044.
Original Agreement: 0.6 million
LCE remaining as of January 2017
January 2017 Amendment:
Provides Albemarle with
authorization to produce an
incremental 1.4 million MTs LCE
March 2018 Amendment: If
Albemarle elects to build Chile V /
VI, allows Albemarle to produce an
incremental 1.4 million MTs LCE
January 2017 Authorization: Authorizes
sale of lithium production quota granted by
CORFO in January 2017 Amendment.
March 2018: Simultaneous with March
2018 CORFO Amendment, Albemarle
submitted request to increase the lithium
sales authorization
September 2018: CCHEN rejected
March 2018 submission
November 2018: Albemarle working with
CCHEN to address concerns prior to re-
submission
Estimated Annual
Volume through 2043
(MTs LCE per year)
80,000 at current lithium yield;
SMA enforces brine pump rate,
not lithium production quota
80,0001; increases up to 145,0001 if
Albemarle builds Chile V / VI
80,0001 with current authorization; would
increase up to 145,0001 when new
submission is approved
1CORFO and CCHEN grant volume quota/authorizations on an aggregate basis in metric tons equivalent metallic lithium. These quotas/authorizations do not specify
annual production or sales volumes.
Note: One metric ton equivalent metallic lithium equates to ~5.32 metric tons lithium carbonate equivalent.
Albemarle has the permits, agreements and authorizations in place to produce and sell at least 80,000 MTs annually through 2043
16
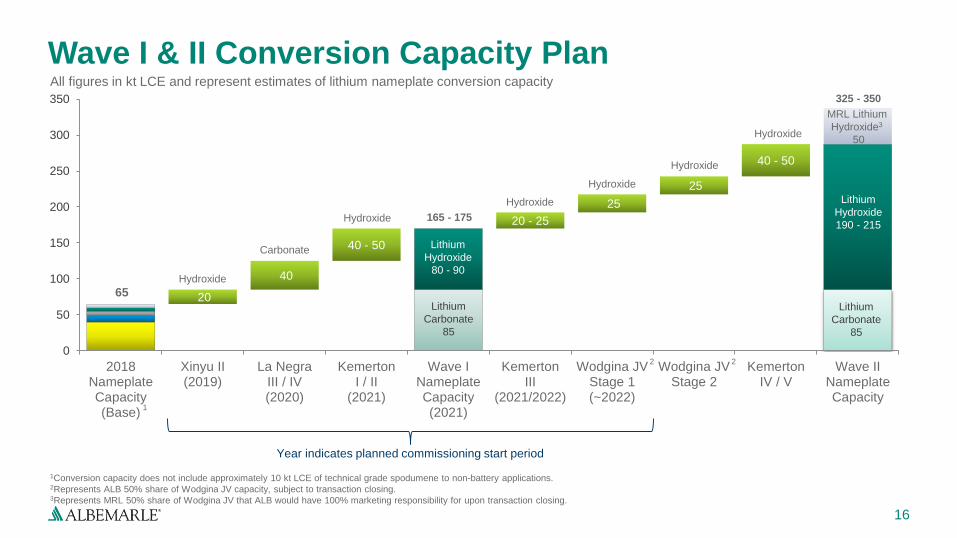
Wave I & II Conversion Capacity Plan
20
40
40 - 50
20 - 25
25
25
40 - 50
0
50
100
150
200
250
300
350
2018NameplateCapacity(Base)
Xinyu II(2019)
La NegraIII / IV(2020)
KemertonI / II
(2021)
Wave INameplateCapacity(2021)
KemertonIII
(2021/2022)
Wodgina JVStage 1(~2022)
Wodgina JVStage 2
KemertonIV / V
Wave IINameplateCapacity
1
1Conversion capacity does not include approximately 10 kt LCE of technical grade spodumene to non-battery applications.2Represents ALB 50% share of Wodgina JV capacity, subject to transaction closing.3Represents MRL 50% share of Wodgina JV that ALB would have 100% marketing responsibility for upon transaction closing.
Hydroxide
Carbonate
Hydroxide
Hydroxide
Year indicates planned commissioning start period
65
All figures in kt LCE and represent estimates of lithium nameplate conversion capacity
Hydroxide
Lithium
Hydroxide
80 - 90
Lithium
Carbonate
85
165 - 175
Lithium
Hydroxide
190 - 215
Lithium
Carbonate
85
325 - 350
Hydroxide
2
Hydroxide
2
MRL Lithium
Hydroxide3
50
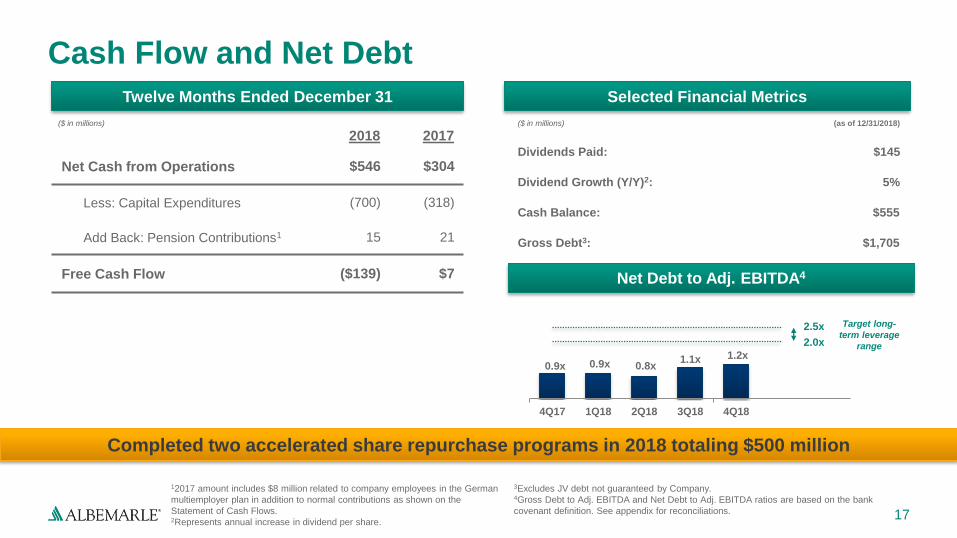
0.9x 0.9x 0.8x 1.1x 1.2x
2.0x
2.5x
4Q17 1Q18 2Q18 3Q18 4Q18
Dividends Paid: $145
Dividend Growth (Y/Y)2: 5%
Cash Balance: $555
Gross Debt3: $1,705
2018 2017
Net Cash from Operations $546 $304
Less: Capital Expenditures (700) (318)
Add Back: Pension Contributions1 15 21
Free Cash Flow ($139) $7
17
Cash Flow and Net Debt
(as of 12/31/2018)
12017 amount includes $8 million related to company employees in the German
multiemployer plan in addition to normal contributions as shown on the
Statement of Cash Flows.2Represents annual increase in dividend per share.
($ in millions)
Twelve Months Ended December 31 Selected Financial Metrics
($ in millions)
Net Debt to Adj. EBITDA4
Target long-
term leverage
range
3Excludes JV debt not guaranteed by Company. 4Gross Debt to Adj. EBITDA and Net Debt to Adj. EBITDA ratios are based on the bank
covenant definition. See appendix for reconciliations.
Completed two accelerated share repurchase programs in 2018 totaling $500 million
18
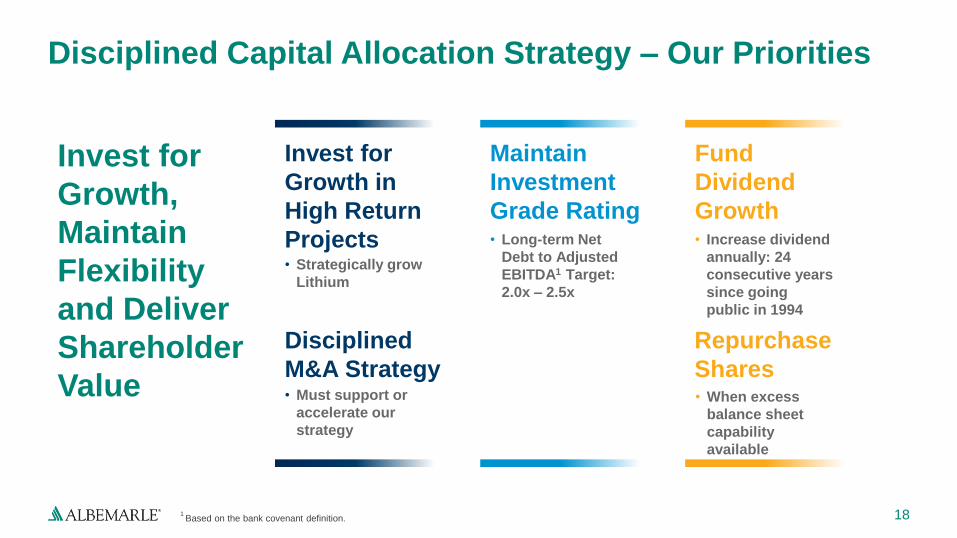
Disciplined Capital Allocation Strategy – Our Priorities
Invest for
Growth in
High Return
Projects
Maintain
Investment
Grade Rating
Fund
Dividend
Growth
• Strategically grow
Lithium
• Long-term Net
Debt to Adjusted
EBITDA1 Target:
2.0x – 2.5x
• Increase dividend
annually: 24
consecutive years
since going
public in 1994
Invest for
Growth,
Maintain
Flexibility
and Deliver
Shareholder
Value
Disciplined
M&A Strategy• Must support or
accelerate our
strategy
1 Based on the bank covenant definition.
Repurchase
Shares• When excess
balance sheet
capability
available

19
Albemarle Is Well Positioned to Maximize Long-
Term Shareholder Value Creation
Multi-year journey has resulted in a more focused and growth-oriented portfolio underpinned by energy efficiency macro drivers
Clear strategy with the people, cash generation and resources necessary to ….execute the strategy
Experienced and focused management team with clear deliverables
Actively managing our portfolio in a disciplined and focused manner to drive shareholder value
Strong balance sheet and disciplined approach to capital allocation with focus on highest returns (reinvestment, strategic acquisitions and returns to shareholders)
1
2
3
4
5
Appendix AGuidance as per Q4 2018 Earnings Released
February 20, 2019
21
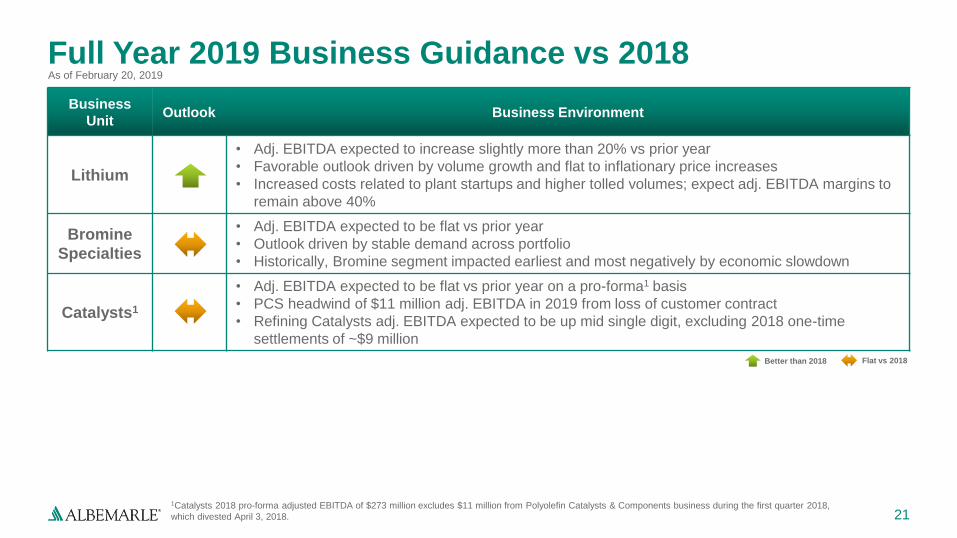
Full Year 2019 Business Guidance vs 2018
Business
UnitOutlook Business Environment
Lithium
• Adj. EBITDA expected to increase slightly more than 20% vs prior year
• Favorable outlook driven by volume growth and flat to inflationary price increases
• Increased costs related to plant startups and higher tolled volumes; expect adj. EBITDA margins to
remain above 40%
Bromine
Specialties
• Adj. EBITDA expected to be flat vs prior year
• Outlook driven by stable demand across portfolio
• Historically, Bromine segment impacted earliest and most negatively by economic slowdown
Catalysts1
• Adj. EBITDA expected to be flat vs prior year on a pro-forma1 basis
• PCS headwind of $11 million adj. EBITDA in 2019 from loss of customer contract
• Refining Catalysts adj. EBITDA expected to be up mid single digit, excluding 2018 one-time
settlements of ~$9 million
Better than 2018
1Catalysts 2018 pro-forma adjusted EBITDA of $273 million excludes $11 million from Polyolefin Catalysts & Components business during the first quarter 2018,
which divested April 3, 2018.
Flat vs 2018
As of February 20, 2019
22
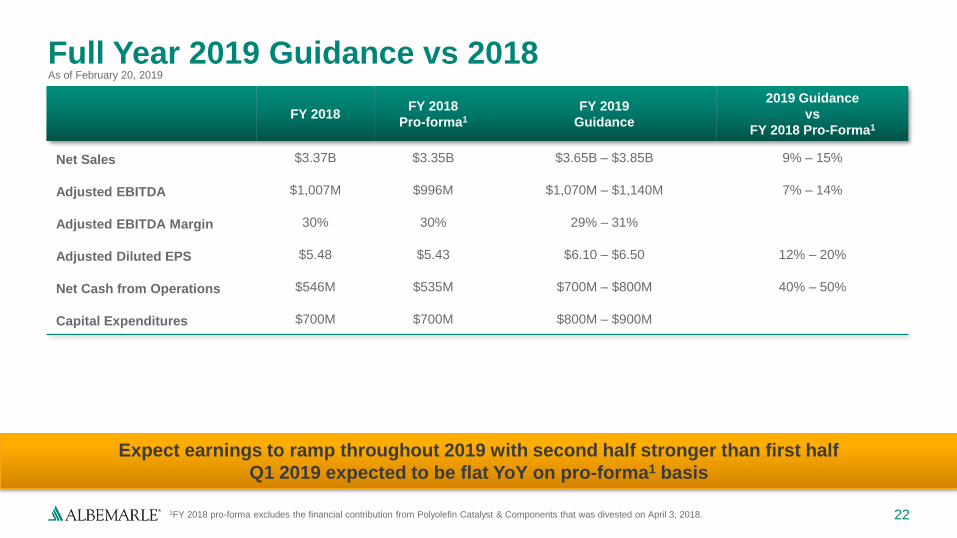
Full Year 2019 Guidance vs 2018
FY 2018FY 2018
Pro-forma1
FY 2019
Guidance
2019 Guidance
vs
FY 2018 Pro-Forma1
Net Sales $3.37B $3.35B $3.65B – $3.85B 9% – 15%
Adjusted EBITDA $1,007M $996M $1,070M – $1,140M 7% – 14%
Adjusted EBITDA Margin 30% 30% 29% – 31%
Adjusted Diluted EPS $5.48 $5.43 $6.10 – $6.50 12% – 20%
Net Cash from Operations $546M $535M $700M – $800M 40% – 50%
Capital Expenditures $700M $700M $800M – $900M
1FY 2018 pro-forma excludes the financial contribution from Polyolefin Catalyst & Components that was divested on April 3, 2018.
Expect earnings to ramp throughout 2019 with second half stronger than first half
Q1 2019 expected to be flat YoY on pro-forma1 basis
As of February 20, 2019
23
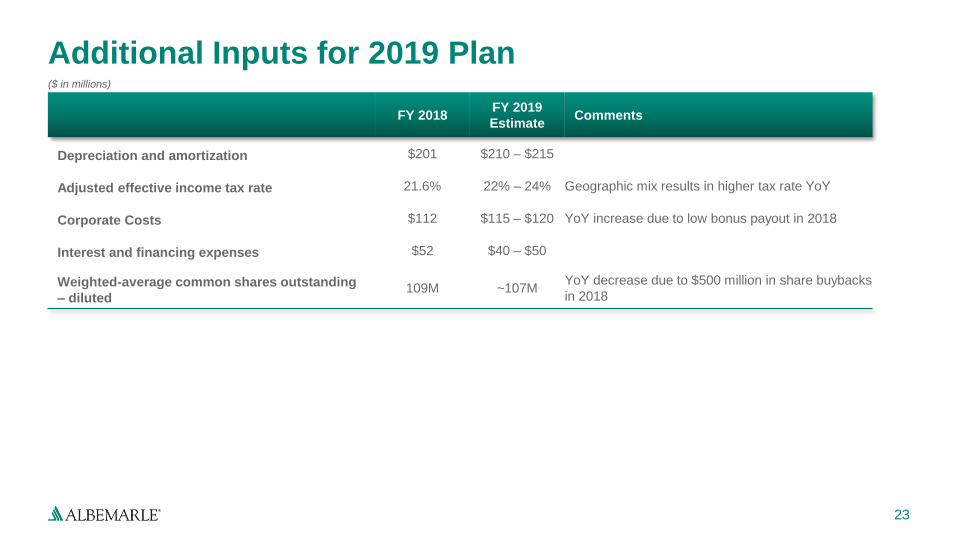
Additional Inputs for 2019 Plan
FY 2018FY 2019
EstimateComments
Depreciation and amortization $201 $210 – $215
Adjusted effective income tax rate 21.6% 22% – 24% Geographic mix results in higher tax rate YoY
Corporate Costs $112 $115 – $120 YoY increase due to low bonus payout in 2018
Interest and financing expenses $52 $40 – $50
Weighted-average common shares outstanding
– diluted109M ~107M
YoY decrease due to $500 million in share buybacks
in 2018
($ in millions)

Appendix BNon-GAAP Reconciliations and
Supplemental Information
25
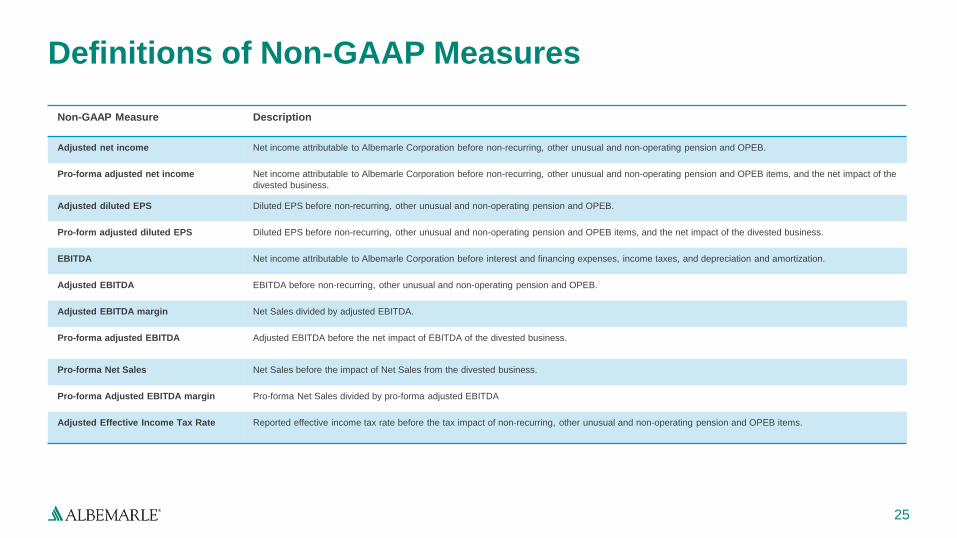
Definitions of Non-GAAP Measures
Non-GAAP Measure Description
Adjusted net income Net income attributable to Albemarle Corporation before non-recurring, other unusual and non-operating pension and OPEB.
Pro-forma adjusted net income Net income attributable to Albemarle Corporation before non-recurring, other unusual and non-operating pension and OPEB items, and the net impact of the
divested business.
Adjusted diluted EPS Diluted EPS before non-recurring, other unusual and non-operating pension and OPEB.
Pro-form adjusted diluted EPS Diluted EPS before non-recurring, other unusual and non-operating pension and OPEB items, and the net impact of the divested business.
EBITDA Net income attributable to Albemarle Corporation before interest and financing expenses, income taxes, and depreciation and amortization.
Adjusted EBITDA EBITDA before non-recurring, other unusual and non-operating pension and OPEB.
Adjusted EBITDA margin Net Sales divided by adjusted EBITDA.
Pro-forma adjusted EBITDA Adjusted EBITDA before the net impact of EBITDA of the divested business.
Pro-forma Net Sales Net Sales before the impact of Net Sales from the divested business.
Pro-forma Adjusted EBITDA margin Pro-forma Net Sales divided by pro-forma adjusted EBITDA
Adjusted Effective Income Tax Rate Reported effective income tax rate before the tax impact of non-recurring, other unusual and non-operating pension and OPEB items.
26
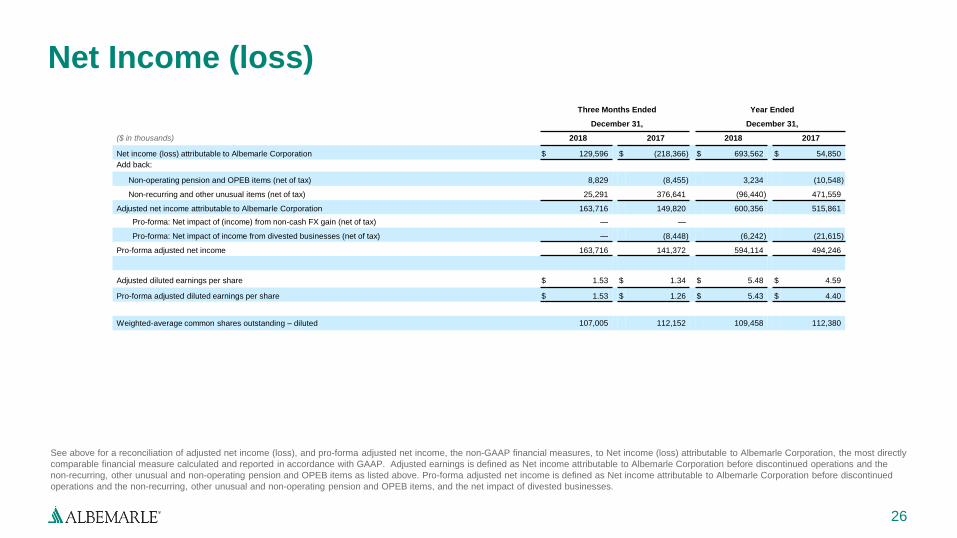
Net Income (loss)
See above for a reconciliation of adjusted net income (loss), and pro-forma adjusted net income, the non-GAAP financial measures, to Net income (loss) attributable to Albemarle Corporation, the most directly
comparable financial measure calculated and reported in accordance with GAAP. Adjusted earnings is defined as Net income attributable to Albemarle Corporation before discontinued operations and the
non-recurring, other unusual and non-operating pension and OPEB items as listed above. Pro-forma adjusted net income is defined as Net income attributable to Albemarle Corporation before discontinued
operations and the non-recurring, other unusual and non-operating pension and OPEB items, and the net impact of divested businesses.
Three Months Ended Year Ended
December 31, December 31,
($ in thousands) 2018 2017 2018 2017
Net income (loss) attributable to Albemarle Corporation $ 129,596 $ (218,366) $ 693,562 $ 54,850
Add back:
Non-operating pension and OPEB items (net of tax) 8,829 (8,455) 3,234 (10,548)
Non-recurring and other unusual items (net of tax) 25,291 376,641 (96,440) 471,559
Adjusted net income attributable to Albemarle Corporation 163,716 149,820 600,356 515,861
Pro-forma: Net impact of (income) from non-cash FX gain (net of tax) — —
Pro-forma: Net impact of income from divested businesses (net of tax) — (8,448) (6,242) (21,615)
Pro-forma adjusted net income 163,716 141,372 594,114 494,246
Adjusted diluted earnings per share $ 1.53 $ 1.34 $ 5.48 $ 4.59
Pro-forma adjusted diluted earnings per share $ 1.53 $ 1.26 $ 5.43 $ 4.40
Weighted-average common shares outstanding – diluted 107,005 112,152 109,458 112,380
27
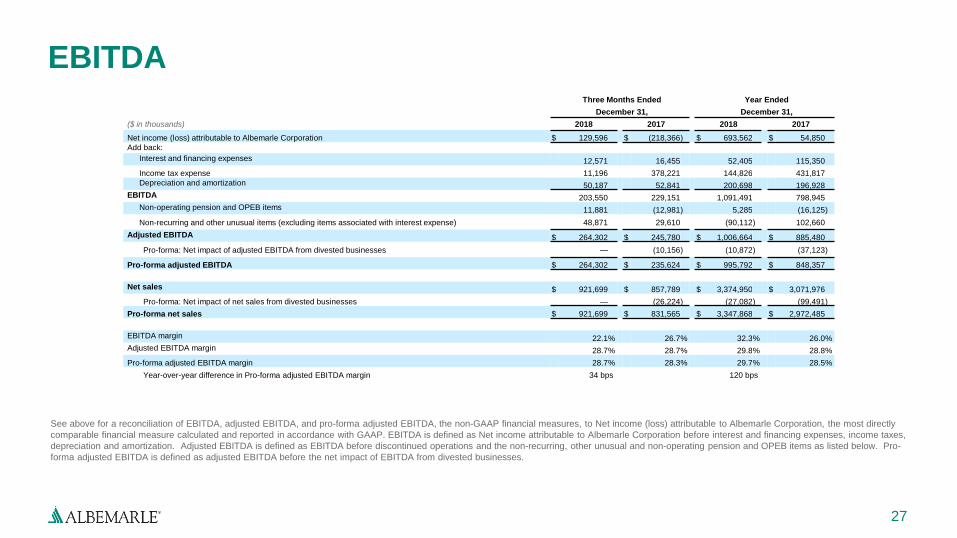
EBITDA
See above for a reconciliation of EBITDA, adjusted EBITDA, and pro-forma adjusted EBITDA, the non-GAAP financial measures, to Net income (loss) attributable to Albemarle Corporation, the most directly
comparable financial measure calculated and reported in accordance with GAAP. EBITDA is defined as Net income attributable to Albemarle Corporation before interest and financing expenses, income taxes,
depreciation and amortization. Adjusted EBITDA is defined as EBITDA before discontinued operations and the non-recurring, other unusual and non-operating pension and OPEB items as listed below. Pro-
forma adjusted EBITDA is defined as adjusted EBITDA before the net impact of EBITDA from divested businesses.
Three Months Ended Year Ended
December 31, December 31,
($ in thousands) 2018 2017 2018 2017
Net income (loss) attributable to Albemarle Corporation $ 129,596 $ (218,366) $ 693,562 $ 54,850
Add back:
Interest and financing expenses 12,571 16,455 52,405 115,350
Income tax expense 11,196 378,221 144,826 431,817
Depreciation and amortization 50,187 52,841 200,698 196,928
EBITDA 203,550 229,151 1,091,491 798,945
Non-operating pension and OPEB items 11,881 (12,981) 5,285 (16,125)
Non-recurring and other unusual items (excluding items associated with interest expense) 48,871 29,610 (90,112) 102,660
Adjusted EBITDA $ 264,302 $ 245,780 $ 1,006,664 $ 885,480
Pro-forma: Net impact of adjusted EBITDA from divested businesses — (10,156) (10,872) (37,123)
Pro-forma adjusted EBITDA $ 264,302 $ 235,624 $ 995,792 $ 848,357
Net sales $ 921,699 $ 857,789 $ 3,374,950 $ 3,071,976
Pro-forma: Net impact of net sales from divested businesses — (26,224) (27,082) (99,491)
Pro-forma net sales $ 921,699 $ 831,565 $ 3,347,868 $ 2,972,485
EBITDA margin 22.1% 26.7% 32.3% 26.0%
Adjusted EBITDA margin 28.7% 28.7% 29.8% 28.8%
Pro-forma adjusted EBITDA margin 28.7% 28.3% 29.7% 28.5%
Year-over-year difference in Pro-forma adjusted EBITDA margin 34 bps 120 bps
28
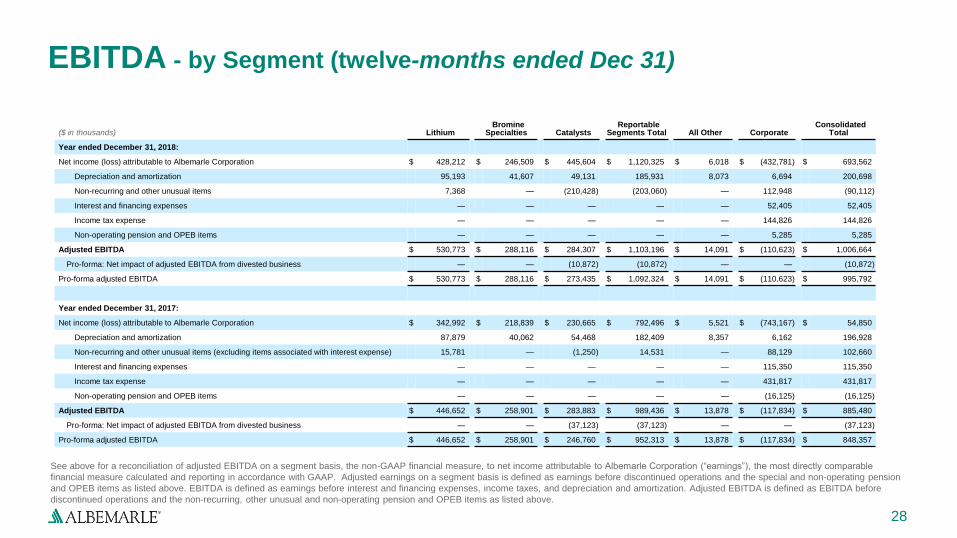
EBITDA - by Segment (twelve-months ended Dec 31)
See above for a reconciliation of adjusted EBITDA on a segment basis, the non-GAAP financial measure, to net income attributable to Albemarle Corporation (“earnings”), the most directly comparable
financial measure calculated and reporting in accordance with GAAP. Adjusted earnings on a segment basis is defined as earnings before discontinued operations and the special and non-operating pension
and OPEB items as listed above. EBITDA is defined as earnings before interest and financing expenses, income taxes, and depreciation and amortization. Adjusted EBITDA is defined as EBITDA before
discontinued operations and the non-recurring, other unusual and non-operating pension and OPEB items as listed above.
($ in thousands) LithiumBromine
Specialties CatalystsReportable
Segments Total All Other CorporateConsolidated
Total
Year ended December 31, 2018:
Net income (loss) attributable to Albemarle Corporation $ 428,212 $ 246,509 $ 445,604 $ 1,120,325 $ 6,018 $ (432,781) $ 693,562
Depreciation and amortization 95,193 41,607 49,131 185,931 8,073 6,694 200,698
Non-recurring and other unusual items 7,368 — (210,428) (203,060) — 112,948 (90,112)
Interest and financing expenses — — — — — 52,405 52,405
Income tax expense — — — — — 144,826 144,826
Non-operating pension and OPEB items — — — — — 5,285 5,285
Adjusted EBITDA $ 530,773 $ 288,116 $ 284,307 $ 1,103,196 $ 14,091 $ (110,623) $ 1,006,664
Pro-forma: Net impact of adjusted EBITDA from divested business — — (10,872) (10,872) — — (10,872)
Pro-forma adjusted EBITDA $ 530,773 $ 288,116 $ 273,435 $ 1,092,324 $ 14,091 $ (110,623) $ 995,792
Year ended December 31, 2017:
Net income (loss) attributable to Albemarle Corporation $ 342,992 $ 218,839 $ 230,665 $ 792,496 $ 5,521 $ (743,167) $ 54,850
Depreciation and amortization 87,879 40,062 54,468 182,409 8,357 6,162 196,928
Non-recurring and other unusual items (excluding items associated with interest expense) 15,781 — (1,250) 14,531 — 88,129 102,660
Interest and financing expenses — — — — — 115,350 115,350
Income tax expense — — — — — 431,817 431,817
Non-operating pension and OPEB items — — — — — (16,125) (16,125)
Adjusted EBITDA $ 446,652 $ 258,901 $ 283,883 $ 989,436 $ 13,878 $ (117,834) $ 885,480
Pro-forma: Net impact of adjusted EBITDA from divested business — — (37,123) (37,123) — — (37,123)
Pro-forma adjusted EBITDA $ 446,652 $ 258,901 $ 246,760 $ 952,313 $ 13,878 $ (117,834) $ 848,357
29
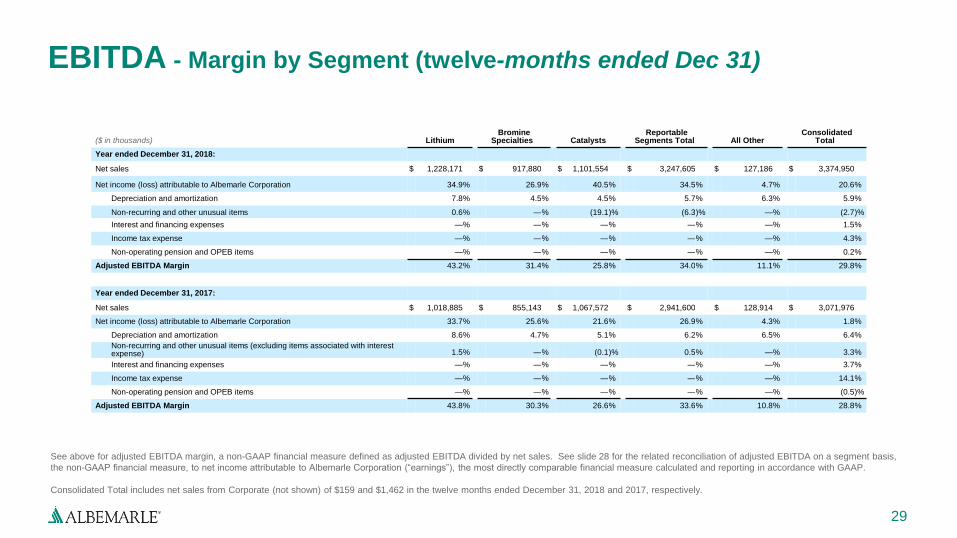
EBITDA - Margin by Segment (twelve-months ended Dec 31)
See above for adjusted EBITDA margin, a non-GAAP financial measure defined as adjusted EBITDA divided by net sales. See slide 28 for the related reconciliation of adjusted EBITDA on a segment basis,
the non-GAAP financial measure, to net income attributable to Albemarle Corporation (“earnings”), the most directly comparable financial measure calculated and reporting in accordance with GAAP.
Consolidated Total includes net sales from Corporate (not shown) of $159 and $1,462 in the twelve months ended December 31, 2018 and 2017, respectively.
($ in thousands) LithiumBromine
Specialties CatalystsReportable
Segments Total All OtherConsolidated
Total
Year ended December 31, 2018:
Net sales $ 1,228,171 $ 917,880 $ 1,101,554 $ 3,247,605 $ 127,186 $ 3,374,950
Net income (loss) attributable to Albemarle Corporation 34.9% 26.9% 40.5% 34.5% 4.7% 20.6%
Depreciation and amortization 7.8% 4.5% 4.5% 5.7% 6.3% 5.9%
Non-recurring and other unusual items 0.6% —% (19.1)% (6.3)% —% (2.7)%
Interest and financing expenses —% —% —% —% —% 1.5%
Income tax expense —% —% —% —% —% 4.3%
Non-operating pension and OPEB items —% —% —% —% —% 0.2%
Adjusted EBITDA Margin 43.2% 31.4% 25.8% 34.0% 11.1% 29.8%
Year ended December 31, 2017:
Net sales $ 1,018,885 $ 855,143 $ 1,067,572 $ 2,941,600 $ 128,914 $ 3,071,976
Net income (loss) attributable to Albemarle Corporation 33.7% 25.6% 21.6% 26.9% 4.3% 1.8%
Depreciation and amortization 8.6% 4.7% 5.1% 6.2% 6.5% 6.4%
Non-recurring and other unusual items (excluding items associated with interest expense) 1.5% —% (0.1)% 0.5% —% 3.3%
Interest and financing expenses —% —% —% —% —% 3.7%
Income tax expense —% —% —% —% —% 14.1%
Non-operating pension and OPEB items —% —% —% —% —% (0.5)%
Adjusted EBITDA Margin 43.8% 30.3% 26.6% 33.6% 10.8% 28.8%

30
EBITDA supplemental1
1 This supplemental is for net-debt-to-adjusted EBITDA ratio based on the bank covenant definition.
Twelve Months Ended($ in thousands) Three Months Ended
Dec 31, 2018 Dec 31, 2018 Sep 30, 2018 Jun 30, 2018 Mar 31, 2018
Adjusted EBITDA $ 1,006,664 $ 264,302 $ 235,082 $ 258,562 $ 248,718
Net income attributable to noncontrolling interests 45,577 16,453 13,734 8,225 7,165
Equity in net income of unconsolidated investments (net of tax) (89,264) (27,537) (22,081) (18,969) (20,677)
Dividends received from unconsolidated investments 57,415 24,621 2,749 4,583 25,462
Consolidated EBITDA $ 1,020,392 $ 277,839 $ 229,484 $ 252,401 $ 260,668
Total Long Term Debt (as reported) $ 1,705,210
Off balance sheet obligations and other 71,800
Consolidated Funded Debt $ 1,777,010
Less Cash 555,320
Consolidated Funded Net Debt $ 1,221,690
Consolidated Funded Debt to Consolidated EBITDA Ratio 1.7
Consolidated Funded Net Debt to Consolidated EBITDA Ratio 1.2
31
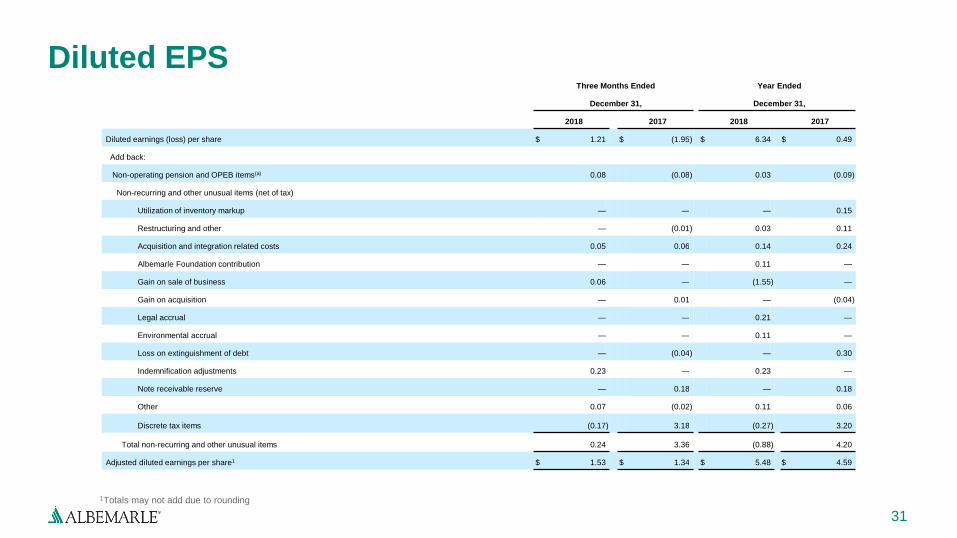
Diluted EPS
1Totals may not add due to rounding
Three Months Ended Year Ended
December 31, December 31,
2018 2017 2018 2017
Diluted earnings (loss) per share $ 1.21 $ (1.95) $ 6.34 $ 0.49
Add back:
Non-operating pension and OPEB items(a) 0.08 (0.08) 0.03 (0.09)
Non-recurring and other unusual items (net of tax)
Utilization of inventory markup — — — 0.15
Restructuring and other — (0.01) 0.03 0.11
Acquisition and integration related costs 0.05 0.06 0.14 0.24
Albemarle Foundation contribution — — 0.11 —
Gain on sale of business 0.06 — (1.55) —
Gain on acquisition — 0.01 — (0.04)
Legal accrual — — 0.21 —
Environmental accrual — — 0.11 —
Loss on extinguishment of debt — (0.04) — 0.30
Indemnification adjustments 0.23 — 0.23 —
Note receivable reserve — 0.18 — 0.18
Other 0.07 (0.02) 0.11 0.06
Discrete tax items (0.17) 3.18 (0.27) 3.20
Total non-recurring and other unusual items 0.24 3.36 (0.88) 4.20
Adjusted diluted earnings per share1 $ 1.53 $ 1.34 $ 5.48 $ 4.59
32
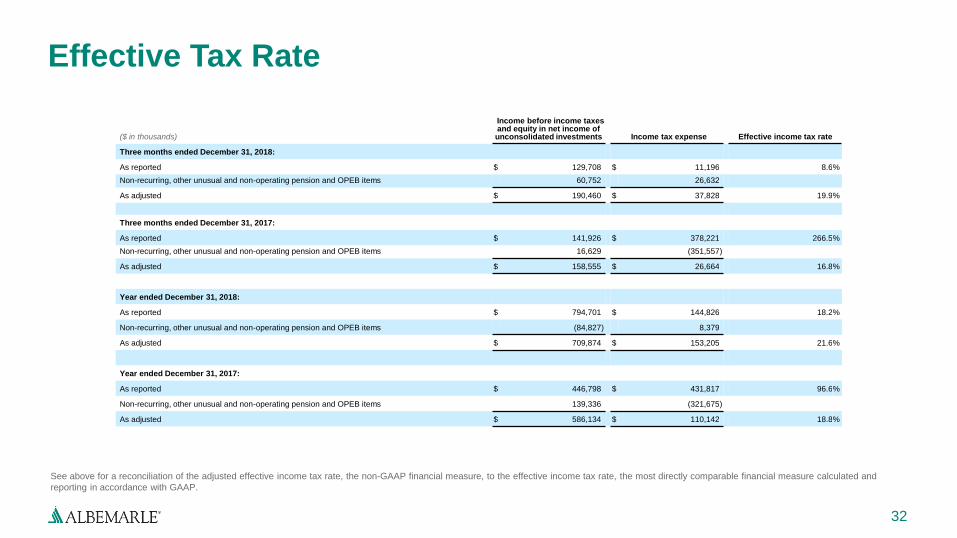
Effective Tax Rate
See above for a reconciliation of the adjusted effective income tax rate, the non-GAAP financial measure, to the effective income tax rate, the most directly comparable financial measure calculated and
reporting in accordance with GAAP.
($ in thousands)
Income before income taxes and equity in net income of unconsolidated investments Income tax expense Effective income tax rate
Three months ended December 31, 2018:
As reported $ 129,708 $ 11,196 8.6%
Non-recurring, other unusual and non-operating pension and OPEB items 60,752 26,632
As adjusted $ 190,460 $ 37,828 19.9%
Three months ended December 31, 2017:
As reported $ 141,926 $ 378,221 266.5%
Non-recurring, other unusual and non-operating pension and OPEB items 16,629 (351,557)
As adjusted $ 158,555 $ 26,664 16.8%
Year ended December 31, 2018:
As reported $ 794,701 $ 144,826 18.2%
Non-recurring, other unusual and non-operating pension and OPEB items (84,827) 8,379
As adjusted $ 709,874 $ 153,205 21.6%
Year ended December 31, 2017:
As reported $ 446,798 $ 431,817 96.6%
Non-recurring, other unusual and non-operating pension and OPEB items 139,336 (321,675)
As adjusted $ 586,134 $ 110,142 18.8%
33
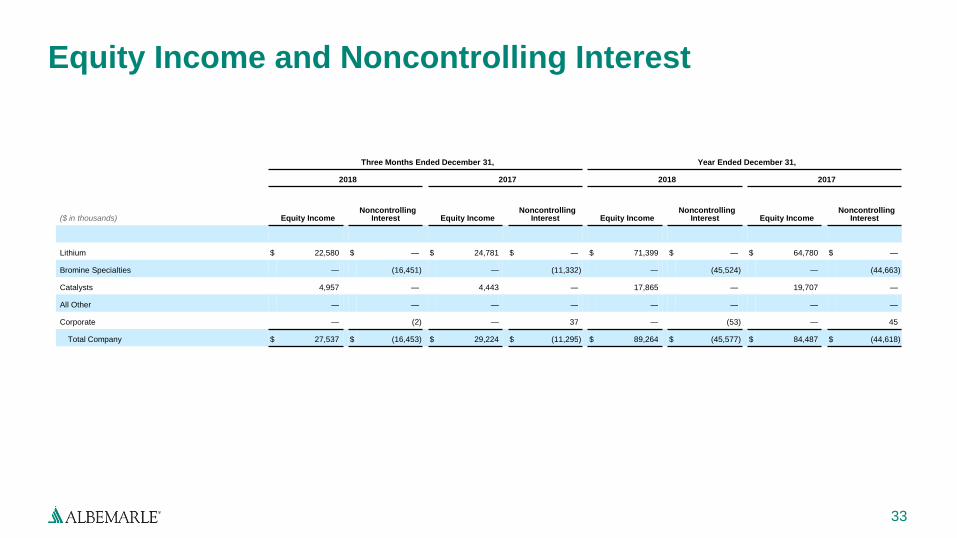
Equity Income and Noncontrolling Interest
Three Months Ended December 31, Year Ended December 31,
2018 2017 2018 2017
($ in thousands) Equity IncomeNoncontrolling
Interest Equity IncomeNoncontrolling
Interest Equity IncomeNoncontrolling
Interest Equity IncomeNoncontrolling
Interest
Lithium $ 22,580 $ — $ 24,781 $ — $ 71,399 $ — $ 64,780 $ —
Bromine Specialties — (16,451) — (11,332) — (45,524) — (44,663)
Catalysts 4,957 — 4,443 — 17,865 — 19,707 —
All Other — — — — — — — —
Corporate — (2) — 37 — (53) — 45
Total Company $ 27,537 $ (16,453) $ 29,224 $ (11,295) $ 89,264 $ (45,577) $ 84,487 $ (44,618)
www.albemarle.com
34