Embed Size (px)
Citation preview

- 1 -
Investor Presentation
FY 2012
“ Get to know who we are, and how we are painting
the world map red!”

Information contained in this presentation is subject to change without notice, its accuracy is not guaranteed
and it may not contain all material information concerning the company. Neither we nor our advisors make
any representation regarding, and assume no responsibility or liability for, the accuracy or completeness of, or
any errors or omissions in, any information contained herein.
In addition, the information contains projections and forward-looking statements that reflect the company’s
current views with respect to future events and financial performance. These views are based on current
assumptions which are subject to various risks and which may change over time. No assurance can be given
that future events will occur, that projections will be achieved, or that the company’s assumptions are
correct. Actual results may differ materially from those projected.
This presentation is strictly not to be distributed without the explicit consent of Company management under
any circumstance.
Disclaimer

Agenda
1. Business Description and Update
2. Industry Snapshot
3. Key Operating Metrics
4. Financial Performance
5. Funding Plan
6. The Way Forward

1. Business Description and Update
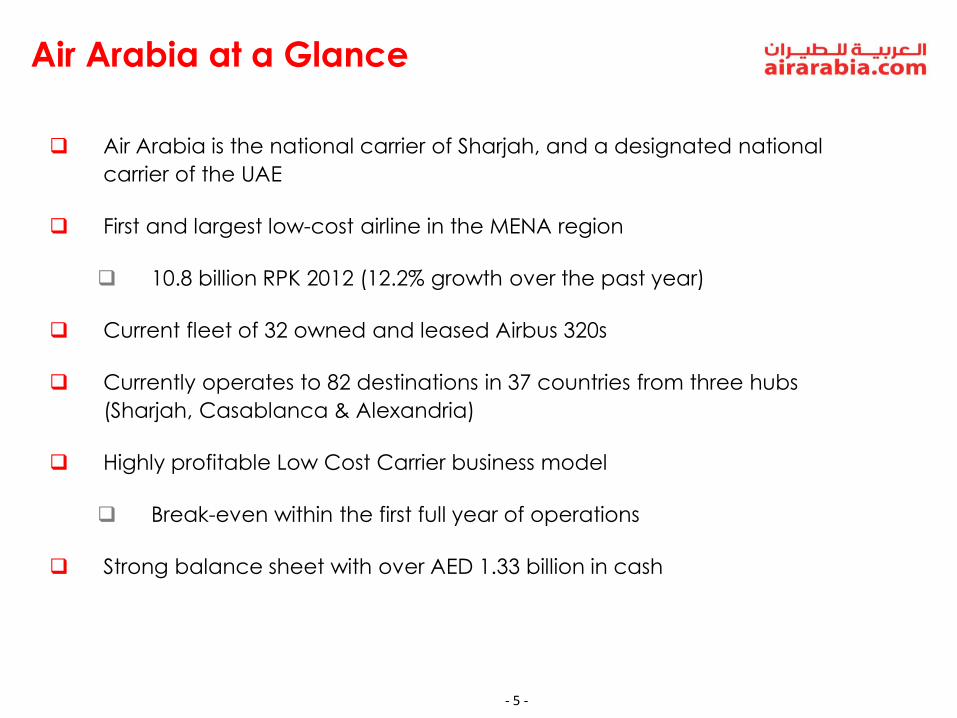
- 5 -
Air Arabia is the national carrier of Sharjah, and a designated national
carrier of the UAE
First and largest low-cost airline in the MENA region
10.8 billion RPK 2012 (12.2% growth over the past year)
Current fleet of 32 owned and leased Airbus 320s
Currently operates to 82 destinations in 37 countries from three hubs
(Sharjah, Casablanca & Alexandria)
Highly profitable Low Cost Carrier business model
Break-even within the first full year of operations
Strong balance sheet with over AED 1.33 billion in cash
Air Arabia at a Glance
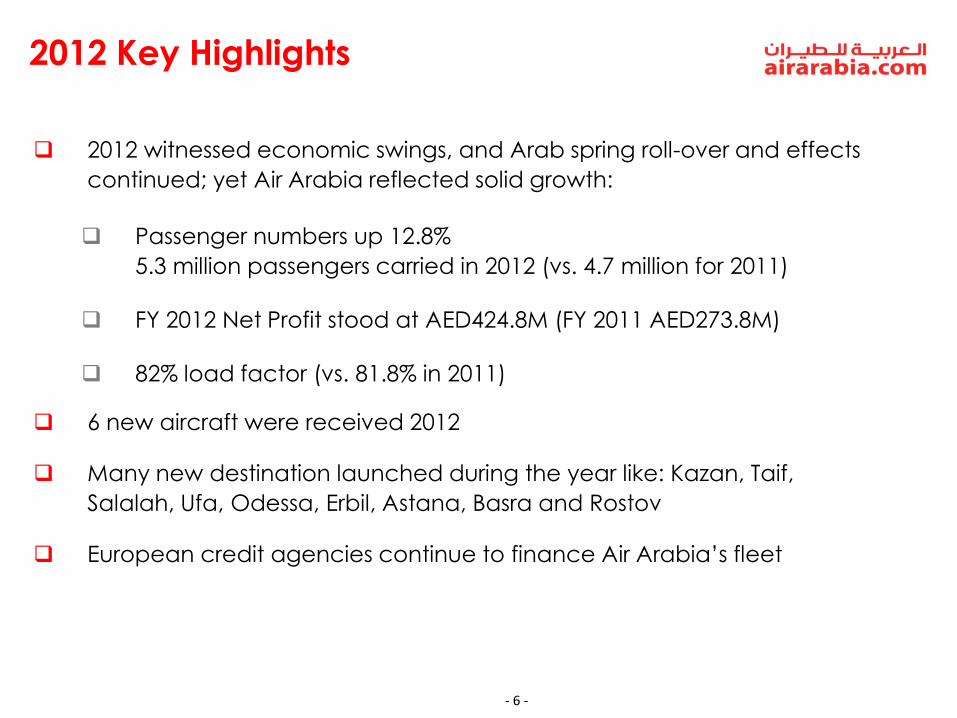
- 6 -
2012 Key Highlights
2012 witnessed economic swings, and Arab spring roll-over and effects
continued; yet Air Arabia reflected solid growth:
Passenger numbers up 12.8%
5.3 million passengers carried in 2012 (vs. 4.7 million for 2011)
FY 2012 Net Profit stood at AED424.8M (FY 2011 AED273.8M)
82% load factor (vs. 81.8% in 2011)
6 new aircraft were received 2012
Many new destination launched during the year like: Kazan, Taif,
Salalah, Ufa, Odessa, Erbil, Astana, Basra and Rostov
European credit agencies continue to finance Air Arabia’s fleet

- 7 -
Vision and Mission
Vision – “To be one of the world’s leading budget airlines” in terms of:
Profitability Innovation
Mission – “To revolutionize air travel in the region through an innovative business approach,
offering superb value for money, and safe reliable reputation”. To achieve that we will:
Be Known for our Low Fares Grow our Business
Profitably
Build Motivated Multi –
Functional Teams
Demonstrate the Highest
Operational Standards
Manage our Costs
Ruthlessly
Reputation Operational
Excellence

- 8 -
Air Arabia Network
Overall growth in
numbers of destinations;
Remains biggest
international airline to fly
to India with 13
destinations and over
102 flights per week
Historic growth in flights
to Pakistan;
Significant progress in
other strategic markets
(Saudi Arabia / Iraq /
Russia)
- 9 -
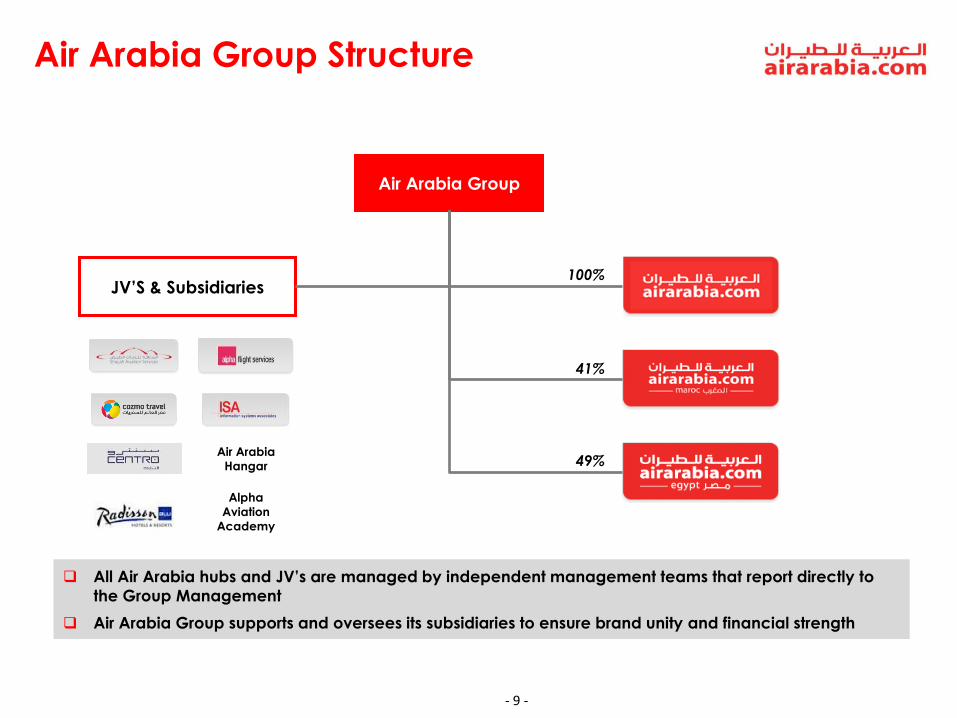
Air Arabia Group Structure
All Air Arabia hubs and JV’s are managed by independent management teams that report directly to
the Group Management
Air Arabia Group supports and oversees its subsidiaries to ensure brand unity and financial strength
JV’S & Subsidiaries
Air Arabia Group
100%
41%
49% Air Arabia
Hangar
Alpha
Aviation
Academy

- 10 - - 10 -
Hubs Overview
Description / Update Country Stake
JV between Moroccan investors , Air Arabia (41%).
Air Arabia Maroc, managed by Air Arabia, started
operations on April 29, 2009
The Casablanca hub serves niche destinations in Europe through several locations in Morocco and continues procuring for rights to fly into Africa to link it to Europe through Morocco
In addition to Casablanca, Air Arabia Maroc also operates from Nador, Fez and Oujda into Europe
Morocco 41%
JV between Travco Group (51%) and Air Arabia (49%), Air Arabia Egypt, managed by Air Arabia, started operations on May 22, 2010
Alexandria serves the Middle East and Europe and
operates tourist charter flights to West Europe and Russia
Egypt 49%
Incorporated on October, 2003, Air Arabia, Sharjah-based, is the first and largest low cost airline in the MENA region
UAE 100%
Hub

- 11 -
100%
51%
51%
51%
100%
- 11 -
Key Data of Selected JVs and Subsidiaries
Stake
Revenue (AED MM)
FY 11
50%
37.6
29.5
7.4
23.8
FY 12
87.6
33.5
8.1
18.4
85.8
33.1
24.5
4.4

- 12 -
Engineering
Mohamed Ismail
Finance
Paul Suckling
Operations
M. Ahmad
Experienced Management Team
Air Arabia is led and managed by a core team of industry seasoned
professional with a proven track record of successfully operating a
company in a booming and competitive industry
Adel Ali has been awarded a number of awards for his outstanding
leadership and management
Group CEO
Adel Ali
Hubs COO’s
Corporate Affairs
A. Bin Taliah
Commercial
- 12 -
HR
Rachel Abraham
IT
Ali Al Hamdany
Network & Strategy
Tony Whitby Rohit R.

- 13 -
Corporate Governance
- 13 -
Air Arabia has put into practice international corporate governance standards,
regulations and policies. This was recognized by ESCA and Air Arabia was awarded for
being the first company in the UAE to successfully implement them
Today, Air Arabia’s board consists predominately of independent directors (4), one non-
executive director, one executive director, and the Chairman
2 committees have been formed to serve under the board of directors: Audit Committee
and the Remuneration and Follow up committee
Board of Directors
Sheikh
Abdullah Bin
Mohamed Al
Thani
Chairman
Mr. Adel
Abdulla Ali
Executive
Member
Mr. Arif Naqvi
Non Executive
Member
Dr. Ghanem
Mohammed Al
Hajri
Independent
Member
Sheikh
Mohammed
Bin Abdullah
Al Thani
Independent
Member
Mr.
Abdulwahab
Mohammed Al
Roomi
Independent
Member
Mr. Taryam
Matar Taryam
Independent
Member

- 14 -
Recent Awards
- 14 -
World Airline Award for best LCC in MENA by Skytrax (2007,
2008, 2009 & 2010)
Low-cost carrier of the year at the Aviation Business Awards
(2007, 2008, 2009 & 2010)
Worlds most profitable airline in 2008
World’s best LCC for 2009 by Aviation week
Super brands Award 2010 & 2011
ESCA award for excellence in Corporate Governance
Best managed company in Middle East aviation by
Euromoney.
CSR Award for best social responsibility practices by Aviation
Business 2012.
World’s Second best Performing Airline by Aviation week.
World’s Best A320 Operator Since 2005

- 15 -
2. Industry Snapshot

- 16 -
87%
84%
82%80% 80%
73%
60%
65%
70%
75%
80%
85%
90%
No
rth
Am
eri
ca
Eu
rop
e
Mid
dle
Ea
st
Asi
a
Pa
cif
ic
La
tin
Am
eri
ca
Afr
ica
(% o
f A
SK
s)
Air Transport Market Analysis
“Only airlines in the Latin American and Middle East regions to have seen volumes grow
at a double figure pace”
- 16 -
Source: IATA, July 2011
ASKs Growth (Y-o-Y) RPKs Growth (Y-o-Y)
12%
10%9%
5% 4%
3%
0%
2%
4%
6%
8%
10%
12%
14%
La
tin
Am
eri
ca
Mid
dle
Ea
st
Eu
rop
e
Asi
a
Pa
cif
ic
Afr
ica
No
rth
Am
eri
ca
Total Passenger Load Factor
9%8% 8%
4%
3%2%
0%
2%
4%
6%
8%
10%
Mid
dle
Ea
st
Eu
rop
e
La
tin
Am
eri
ca
Asi
a
Pa
cif
ic
No
rth
Am
eri
ca
Afr
ica
Industry: 6%
Industry: 5%

- 17 -
0%
2%
4%
6%
8%
Domestic & Intra-
Regional Traffic
International Traffic Total Passenger
Traffic
(CA
GR
)
2009-2018 2009-2028
0%
4%
8%
12%
16%
Se
p-1
0
Oc
t-1
0
No
v-1
0
De
c-1
0
Ja
n-1
1
Fe
b-1
1
Ma
r-1
1
Ap
r-1
1
Ma
y-1
1
Ju
n-1
1
Ju
l-1
1
LCC,
5-6%
Traditional
Carriers, 94-95%
Arab World Aviation Sector Overview
- 17 -
LCC Penetration - MENA Region (2007) LCC Penetration - MENA Region 2011
Int’l Passenger Growth Evolution in MENA Middle East Traffic Growth
Note: Penetration is based on number of passengers
Source: IATA, SRS Analyzer, Airbus and AACO
LCC, 1.4%
Traditional
Carriers, 98.6%
- 18 -
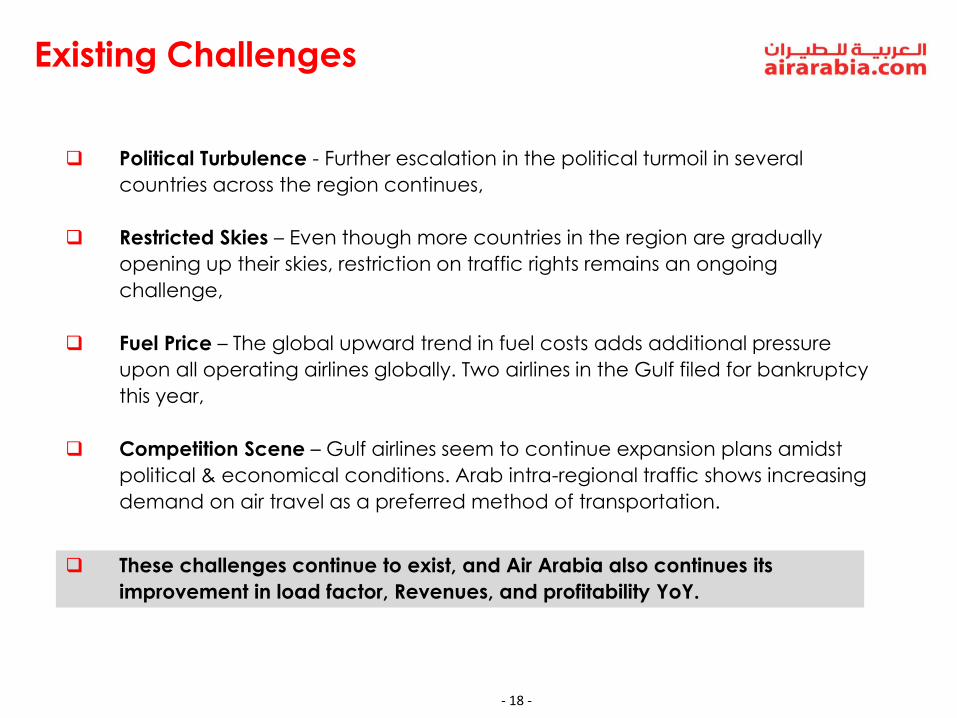
Existing Challenges
Political Turbulence - Further escalation in the political turmoil in several
countries across the region continues,
Restricted Skies – Even though more countries in the region are gradually
opening up their skies, restriction on traffic rights remains an ongoing
challenge,
Fuel Price – The global upward trend in fuel costs adds additional pressure
upon all operating airlines globally. Two airlines in the Gulf filed for bankruptcy
this year,
Competition Scene – Gulf airlines seem to continue expansion plans amidst
political & economical conditions. Arab intra-regional traffic shows increasing
demand on air travel as a preferred method of transportation.
These challenges continue to exist, and Air Arabia also continues its
improvement in load factor, Revenues, and profitability YoY.
- 19 -
3. Key Operating Metrics

- 20 -
Operational Metrics - Keep On Growing
Load Factor Total Passengers (MM)
Fleet Size Destinations
- 20 -

- 21 -
RPK and ASK Evolution
- 21 -
2011 RPK: 9.6
billion
2011 ASK: 11.7
billion
2012 RPK: 10.77
billion
2012 ASK: 13
billion
2010 RPK: 9.2
billion
2010 ASK: 11.0
billion
2009 RPK: 8.5
billion
2009 ASK: 10.5
billion
- 22 -
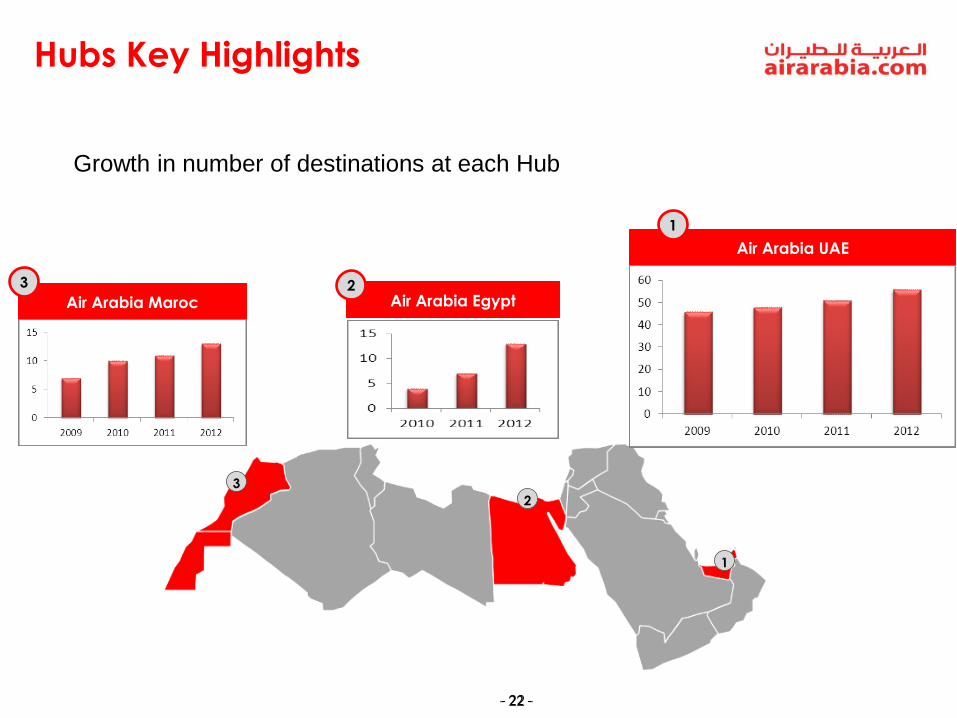
Hubs Key Highlights
- 22 -
Air Arabia Egypt
Air Arabia UAE
Air Arabia Maroc
2
1
3
1
3 2
Growth in number of destinations at each Hub

- 23 -
Operating Statistics (Airline)
(Figures in AED) 2004 2005 2006 2007 2008 2009 2010 2011 2012
Number of Aircrafts 3 5 8 11 16 21 25 29 32
Average Aircrafts 3 4.9 6 9.5 14.5 17 23 27.5 30.5
Destinations 15 23 32 37 44 45 65 69 82
Number of Pax (Millions) 0.5 1.1 1.8 2.7 3.6 4.1 4.5 4.7 5.3
RPK (Billions) 1.2 2.5 3.7 5 7.1 8.5 9.2 9.6 10.8
ASK (Billions) 1.8 3.2 4.7 5.8 8.3 10.5 11 11.7 13
Average Load Factor 68% 79% 80% 86% 85% 80% 83% 82% 82%

- 24 -
4. Financial Performance

- 25 -
Historical Financial Group Performance
Net Profit
Revenues
Margin

November 2011 - 26 -
Robust Financial and Operational Performance (Q4)
Q4’ 12 Q4’ 11 Change
Financial Highlights (AED MM)
Total Revenue 755 638 18.3%
Net Profit 83 79 5%
Operational Highlights
Number of Pax (Millions) 1.37 1.18 16.1%
RPK (Billions) 2.79 2.43 14.8%
ASK (Billions) 3.47 3.02 14.9%
Average Load Factor 79.5% 79.4% ~
- 27 -
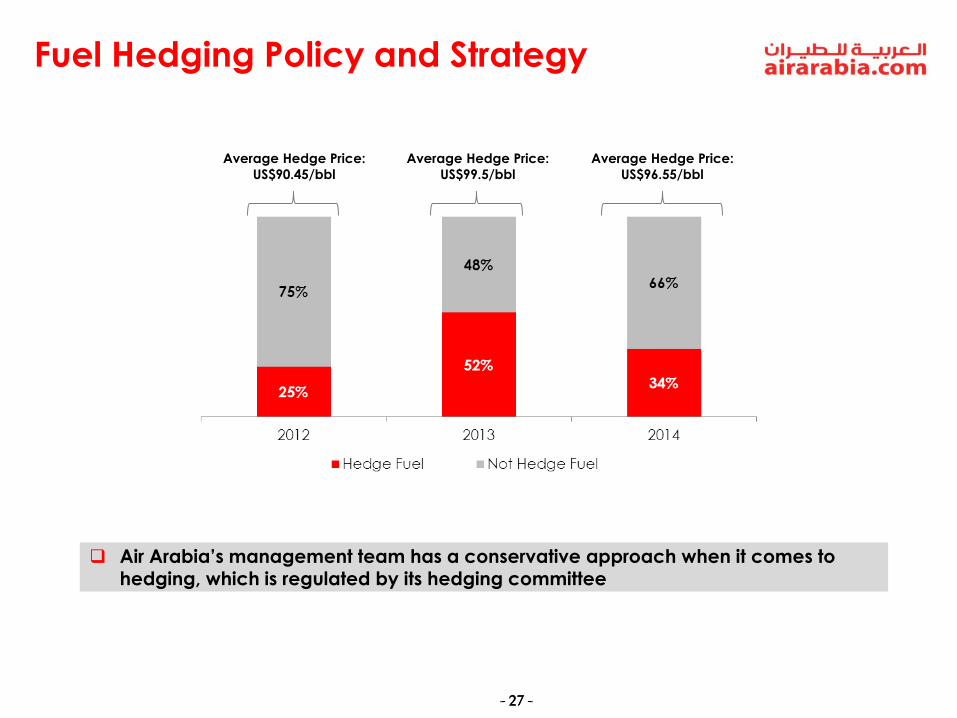
Fuel Hedging Policy and Strategy
- 27 -
Average Hedge Price:
US$99.5/bbl
Average Hedge Price:
US$96.55/bbl
Air Arabia’s management team has a conservative approach when it comes to hedging, which is regulated by its hedging committee
Average Hedge Price:
US$90.45/bbl
- 28 -
5. Funding Plan
- 29 -
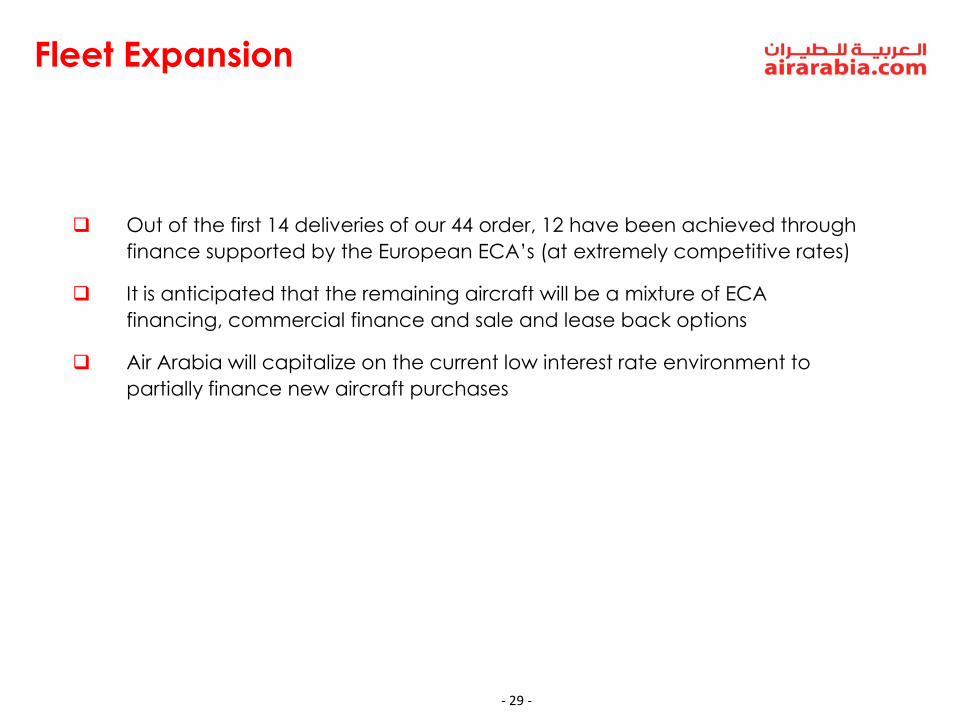
Fleet Expansion
Out of the first 14 deliveries of our 44 order, 12 have been achieved through
finance supported by the European ECA’s (at extremely competitive rates)
It is anticipated that the remaining aircraft will be a mixture of ECA
financing, commercial finance and sale and lease back options
Air Arabia will capitalize on the current low interest rate environment to
partially finance new aircraft purchases

- 30 -
6. The way forward…

- 31 -
The Way Forward
To expand operation from Sharjah to Central Asia, Russian Federation, CIS
and Eastern Europe,
Grow operations from Egypt hub organically to serve GCC, Europe and
Africa,
To expand Morocco hub operations into Europe and seek further flying
rights to Africa,
To focus on growing ancillary revenues, and
Remain a customer & product focused airline and commercially driven
business.

- 32 -
Contact Us
- 32 -
Tel: +971.6.5088977
E-mail: [email protected]
Thank you
This material is available on our website
www.airarabia.com


![Investor Presentation Q4 FY 2016 [Company Update]](https://img.pdfslide.net/doc/110x75/577c7fb51a28abe054a5bb0b/investor-presentation-q4-fy-2016-company-update.jpg)