Embed Size (px)
Citation preview
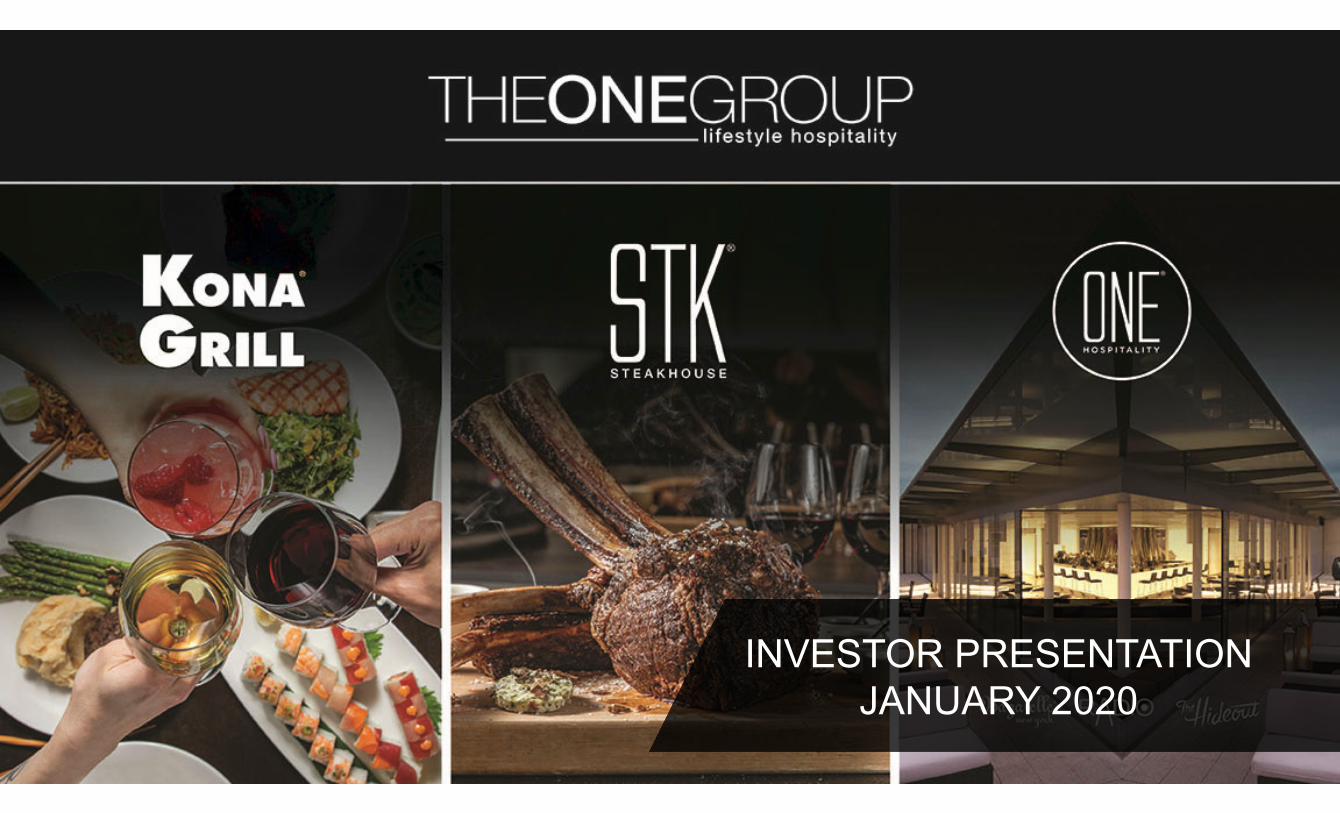
INVESTOR PRESENTATION JANUARY 2020

Cautionary Statements
2
Forward-Looking StatementsThis presentation contains statements relating to the Company’s future business and financial performance and future events or developments that may constitute “forward-looking statements” within the meaning of the “safe harbor” provisions of the United States Private Securities Litigation Reform Act of 1995. These statements are based on current expectations and assumptions that are subject to risks and uncertainties. These statements include forward-looking statements with respect to the Company’s business and industry in general. Statements that include the words “expect,” “intend,” “plan,” “believe,” “project,” “forecast,” “estimate,” “may,” “should,” “anticipate,” "target," and similar words identify forward-looking statements. A variety of factors, many of which are beyond the Company’s control, affect the Company’s operations, performance, business strategies and results, and the Company’s actual results may differ materially from those indicated in these statements. These factors include, but are not limited to, continued compliance with governmental regulation, the ability to manage growth, requirements or changes affecting the Company's business, general economic and business conditions and the Company’s ability to open new restaurants and food and beverage locations in existing and new markets. More detailed information about these risk factors may be found in the Company’s filings with the Securities and Exchange Commission, including its Annual Report on Form 10-K for the year ended December 31, 2018. The statements made herein speak only as of the date of this presentation. The Company undertakes no obligation to update its forward-looking statements to reflect events or circumstances after the date of this presentation.
Non-GAAP Financial MeasuresThis presentation contains non-GAAP financial measures. A “non-GAAP financial measure” is a numerical measure of a company’s financial performance that excludes or includes amounts from a measure calculated and presented in accordance with GAAP in the consolidated statements of operations, balance sheets or statements of cash flows of the Company. These measures are presented because management uses this information to monitor and evaluate financial results and trends and believes this information to also be useful for investors. The Company has both wholly owned and partially owned subsidiaries. Total food and beverage sales at owned and managed units represents total revenue from owned operations as well as the sales reported to the Company by the owners of locations the Company manages, where it earns management and incentive fees. EBITDA is defined as net income before interest expense, provision for income taxes and depreciation and amortization. Adjusted EBITDA represents net income before interest expense, provision for income taxes, depreciation and amortization, non-cash impairment loss, non-cash rent, pre-opening expenses, non-recurring gains and losses and losses from discontinued operations. The disclosure of EBITDA and Adjusted EBITDA and other non-GAAP financial measures may not be comparable to similarly titled measures reported by other companies. EBITDA and Adjusted EBITDA should be considered in addition to, and not as a substitute for, or superior to, net income, operating income, cash flows, revenue, or other measures of financial performance prepared in accordance with GAAP. For a reconciliation of total food and beverage sales at owned and managed units, EBITDA, and Adjusted EBITDA to the most directly comparable financial measures presented in accordance with GAAP and a discussion of why we consider them useful, see the Company’s filings with the Securities and Exchange Commission, including its Annual Report on Form 10-K for the year ended December 31, 2018, and its Quarterly Report on Form 10-Q for the quarters ended September 30, 2018 and September 30, 2019.
.
3
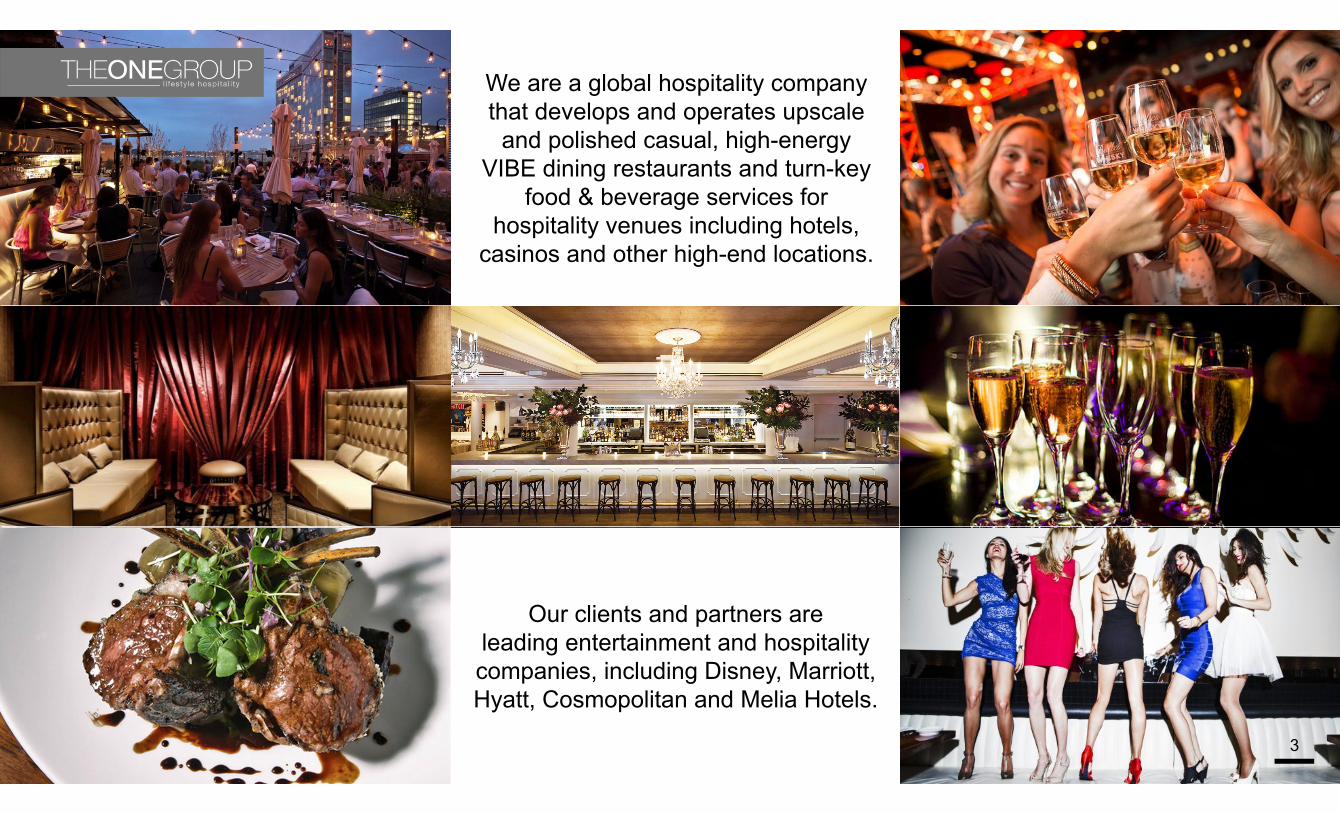
We are a global hospitality company that develops and operates upscale
and polished casual, high-energy VIBE dining restaurants and turn-key
food & beverage services for hospitality venues including hotels,
casinos and other high-end locations.
Our clients and partners areleading entertainment and hospitality companies, including Disney, Marriott, Hyatt, Cosmopolitan and Melia Hotels.

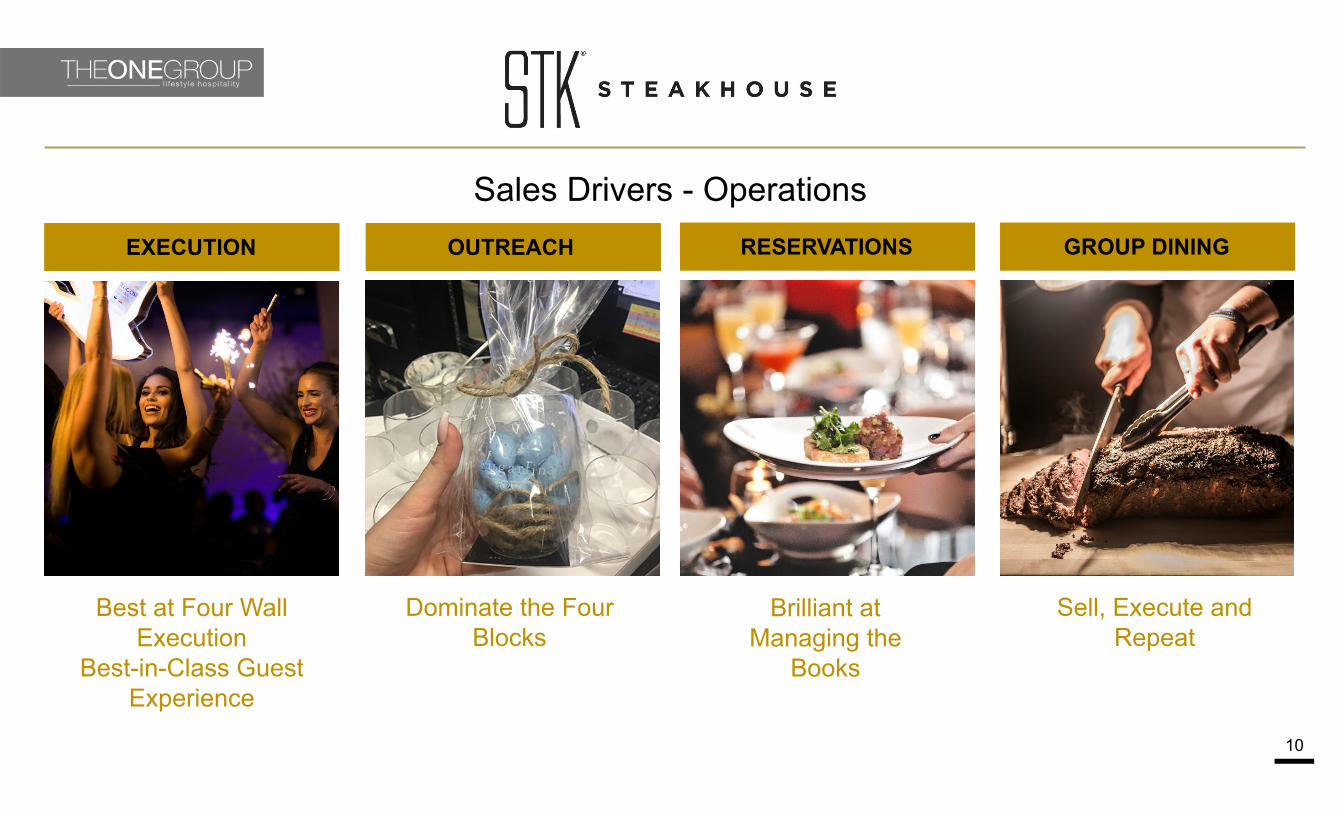
Execution: Best at Four Wall Execution -Best in Class at Guest Experience
Reservations: Brilliant at Managing the Books
Group Dining / Events: Sell, Execute and Repeat
Outreach: Dominate the Four Blocks
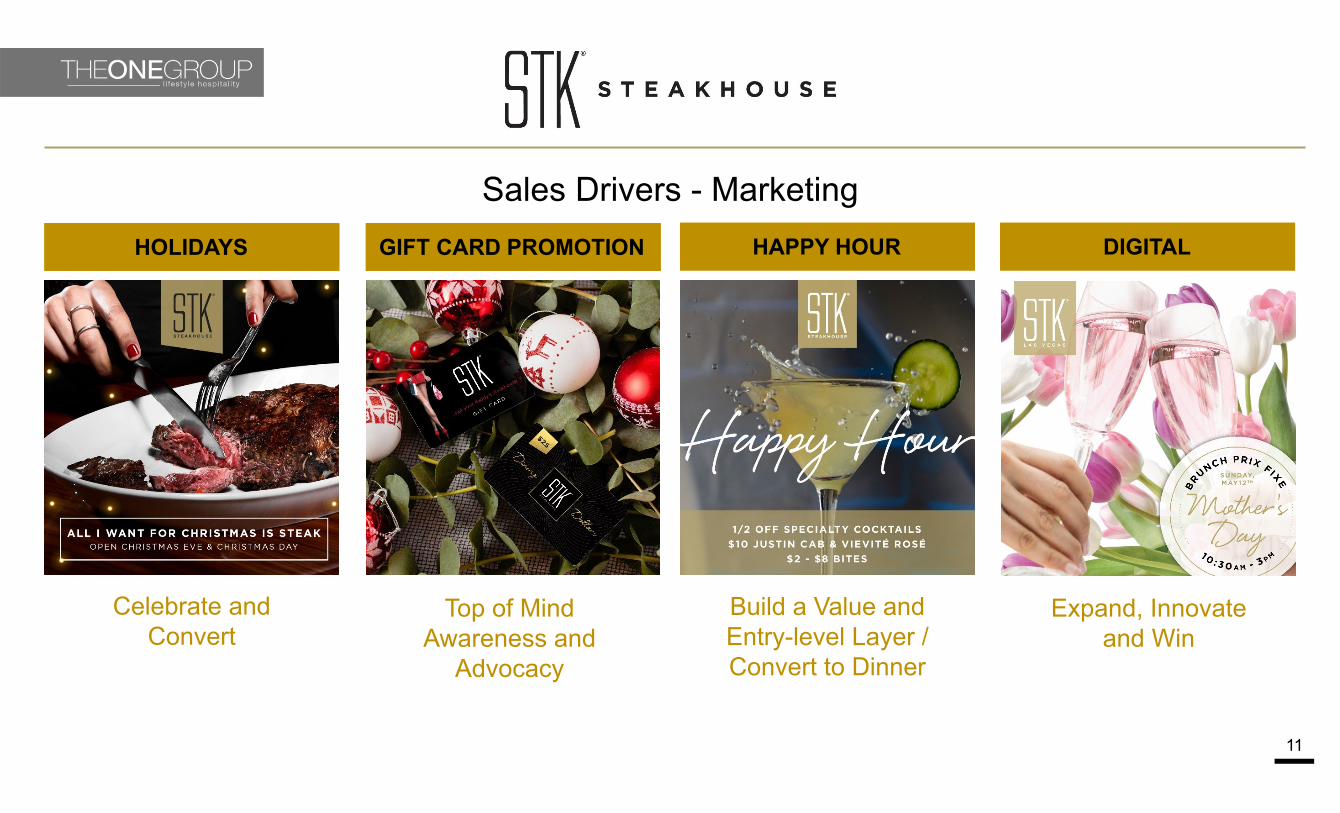
Holidays: Celebrate and Convert
Gift Cards: Top of Mind awareness -Advocate
Happy Hour: Build a Value and Entry-Level Layer / Convert to Dinner
Digital: Expand, Innovate and Win
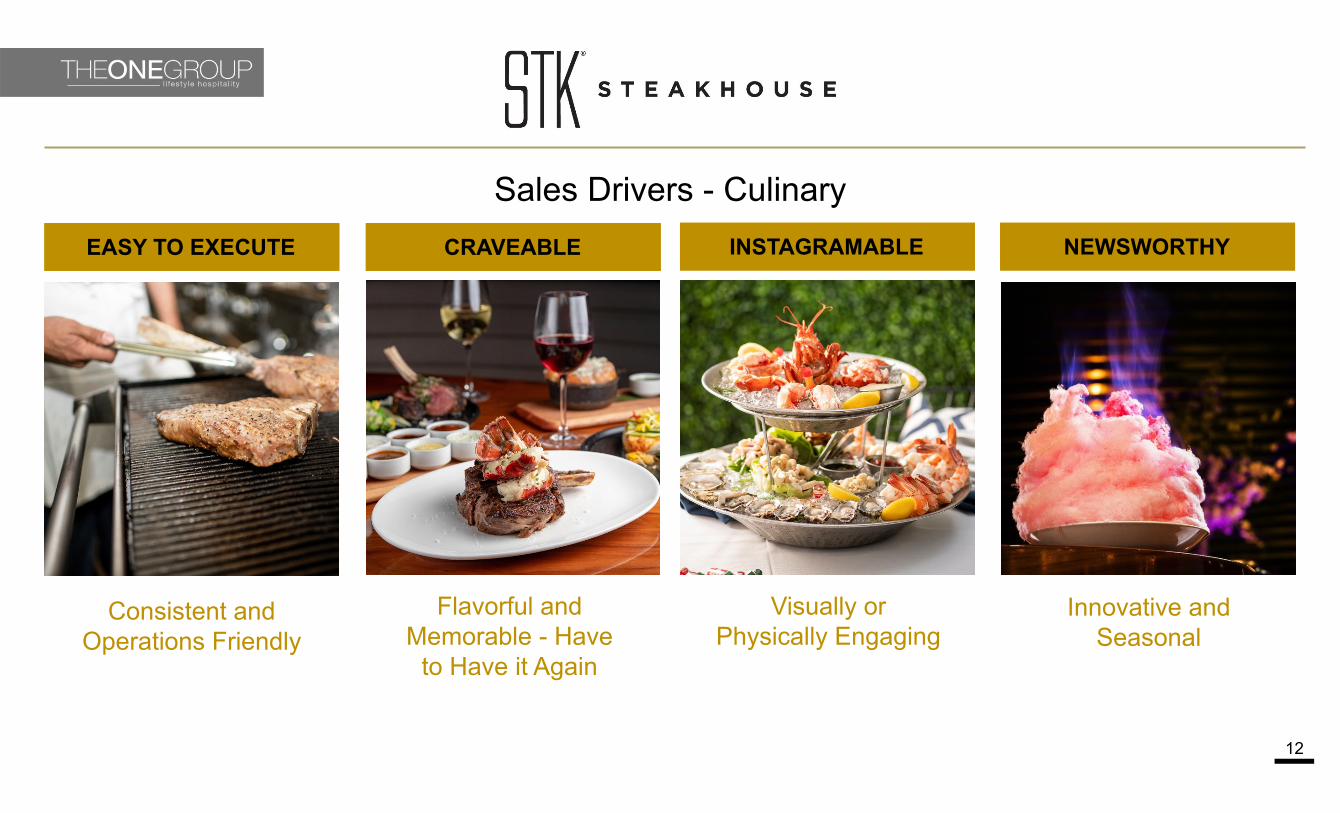
Craveable: Flavorful and Memorable-Have to Have it Again
Easy to Execute: Consistent and Operations Friendly
Newsworthy: Innovative / Seasonal
Instagramable: Visually or Physically Engaging
STRATEGY PILLARS
Vision: The Undisputed Global Leader In VIBE Dining.
Mission: To be the BEST Restaurant In Every Market That We Operate by Delivering Exceptional and Unforgettable Guest Experiences to Every Guest, Every Time.
OperationsOperations MarketingMarketing CulinaryCulinary
4

Company Overview
5
Key Financials (2020 Guidance) GAAP Revenue~ $200MM to $210MM
Global F&B Revenue~ $310MM to $320MM
G&A (excluding non-cash stock-based compensation):
~ 6% to 7% of GAAP Revenues
Adj. EBITDA: ~ $23MM to $25MM
STK RESTAURANTS Upscale, high-energy steakhouse concept
Launched in NYC in 2006
Portfolio of 10 owned, 4 managed and 6 licensed restaurants
An additional 10 venues in operation or under lease / construction in North America, Europe and the Middle East
Includes both large and mid-sized market restaurants, rooftops, and offsite catering and events
STK brand US Sales in 2019 rose to a record $115 million
HOSPITALITY SERVICES
Unique opportunity to leverage restaurant and hospitality expertise, while utilizing Company-branded restaurants or tailored concepts
Generate high margin management and incentive fee income with minimal capital expenditure
Target opportunities generating a minimum of $8mm-10mm in food & beverage (“F&B”) sales
Six hospitality programs in operation
KONA GRILL RESTAURANTS
Polished casual, bar-centric grill concept
Launched in AZ in 1998
Portfolio of 24 owned locations in 17 states
Includes mid-sized markets and large market suburban restaurants, rooftops, catering and events
Kona Grill sales in 2020 projected to be approximately $100 million
Puerto Rico UAE Mexico SpainQatar
United Kingdom
Hippodrome CasinoLondon
ME HotelLondon
Italy
ME HotelMilan
The United States & Canada
The W HotelLos Angeles
(2020)
FlorenceF&B
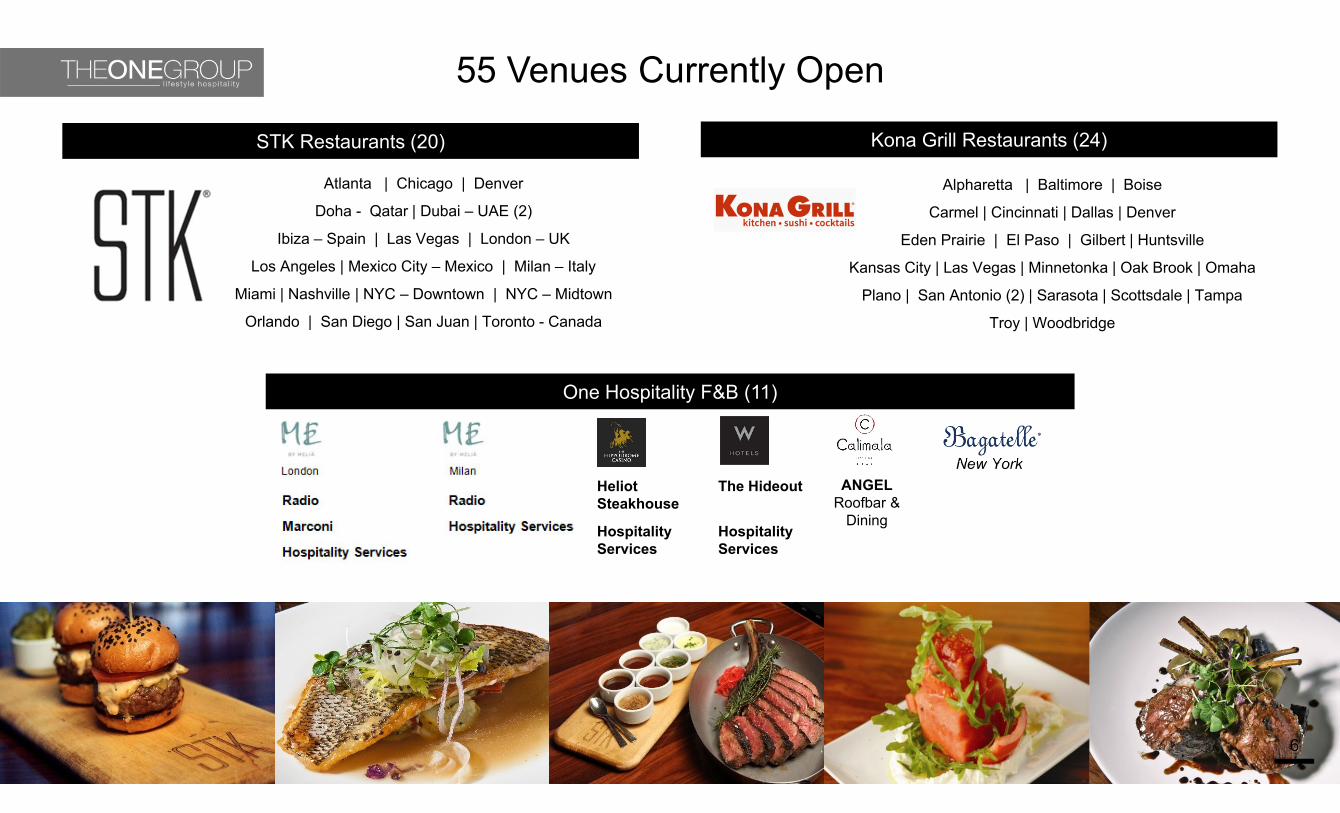
One Hospitality F&B (11)
55 Venues Currently Open
6
New York
Atlanta | Chicago | Denver
Doha - Qatar | Dubai – UAE (2)
Ibiza – Spain | Las Vegas | London – UK
Los Angeles | Mexico City – Mexico | Milan – Italy
Miami | Nashville | NYC – Downtown | NYC – Midtown
Orlando | San Diego | San Juan | Toronto - Canada
STK Restaurants (20)
Heliot Steakhouse
The Hideout
Hospitality Services
Hospitality Services
ANGELRoofbar &
Dining
Alpharetta | Baltimore | Boise
Carmel | Cincinnati | Dallas | Denver
Eden Prairie | El Paso | Gilbert | Huntsville
Kansas City | Las Vegas | Minnetonka | Oak Brook | Omaha
Plano | San Antonio (2) | Sarasota | Scottsdale | Tampa
Troy | Woodbridge
Kona Grill Restaurants (24)
‐0.5% ‐0.3%‐1.4%
2.1%
0.1% 0.7% 1.1% 0.4%1.3%
0.4%2.0%
2.6%1.7% 1.9%
6.0%7.3% 7.5% 6.9%
15.0%
8.6%
6.4%
9.5% 8.9%
Q1 '17 Q2 '17 Q3 '17 Q4 '17 Q1 '18 Q2 '18 Q3 '18 Q4 '18 Q1 '19 Q2 '19 Q3 '19 Q4 '19
STK Same Store Sales GrowthFine Dining Steak Index* STK
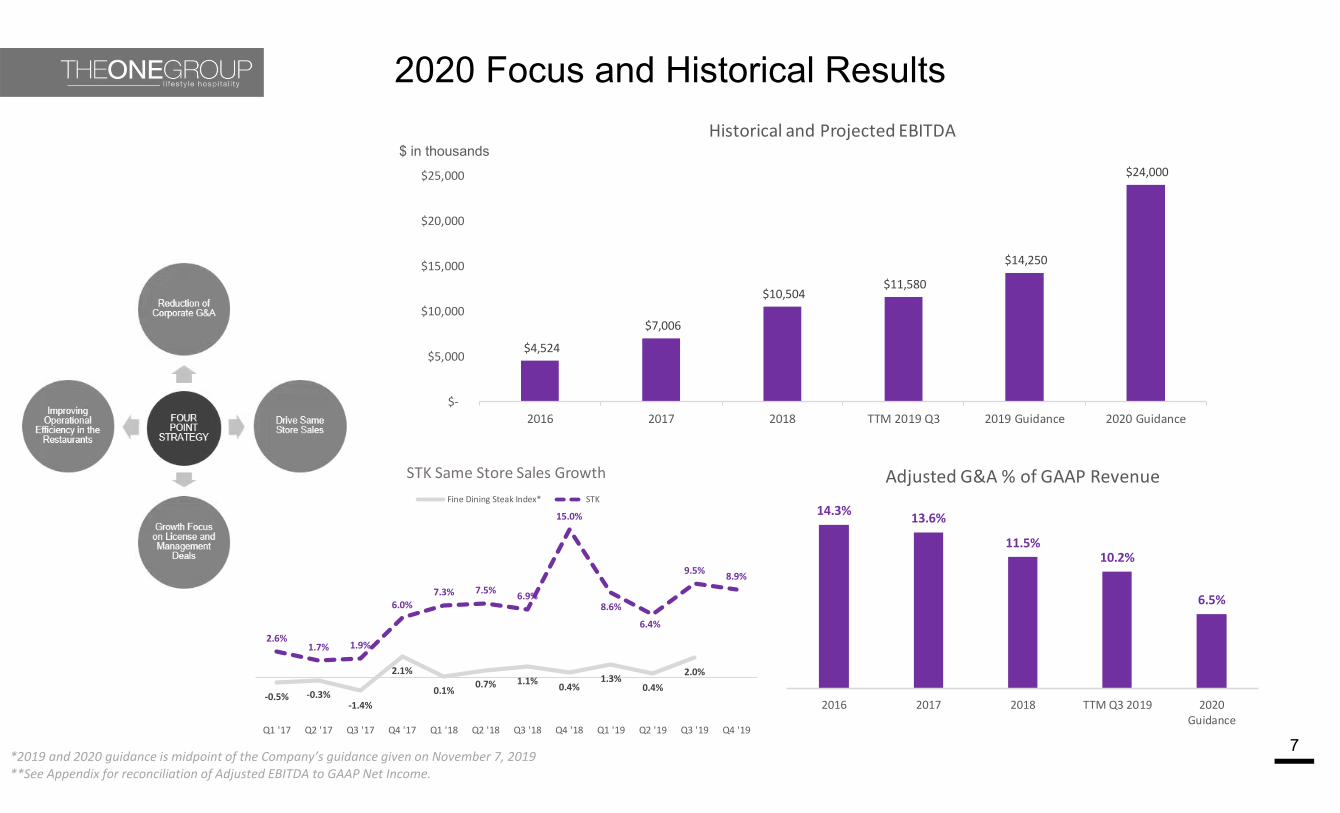
2020 Focus and Historical Results
7*2019 and 2020 guidance is midpoint of the Company’s guidance given on November 7, 2019
$4,524
$7,006
$10,504 $11,580
$14,250
$24,000
$‐
$5,000
$10,000
$15,000
$20,000
$25,000
2016 2017 2018 TTM 2019 Q3 2019 Guidance 2020 Guidance
Historical and Projected EBITDA$ in thousands
**See Appendix for reconciliation of Adjusted EBITDA to GAAP Net Income.
14.3% 13.6%
11.5%10.2%
6.5%
2016 2017 2018 TTM Q3 2019 2020Guidance
Adjusted G&A % of GAAP Revenue

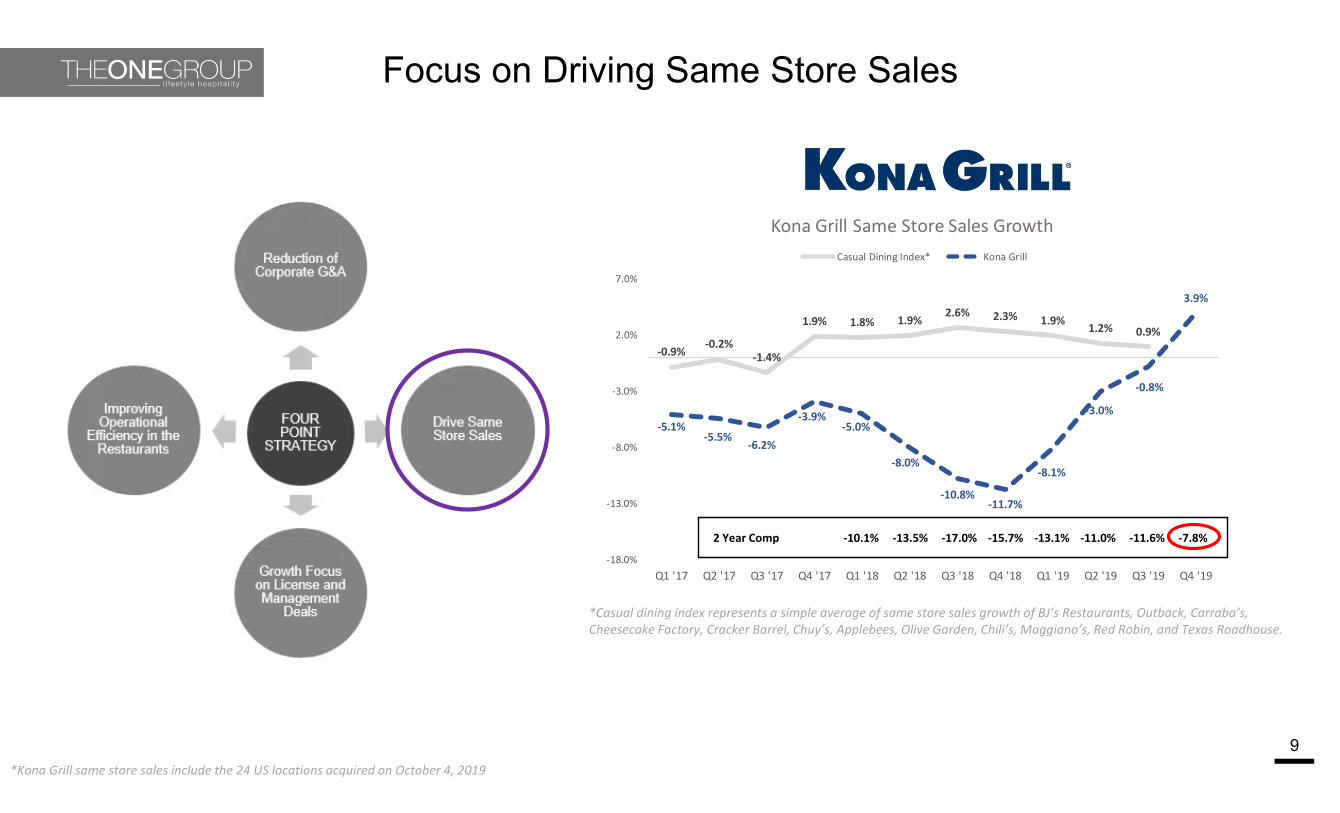
Focus on Driving Same Store Sales
8
*Fine dining steak index represents a simple average of same store sales growth of Del Friscos – Double Eagle (while public), Del Friscos – Grille (while public), Ruth’s Chris, Flemings, and Capital Grill
‐0.5% ‐0.3%‐1.4%
2.1%
0.1% 0.7% 1.1% 0.4%1.3%
0.4%2.0%
2.6%1.7% 1.9%
6.0%7.3% 7.5% 6.9%
15.0%
8.6%
6.4%
9.5% 8.9%
Q1 '17 Q2 '17 Q3 '17 Q4 '17 Q1 '18 Q2 '18 Q3 '18 Q4 '18 Q1 '19 Q2 '19 Q3 '19 Q4 '19
STK Same Store Sales GrowthFine Dining Steak Index* STK
Focus on Driving Same Store Sales
9
*Casual dining index represents a simple average of same store sales growth of BJ’s Restaurants, Outback, Carraba’s, Cheesecake Factory, Cracker Barrel, Chuy’s, Applebees, Olive Garden, Chili’s, Maggiano’s, Red Robin, and Texas Roadhouse.
‐0.9%‐0.2%
‐1.4%
1.9% 1.8% 1.9%2.6% 2.3% 1.9% 1.2% 0.9%
‐5.1%‐5.5%
‐6.2%
‐3.9%‐5.0%
‐8.0%
‐10.8%‐11.7%
‐8.1%
‐3.0%
‐0.8%
3.9%
‐18.0%
‐13.0%
‐8.0%
‐3.0%
2.0%
7.0%
Q1 '17 Q2 '17 Q3 '17 Q4 '17 Q1 '18 Q2 '18 Q3 '18 Q4 '18 Q1 '19 Q2 '19 Q3 '19 Q4 '19
Kona Grill Same Store Sales GrowthCasual Dining Index* Kona Grill
2 Year Comp ‐10.1% ‐13.5% ‐17.0% ‐15.7% ‐13.1% ‐11.0% ‐11.6% ‐7.8%
*Kona Grill same store sales include the 24 US locations acquired on October 4, 2019
10
Best at Four Wall Execution
Best-in-Class Guest Experience
Dominate the Four Blocks
Brilliant at Managing the
Books
Sell, Execute and Repeat
Sales Drivers - OperationsEXECUTION OUTREACH RESERVATIONS GROUP DINING
11
Celebrate andConvert
Top of Mind Awareness and
Advocacy
Build a Value and Entry-level Layer / Convert to Dinner
Expand, Innovate and Win
Sales Drivers - MarketingHOLIDAYS GIFT CARD PROMOTION HAPPY HOUR DIGITAL
12
Consistent and Operations Friendly
Flavorful and Memorable - Have
to Have it Again
Visually or Physically Engaging
Innovative and Seasonal
Sales Drivers - CulinaryEASY TO EXECUTE CRAVEABLE INSTAGRAMABLE NEWSWORTHY

13
Sales Drivers - Operations
Energize, Engage,and Elevate the Bar Business
Develop World-Class Restaurant
Leadership
Ignite & Dominate Delivery, Catering,
and Events
THE BAR LEADERSHIP EVENTS & CATERING
14
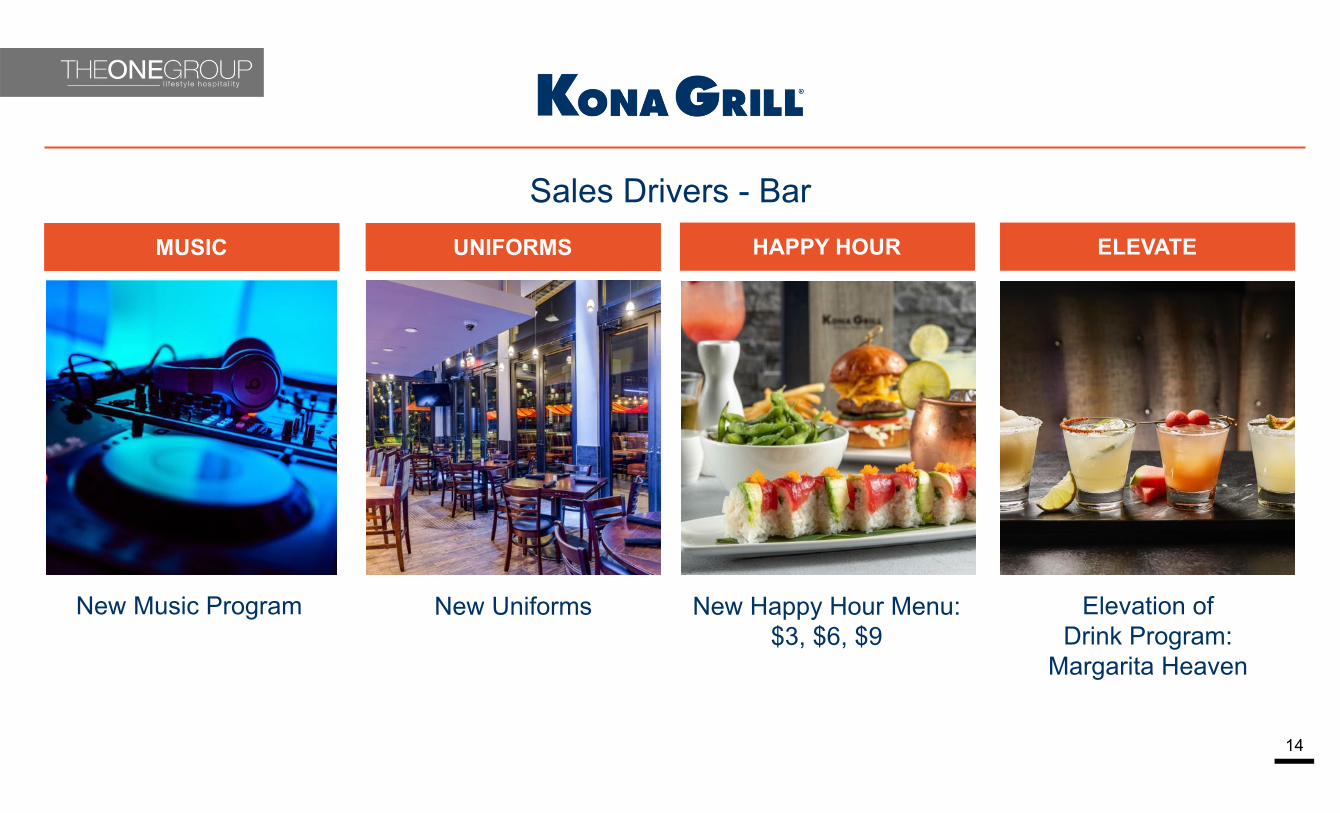
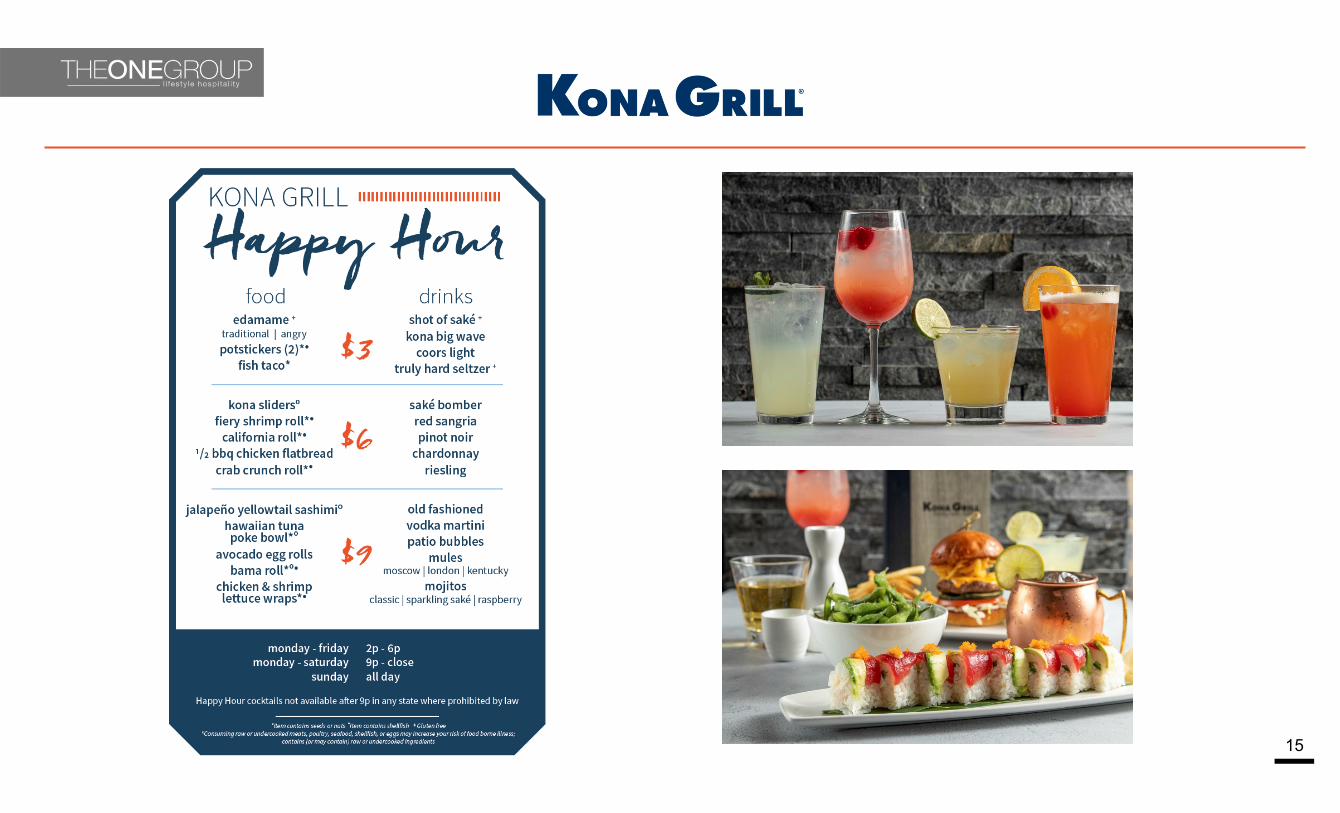
Sales Drivers - Bar
New Music Program New Uniforms New Happy Hour Menu: $3, $6, $9
Elevation of Drink Program:
Margarita Heaven
MUSIC UNIFORMS HAPPY HOUR ELEVATE
15

16
Sales Drivers - Leadership
Fully Staffed Restaurants
Hired Private Dining Sales Leadership
Developing Sales Driving Culture
STAFFING EVENT SALES SALES DRIVING

17
Sales Drivers - Events
Rollout New Software Program that Connects all Delivery Platforms
Launched New Events & Private
Dining Menu
Identified Spaces for Private Dining in Every
Location
Begin Relaunching of Offsite Catering
SOFTWARE MENU EVENT SPACES OFFSITE CATERING
18
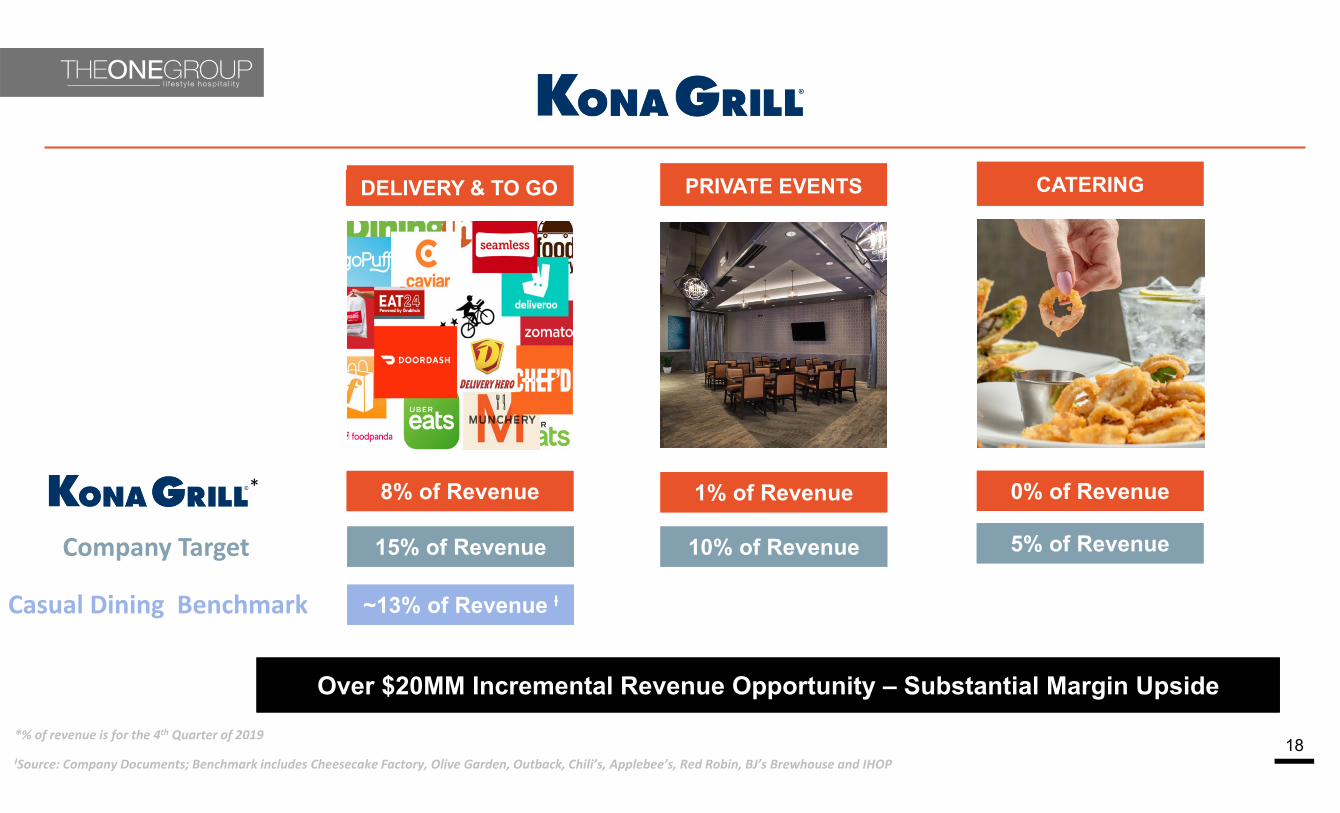
DELIVERY & TO GO PRIVATE EVENTS CATERING
Casual Dining Benchmark
8% of Revenue 1% of Revenue 0% of Revenue
~13% of Revenue Ɨ
Over $20MM Incremental Revenue Opportunity – Substantial Margin UpsideOver $20MM Incremental Revenue Opportunity – Substantial Margin Upside
*
*% of revenue is for the 4th Quarter of 2019
ƗSource: Company Documents; Benchmark includes Cheesecake Factory, Olive Garden, Outback, Chili’s, Applebee’s, Red Robin, BJ’s Brewhouse and IHOP
Company Target 15% of Revenue 10% of Revenue 5% of Revenue
19
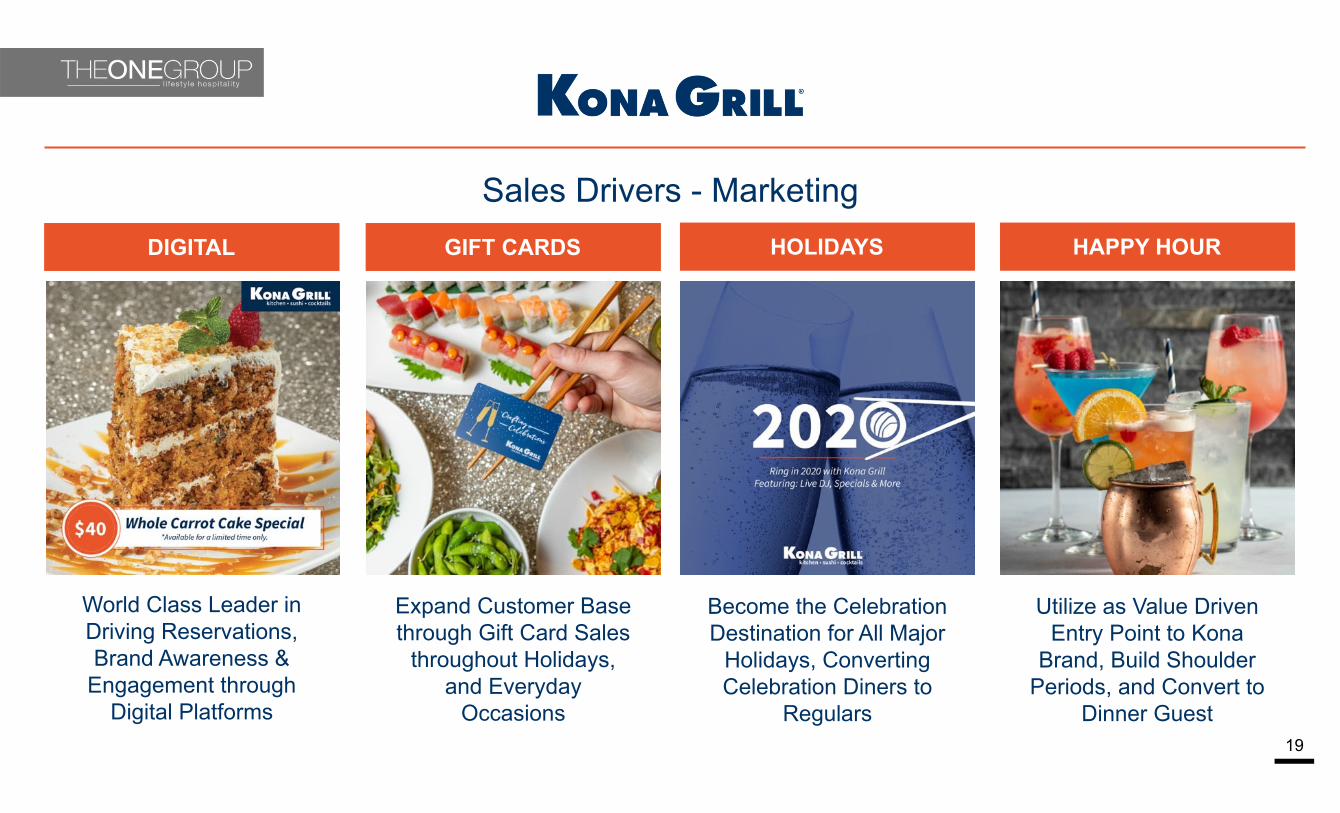
Sales Drivers - Marketing
World Class Leader in Driving Reservations, Brand Awareness &
Engagement through Digital Platforms
Expand Customer Base through Gift Card Sales
throughout Holidays, and Everyday
Occasions
Become the Celebration Destination for All Major
Holidays, Converting Celebration Diners to
Regulars
Utilize as Value Driven Entry Point to Kona
Brand, Build Shoulder Periods, and Convert to
Dinner Guest
DIGITAL GIFT CARDS HOLIDAYS HAPPY HOUR
DEVELOPMENT
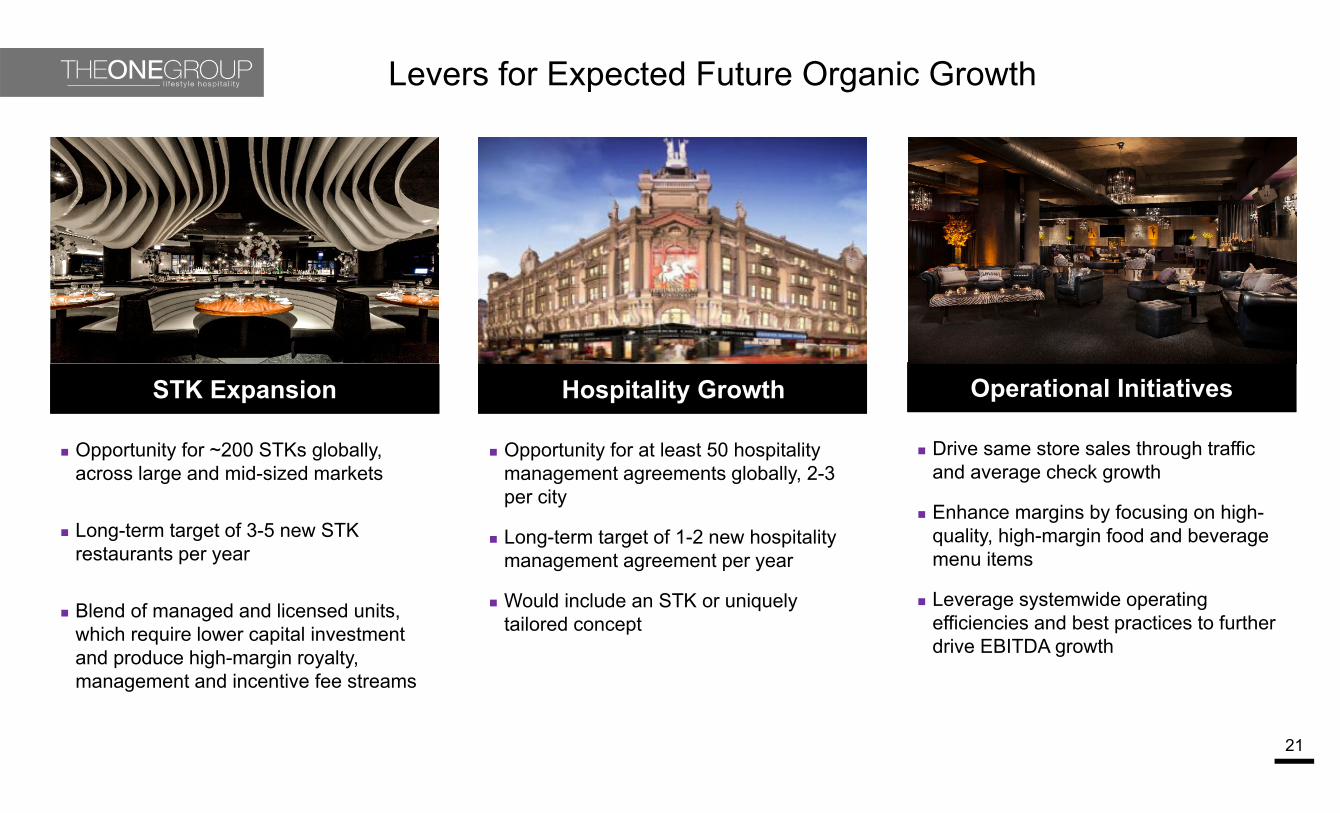
Levers for Expected Future Organic Growth
21
Hospitality Growth
Opportunity for at least 50 hospitality management agreements globally, 2-3 per city
Long-term target of 1-2 new hospitality management agreement per year
Would include an STK or uniquely tailored concept
Operational Initiatives
Drive same store sales through traffic and average check growth
Enhance margins by focusing on high-quality, high-margin food and beverage menu items
Leverage systemwide operating efficiencies and best practices to further drive EBITDA growth
STK Expansion
Opportunity for ~200 STKs globally, across large and mid-sized markets
Long-term target of 3-5 new STK restaurants per year
Blend of managed and licensed units, which require lower capital investment and produce high-margin royalty, management and incentive fee streams

STK: Differentiated Steakhouse with High-Energy & Great Atmosphere
22
Reinvention of the traditional steakhouse
High-energy dining experience
Restaurants built around the bar, featuring DJ played music
High female to male customer mix
Destination locations
Superior quality with innovative menu
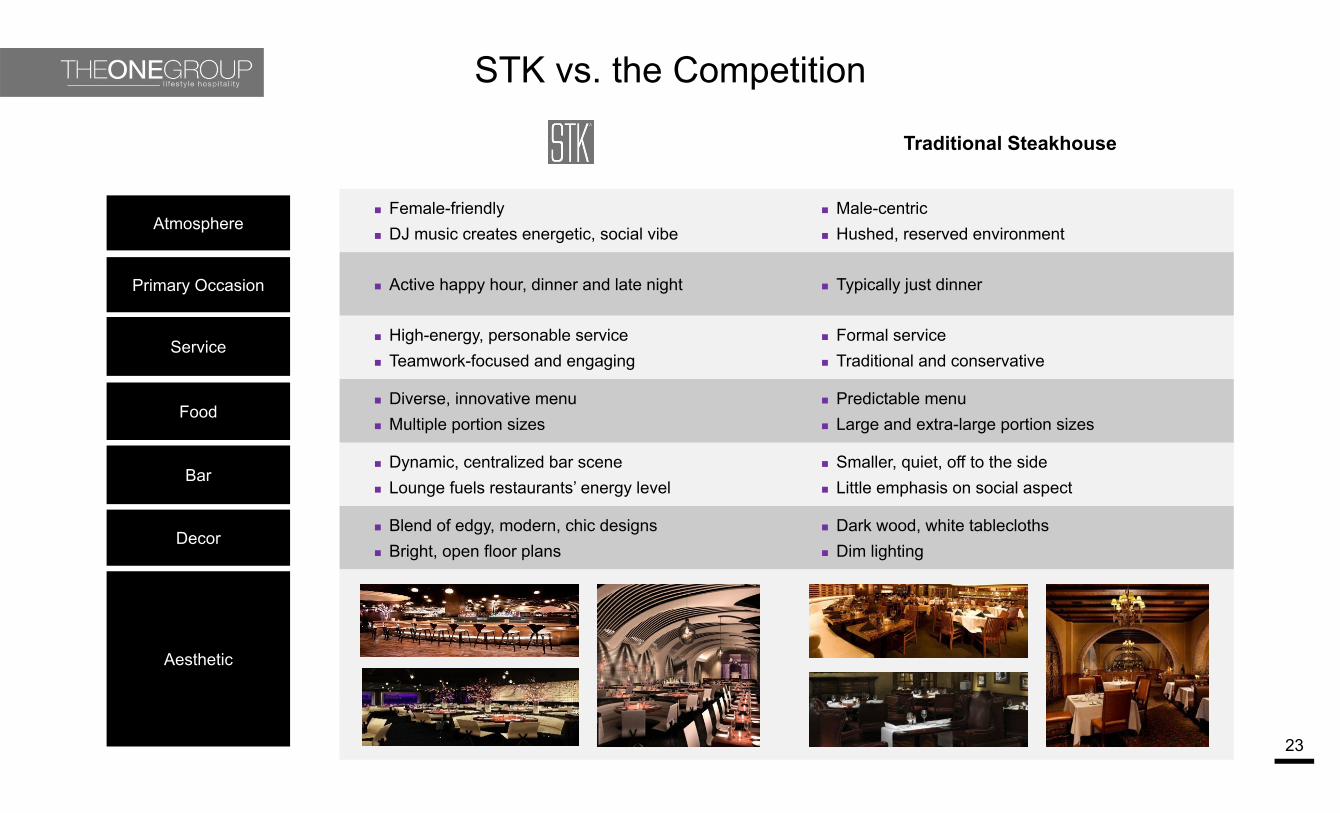
STK vs. the Competition
23
Traditional Steakhouse
Female-friendly DJ music creates energetic, social vibe
Male-centric Hushed, reserved environment
Active happy hour, dinner and late night Typically just dinner
High-energy, personable service Teamwork-focused and engaging
Formal service Traditional and conservative
Diverse, innovative menu Multiple portion sizes
Predictable menu Large and extra-large portion sizes
Dynamic, centralized bar scene Lounge fuels restaurants’ energy level
Smaller, quiet, off to the side Little emphasis on social aspect
Blend of edgy, modern, chic designs Bright, open floor plans
Dark wood, white tablecloths Dim lighting
Atmosphere
Food
Aesthetic
Decor
Bar
Service
Primary Occasion
One Night At STK
24

Premier Venues
25
STK – New York Downtown STK – Miami BeachSTK – Chicago
STK – Los Angeles STK – OrlandoSTK – NY Rooftop STK – Denver
STK – Milan STK – AtlantaSTK – Ibiza STK – Toronto
STK – Las Vegas
STK – London STK – New York Midtown STK – San Diego RooftopSTK – Orlando Rooftop
STK – Mexico City
STK – Dubai Downtown
STK – Dubai Marina
STK – San Diego
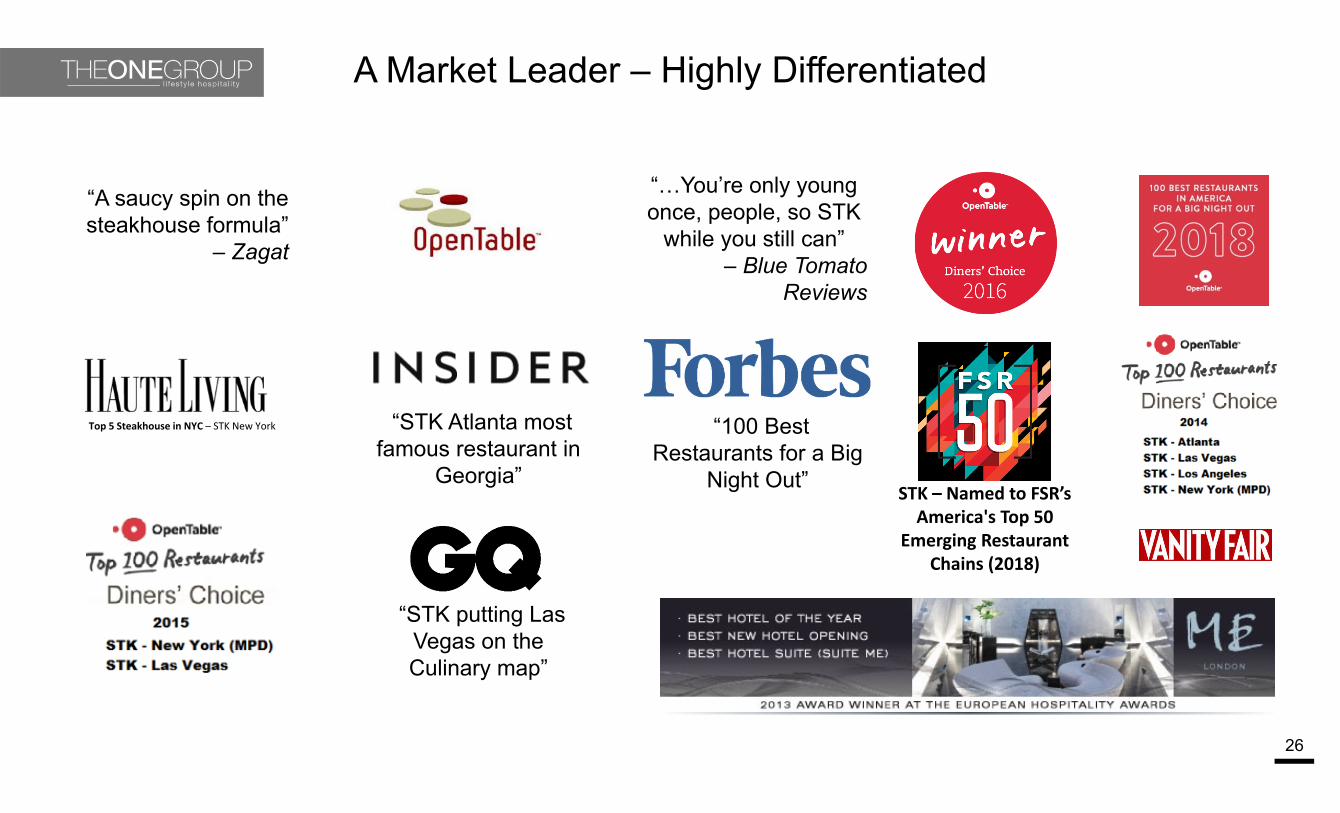
A Market Leader – Highly Differentiated
26
“A saucy spin on the steakhouse formula”
– Zagat
Top 5 Steakhouse in NYC – STK New York
“…You’re only young once, people, so STK
while you still can” – Blue Tomato
Reviews
STK – Named to FSR’s America's Top 50
Emerging Restaurant Chains (2018)
““STK Atlanta most famous restaurant in
Georgia”
““STK putting Las Vegas on the Culinary map”
““100 Best Restaurants for a Big
Night Out”
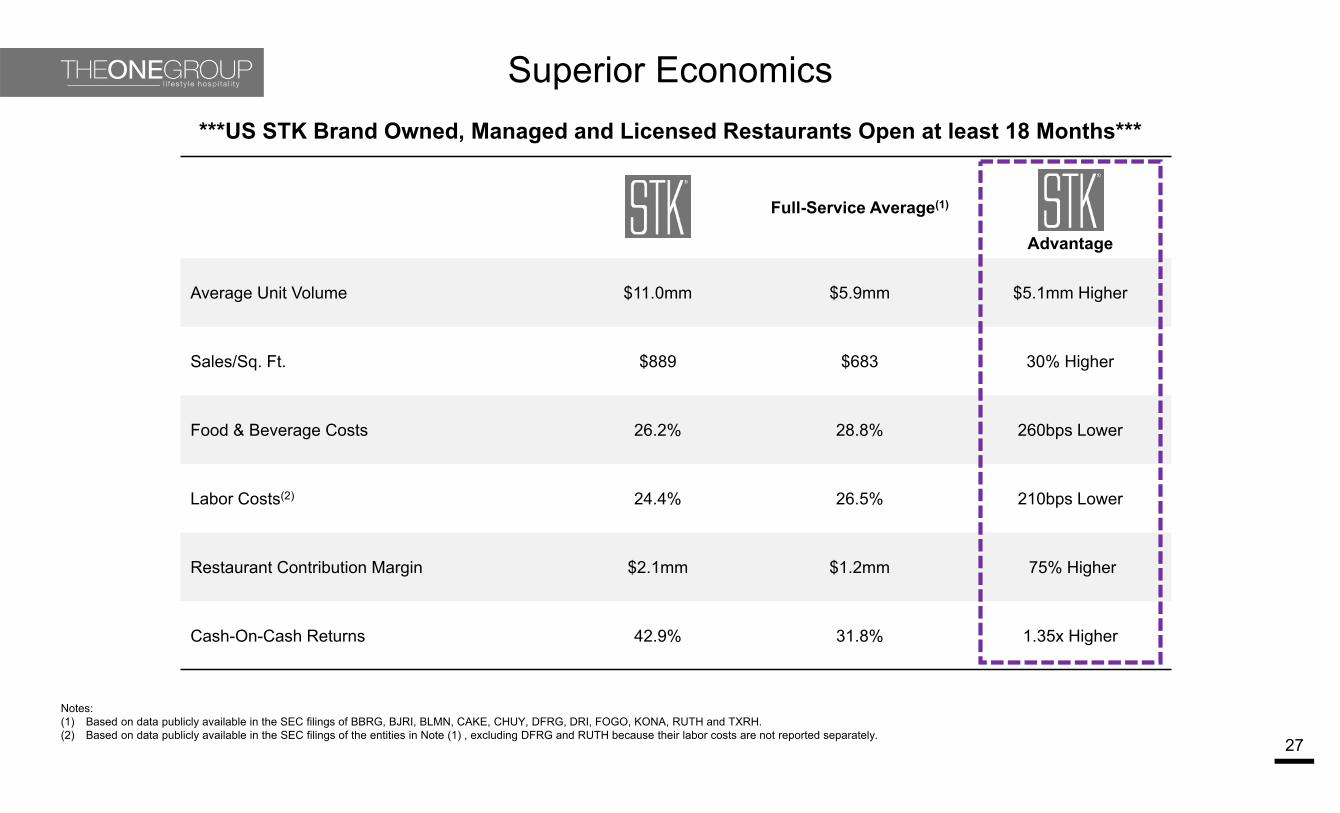
Superior Economics
27
***US STK Brand Owned, Managed and Licensed Restaurants Open at least 18 Months***
Full-Service Average(1)
Advantage
Average Unit Volume $11.0mm $5.9mm $5.1mm Higher
Sales/Sq. Ft. $889 $683 30% Higher
Food & Beverage Costs 26.2% 28.8% 260bps Lower
Labor Costs(2) 24.4% 26.5% 210bps Lower
Restaurant Contribution Margin $2.1mm $1.2mm 75% Higher
Cash-On-Cash Returns 42.9% 31.8% 1.35x Higher
Notes:(1) Based on data publicly available in the SEC filings of BBRG, BJRI, BLMN, CAKE, CHUY, DFRG, DRI, FOGO, KONA, RUTH and TXRH.(2) Based on data publicly available in the SEC filings of the entities in Note (1) , excluding DFRG and RUTH because their labor costs are not reported separately.
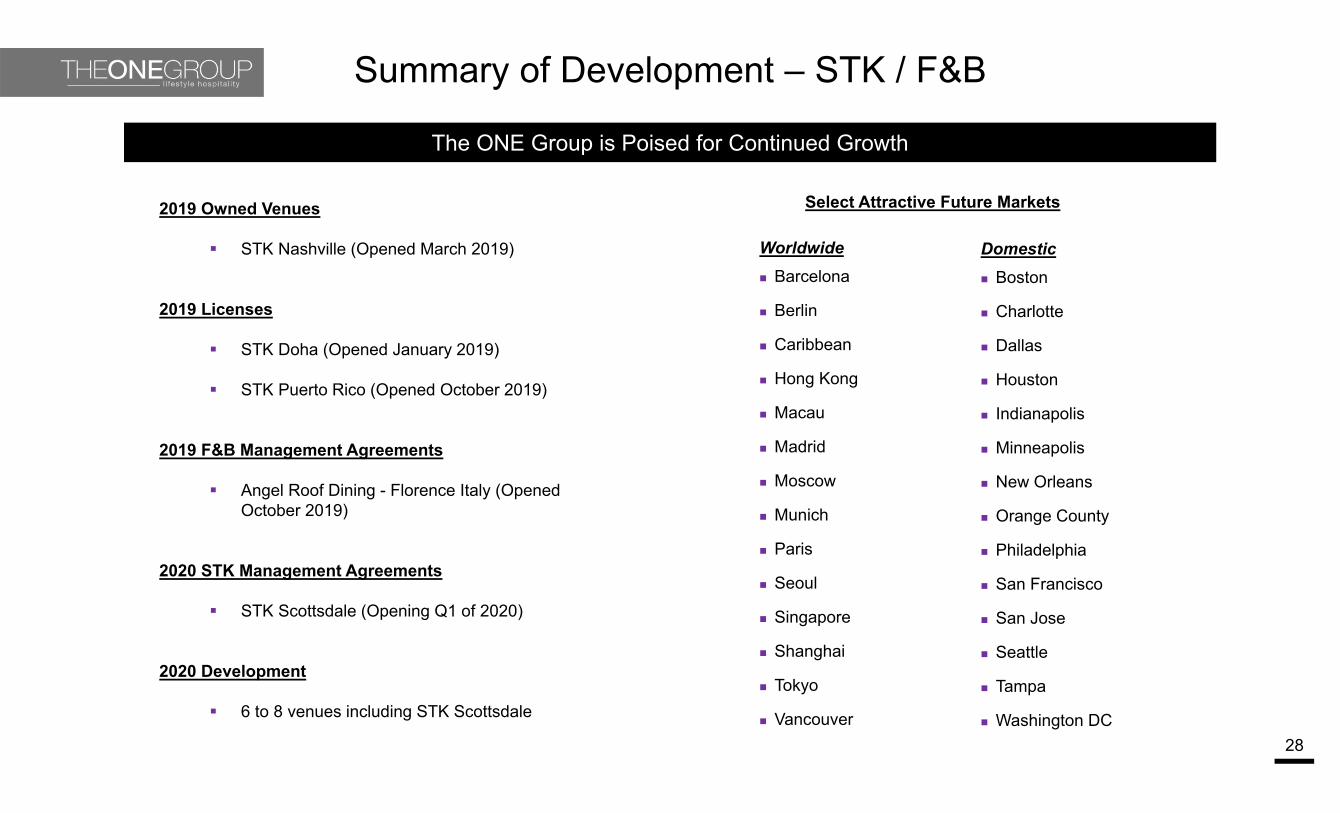
Summary of Development – STK / F&B
28
Select Attractive Future Markets
Worldwide Barcelona
Berlin
Caribbean
Hong Kong
Macau
Madrid
Moscow
Munich
Paris
Seoul
Singapore
Shanghai
Tokyo
Vancouver
Domestic Boston
Charlotte
Dallas
Houston
Indianapolis
Minneapolis
New Orleans
Orange County
Philadelphia
San Francisco
San Jose
Seattle
Tampa
Washington DC
2019 Owned Venues
STK Nashville (Opened March 2019)
2019 Licenses
STK Doha (Opened January 2019)
STK Puerto Rico (Opened October 2019)
2019 F&B Management Agreements
Angel Roof Dining - Florence Italy (Opened October 2019)
2020 STK Management Agreements
STK Scottsdale (Opening Q1 of 2020)
2020 Development
6 to 8 venues including STK Scottsdale
The ONE Group is Poised for Continued Growth
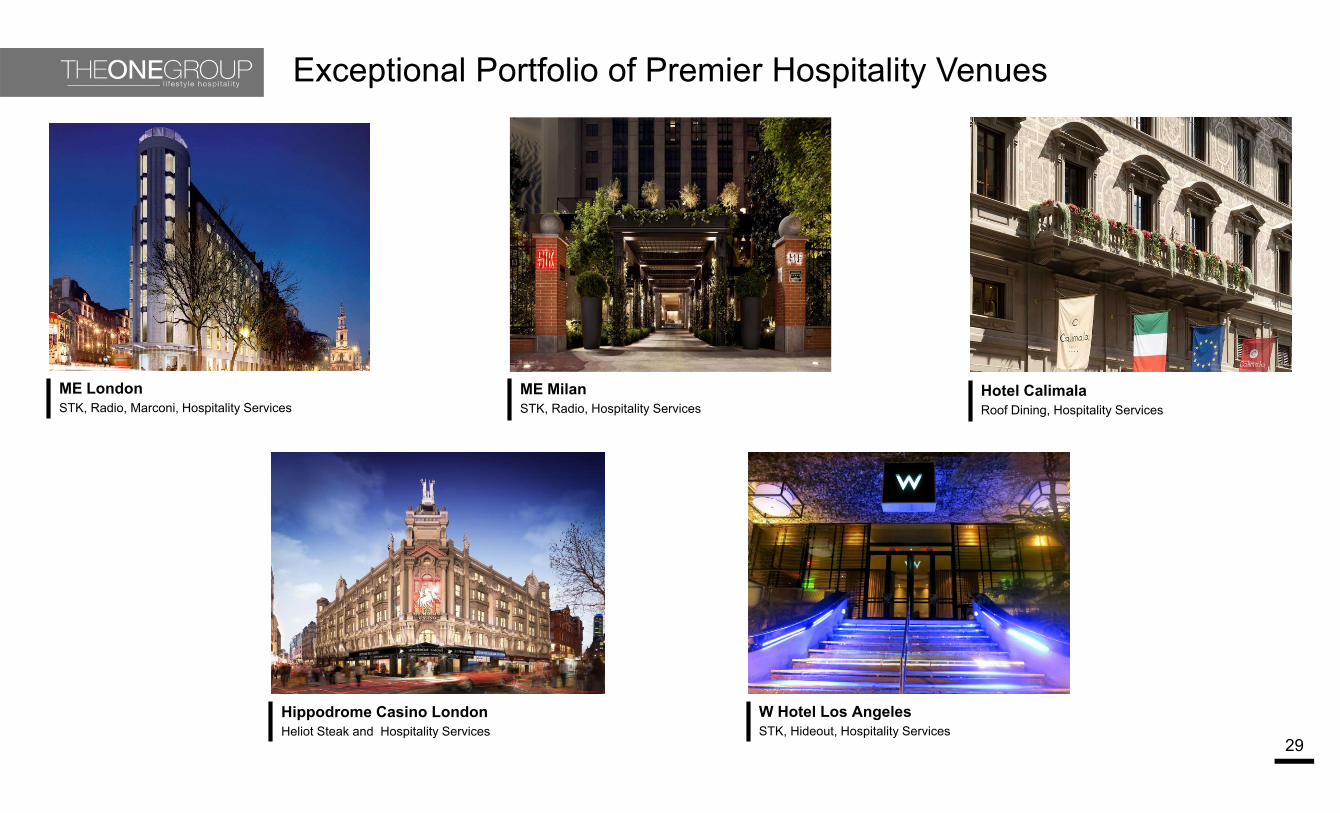
Exceptional Portfolio of Premier Hospitality Venues
29
ME MilanSTK, Radio, Hospitality Services
ME LondonSTK, Radio, Marconi, Hospitality Services
Hippodrome Casino LondonHeliot Steak and Hospitality Services
W Hotel Los AngelesSTK, Hideout, Hospitality Services
Hotel CalimalaRoof Dining, Hospitality Services
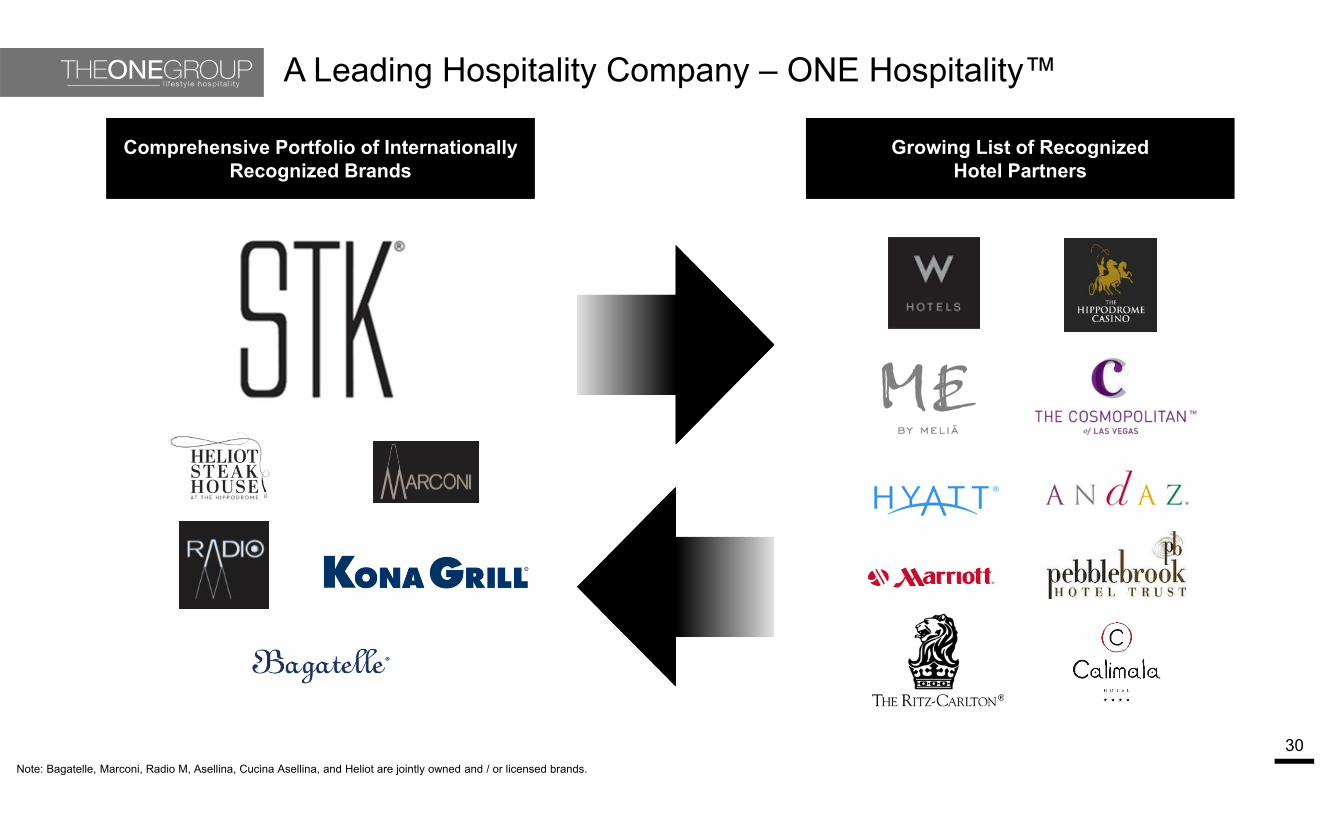
A Leading Hospitality Company – ONE Hospitality™
30
Comprehensive Portfolio of Internationally Recognized Brands
Comprehensive Portfolio of Internationally Recognized Brands
Growing List of RecognizedHotel Partners
Growing List of RecognizedHotel Partners
Note: Bagatelle, Marconi, Radio M, Asellina, Cucina Asellina, and Heliot are jointly owned and / or licensed brands.

Focus On Profitability ThroughImproving Restaurant Efficiency
31*Restaurant operating profit includes owned restaurant net revenues and expenses and exclude owned food, beverage and other net revenues and expenses**See Appendix for reconciliation of Adjusted EBITDA to GAAP Net Income.
$6.0
$9.1 $9.9
$‐
$2.0
$4.0
$6.0
$8.0
$10.0
$12.0
2017 2018 TTM Q3 2019
Restaurant Operating Profit ($ millions)
10.2%
13.8% 13.5%
0.0%
2.0%
4.0%
6.0%
8.0%
10.0%
12.0%
14.0%
16.0%
2017 2018 TTM Q3 2019
Restaurant Operating Profit %

FINANCIAL REVIEW
Strong Historical Performance and 2020 Outlook
33
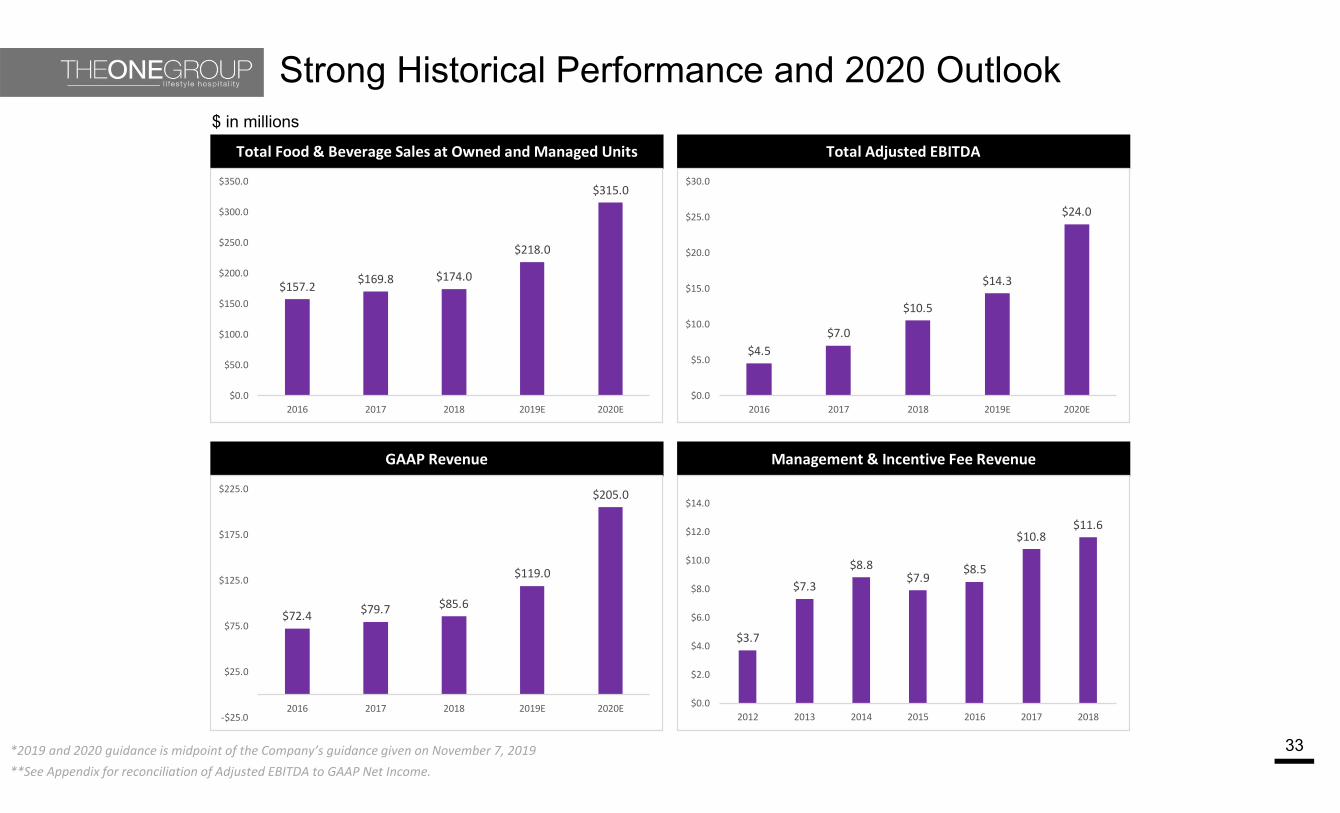
$ in millions
*2019 and 2020 guidance is midpoint of the Company’s guidance given on November 7, 2019
Total Food & Beverage Sales at Owned and Managed Units Total Adjusted EBITDA
GAAP Revenue Management & Incentive Fee Revenue
$157.2 $169.8 $174.0
$218.0
$315.0
$0.0
$50.0
$100.0
$150.0
$200.0
$250.0
$300.0
$350.0
2016 2017 2018 2019E 2020E
$4.5$7.0
$10.5
$14.3
$24.0
$0.0
$5.0
$10.0
$15.0
$20.0
$25.0
$30.0
2016 2017 2018 2019E 2020E
$72.4 $79.7 $85.6
$119.0
$205.0
‐$25.0
$25.0
$75.0
$125.0
$175.0
$225.0
2016 2017 2018 2019E 2020E
$3.7
$7.3
$8.8$7.9
$8.5
$10.8$11.6
$0.0
$2.0
$4.0
$6.0
$8.0
$10.0
$12.0
$14.0
2012 2013 2014 2015 2016 2017 2018
**See Appendix for reconciliation of Adjusted EBITDA to GAAP Net Income.
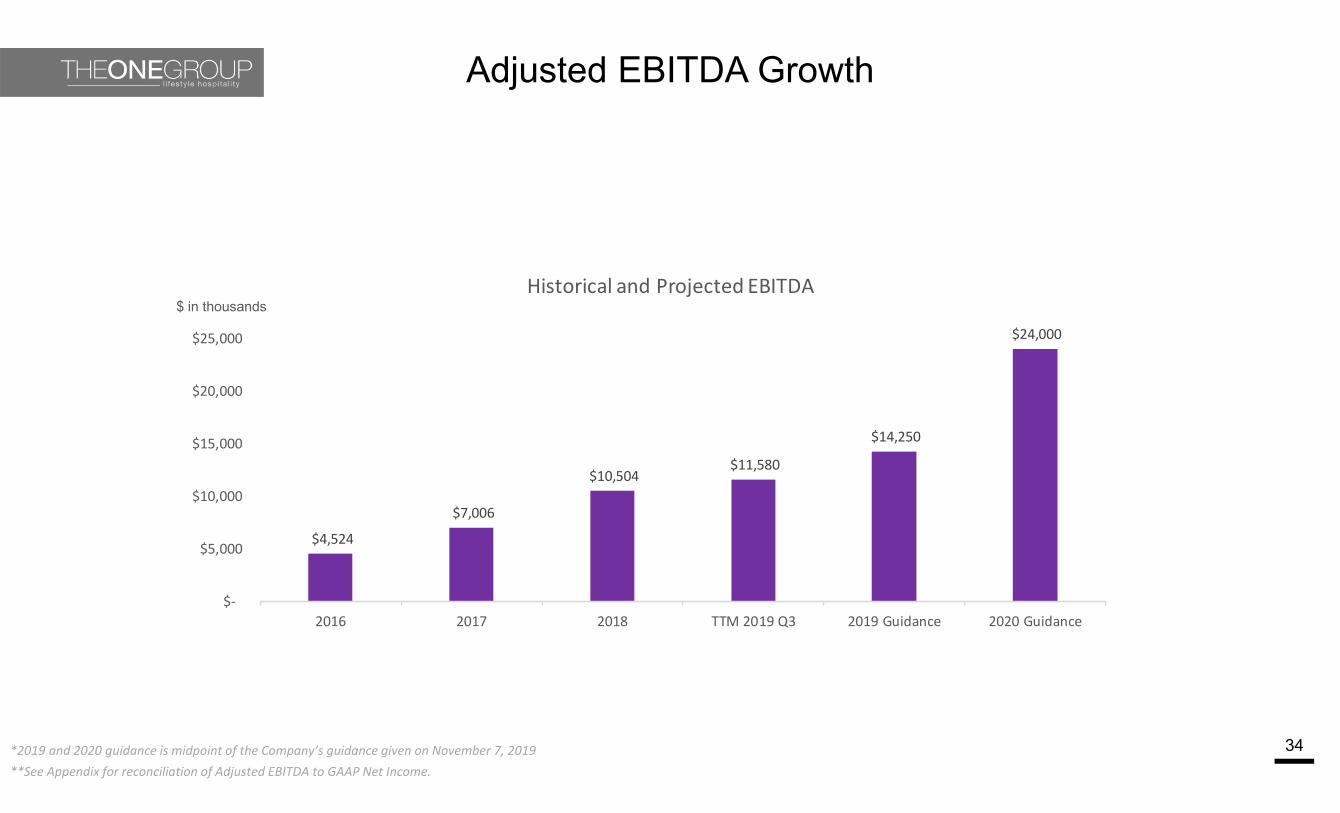
$4,524
$7,006
$10,504 $11,580
$14,250
$24,000
$‐
$5,000
$10,000
$15,000
$20,000
$25,000
2016 2017 2018 TTM 2019 Q3 2019 Guidance 2020 Guidance
Historical and Projected EBITDA
Adjusted EBITDA Growth
34
$ in thousands
*2019 and 2020 guidance is midpoint of the Company’s guidance given on November 7, 2019**See Appendix for reconciliation of Adjusted EBITDA to GAAP Net Income.
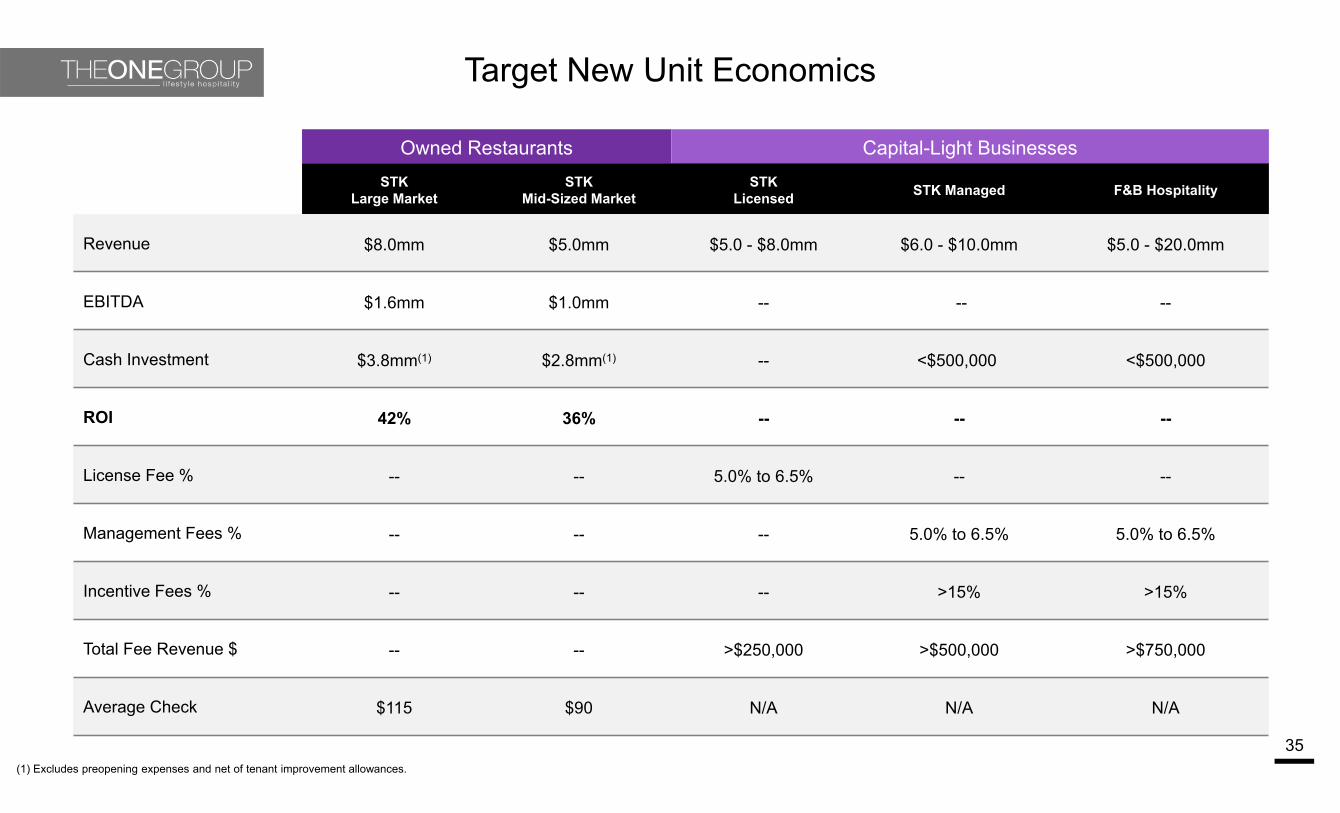
Target New Unit Economics
35
Owned Restaurants Capital-Light BusinessesSTK
Large MarketSTK
Mid-Sized MarketSTK
Licensed STK Managed F&B Hospitality
Revenue $8.0mm $5.0mm $5.0 - $8.0mm $6.0 - $10.0mm $5.0 - $20.0mm
EBITDA $1.6mm $1.0mm -- -- --
Cash Investment $3.8mm(1) $2.8mm(1) -- <$500,000 <$500,000
ROI 42% 36% -- -- --
License Fee % -- -- 5.0% to 6.5% -- --
Management Fees % -- -- -- 5.0% to 6.5% 5.0% to 6.5%
Incentive Fees % -- -- -- >15% >15%
Total Fee Revenue $ -- -- >$250,000 >$500,000 >$750,000
Average Check $115 $90 N/A N/A N/A
(1) Excludes preopening expenses and net of tenant improvement allowances.

STK GAAP Revenue and EBITDA Contribution by Ownership Type(Example - Illustrative Purposes Only)
36(1) Excludes preopening expenses and net of tenant improvement allowances.
*Assume 5.0% license fee and 50/50 split of restaurant EBITDA less license fees
Company-ownedManagement Agreement
License Agreement
System-wide Revenue $5.0MM $5.0MM $5.0MM
COGS 25% 25% 25%
Other Operating 55% 55% 55%
Restaurant EBITDA (Before License & Management Fees) $1.0MM $1.0MM $1.0MM
Management & License Revenue* -$ $250K $250K
Profit Share* -$ $375K $250K
GAAP Revenue $5.0MM $625K $250K
EBITDA Contribution $1.0MM $625K $250K
Cash Investment(1)$2.8MM -$ -$

Focus On Reduction of Corporate G&A to Increase Profitability & Improve Leverage
37*Adjusted G&A does not include stock‐based compensation or integration expenses**See Appendix for reconciliation of Adjusted G&A to GAAP G&A.
$10.3 $10.8 $9.8 $9.6
$13.3
$‐
$2.0
$4.0
$6.0
$8.0
$10.0
$12.0
$14.0
2016 2017 2018 TTM Q3 2019 2020Guidance
Adjusted G&A ($ millions)
14.3% 13.6%
11.5%10.2%
6.5%
2016 2017 2018 TTM Q3 2019 2020Guidance
Adjusted G&A % of GAAP Revenue
***2020 guidance is midpoint of the Company’s guidance given on November 7, 2019
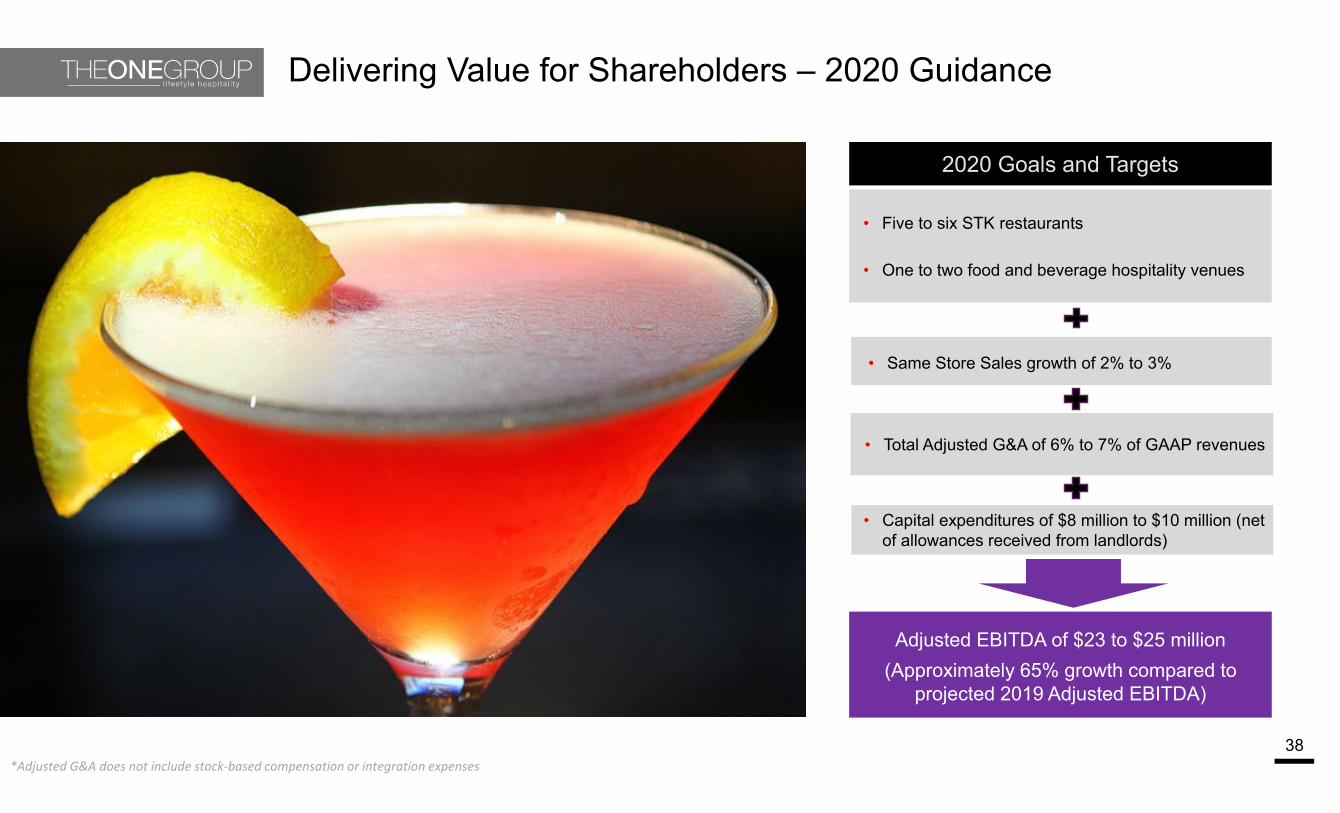
Delivering Value for Shareholders – 2020 Guidance
38
• Five to six STK restaurants
• One to two food and beverage hospitality venues
Adjusted EBITDA of $23 to $25 million(Approximately 65% growth compared to
projected 2019 Adjusted EBITDA)
2020 Goals and Targets
• Same Store Sales growth of 2% to 3%
• Capital expenditures of $8 million to $10 million (net of allowances received from landlords)
• Total Adjusted G&A of 6% to 7% of GAAP revenues
*Adjusted G&A does not include stock‐based compensation or integration expenses
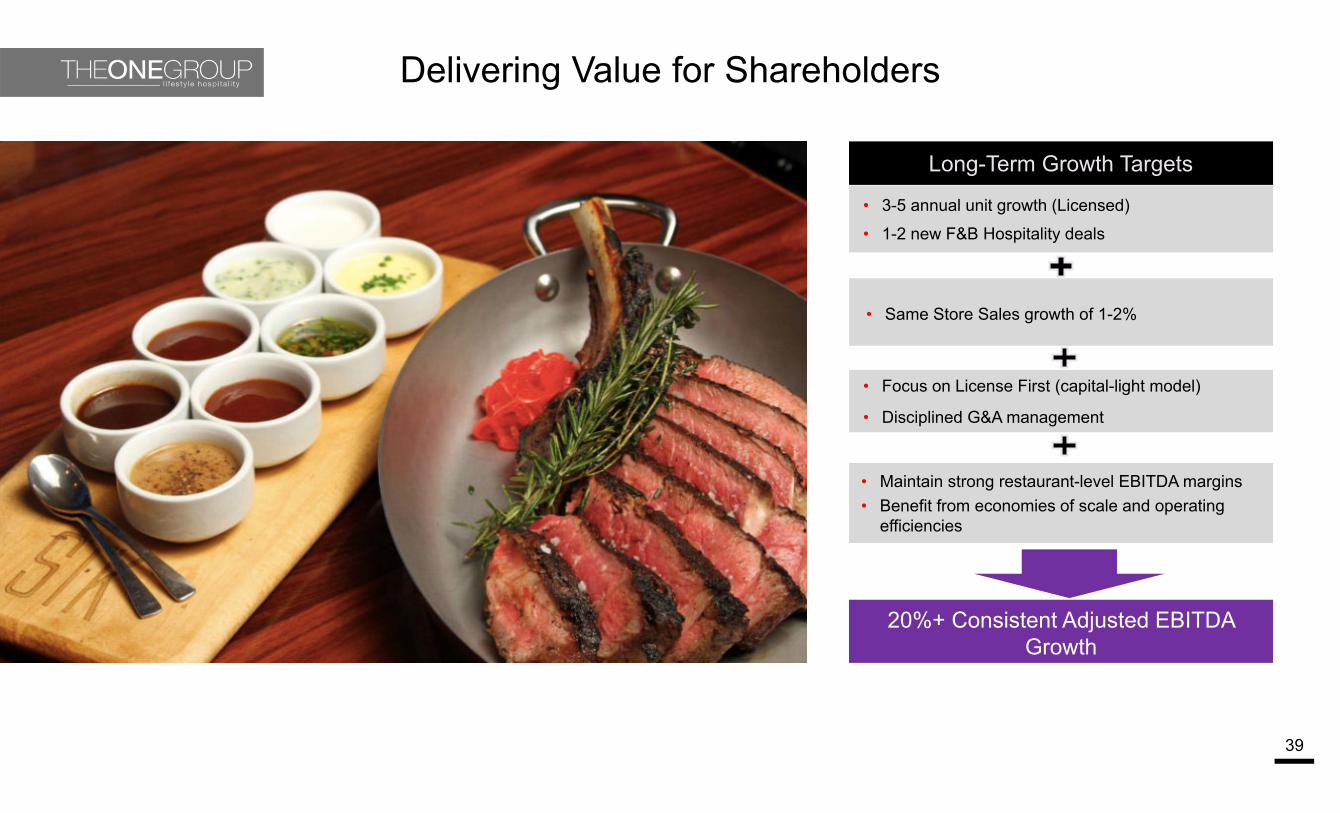
Delivering Value for Shareholders
39
• 3-5 annual unit growth (Licensed)• 1-2 new F&B Hospitality deals
20%+ Consistent Adjusted EBITDA Growth
Long-Term Growth Targets
• Same Store Sales growth of 1-2%
• Maintain strong restaurant-level EBITDA margins• Benefit from economies of scale and operating
efficiencies
• Focus on License First (capital-light model)
• Disciplined G&A management
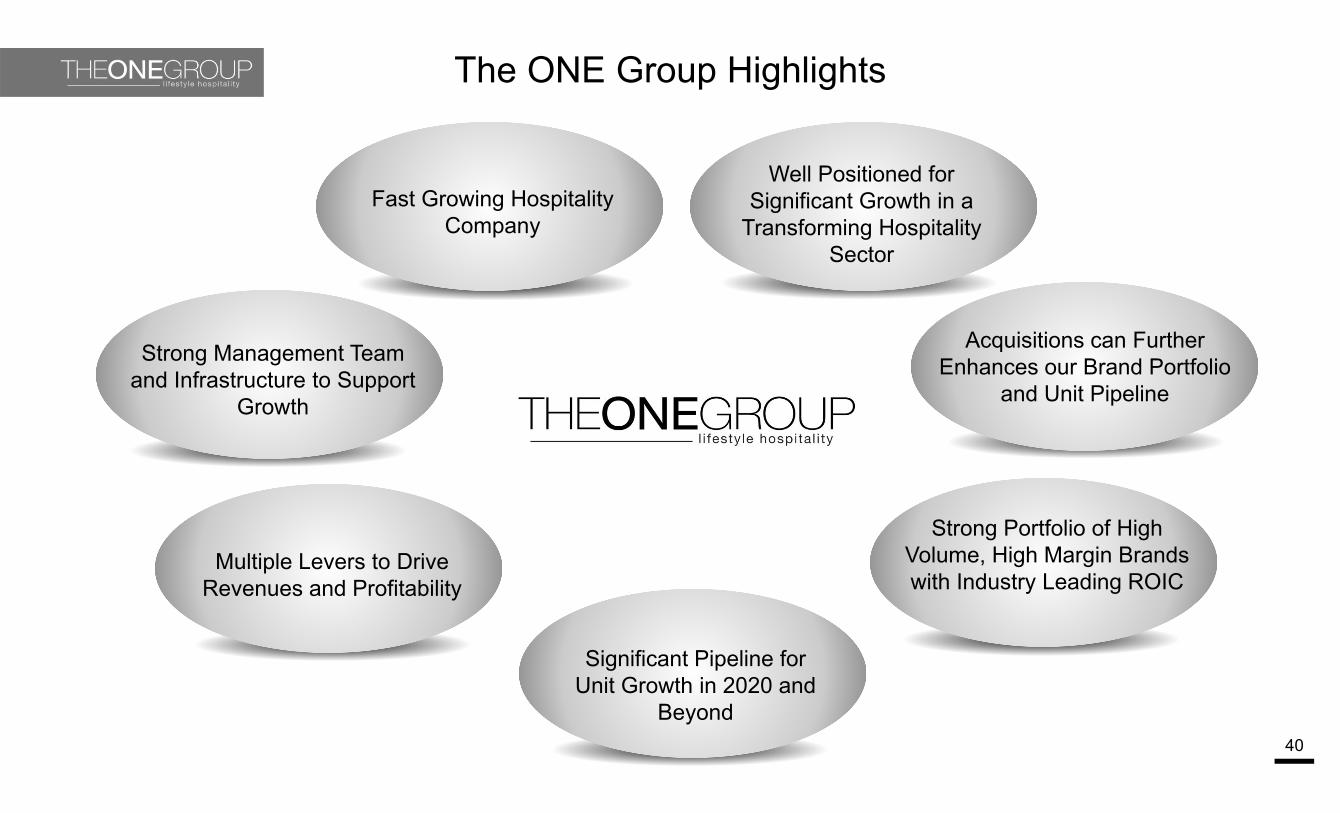
The ONE Group Highlights
40
Fast Growing Hospitality Company
Strong Management Team and Infrastructure to Support
Growth
Multiple Levers to Drive Revenues and Profitability
Significant Pipeline for Unit Growth in 2020 and
Beyond
Strong Portfolio of High Volume, High Margin Brands with Industry Leading ROIC
Acquisitions can Further Enhances our Brand Portfolio
and Unit Pipeline
Well Positioned for Significant Growth in a
Transforming Hospitality Sector
APPENDIX
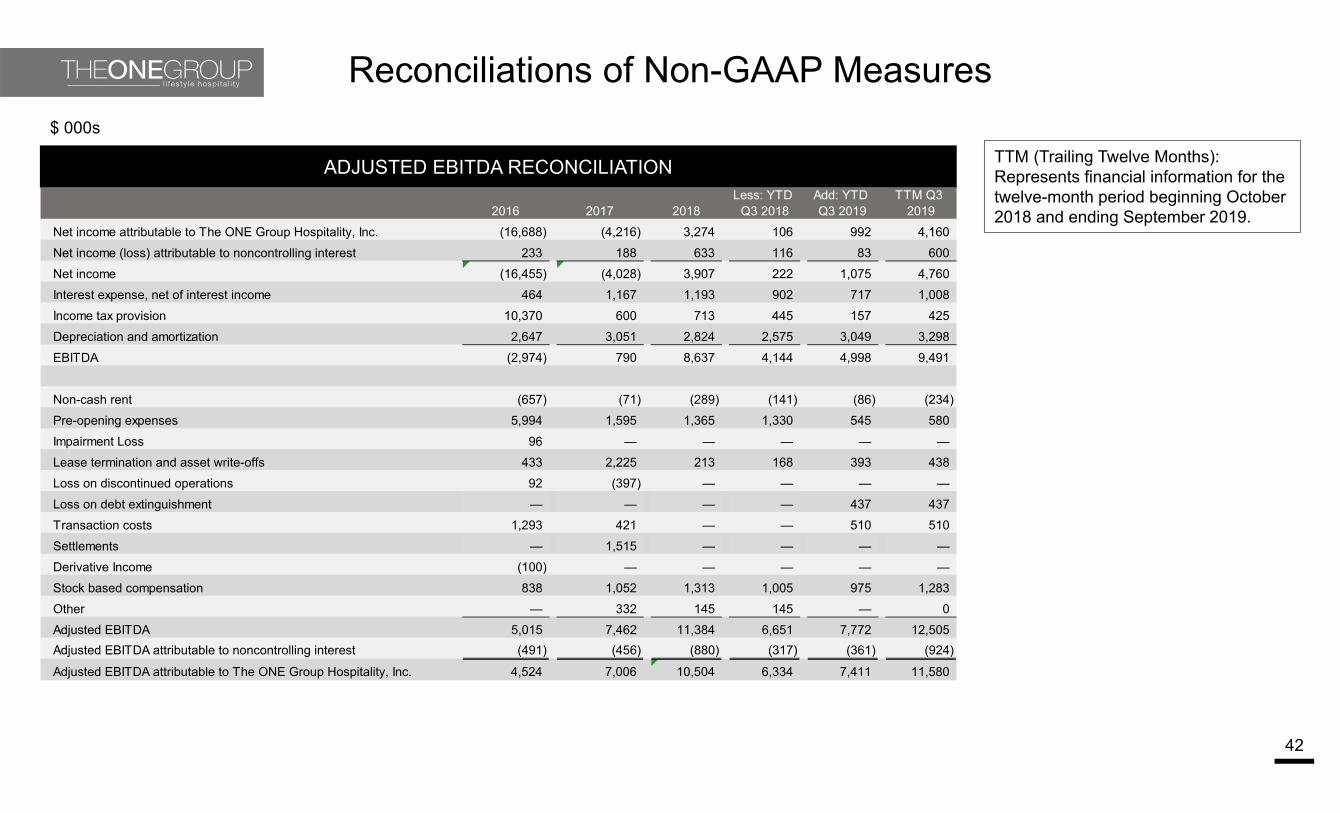
Reconciliations of Non-GAAP Measures
42
ADJUSTED EBITDA RECONCILIATION
$ 000s
TTM (Trailing Twelve Months): Represents financial information for the twelve-month period beginning October 2018 and ending September 2019. 2016 2017 2018
Less: YTD Q3 2018
Add: YTD Q3 2019
TTM Q3 2019
Net income attributable to The ONE Group Hospitality, Inc. (16,688) (4,216) 3,274 106 992 4,160Net income (loss) attributable to noncontrolling interest 233 188 633 116 83 600Net income (16,455) (4,028) 3,907 222 1,075 4,760Interest expense, net of interest income 464 1,167 1,193 902 717 1,008Income tax provision 10,370 600 713 445 157 425Depreciation and amortization 2,647 3,051 2,824 2,575 3,049 3,298EBITDA (2,974) 790 8,637 4,144 4,998 9,491
Non-cash rent (657) (71) (289) (141) (86) (234)Pre-opening expenses 5,994 1,595 1,365 1,330 545 580Impairment Loss 96 — — — — —Lease termination and asset write-offs 433 2,225 213 168 393 438Loss on discontinued operations 92 (397) — — — —Loss on debt extinguishment — — — — 437 437Transaction costs 1,293 421 — — 510 510Settlements — 1,515 — — — —Derivative Income (100) — — — — —Stock based compensation 838 1,052 1,313 1,005 975 1,283Other — 332 145 145 — 0Adjusted EBITDA 5,015 7,462 11,384 6,651 7,772 12,505Adjusted EBITDA attributable to noncontrolling interest (491) (456) (880) (317) (361) (924)
Adjusted EBITDA attributable to The ONE Group Hospitality, Inc. 4,524 7,006 10,504 6,334 7,411 11,580
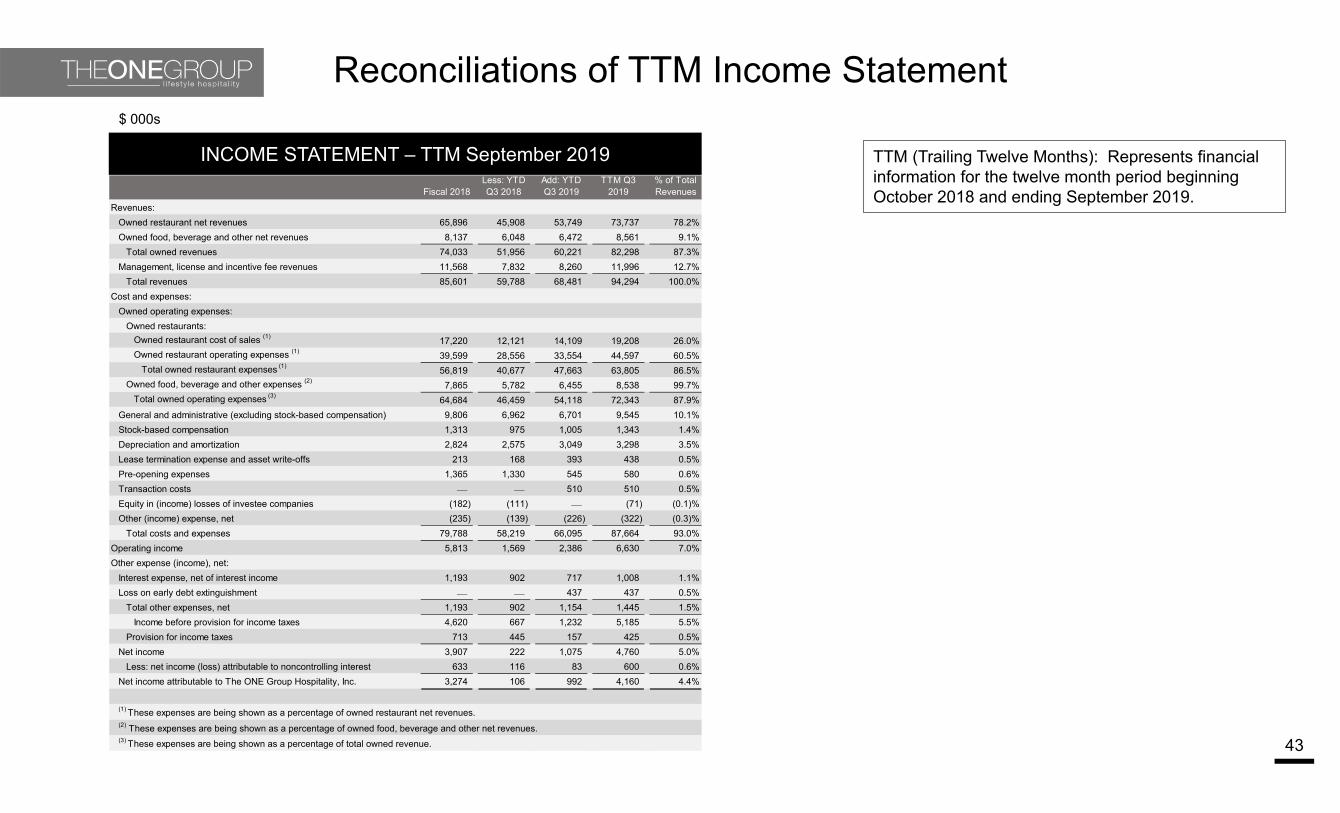
Reconciliations of TTM Income Statement
43
INCOME STATEMENT – TTM September 2019
$ 000s
Fiscal 2018Less: YTD Q3 2018
Add: YTD Q3 2019
TTM Q3 2019
% of Total Revenues
Revenues:Owned restaurant net revenues 65,896 45,908 53,749 73,737 78.2%Owned food, beverage and other net revenues 8,137 6,048 6,472 8,561 9.1%
Total owned revenues 74,033 51,956 60,221 82,298 87.3%Management, license and incentive fee revenues 11,568 7,832 8,260 11,996 12.7%
Total revenues 85,601 59,788 68,481 94,294 100.0%Cost and expenses:
Owned operating expenses:Owned restaurants:
Owned restaurant cost of sales (1) 17,220 12,121 14,109 19,208 26.0%Owned restaurant operating expenses (1) 39,599 28,556 33,554 44,597 60.5%
Total owned restaurant expenses (1) 56,819 40,677 47,663 63,805 86.5%Owned food, beverage and other expenses (2) 7,865 5,782 6,455 8,538 99.7%
Total owned operating expenses (3) 64,684 46,459 54,118 72,343 87.9%General and administrative (excluding stock-based compensation) 9,806 6,962 6,701 9,545 10.1%Stock-based compensation 1,313 975 1,005 1,343 1.4%Depreciation and amortization 2,824 2,575 3,049 3,298 3.5%Lease termination expense and asset write-offs 213 168 393 438 0.5%Pre-opening expenses 1,365 1,330 545 580 0.6%Transaction costs — — 510 510 0.5%Equity in (income) losses of investee companies (182) (111) — (71) (0.1)%Other (income) expense, net (235) (139) (226) (322) (0.3)%
Total costs and expenses 79,788 58,219 66,095 87,664 93.0%Operating income 5,813 1,569 2,386 6,630 7.0%Other expense (income), net:
Interest expense, net of interest income 1,193 902 717 1,008 1.1%Loss on early debt extinguishment — — 437 437 0.5%
Total other expenses, net 1,193 902 1,154 1,445 1.5%Income before provision for income taxes 4,620 667 1,232 5,185 5.5%
Provision for income taxes 713 445 157 425 0.5%Net income 3,907 222 1,075 4,760 5.0%
Less: net income (loss) attributable to noncontrolling interest 633 116 83 600 0.6%Net income attributable to The ONE Group Hospitality, Inc. 3,274 106 992 4,160 4.4%
(1) These expenses are being shown as a percentage of owned restaurant net revenues.(2) These expenses are being shown as a percentage of owned food, beverage and other net revenues.(3) These expenses are being shown as a percentage of total owned revenue.
TTM (Trailing Twelve Months): Represents financial information for the twelve month period beginning October 2018 and ending September 2019.
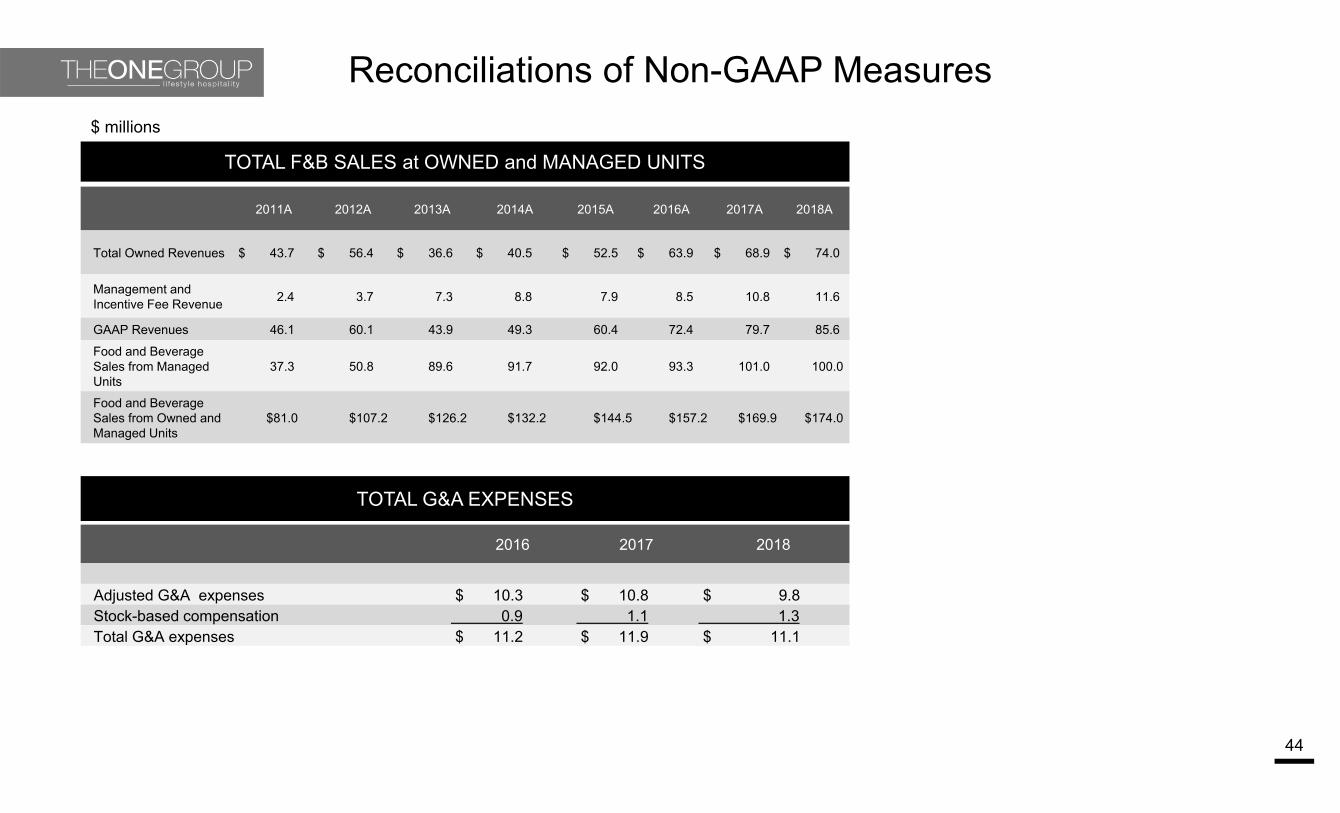
Reconciliations of Non-GAAP Measures
44
2011A 2012A 2013A 2014A 2015A 2016A 2017A 2018A
Total Owned Revenues $ 43.7 $ 56.4 $ 36.6 $ 40.5 $ 52.5 $ 63.9 $ 68.9 $ 74.0
Management and Incentive Fee Revenue 2.4 3.7 7.3 8.8 7.9 8.5 10.8 11.6
GAAP Revenues 46.1 60.1 43.9 49.3 60.4 72.4 79.7 85.6
Food and Beverage Sales from Managed Units
37.3 50.8 89.6 91.7 92.0 93.3 101.0 100.0
Food and Beverage Sales from Owned and Managed Units
$81.0 $107.2 $126.2 $132.2 $144.5 $157.2 $169.9 $174.0
TOTAL F&B SALES at OWNED and MANAGED UNITS
$ millions
2016 2017 2018
Adjusted G&A expenses $ 10.3 $ 10.8 $ 9.8Stock-based compensation 0.9 1.1 1.3 Total G&A expenses $ 11.2 $ 11.9 $ 11.1
TOTAL G&A EXPENSES