Embed Size (px)
Citation preview
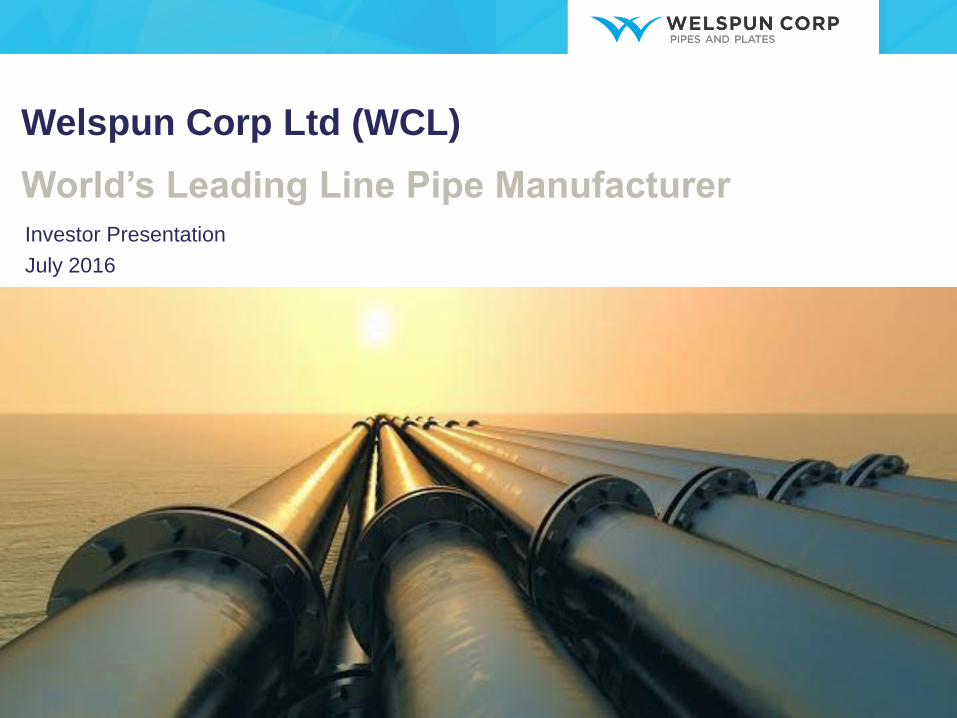
Welspun Corp Ltd (WCL) World’s Leading Line Pipe Manufacturer Investor Presentation
July 2016
This presentation and the accompanying slides (the “Presentation”), which have been prepared by Welspun Corp Limited (the “Company”), have been prepared solely for information purposes and do not constitute any offer, recommendation or invitation to purchase or subscribe for any securities, and shall not form the basis or be relied on in connection with any contract or binding commitment whatsoever. No offering of securities of the Company will be made except by means of a statutory offering document containing detailed information about the Company.
This Presentation has been prepared by the Company based on information and data which the Company considers reliable, but the Company makes no representation or warranty, express or implied, whatsoever, and no reliance shall be placed on, the truth, accuracy, completeness, fairness and reasonableness of the contents of this Presentation. This Presentation may not be all inclusive and may not contain all of the information that you may consider material. Any liability in respect of the contents of, or any omission from, this Presentation is expressly excluded.
This presentation contains certain forward looking statements concerning the Company’s future business prospects and business profitability, which are subject to a number of risks and uncertainties and the actual results could materially differ from those in such forward looking statements. The risks and uncertainties relating to these statements include, but are not limited to, risks and uncertainties regarding fluctuations in earnings, our ability to manage growth, competition (both domestic and international), economic growth in India and abroad, ability to attract and retain highly skilled professionals, time and cost over runs on contracts, our ability to manage our international operations, government policies and actions regulations, interest and other fiscal costs generally prevailing in the economy. The company does not undertake to make any announcement in case any of these forward looking statements become materially incorrect in future or update any forward looking statements made from time to time by or on behalf of the Company.
SAFE HARBOUR
2
3
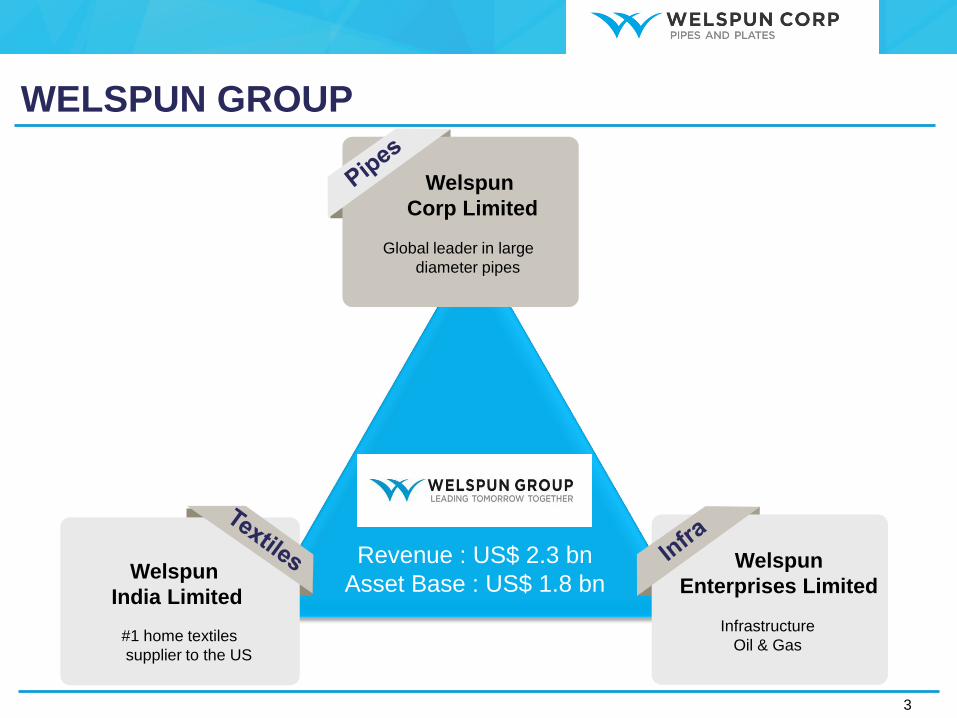
Welspun
India Limited
#1 home textiles
supplier to the US
Global leader in large
diameter pipes
Welspun
Corp Limited
Infrastructure
Oil & Gas
Welspun
Enterprises Limited
WELSPUN GROUP
Revenue : US$ 2.3 bn
Asset Base : US$ 1.8 bn

4
...focussed on midstream segment of Oil & Gas industry value chain
Exploration / Production Distribution / Retail Sale
Upstream Midstream Downstream
...and Water transmission value chain
Transportation
Denotes WCL’s presence
Line pipes are used for transporting oil, gas or water
over long distances (interstate or from offshore/
under-sea) or as gathering lines (from well to
processing centre)
WORLD’S LEADING LINE PIPE MANUFACTURER...

Incorporated as
Welspun Gujarat
Stahl Rohren
First 50 KTPA
HSAW mill at Dahej
200 KTPA LSAW mill at
Dahej with
Mannesmann Germany
Won 1,700 KM
Keystone project from
Trans Canada
Integrated plate and coil mill
at Anjar
150 KTPA HSAW mill at Anjar
350 KTPA HSAW
mill at Arkansas,
US
Renamed as Welspun Corp Ltd.
100 KTPA HSAW mill at Mandya
350 KTPA LSAW mill at
Anjar
300 KTPA HSAW mill at
Saudi Arabia
Record volumes of 1mn MT
175 KTPA small-diameter HFIW mill
in the US to cater to shale gas
business
Demerged non-pipe businesses into
Welspun Enterprises
Several new professional CXO-level
hires to bolster the core-pipe
business management team
4th year of >1mn MT volumes;
order book at record high
JV with Wasco Energy Ltd for
CWC plant
5
EMERGED TO BECOME LEADER
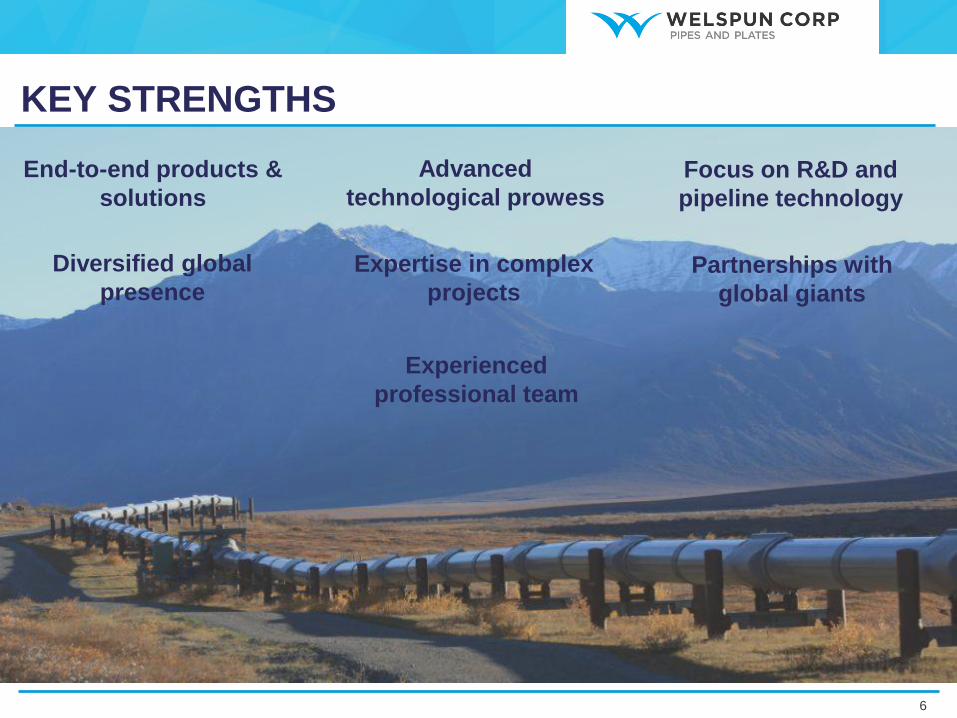
End-to-end products &
solutions
Advanced
technological prowess Focus on R&D and
pipeline technology
Partnerships with
global giants
Experienced
professional team
Diversified global
presence
Expertise in complex
projects
6
KEY STRENGTHS

Longitudinally welded pipes
made from HR plates; used for
onshore / off-shore oil & gas
transmission
16 – 60 inch diameter, high wall
thickness
LSAW Pipes
Helically welded pipes made
from HR coils; used for on-
shore oil, gas & water
transmission
24 – 140 inch diameter,
moderate wall thickness
HSAW Pipes
High-frequency electric welded
pipes made from HR coils; used
for downstream distribution of oil,
gas & water
1.5 – 16 inch diameter,
low/moderate wall thickness
ERW/HFIW Pipes
Plates & Coils: Provides WCL with vertical integration & competitive advantage in a few market segments
Coating Systems: Concrete Weight Coating, Double Jointing, 3LPE, 3LPP, DJ, Internal Solvent /Solvent free coating,
Coal Tar Enamel, Inside Cement Mortar Lining
Ancillary services: Pipe bending, Dump Site & Inventory management
7
END-TO-END PRODUCTS & SOLUTIONS
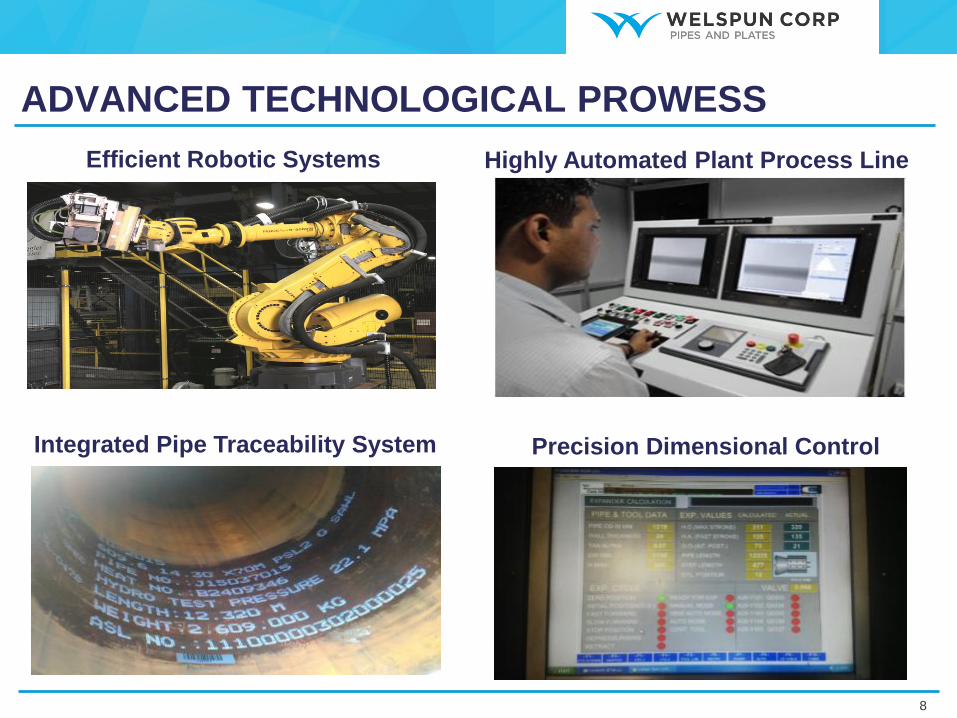
Efficient Robotic Systems Highly Automated Plant Process Line
Integrated Pipe Traceability System Precision Dimensional Control
8
ADVANCED TECHNOLOGICAL PROWESS
Technical
knowhow
with optimal
solutions
Experience of delivering pipe with stringent specifications gives us the edge
for prestigious and challenging projects like Keystone Pipeline, Peru LNG,
Wasit Gas Program, Independence Trail, IGAT-IV, Master Gas - I
Dedicated
R&D facility
Fully equipped Growth Workshop facilities to facilitate capability
enhancement, capacity expansion, de-bottlenecking, automation and
product development programs
Continuous
research
Continuous research in steel, strain-based and deep sea pipelines, welding
technology and consumables, and quality integrated management systems
Technical
expert team
Technical experts, who belong to various international technical committees
for oil and gas pipeline research, contribute to the development of new
standards for line pipe durability
9
FOCUS ON R&D AND PIPELINE TECHNOLOGY
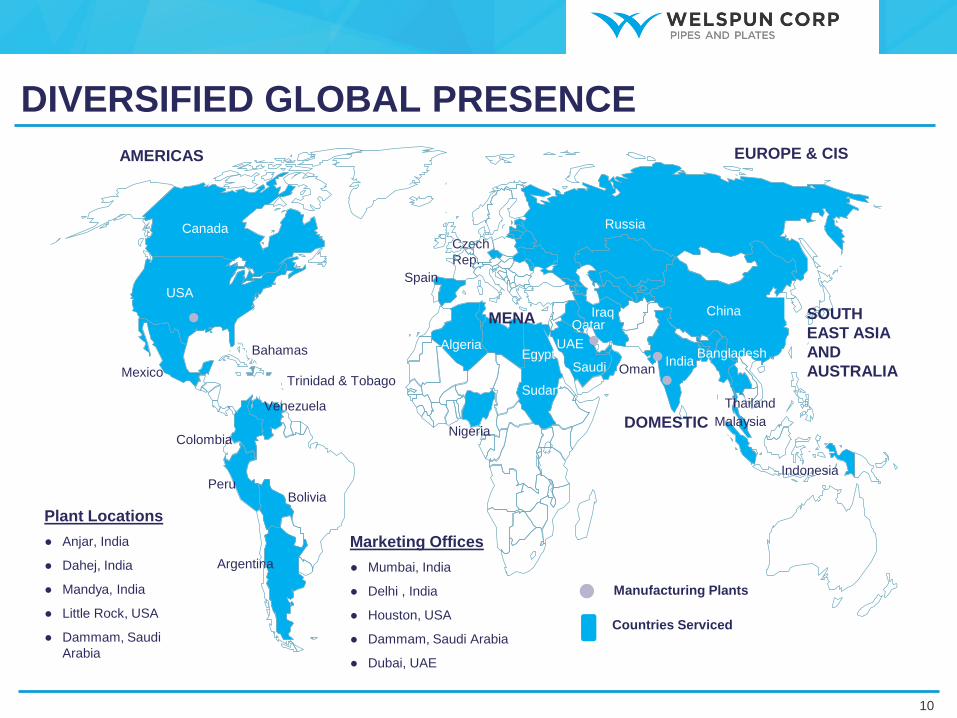
Plant Locations
● Anjar, India
● Dahej, India
● Mandya, India
● Little Rock, USA
● Dammam, Saudi
Arabia
Marketing Offices
● Mumbai, India
● Delhi , India
● Houston, USA
● Dammam, Saudi Arabia
● Dubai, UAE
Czech
Rep.
Canada
USA
Mexico
Bahamas
Trinidad & Tobago
Venezuela
Colombia
Peru Bolivia
Spain
Russia
China
India Bangladesh
Malaysia
Indonesia
Thailand
Iraq Qatar
Saudi Oman
Sudan
Egypt Algeria
Nigeria
UAE
AMERICAS
MENA SOUTH
EAST ASIA
AND
AUSTRALIA
EUROPE & CIS
DOMESTIC
Countries Serviced
Manufacturing Plants
10
DIVERSIFIED GLOBAL PRESENCE
Argentina
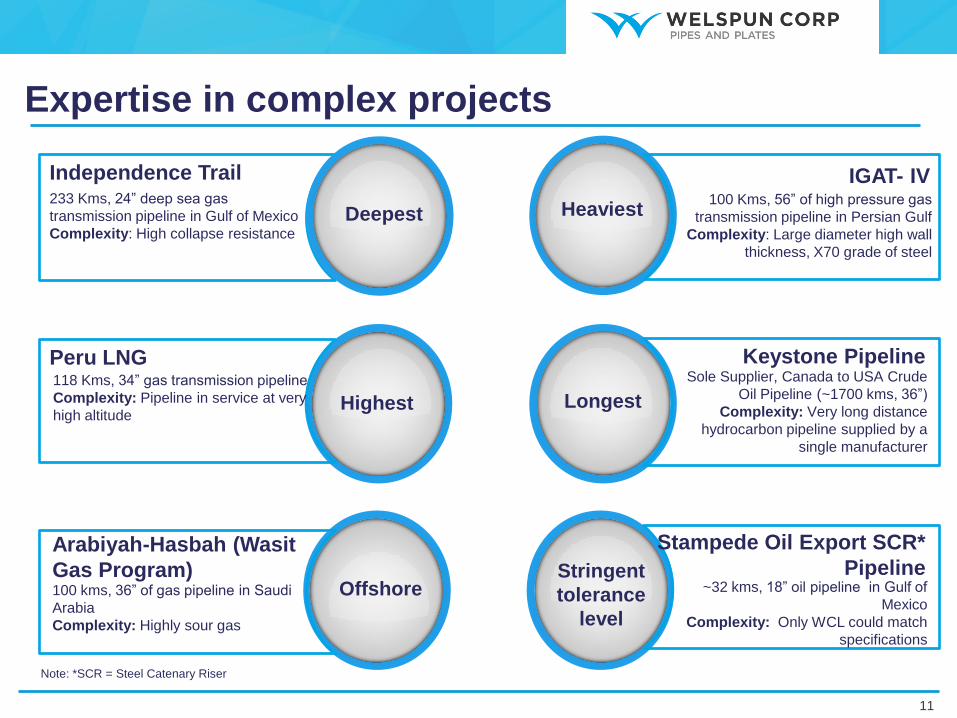
Expertise in complex projects
Independence Trail
Deepest 100 Kms, 56” of high pressure gas
transmission pipeline in Persian Gulf
Complexity: Large diameter high wall
thickness, X70 grade of steel
IGAT- IV
Heaviest
118 Kms, 34” gas transmission pipeline
Complexity: Pipeline in service at very
high altitude
Peru LNG
Highest
Sole Supplier, Canada to USA Crude
Oil Pipeline (~1700 kms, 36”)
Complexity: Very long distance
hydrocarbon pipeline supplied by a
single manufacturer
Keystone Pipeline
Longest
~32 kms, 18” oil pipeline in Gulf of
Mexico
Complexity: Only WCL could match
specifications
Stampede Oil Export SCR*
Pipeline Stringent
tolerance
level
100 kms, 36” of gas pipeline in Saudi
Arabia
Complexity: Highly sour gas
Arabiyah-Hasbah (Wasit
Gas Program) Offshore
233 Kms, 24” deep sea gas
transmission pipeline in Gulf of Mexico
Complexity: High collapse resistance
Note: *SCR = Steel Catenary Riser
11
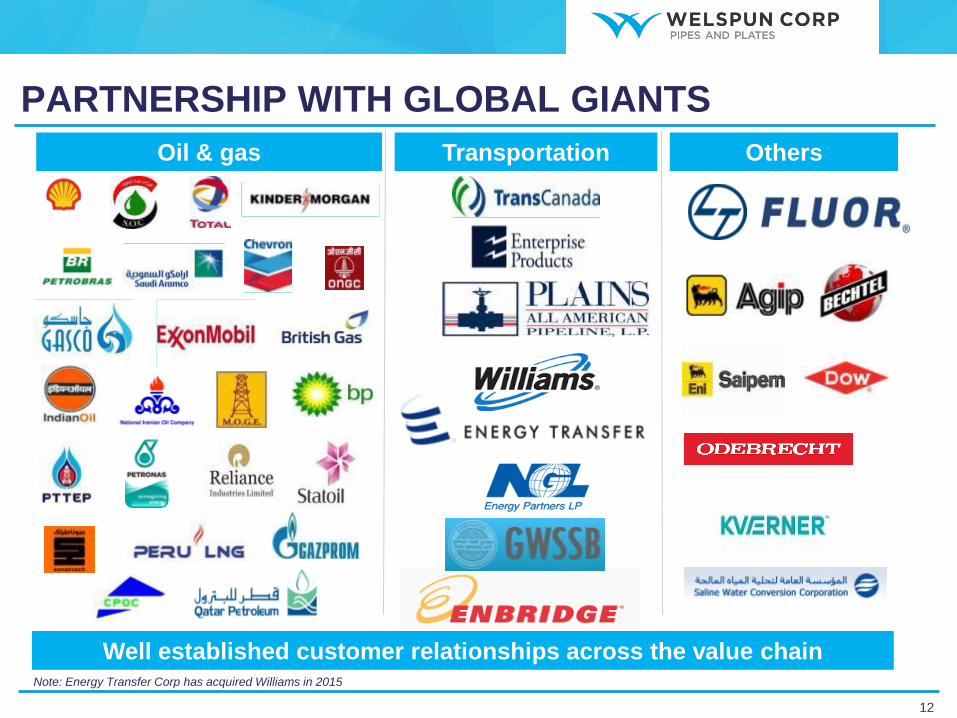
Well established customer relationships across the value chain Note: Energy Transfer Corp has acquired Williams in 2015
12
PARTNERSHIP WITH GLOBAL GIANTS
Oil & gas Transportation Others
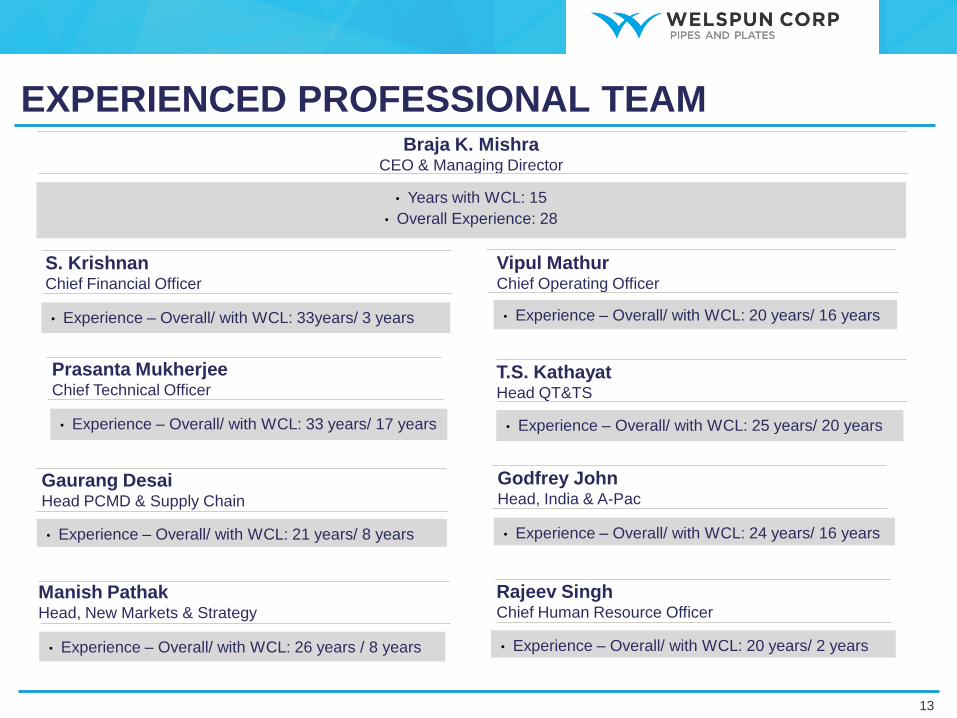
Braja K. Mishra CEO & Managing Director
• Years with WCL: 15
• Overall Experience: 28
S. Krishnan Chief Financial Officer
• Experience – Overall/ with WCL: 33years/ 3 years
Vipul Mathur Chief Operating Officer
• Experience – Overall/ with WCL: 20 years/ 16 years
Godfrey John Head, India & A-Pac
• Experience – Overall/ with WCL: 24 years/ 16 years
T.S. Kathayat Head QT&TS
• Experience – Overall/ with WCL: 25 years/ 20 years
Prasanta Mukherjee Chief Technical Officer
• Experience – Overall/ with WCL: 33 years/ 17 years
Manish Pathak Head, New Markets & Strategy
• Experience – Overall/ with WCL: 26 years / 8 years
Gaurang Desai Head PCMD & Supply Chain
• Experience – Overall/ with WCL: 21 years/ 8 years
Rajeev Singh Chief Human Resource Officer
• Experience – Overall/ with WCL: 20 years/ 2 years
13
EXPERIENCED PROFESSIONAL TEAM
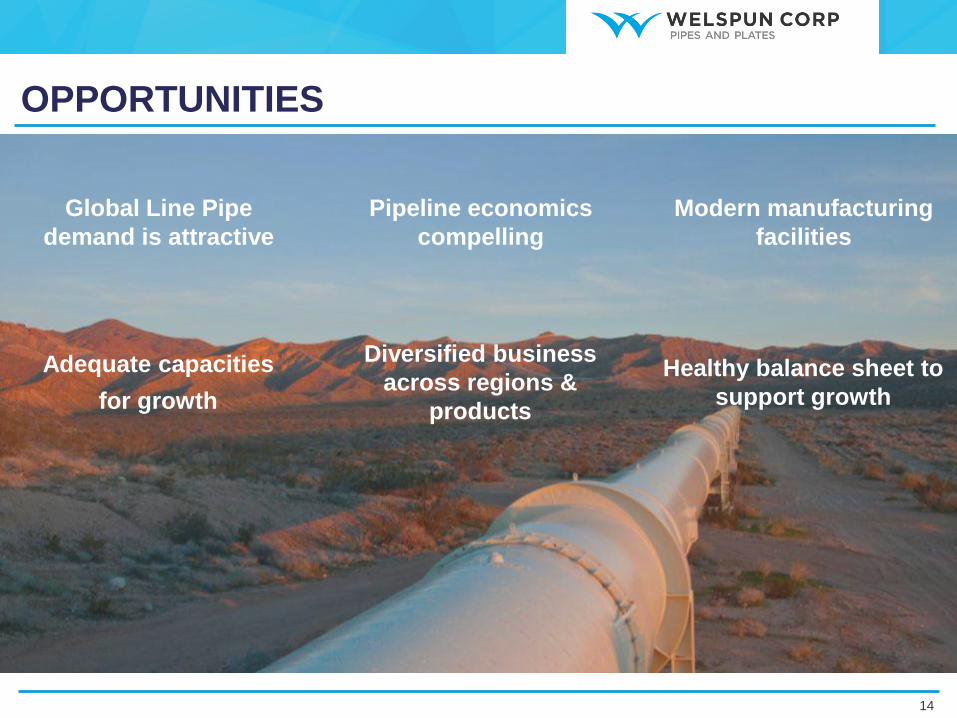
Global Line Pipe
demand is attractive
Pipeline economics
compelling
Modern manufacturing
facilities
Adequate capacities
for growth
Diversified business
across regions &
products
Healthy balance sheet to
support growth
14
OPPORTUNITIES

LINEPIPE DEMAND ACROSS GEOGRAPHIES
Global Line Pipe demand
(KMT excl. China & CIS)
9,19410,744
+17%
2014A 2020E
North America LNG export terminals in USA – first operational; more to come
Focus on LNG export projects – Prince Rupert, Coastal Gas
Link
Transnational gas pipeline projects from USA to Mexico
MENA Heavy oil development
Enhancement of refining capacities in the region
Iraq-Jordan Crude export pipeline (Total over 1,100 KM)
Pipeline development in Kuwait
Saudi – substituting oil with gas for domestic consumption;
emphasis on oil exports; increased demand for water pipelines
Opening up of Iran
India & Asia-Pac Doubling of gas pipelines infrastructure; activity has just begun
~2.5 million MT water pipeline projects expected in near future
Transnational projects – TAPI, Middle East to India
City gas distribution pipeline projects in multiple cities
Offshore development in Thailand-Myanmar region
Addressable market
for WCL
Source: Metal Bulletin Research 2015: The Five Year Strategic Outlook for the
Global Large Diameter Linepipe Market
15
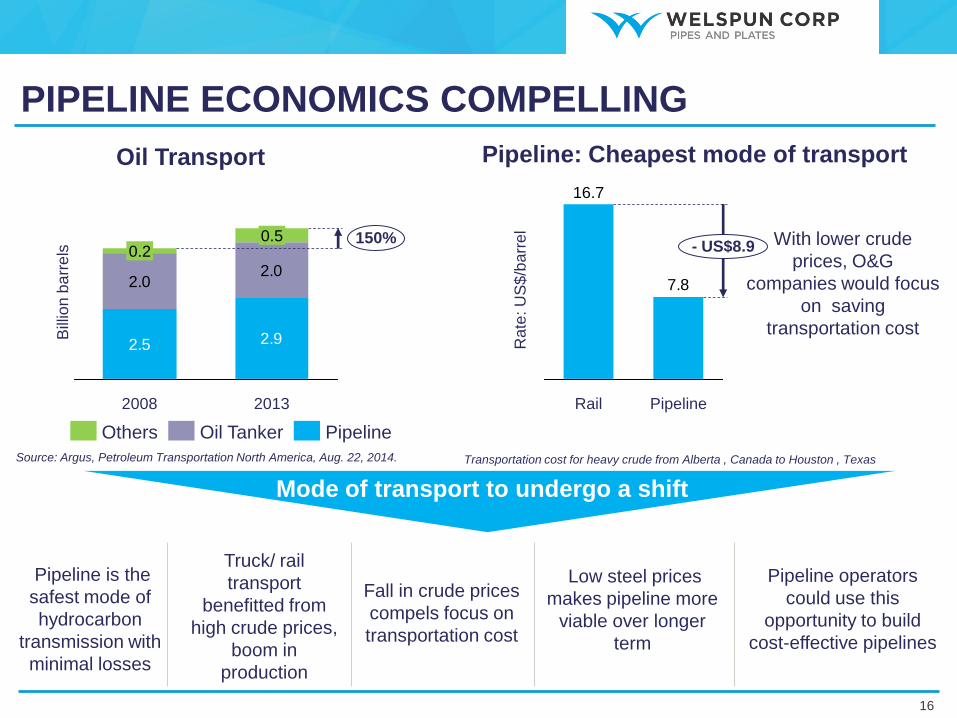
PIPELINE ECONOMICS COMPELLING
Oil Transport
2.5 2.9
2.02.0
150%
2013
0.5
2008
0.2
Others Pipeline Oil Tanker
Pipeline: Cheapest mode of transport
Bill
ion
ba
rre
ls
Mode of transport to undergo a shift
Pipeline is the
safest mode of
hydrocarbon
transmission with
minimal losses
Truck/ rail
transport
benefitted from
high crude prices,
boom in
production
Fall in crude prices
compels focus on
transportation cost
Low steel prices
makes pipeline more
viable over longer
term
Source: Argus, Petroleum Transportation North America, Aug. 22, 2014.
Pipeline operators
could use this
opportunity to build
cost-effective pipelines
With lower crude
prices, O&G
companies would focus
on saving
transportation cost
Transportation cost for heavy crude from Alberta , Canada to Houston , Texas
Rate
: U
S$
/ba
rre
l
7.8
Pipeline
- US$8.9
Rail
16.7
16
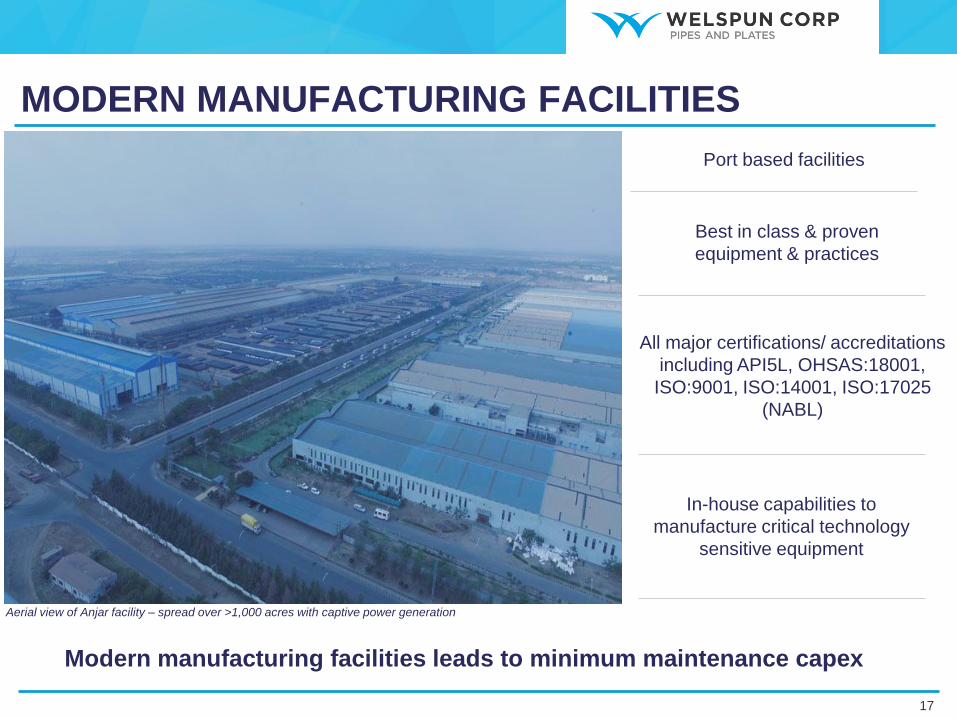
MODERN MANUFACTURING FACILITIES
Aerial view of Anjar facility – spread over >1,000 acres with captive power generation
Modern manufacturing facilities leads to minimum maintenance capex
Port based facilities
Best in class & proven
equipment & practices
All major certifications/ accreditations
including API5L, OHSAS:18001,
ISO:9001, ISO:14001, ISO:17025
(NABL)
In-house capabilities to
manufacture critical technology
sensitive equipment
17
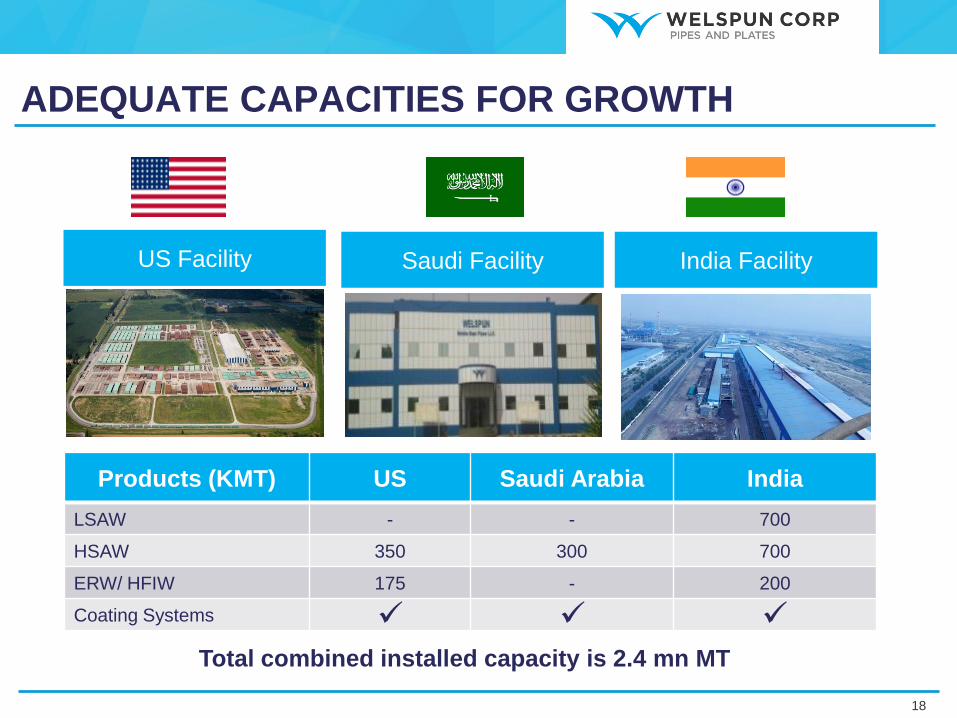
ADEQUATE CAPACITIES FOR GROWTH
India Facility Saudi Facility US Facility
Products (KMT) US Saudi Arabia India
LSAW - - 700
HSAW 350 300 700
ERW/ HFIW 175 - 200
Coating Systems
Total combined installed capacity is 2.4 mn MT
18
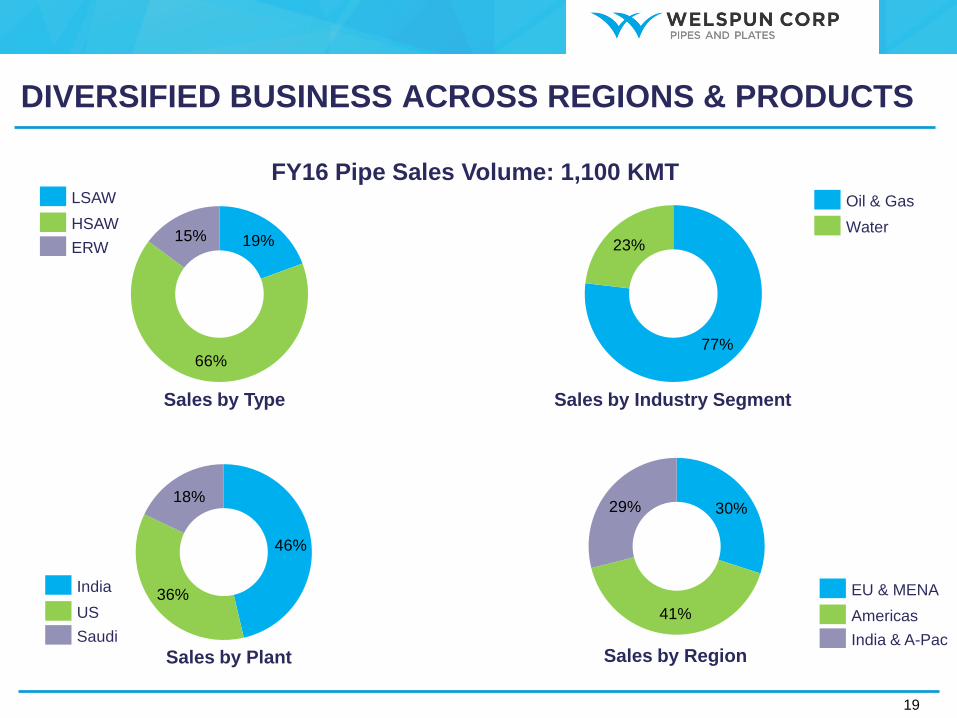
FY16 Pipe Sales Volume: 1,100 KMT
DIVERSIFIED BUSINESS ACROSS REGIONS & PRODUCTS
Sales by Type Sales by Industry Segment
Sales by Plant Sales by Region
HSAW
LSAW
ERW
US
India
Saudi
Water
Oil & Gas
Americas
EU & MENA
India & A-Pac
19%
66%
15%
77%
23%
46%
36%
18%30%
41%
29%
19
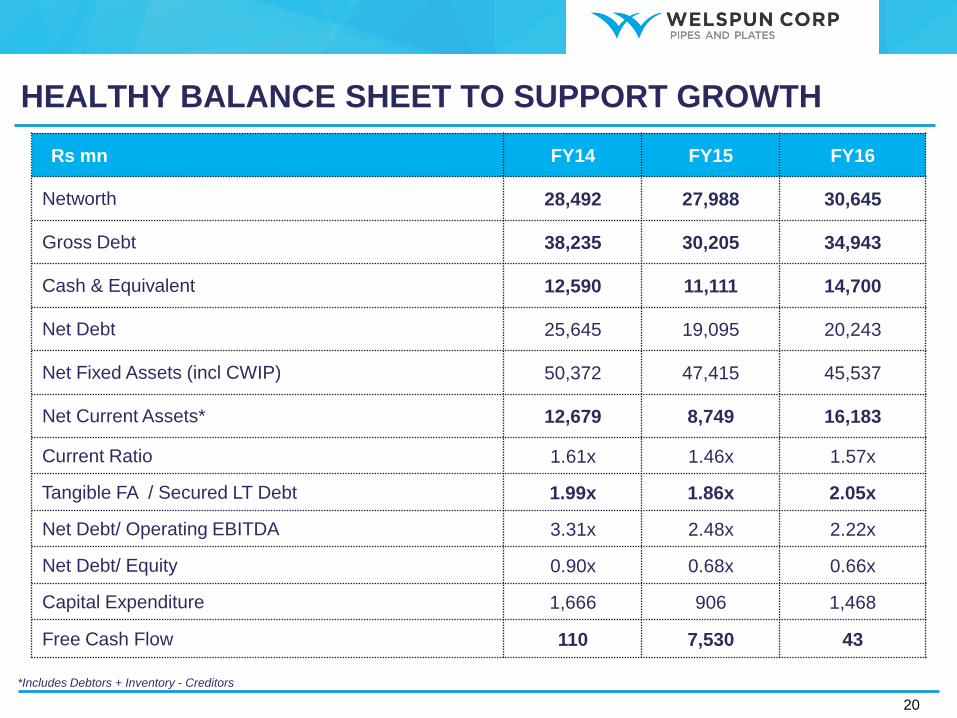
HEALTHY BALANCE SHEET TO SUPPORT GROWTH
Rs mn FY14 FY15 FY16
Networth 28,492 27,988 30,645
Gross Debt 38,235 30,205 34,943
Cash & Equivalent 12,590 11,111 14,700
Net Debt 25,645 19,095 20,243
Net Fixed Assets (incl CWIP) 50,372 47,415 45,537
Net Current Assets* 12,679 8,749 16,183
Current Ratio 1.61x 1.46x 1.57x
Tangible FA / Secured LT Debt 1.99x 1.86x 2.05x
Net Debt/ Operating EBITDA 3.31x 2.48x 2.22x
Net Debt/ Equity 0.90x 0.68x 0.66x
Capital Expenditure 1,666 906 1,468
Free Cash Flow 110 7,530 43
20
*Includes Debtors + Inventory - Creditors
FY16 HIGHLIGHTS
21
FY16 – DELIVERING AMIDST CHALLENGES
1+ million MT production/ sales for
fourth year in a row
• Order book stands at 913K MT
• Reported EBITDA up 9% YoY to Rs
10,349 million
• PAT up 229% YoY to Rs 2,275 million
US facility
• Spiral mill was running at full throttle after
it underwent a major revamp in H1 FY15
to improve productivity, enhance
efficiency, reduce costs and reset the mill
capabilities
Saudi Arabia facility
• Executed first export order in FY15-16,
thereby increasing the geographical reach
• First ever 12/18/24 MTR Manufactured &
FBE Coated Pipe exported out of
Dammam Port
India facilities
• Pre-qualified for a complex project 22”OD
& 39 mm WT X65 (D/T ratio of 14.3) –
more stringent than Independence Trail
Pipeline Project (world’s deepest)
• Spiral mills were largely engaged in
domestic water projects
• Plate mill accessed the wind turbine and
structural plates market
Awards during the year
• “International Safety Award with Merit"
from British Safety Council, United
Kingdom for 2015
• Dahej facility awarded “Prashansa Patra”
for implementing Occupational Safety and
Health (OSH) management systems and
procedures
• Anjar Pipe facility received “Certificate of
Appreciation for Good Practice in Quality
System for 2015” by FICCI
22
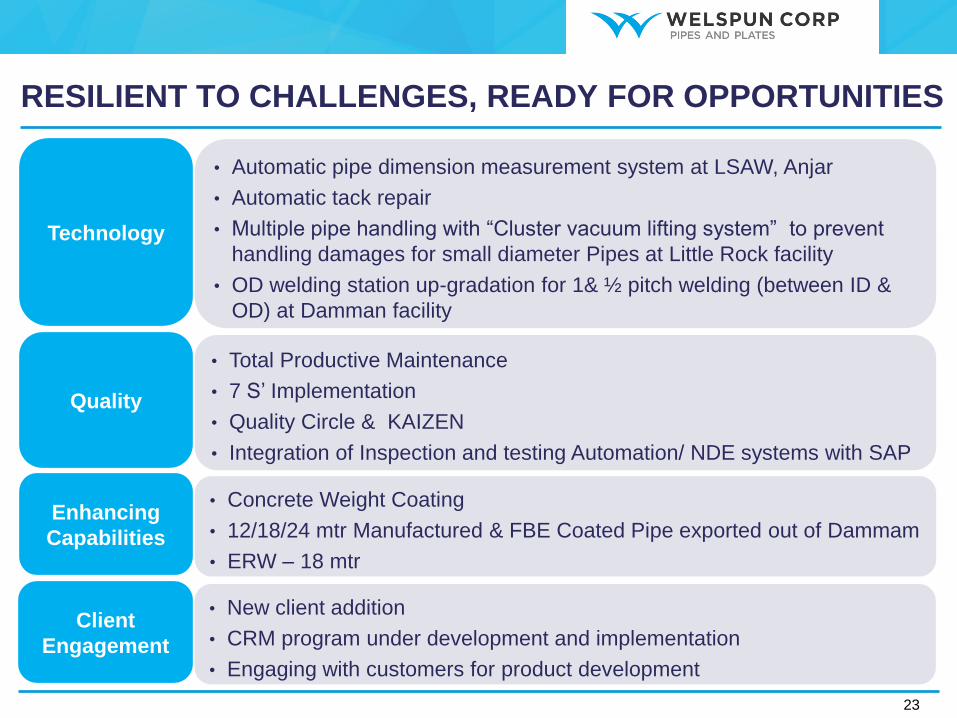
RESILIENT TO CHALLENGES, READY FOR OPPORTUNITIES
Technology
• Automatic pipe dimension measurement system at LSAW, Anjar
• Automatic tack repair
• Multiple pipe handling with “Cluster vacuum lifting system” to prevent
handling damages for small diameter Pipes at Little Rock facility
• OD welding station up-gradation for 1& ½ pitch welding (between ID &
OD) at Damman facility
Quality
• Total Productive Maintenance
• 7 S’ Implementation
• Quality Circle & KAIZEN
• Integration of Inspection and testing Automation/ NDE systems with SAP
Enhancing
Capabilities
• Concrete Weight Coating
• 12/18/24 mtr Manufactured & FBE Coated Pipe exported out of Dammam
• ERW – 18 mtr
Client
Engagement
• New client addition
• CRM program under development and implementation
• Engaging with customers for product development
23
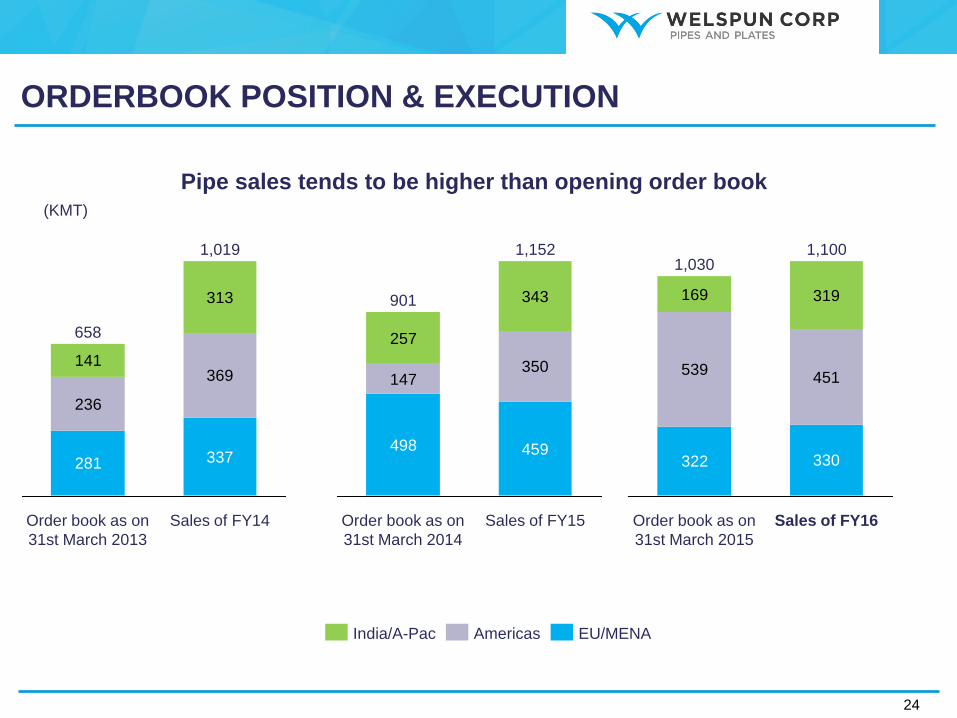
ORDERBOOK POSITION & EXECUTION
Pipe sales tends to be higher than opening order book
236
369141
313
337281
Sales of FY14
1,019
Order book as on
31st March 2013
658
EU/MENA Americas India/A-Pac
147350
459498
343
257
Order book as on
31st March 2014
901
1,152
Sales of FY15
(KMT)
322 330
539451
169 319
1,100
Order book as on
31st March 2015
1,030
Sales of FY16
24
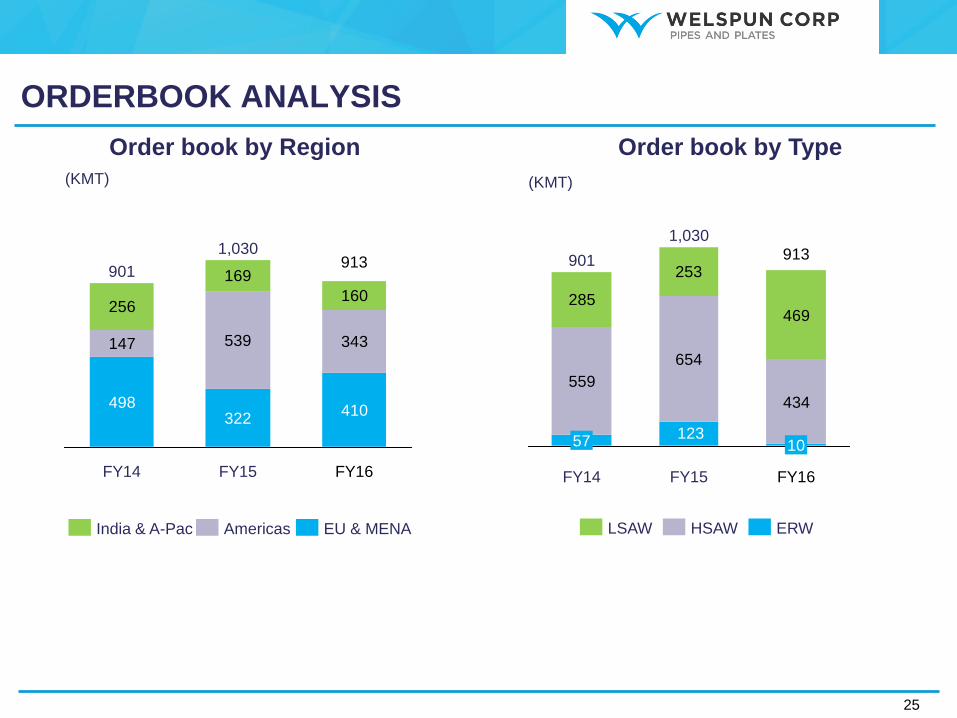
Order book by Region
India & A-Pac EU & MENA Americas
Order book by Type
559
654
434
285
253
469
12357
901
FY14
10
913
FY15
1,030
FY16
HSAW ERW LSAW
(KMT) (KMT)
498322
410
147 539 343
256
169
160
901 913
1,030
FY15 FY16 FY14
ORDERBOOK ANALYSIS
25

PERFORMANCE HIGHLIGHTS FY16
135 Cr Operating Profit
Rs. 83,204 mn
Income from Operations
2% YoY
135 Cr Operating Profit
Operating EBITDA*
18% YoY
135 Cr Operating Profit
1,100 KMT
Pipe sales volume
5% YoY
135 Cr Operating Profit
Rs. 10,349 mn
Reported EBIDTA
9% YoY
135 Cr Operating Profit
Profit After Tax
229 % YoY
135 Cr Operating Profit
Cash PAT
Rs. 9,113 mn Rs. 2,275 mn Rs. 6,541 mn
Note: *Operating EBITDA represents Reported EBITDA (-) Other Income (+) Unrealized Forex Losses (-) Unrealized Forex Gains
26
1% YoY

FY16 FINANCIAL PERFORMANCE
Income from Operations
FY15
83,204 84,505
FY16
EBITDA/Ton for Pipes
8.06.4
FY16 FY15
Consolidated PAT
2,275
690
FY16 FY15
Operating EBITDA
7,692
FY16
9,113
FY15
Note: * Operating EBITDA represents Reported EBITDA (-) Other Income (+) Unrealized Forex Losses (-) Unrealized Forex Gains
(Rs. Mn) (Rs. ‘000)
(Rs. Mn)
Reported production and
sales of pipes for FY16 at
1,119 KMT and 1,100 KMT
respectively
Net Working Capital has
increased to 71 days (49
days in Q3FY16)
Net debt as on 31 March
2016 was at Rs. 20,243 mn,
up Rs. 1,149 mn Y-o-Y
largely due to expanded
working capital
(Rs. Mn)
27
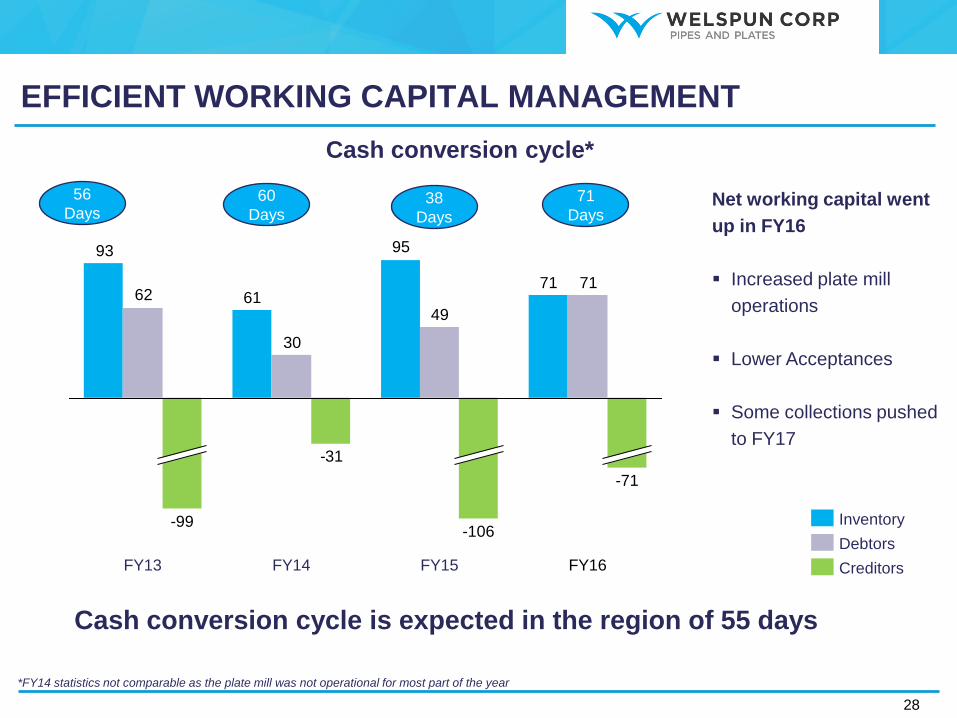
EFFICIENT WORKING CAPITAL MANAGEMENT
56
Days 60
Days 38
Days
*FY14 statistics not comparable as the plate mill was not operational for most part of the year
Cash conversion cycle*
71
95
61
93
71
49
30
62
-31
FY16 FY15
-106
-71
FY14
-99
FY13
Inventory
Creditors
Debtors
71
Days Net working capital went
up in FY16
Increased plate mill
operations
Lower Acceptances
Some collections pushed
to FY17
Cash conversion cycle is expected in the region of 55 days
28

OUTLOOK
29
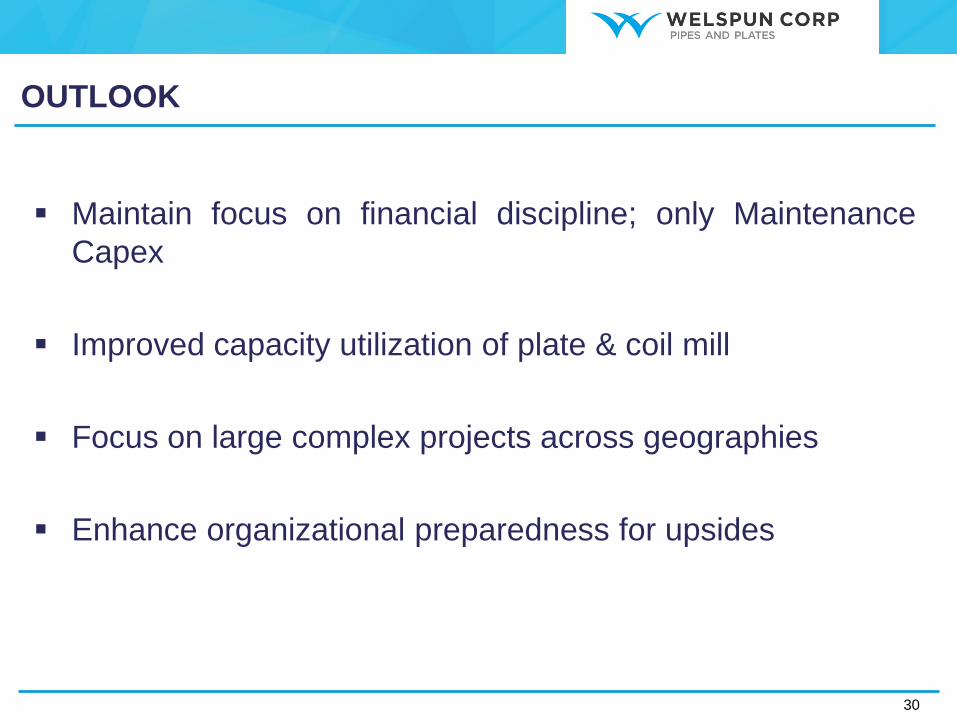
OUTLOOK
Maintain focus on financial discipline; only Maintenance
Capex
Improved capacity utilization of plate & coil mill
Focus on large complex projects across geographies
Enhance organizational preparedness for upsides
30
THANK YOU
Welspun Corp Limited
CIN: L27100GJ1995PLC025609
Mr. Deepak Khetan
+91-2266136584
Mr. Harish Venkateswaran
www.welspuncorp.com
31
ANNEXURE
32
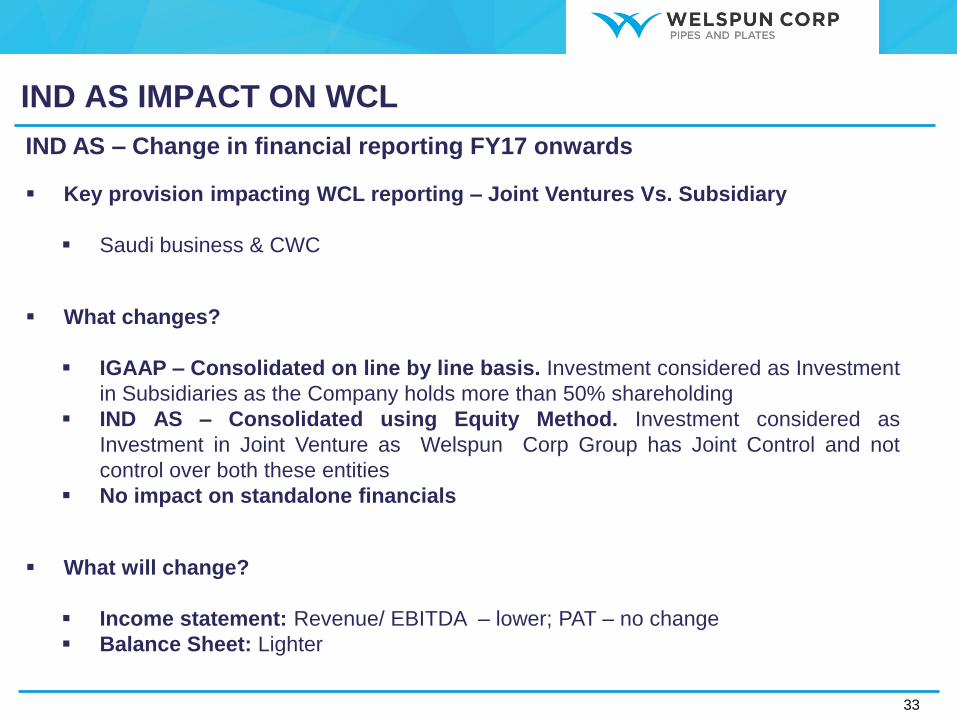
IND AS IMPACT ON WCL
IND AS – Change in financial reporting FY17 onwards
Key provision impacting WCL reporting – Joint Ventures Vs. Subsidiary
Saudi business & CWC
What changes?
IGAAP – Consolidated on line by line basis. Investment considered as Investment
in Subsidiaries as the Company holds more than 50% shareholding
IND AS – Consolidated using Equity Method. Investment considered as
Investment in Joint Venture as Welspun Corp Group has Joint Control and not
control over both these entities
No impact on standalone financials
What will change?
Income statement: Revenue/ EBITDA – lower; PAT – no change
Balance Sheet: Lighter
33
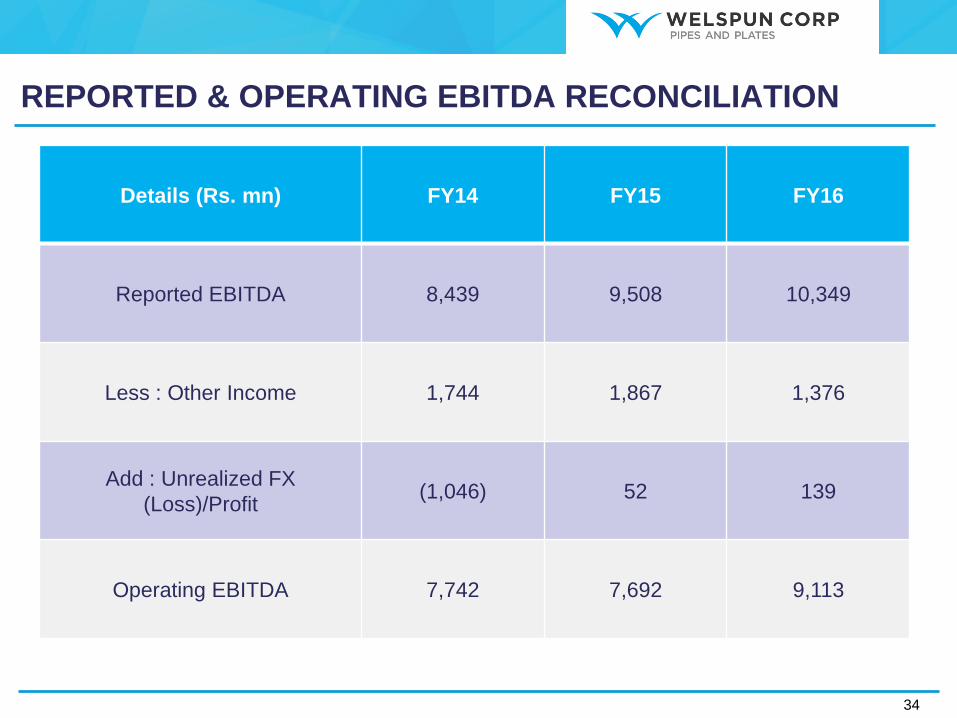
REPORTED & OPERATING EBITDA RECONCILIATION
Details (Rs. mn) FY14 FY15 FY16
Reported EBITDA 8,439 9,508 10,349
Less : Other Income 1,744 1,867 1,376
Add : Unrealized FX
(Loss)/Profit (1,046) 52 139
Operating EBITDA 7,742 7,692 9,113
34
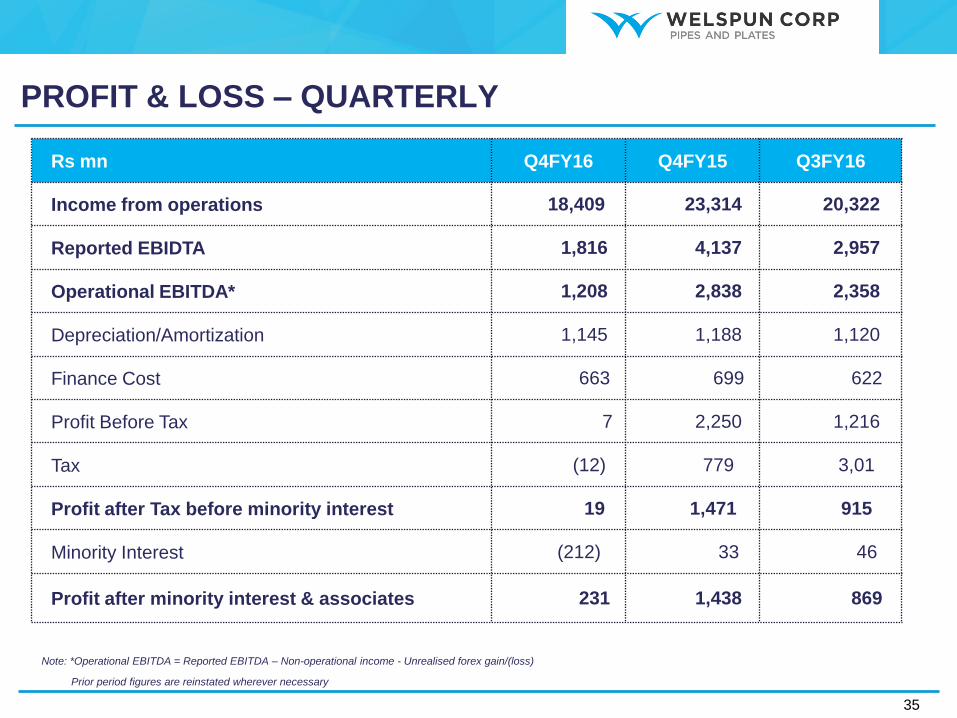
PROFIT & LOSS – QUARTERLY
Rs mn Q4FY16 Q4FY15 Q3FY16
Income from operations 18,409 23,314 20,322
Reported EBIDTA 1,816 4,137 2,957
Operational EBITDA* 1,208 2,838 2,358
Depreciation/Amortization 1,145 1,188 1,120
Finance Cost 663 699 622
Profit Before Tax 7 2,250 1,216
Tax (12) 779 3,01
Profit after Tax before minority interest 19 1,471 915
Minority Interest (212) 33 46
Profit after minority interest & associates 231 1,438 869
Note: *Operational EBITDA = Reported EBITDA – Non-operational income - Unrealised forex gain/(loss)
Prior period figures are reinstated wherever necessary
35

PROFIT & LOSS – ANNUAL
Rs mn FY14 FY15 FY16
Income from operations 77,047 84,505 83,204
Reported EBIDTA 8,439 9,508 10,349
Operational EBITDA* 7,742 7,692 9,113
Depreciation/Amortization 4,063 4,365 4,542
Finance Cost 2,964 2,830 2,637
Profit Before Tax 1,412 2,313 3,171
Tax 432 177 809
Profit after Tax before minority interest 980 2,135 2,361
Minority Interest 247 1,445 87
Profit after minority interest & associates 734 690 2,275
Note: *Operational EBITDA = Reported EBITDA – Non-operational income - Unrealised forex gain/(loss)
Prior period figures are reinstated wherever necessary
36
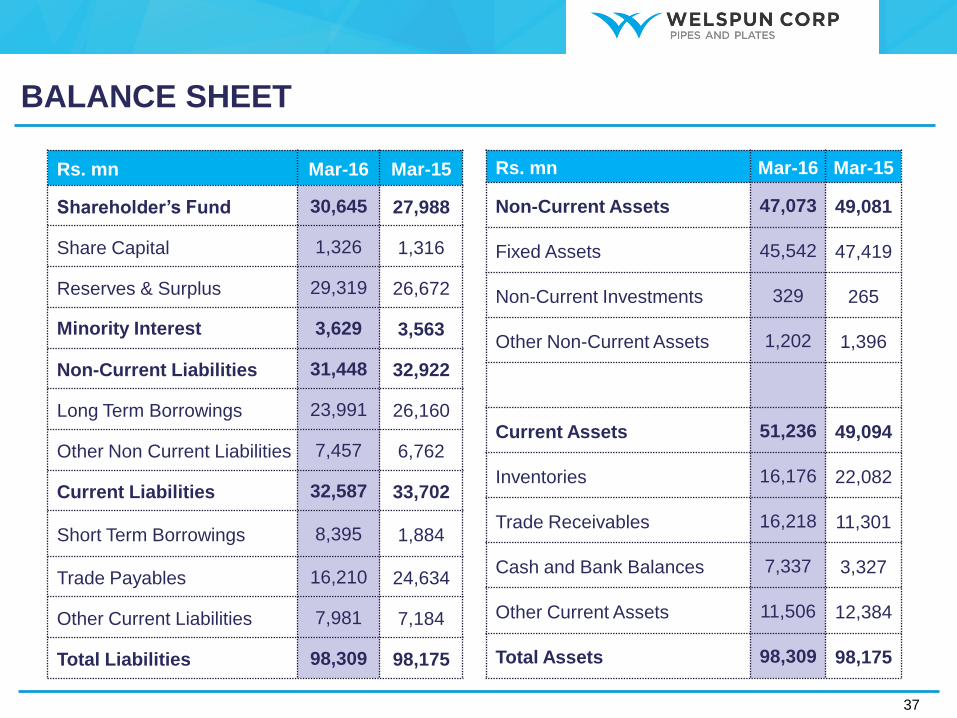
Rs. mn Mar-16 Mar-15
Non-Current Assets 47,073 49,081
Fixed Assets 45,542 47,419
Non-Current Investments 329 265
Other Non-Current Assets 1,202 1,396
Current Assets 51,236 49,094
Inventories 16,176 22,082
Trade Receivables 16,218 11,301
Cash and Bank Balances 7,337 3,327
Other Current Assets 11,506 12,384
Total Assets 98,309 98,175
BALANCE SHEET
Rs. mn Mar-16 Mar-15
Shareholder’s Fund 30,645 27,988
Share Capital 1,326 1,316
Reserves & Surplus 29,319 26,672
Minority Interest 3,629 3,563
Non-Current Liabilities 31,448 32,922
Long Term Borrowings 23,991 26,160
Other Non Current Liabilities 7,457 6,762
Current Liabilities 32,587 33,702
Short Term Borrowings 8,395 1,884
Trade Payables 16,210 24,634
Other Current Liabilities 7,981 7,184
Total Liabilities 98,309 98,175
37