Embed Size (px)
Citation preview

Investor Presentation
June 2016

-2-
Risks and Forward-Looking Statements
This presentation includes forward-looking statements within the meaning of Section 21A of the
Securities Act of 1933, as amended, and Section 21E of the Exchange Act of 1934 as amended. Except
for the historical information contained herein, the matters discussed in this presentation include
forward-looking statements. These forward-looking statements are based on the Partnership’s current
assumptions, expectations and projections about future events, and historical performance is not
necessarily indicative of future performance. Although Genesis believes that the assumptions
underlying these statements are reasonable, investors are cautioned that such forward-looking
statements are inherently uncertain and necessarily involve risks that may affect Genesis’ business
prospects and performance, causing actual results to differ materially from those discussed during
this presentation. Genesis’ actual current and future results may be impacted by factors beyond its
control. Important risk factors that could cause actual results to differ materially from Genesis’
expectations are discussed in Genesis’ most recently filed reports with the Securities and Exchange
Commission. Genesis undertakes no obligation to publicly update any forward-looking statements,
whether as a result of new information or future events.
This presentation may include non-GAAP financial measures. Please refer to the presentations of the
most directly comparable GAAP financial measures and the reconciliations of non-GAAP financial
measures to GAAP financial measures included in the end of this presentation.

-3-
Master Limited Partnership (NYSE: GEL)
L.P. market capitalization of ~$4.2 billion
Integrated portfolio of assets focused on
providing services to:
Handle crude oil upstream of refineries
Perform sulfur removal and other services
inside refineries
Handle products (primarily intermediate and
heavies) downstream of refineries
Culture committed to health, safety and
environmental stewardship
Genesis Energy, L.P.
Integrated asset portfolio creates opportunity
across the crude oil production / refining
value chain
Substantial footprint of increasingly integrated
assets and service capabilities
Fixed margin businesses, limited commodity
price exposure
Significant organic projects underway in and
around existing assets
Disciplined financial policy
Competitive equity cost of capital with no GP
incentive distribution rights (IDRs)
Investment Highlights Partnership Overview

-4-
Integrated asset & services portfolio creates opportunities with producers and refineries
Genesis’ Business Proposition
Asset / Services Integration
Refinery
Services
Refineries
Sulfur Removal
CO2 Pipelines
Producers
Crude Pipelines
Supply & Logistics
Crude Oil
Trucks
Marine
Terminals
Rail
NaHS Markets
Supply & Logistics
Refined Products
Trucks
Marine
Terminals
Rail
Marine Transportation
Crude Oil
Marine Transportation
Refined Products

-5-
• Transportation & supply of crude oil
and CO2, connecting producers to
large interstate pipelines and
refineries
• ~560 miles of oil pipelines in TX,
MS, FL, AL, LA & WY
• ~270 miles of CO2 pipe including
Free State and NEJD
Onshore Pipeline
Transportation Supply & Logistics Refinery Services
Note: LTM Segment Margin pro forma for Material Projects and Acquisitions as of 1Q 2016.
$70 million (11%) $84 million (13%) $63 million (10%)
Genesis’ Operational Footprint
• Refinery sulfur removal services and
sales of by-products at 10 owned
and / or operated facilities; 4
marketing agreements
• Owned & leased NaHS and NaOH
terminals in Gulf Coast, Midwest,
Montana, British Columbia, Utah
and South America
• Owned & leased logistical assets:
trucks, railcars, barges and ships
• Crude oil services and logistics,
refined products services and
logistics and rail services
• Crude Oil: ~2.4 mmbbl storage and
~145 trucks & facilities along Gulf
Coast
• Refined Products: ~0.9 mmbbl
storage and 120 trucks
• Inland Marine Operations: 66
barges and 31 push-boats; Offshore
Marine Operations: 9 boats / 9
barges, 1 ocean going tanker
• Total design capacity of ~1.8 mmbbl
for Inland Marine Operations, ~0.9
mmbbl for Offshore Marine
Operations, and ~0.3 mmbbl for
American Phoenix (ocean going
tanker)
Marine Transportation
$98 million (16%)
Offshore Pipeline
Transportation
• Own interests in crude oil pipelines
and related infrastructure located
offshore in the Gulf of Mexico, a
producing region representing ~15%
of the crude oil production in the
United States in 2015
• ~2,600 miles of offshore pipelines,
primarily servicing deepwater
production
$318 million (50%)
Pipelines
Crude Oil CO 2
Refinery Services
Owned / Operated Facilties NaHS/NaOH Terminals
Marketing Agreements
Supply & Logistics
Crude Oil Operations Crude Oil Tanks
Refineries - Products Product Tanks
Marine Transportation
Rail Services CO2 Facilities
Red River
Ouachita
River
Mississippi
River
Houston
Mobile
Corpus
Christi
Lake
Charles
Shreveport
TX City
Liberty
Port
Arthur
Jackson
MT
WV
WY
CO
GA
AZ
NY
Baton
Rouge
UT
Wink Natchez
Walnut Hill `
Midland
Boats & Barges
Natural Gas

-6-
Limited Commodity Price Exposure Business Segment General Commodity Exposure Mitigant
Onshore Pipeline Transportation No Direct Exposure
• Tariff-based, fee income (except for PLA
volumes)
• Fixed lease payments from DNR for NEJD
CO2 system through 2028
Offshore Pipeline Transportation No Direct Exposure • Tariff-based, fee income (except for PLA
volumes)
Refinery Services NaHS (Long)
NaOH (Short)
• ~85% of our operating expense is cost of
NaOH
• ~75% of NaHS sales contracts indexed to
NaOH prices
• Remaining ~25% have short-term mechanism
to change pricing in response to changes in
operating costs
Marine Transportation No Direct Exposure
• Marine contracts are based upon day rates for
specified types of equipment
• In 2015, ~75% of revenues were from term
contracts and ~25% of revenues were from
spot contracts
Supply & Logistics Crude Oil
Refined Products
• Typically back-to-back monthly purchase and
sales contracts for crude oil
• On average, carry low level crude inventory
• Refined products held for blending are hedged
to remove volatility in underlying value but
subject to marked-to-market accounting
• No “paper” trading
• Tight controls under board approved risk
management policy (VAR ≤ $2.5 mm)

Existing Businesses

-8-
109 235 135 17 60 183 86
8” - ~60 kbd
18” - ~275 kbd ~45 kbd ~150 kbd ~350 kbd ~30 kbd N/A ~500 mmcfd
~73 kbd ~12 kbd ~14 kbd ~30 kbd ~7 kbd $5.2 mm per
quarter ~132 mmcfd
Marathon’s TX
City refinery,
Houston Refining
and Texas City Oil
Terminal
Interconnect w/
Capline to Midwest
refiners
Shell’s Mobile
refinery & PAA’s
Mobile terminal
ExxonMobil’s
Anchorage Tank
Farm
Pronghorn Rail
Facility
Denbury’s Phase I
fields in Mississippi
and Louisiana
Denbury’s Phase II
fields in Mississippi
Onshore Pipeline Transportation
Onshore Crude Oil Pipelines CO2 Pipelines
TX System
Length (miles)
Average Daily
Volume(a)
Delivery
Points
• Stable cash flows through pipeline tariffs combined with future volume growth
• Refiners are the shipper of approximately 85% of total crude oil moved through our onshore pipelines
Capacity
MS System Jay System LA System NEJD Free State WY System
NEJD
Texas
System
Mississippi
System
Free State
Jay System
Houston
Jackson
Baton Rouge
Mobile
Crude Oil Pipeline
CO2 Pipeline
Looped 18” Pipeline
Port Arthur
WY
Casper
Louisiana
System
(a) Average daily volume for 1Q 2016.

-9-
380 367 149 120 184 Includes Allegheny,
Constitution, Marco Polo,
Shenzi and Tarantula
Includes Anaconda,
Falcon, HIOS,
Independence Trail,
Manta Ray, Nautilus,
TPC and Viosca Knoll ~500 kbd ~350 kbd ~115 kbd ~200 kbd ~39 kbd
~197 kbd ~250 kbd ~65 kbd ~108 kbd ~6 kbd NM(c) ~603,000 MMBtu/d
Texas City and
Port Arthur
Refineries
Shell Tankage in
Houma, LA
Poseidon SMI-205
Platform
Delta Loop 20”
(Venice, LA) Cailou Island, LA Various Various
100% 64% 100% 29%
23% undivided joint
interest,
Two 100% owned
laterals
100% Various
Offshore Pipeline Transportation
CHOPS
Length (miles)
Average Daily
Volume(b)
Delivery
Points
• Positioned to provide deepwater producers maximum optionality with access to both Texas & Louisiana markets
• Potential for meaningful volume growth with increased development drilling in dedicated, currently connected fields
(a) Capacity figures represent gross system capacity except Eugene Island, which represents Genesis net capacity in undivided joint interest system.
(b) Average daily volume for 1Q 2016.
(c) Volumes in laterals are reflected in primary pipeline volumes.
Capacity(a)
Poseidon SEKCO Odyssey GOPL
Ownership
Interest
Oil Pipeline
Laterals
Natural Gas
Transportation
Gas Pipeline Oil Pipeline Platform
TPC
Falcon
Viosca Knoll
Anaconda
Independence Trail HIOS
Manta Ray
Nautilus
CHOPS
SEKCO
Poseidon
Odyssey
Eugene Island
Constitution
Shenzi
Marco Polo
Allegheny
Viosca Knoll 817
Marco Polo
Independence Hub Garden Banks
72
East Cameron
373
Falcon Nest
Tarantula
Medusa

-10-
Deepwater Gulf of Mexico Activity
2015 Deepwater Production by Operator(b) • Gulf of Mexico production to increase despite decline in oil price
– EIA projects Gulf of Mexico production will average ~1,630 KBD in 2016
and ~1,790 KBD in 2017
– Gulf of Mexico production expected to represent to 18% and 21% of total
domestic production in 2016 and 2017, respectively
• Producers continuing to move forward with long-term projects
– Anadarko’s Heidelberg field announced first oil on January 14, 2016
(facilities capable of processing 80 kbd)
– Freeport McMoRan’s Holstein Deep development commenced production
with two additional wells to be completed in 2Q 2016
– Stampede producers to invest ~$1.3 billion on topside facilities and other
equipment in 2016
– Anadarko anticipates drilling at Shenandoah, Phobos and Warrior
prospects in 2016
– Offshore project costs continue to decline. BP operated Mad Dog cost
estimated to decrease by more than 50% through re-engineering and
other cost cutting(a)
• Decrease in deepwater rig count has been less substantial than onshore rig
count despite the recent decrease in oil prices
– Driven by continued commitment of Anadarko, BHP, BP, Chevron, Shell,
LLOG and Hess, representing ~85% of 2015 deepwater production(b)
– 27 rigs currently working for previously referenced operators compared to
27 as of 3Q 2014
• 34 rigs currently active in the deepwater compared to 39 as of 3Q 2014, a
decrease of 5 rigs
• 16 rigs currently active in “core areas” of Garden Banks, Green Canyon,
Keathley Canyon and Walker Ridge compared to 24 as of 3Q 2014, a
decrease of 8 rigs
• 5 drillships / semi-submersibles and 2 permanent spars with active drilling in
Genesis connected fields including:
– Atlantis, Heidelberg, Holstein (spar), Lucius, Mad Dog (spar and rig) and
Merganser
• Since 3Q 2014, onshore rig count has decreased 80% (1,869 compared to 375
as of 5/20/16). Over the same time period, deepwater rig count has decreased
13% (39 compared to 34 as of 5/23/16)
(a) Per Rystad Energy report dated 1/1/2016.
(b) Per BSEE. Includes oil production from Alaminos Canyon, Atwater Valley, East Breaks, Garden Banks, Green Canyon, Keathley Canyon, Mississippi Canyon and Walker Ridge areas.
(c) Per industry research. Includes only deepwater drillships and semi-submersibles.
Deepwater Gulf of Mexico Rig Activity
Deepwater Rig Count(c)
Deepwater Gulf of Mexico Oil Production
308
251
130 121 96
69 64
32 26 25 14 10 3 2 0 -
50
100
150
200
250
300
350
RD
S
BP
CV
X
AP
C
BH
P
LLO
G
HE
SS
FCX
NB
L
EN
I
MU
R
XO
M
CO
P
AP
A
MR
O
mb
bl/
d37
4139
46
42 42 42 43
38
34
0
200
400
600
800
1,000
1,200
1,400
1,600
1,800
2,000
0
5
10
15
20
25
30
35
40
45
50
1Q14 2Q14 3Q14 4Q14 1Q15 2Q15 3Q15 4Q15 1Q16 Current
Deepwater Gulf Onshore
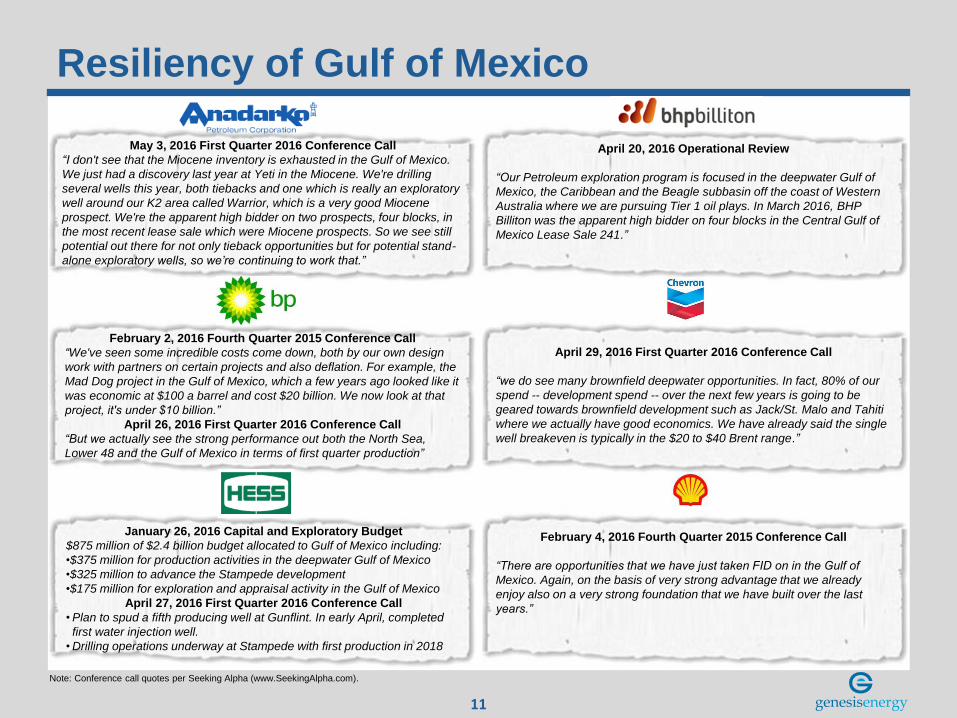
11
Resiliency of Gulf of Mexico
April 20, 2016 Operational Review
“Our Petroleum exploration program is focused in the deepwater Gulf of
Mexico, the Caribbean and the Beagle subbasin off the coast of Western
Australia where we are pursuing Tier 1 oil plays. In March 2016, BHP
Billiton was the apparent high bidder on four blocks in the Central Gulf of
Mexico Lease Sale 241.”
May 3, 2016 First Quarter 2016 Conference Call
“I don't see that the Miocene inventory is exhausted in the Gulf of Mexico.
We just had a discovery last year at Yeti in the Miocene. We're drilling
several wells this year, both tiebacks and one which is really an exploratory
well around our K2 area called Warrior, which is a very good Miocene
prospect. We're the apparent high bidder on two prospects, four blocks, in
the most recent lease sale which were Miocene prospects. So we see still
potential out there for not only tieback opportunities but for potential stand-
alone exploratory wells, so we’re continuing to work that.”
February 2, 2016 Fourth Quarter 2015 Conference Call
“We've seen some incredible costs come down, both by our own design
work with partners on certain projects and also deflation. For example, the
Mad Dog project in the Gulf of Mexico, which a few years ago looked like it
was economic at $100 a barrel and cost $20 billion. We now look at that
project, it's under $10 billion.”
April 26, 2016 First Quarter 2016 Conference Call
“But we actually see the strong performance out both the North Sea,
Lower 48 and the Gulf of Mexico in terms of first quarter production”
April 29, 2016 First Quarter 2016 Conference Call
“we do see many brownfield deepwater opportunities. In fact, 80% of our
spend -- development spend -- over the next few years is going to be
geared towards brownfield development such as Jack/St. Malo and Tahiti
where we actually have good economics. We have already said the single
well breakeven is typically in the $20 to $40 Brent range.”
January 26, 2016 Capital and Exploratory Budget
$875 million of $2.4 billion budget allocated to Gulf of Mexico including:
•$375 million for production activities in the deepwater Gulf of Mexico
•$325 million to advance the Stampede development
•$175 million for exploration and appraisal activity in the Gulf of Mexico
April 27, 2016 First Quarter 2016 Conference Call
• Plan to spud a fifth producing well at Gunflint. In early April, completed
first water injection well.
• Drilling operations underway at Stampede with first production in 2018
February 4, 2016 Fourth Quarter 2015 Conference Call
“There are opportunities that we have just taken FID on in the Gulf of
Mexico. Again, on the basis of very strong advantage that we already
enjoy also on a very strong foundation that we have built over the last
years.”
Note: Conference call quotes per Seeking Alpha (www.SeekingAlpha.com).

-12-
Marine Transportation
• Inland marine operations (brown water) – own 66
barges and 31 push-boats
– 4 push-boats and 8 barges on order with periodic
deliveries through 2016
• Offshore marine operations (blue water) – own 9 boats
and 9 coastwise barges
• Acquired 330,000 bbl capacity ocean going tanker
American Phoenix in 4Q 2014
~1.8 mmbbl ~0.9 mmbbl ~0.3 mmbbl
23,000-39,000 bbl 65,000-136,000 bbl 330,000 bbl
31 9 -
66 9 -
- - 1
Inland Offshore American Phoenix
Total Fleet Capacity
Capacity Range
Push/Tug Boats
Barges
Product Tankers
Marine Transportation Overview
Marine Transportation
Marine Inland Routes
Marine Offshore Routes
American Phoenix Route Corpus
Christi
Houston Mobile
Pt. Everglades
Minneapolis
Cairo
Puerto Rico
Shreveport
Catoosa
Kansas City
Omaha
Sioux City
Cincinnati
Pittsburgh
Chicago
Nashville Knoxville
New Orleans
St. John N.B.
New York
Harbor
Detroit
Norfolk
Boston
Marine Transportation Operational Footprint

-13-
• Refinery sulfur removal and sales of by-products at 10 owned and/or operated facilities; 4 marketing agreements
• Owned & leased NaHS and NaOH terminals in Gulf Coast, Midwest, Montana, British Columbia, Utah and South America
• Lease ~300 railcars, 6 chemical barges
• Purchase / Consume / Handle 200k – 300k DST of NaOH per year
Refinery Services
Midland
Red River
Ouachita
River
Houston
Corpus
Christi
Lake
Charles
Baton
Rouge
Shreveport
WV
TX City
Port
Arthur
Refinery Services
NaHS Facilities (Owned / Operated)
NaHS/NaOH Terminals
Refinery Services Marketing Agreement
WY
MT
GA AZ
NY
Tulsa
Refinery Services NaHS and NaOH Terminals and Facilities
-14-
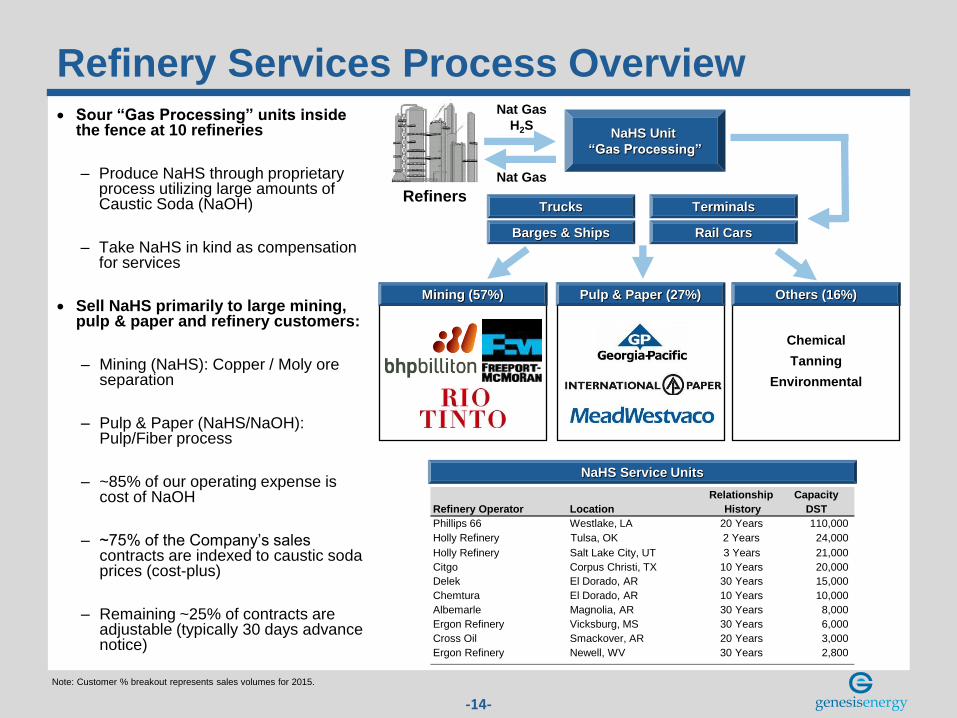
Note: Customer % breakout represents sales volumes for 2015.
Refinery Services Process Overview
Refiners
Nat Gas
H2S
Mining (48%) Pulp & Paper (33%)
Chemical
Tanning
Environmental
Nat Gas
NaHS Unit
“Gas Processing”
Trucks Terminals
Barges & Ships Rail Cars
NaHS Service Units
Others (16%) Mining (57%) Pulp & Paper (27%)
Sour “Gas Processing” units inside the fence at 10 refineries
– Produce NaHS through proprietary process utilizing large amounts of Caustic Soda (NaOH)
– Take NaHS in kind as compensation for services
Sell NaHS primarily to large mining, pulp & paper and refinery customers:
– Mining (NaHS): Copper / Moly ore separation
– Pulp & Paper (NaHS/NaOH): Pulp/Fiber process
– ~85% of our operating expense is cost of NaOH
– ~75% of the Company’s sales contracts are indexed to caustic soda prices (cost-plus)
– Remaining ~25% of contracts are adjustable (typically 30 days advance notice)
Relationship Capacity
Refinery Operator Location History DST
Phillips 66 Westlake, LA 20 Years 110,000
Holly Refinery Salt Lake City, UT 3 Years 21,000
Citgo Corpus Christi, TX 10 Years 20,000
Delek El Dorado, AR 30 Years 15,000
Chemtura El Dorado, AR 10 Years 10,000
Albemarle Magnolia, AR 30 Years 8,000
Ergon Refinery Vicksburg, MS 30 Years 6,000
Cross Oil Smackover, AR 20 Years 3,000
Ergon Refinery Newell, WV 30 Years 2,800
Holly Refinery Tulsa, OK 2 Years 24,000

-15-
Supply & Logistics
Midland
Ouachita
River Mississippi
River
Crude Oil Tanks
Products Tanks
Supply & Logistics
Rail Services
Crude Oil Operation
Refineries-Products
Supply & Logistics Operational Footprint
• Crude oil services and logistics, refined products services and logistics and rail services
• ~145 trucks / ~140 trailers in crude oil trucking fleet. Additional ~120 trucks / ~275 trailers in refined products fleet
• ~2.4 mmbbl crude storage and ~0.9 mmbbl refined product storage
– Additional ~0.9 mmbbl crude storage (various locations) / ~0.7 mmbbl refined products storage (Baton Rouge Terminal)
under construction
• Lease ~50 refined product rail cars and ~470 crude rail cars (all coiled and insulated DOT 111A new builds)
• Five rail load / unload facilities (all unit-train capable)
• Crude oil and petroleum product sales totaled ~70,000 bpd in 1Q 2016
• Rail load/unload volumes totaled ~21,000 bpd in 1Q 2016
Wink
Houston
Port Arthur
TX City Lake
Charles
Mobile
Corpus
Christi
Red River
Natchez
Walnut Hill
Shreveport
Liberty
Baton Rouge
WY
UT CO

Business Objectives and
Recent Developments

-17-
Identify and Exploit Profit Opportunities Across an Increasingly Integrated
Asset Footprint
Continue to Optimize Existing Asset Base and Create Synergies
Evaluate Internal and 3rd Party Growth Opportunities that Leverage Core
Competencies, Lead to Further Integration and Expand Geographic Reach
Leverage Existing Customer Relationships Across Businesses and Attract
New Customers
Maintain Focus on HSSE
Business Objectives
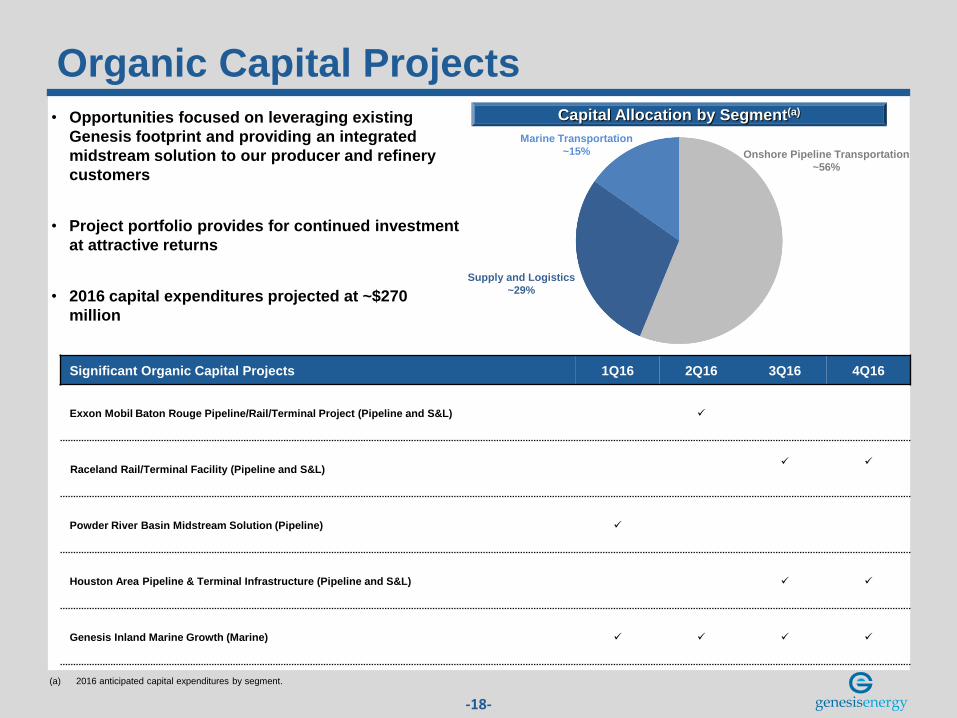
-18-
Organic Capital Projects • Opportunities focused on leveraging existing
Genesis footprint and providing an integrated
midstream solution to our producer and refinery
customers
• Project portfolio provides for continued investment
at attractive returns
• 2016 capital expenditures projected at ~$270
million
Capital Allocation by Segment(a)
Significant Organic Capital Projects 1Q16 2Q16 3Q16 4Q16
Exxon Mobil Baton Rouge Pipeline/Rail/Terminal Project (Pipeline and S&L)
Raceland Rail/Terminal Facility (Pipeline and S&L)
Powder River Basin Midstream Solution (Pipeline)
Houston Area Pipeline & Terminal Infrastructure (Pipeline and S&L)
Genesis Inland Marine Growth (Marine)
(a) 2016 anticipated capital expenditures by segment.
Onshore Pipeline Transportation
~56%
Marine Transportation
~15%
Supply and Logistics
~29%

-19-
Exxon Mobil Baton Rouge Pipeline/Rail/Terminal Project
Integrated Crude Logistics
Baton Rouge Terminal
Project Overview
• Genesis is in final stages of construction of a new crude oil, intermediates and
refined products import / export terminal in Baton Rouge, Louisiana
• Will initially include ~1.1 million barrels of storage
– Ability to segregate, blend and batch multiple grades of crude oils, intermediates
and refined products for multiple customers
– Ample room for expansion to provide additional services and/or handle additional
products
• Will be connected to Genesis’ Scenic Station unit train facility
Shippers to Scenic Station able to access both local refiners and other attractive
refining markets via the Baton Rouge Terminal
• Will be connected to XOM’s LOLA System from Longview to receive Permian
volumes from expansion of SXL’s West Texas Gulf System
• Will be connected to the deepwater docks of the Port of Greater Baton Rouge
– Ability to handle vessels ranging from barges to Aframax class ships
• Project expected to be operational by 2Q 2016
• Genesis entered into definitive agreements with ExxonMobil (“XOM”) in which
Genesis improved existing assets and developed new infrastructure in Louisiana to
connect into XOM’s Anchorage Tank Farm which supplies its Baton Rouge refinery,
one of the largest refinery complexes in North America
• Genesis has completed construction of the following infrastructure:
– Barge dock improvements and ~330,000 barrels of storage at Port Hudson,
Louisiana (in addition to existing 216,000 barrels of tank capacity)
– Crude oil unit train facility at the Scenic Station Terminal
– New 18 mile, 24” diameter crude oil pipeline connecting Port Hudson to the Scenic
Station Terminal and downstream to the XOM Anchorage Tank Farm (ultimate
capacity of ~350,000 bpd)
• Port Hudson upgrades and new pipeline completed in 1Q 2014; Scenic Station
Terminal commissioned in July 2014
XOM Baton Rouge
Refinery (506 kbd)
Port Hudson Truck Station
One existing 10,000 bbl tank
Baton Rouge Terminal
~1.1 Million Barrels of Storage
LA
XOM Anchorage Tank Farm
KCS
CN
Port Hudson Terminal
Three new 110,000 bbl tanks
One existing 216,000 bbl tank
Placid Refinery (60 kbpd) Port of Greater Baton Rouge
Aframax Class Ships / Barges
Scenic Station Terminal
Unit Train Rail Facility
Bato
n R
ou
ge T
erm
inal
Pro
ject

-20-
Houston Area Pipeline & Terminal Infrastructure • Genesis is currently expanding its Houston area logistics
services to include new terminal and pipeline infrastructure
capable of receiving various Gulf of Mexico pipeline volumes
for distribution to Texas City and Houston refining and
waterborne markets
• Genesis has entered into long term agreements with
ExxonMobil (“XOM”) underpinning its investment in the project,
which XOM will use to support its Baytown Refinery (XOM’s
largest refinery in North America)
• Genesis will be able to receive, store and deliver several Gulf of
Mexico pipeline volumes including:
– Hoover Offshore Oil Pipeline System (“HOOPS”) barrels
(via the Department of Energy (“DOE”) Pipeline)
– CHOPS barrels
• As part of the project Genesis will:
– Construct 4 x 185 kbbl tanks at new Texas City Terminal;
capabilities to segregate and batch different streams
– Construct new pipeline connecting Texas City Terminal to
Genesis’ existing 18” pipeline
– Repurpose existing 18” line to bi-directional service; dual
18” bi-directional and 8” southbound lines from Webster to
Texas City provide necessary flexibility to service customers
seeking access to both markets
• Texas City Terminal and new pipeline to be operational in 2H
2016.
Project Overview
GEL Webster Terminal
Existing 415 kbbl storage
XOM Baytown VLO Houston
Lyondell
Pasadena Refining
VLO Texas CIty
MPC Galveston Bay
MPC Texas City
New GEL Texas City Terminal
New 4 x 185 kbbl tanks
CHOPS
DOE
Shell Deer Park

-21-
• The Powder River Basin pipeline is approximately 135 miles and
includes the ability to:
– Receive barrels by in-field gathering systems and truck
transportation from multiple receipt points in Campbell and
Converse Counties, Wyoming
– Deliver barrels to Genesis’ existing Pronghorn unit train loading
facility new Guernsey terminal and the Casper refining market
– Store over 425,000 barrels to support volumes on the pipeline
• The project provides a number of important advantages:
– Comprehensive wellhead-to-market crude oil midstream
solution tailor-made for the Powder River Basin
– Improved year-round flow assurance combined with maximum
market optionality:
• Rail export optionality via the leading loading facility in the
region (dual BNSF and UP access)
• Downstream pipeline delivery options in Guernsey to
local refining markets and Cushing, Oklahoma via the
Pony Express Pipeline
• Project anchored by long-term dedication from Devon Energy
Corporation covering acreage located in Campbell, Converse and
Johnson Counties, Wyoming
– Devon acquired an additional 253,000 net acres in Converse
County, Wyoming for $600 million in Dec. 2015
• Additional commitments received from refinery and third-party
customers
Powder River Basin Midstream Solution Project Overview

Financial Summary

-23-
Financial Objectives
Continue to deliver disciplined growth in distributions
Grow our distribution coverage ratio, using excess Available Cash as equity
and to pay down senior secured debt
Target long-term total leverage ratio of +/- 3.75x. Allow to episodically
increase to fund construction of high return organic opportunities

-24-
Strong Balance Sheet and Credit Profile
(a) Excludes debt used to finance short-term hedged inventory of $48.8 million as of 1Q 2016. Net of cash of $12.3 million as of 1Q 2016.
($ in 000s) Reported LTM Material Project & Acquisitions Pro Forma LTM
3/31/2016 EBITDA Adjustment 3/31/2016
Senior Secured(a) $1,218,889 $1,218,889
Senior Unsecured 1,808,575 1,808,575
Pro Forma Adjusted Debt $3,027,464 $3,027,464
LTM Pro Forma EBITDA $485,588 $105,220 $590,808
Pro Forma Adjusted Debt / LTM Pro Forma EBITDA 5.12x
1Q 2016 Reported Available Cash Before Reserves $97,794
Less: Distributions (73,961) Distribution Coverage ($) $23,833
Distribution Coverage 1.32x

-25-
43 consecutive quarters of distribution increases to L.P.s, 38 of which have been 10% or greater
year-over-year
Disciplined Distribution Growth
Historical LP Unit Distributions ($ / unit)

Appendix I
Deepwater Gulf of Mexico
Activity Update

-27-
Known Deepwater Discoveries Not Yet Developed
Note: Per industry research.
GEL Gas Pipeline GEL Oil Pipeline GEL Platform
Anchor
Buckskin
Coronado Gibson Gila Guadalupe
Kaskida
Katmai
Leon
Logan
Mad Dog II
Magellan
Melmar
North Platte
Phobos
Rydberg
Samurai
Shenandoah
Sicily
Tiber
Tortuga Troubadour
Vito
Winter
Yeti Yucatan
Field Name Operator Location Year of Discovery Field Name Operator Location Year of Discovery
Anchor Chevron Green Canyon 807 2015 North Platte Cobalt Garden Banks 959 2012
Buckskin Repsol Keathley Canyon 872 2009 Phobos Anadarko Sigsbee Escarpment 39 2013
Coronado Chevron Walker Ridge 98 2013 Rydberg Shell Mississippi Canyon 525 2014
Gibson Chevron Keathley Canyon 97 NM Samurai Anadarko Green Canyon 432 2009
Gila Chevron Keathley Canyon 93 2013 Shenandoah Anadarko Walker Ridge 52 2009
Guadalupe Chevron Keathley Canyon 10 2014 Sicily Chevron Keathley Canyon 814 2015
Kaskida BP Keathley Canyon 292 2006 Tiber Chevron Keathley Canyon 102 2009
Katmai Noble Energy Green Canyon 40 2014 Tortuga Noble Energy Mississippi Canyon 561/605 2008
Leon Repsol Keathley Canyon 642 2014 Troubadour Noble Energy Mississippi Canyon 699 2013
Logan Statoil Walker Ridge 969 2011 Vito Shell Mississippi Canyon 984 2009
Mad Dog II BP Green Canyon 826 2009 Winter W & T Garden Banks 605 2009
Magellan Apache East Breaks 424 2007 Yeti Statoil Walker Ridge 160 2015
Melmar Conoco Phillips Alaminos Canyon 475 NM Yucatan Shell Walker Ridge 95 2013

28
Atlantis Field Development
Average Daily Production(b)
Field Overview
(a) Per industry research.
(b) Per BSEE.
• BP operated field
• Field Development:
– Discovery announced in 1998; first production in 2007
– Semisubmersible in ~7,000 feet of water with 200,000
bbl/d of production capacity
– Initial development included southern portion of the field
– Initial estimated recoverable reserves in excess of 600
mboe(a)
• Future development plans
– In 2013, BP started developing the northern section of the
field
– The northern expansion includes an additional seven wells
to be tied back to the existing semisubmersible(a)
– During 2015, BP utilized the Transocean Development
Driller III and Seadrill West Auriga in the Atlantis field(a)
-
20
40
60
80
100
120
2008 2009 2010 2011 2012 2013 2014 2015
kbd

29
Constitution Field Development
Historical Average Daily Production(b)
Caesar Tonga Forecasted Production(d)
(a) Per industry research.
(b) Per BSEE.
(c) Per slide 9 of Anadarko 1Q 2016 Operations Report.
(d) Per slide 10 of Anadarko investor presentation dated 11/10/15
• Anadarko operated development
• Includes production from the Constitution, Ticonderoga and
Caesar/Tonga fields
• Field Development:
– Discovery announced in 2003; first production in 2006
– Standalone TLP in ~5,000 feet of water with 70,000 bbl/d
of production capacity
– Initial estimated recoverable reserves of 200-400 mboe
from Caesar/Tonga development(a)
– 5 production wells completed at Caesar/Tonga as of year-
end 2015
– As of year-end 2015, oil production has averaged ~25 kbd
over life of field(b)
• Future development plans(c):
– 6th Caesar/Tonga well completed and producing in excess
of 8,000 boe/d
– 7th Caesar Tonga/Well was drilled, completed and flow
tested in 1Q 2016. Expected to come online in 2Q 2016.
– Phase 2 development of Caesar/Tonga anticipating first oil
by end of 2017
-
5
10
15
20
25
30
35
40
45
2012 2013 2014 2015
kb
d
30
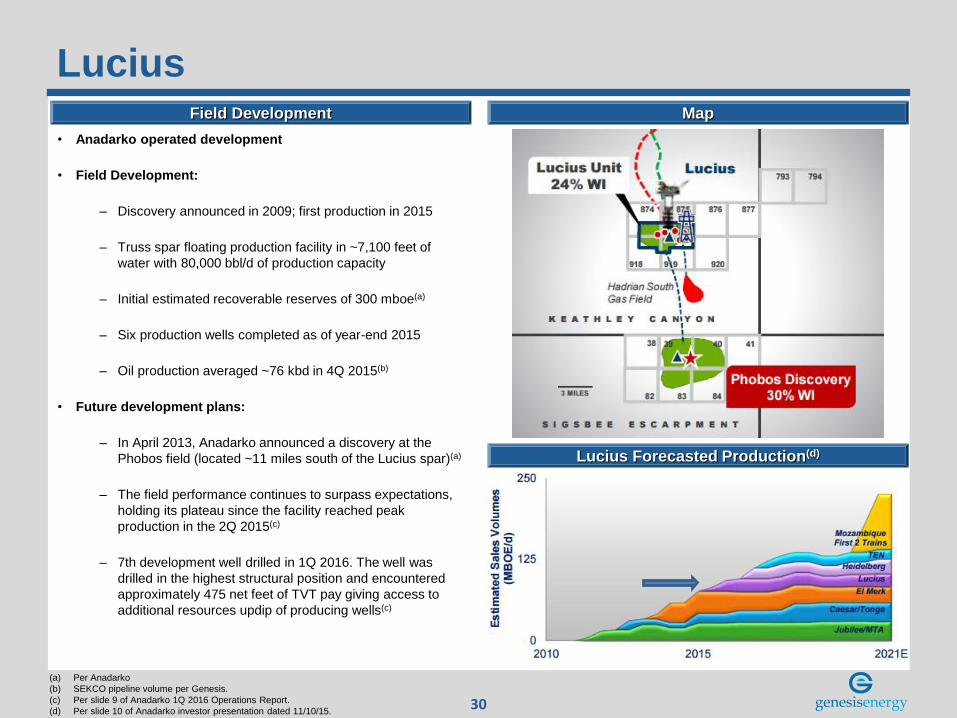
Lucius Field Development
Lucius Forecasted Production(d)
Map
• Anadarko operated development
• Field Development:
– Discovery announced in 2009; first production in 2015
– Truss spar floating production facility in ~7,100 feet of
water with 80,000 bbl/d of production capacity
– Initial estimated recoverable reserves of 300 mboe(a)
– Six production wells completed as of year-end 2015
– Oil production averaged ~76 kbd in 4Q 2015(b)
• Future development plans:
– In April 2013, Anadarko announced a discovery at the
Phobos field (located ~11 miles south of the Lucius spar)(a)
– The field performance continues to surpass expectations,
holding its plateau since the facility reached peak
production in the 2Q 2015(c)
– 7th development well drilled in 1Q 2016. The well was
drilled in the highest structural position and encountered
approximately 475 net feet of TVT pay giving access to
additional resources updip of producing wells(c)
(a) Per Anadarko
(b) SEKCO pipeline volume per Genesis.
(c) Per slide 9 of Anadarko 1Q 2016 Operations Report.
(d) Per slide 10 of Anadarko investor presentation dated 11/10/15.

31
Mad Dog Field Development
Average Daily Production(a)
Field Overview
• BP operated development
• Field Development:
– Discovery announced in 1998; first production in 2005
– Truss spar in ~4,500 feet of water with 80,000 bbl/d of
production capacity
• Future development plans:
– Only 12% of recoverable reserves produced to date(a)
– In 2009, BP drilled appraisal well in southern portion of the
field (“Mad Dog 2”)
– 2009 appraisal drilling increased estimate of oil in place to
more than 4,000 mboe(a)
– Estimates of cost to develop Mad Dog 2 continue to
decline, project cost estimated to be below $10 billion as
of 4Q 2015(b)
(a) Per BP.
(b) Per BP 4Q 2015 conference call.

32
Marco Polo Field Development
Average Daily Production(b)
Map
• Anadarko operated development
• Includes production from the Marco Polo, K2 and Genghis
Kahn fields
• Field Development:
– Discovery announced in 1999; first production in 2005
– Standalone TLP in ~4,300 feet of water with 125,000 bbl/d
of production capacity
– Completed successful flow test of new well at K2 in 3Q
2015(a)
– As of year-end 2015, oil production averaged ~27kbd over
life of field(b)
• Future development plans:
– Contracts awarded for the instillation of artificial gas lift at
K2(c)
– Additional infield drilling expected in 2016(d)
(a) Per slide 12 of Anadarko 3Q 2015 Operations Report dated 9/17/2015.
(b) Per BSEE.
(c) Per Technip 11/13/2014 press release.
(d) Per Anadarko 4Q 2015 earnings call.
-
5
10
15
20
25
30
35
2010 2011 2012 2013 2014 2015
kbd

33
Shenzi
(a) Per industry research.
(b) Per BHP Billiton 1/20/2016 Operational Review.
(c) Per Hess 1/26/2016 Capital and Exploratory Budget.
(d) Per BSEE.
Field Development
Average Daily Production(d)
Field Overview
• BHP operated field
• Field Development:
– Discovery announced in 2002; first production in 2009
– Standalone TLP in ~4,300 feet of water with 100,000 bbl/d
of production capacity
– Initial estimated recoverable reserves of 350-400 mboe(a)
– Oil production has averaged ~88kbd over life of field(b)
• Future development plans:
– Two wells were drilled at the Shenzi field during the
second half of 2015(b)
– Water injection well to be drilled in 2016(c)
-
20
40
60
80
100
120
2009 2010 2011 2012 2013 2014 2015
kbd

Appendix II
Additional Financial Information
-35-
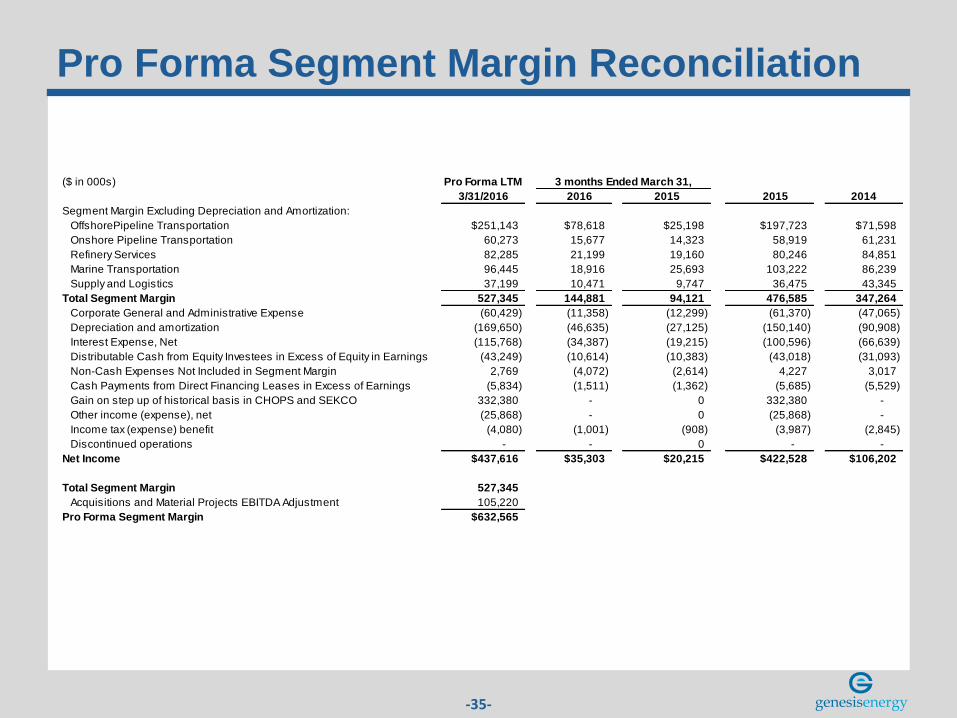
Pro Forma Segment Margin Reconciliation
($ in 000s) Pro Forma LTM
3/31/2016 2016 2015 2015 2014
Segment Margin Excluding Depreciation and Amortization:
OffshorePipeline Transportation $251,143 $78,618 $25,198 $197,723 $71,598
Onshore Pipeline Transportation 60,273 15,677 14,323 58,919 61,231
Refinery Services 82,285 21,199 19,160 80,246 84,851
Marine Transportation 96,445 18,916 25,693 103,222 86,239
Supply and Logistics 37,199 10,471 9,747 36,475 43,345
Total Segment Margin 527,345 144,881 94,121 476,585 347,264
Corporate General and Administrative Expense (60,429) (11,358) (12,299) (61,370) (47,065)
Depreciation and amortization (169,650) (46,635) (27,125) (150,140) (90,908)
Interest Expense, Net (115,768) (34,387) (19,215) (100,596) (66,639)
Distributable Cash from Equity Investees in Excess of Equity in Earnings (43,249) (10,614) (10,383) (43,018) (31,093)
Non-Cash Expenses Not Included in Segment Margin 2,769 (4,072) (2,614) 4,227 3,017
Cash Payments from Direct Financing Leases in Excess of Earnings (5,834) (1,511) (1,362) (5,685) (5,529)
Gain on step up of historical basis in CHOPS and SEKCO 332,380 - 0 332,380 -
Other income (expense), net (25,868) - 0 (25,868) -
Income tax (expense) benefit (4,080) (1,001) (908) (3,987) (2,845)
Discontinued operations - - 0 - -
Net Income $437,616 $35,303 $20,215 $422,528 $106,202
Total Segment Margin 527,345
Acquisitions and Material Projects EBITDA Adjustment 105,220
Pro Forma Segment Margin $632,565
3 months Ended March 31,
-36-
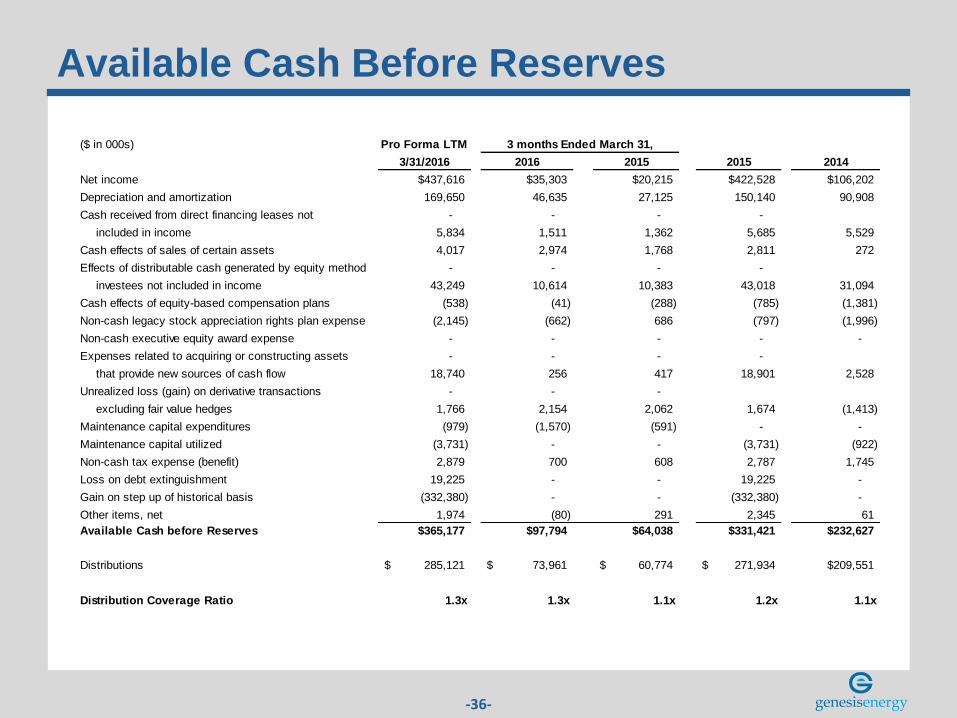
Available Cash Before Reserves
($ in 000s) Pro Forma LTM
3/31/2016 2016 2015 2015 2014
Net income $437,616 $35,303 $20,215 $422,528 $106,202
Depreciation and amortization 169,650 46,635 27,125 150,140 90,908
Cash received from direct financing leases not - - - -
included in income 5,834 1,511 1,362 5,685 5,529
Cash effects of sales of certain assets 4,017 2,974 1,768 2,811 272
Effects of distributable cash generated by equity method - - - -
investees not included in income 43,249 10,614 10,383 43,018 31,094
Cash effects of equity-based compensation plans (538) (41) (288) (785) (1,381)
Non-cash legacy stock appreciation rights plan expense (2,145) (662) 686 (797) (1,996)
Non-cash executive equity award expense - - - - -
Expenses related to acquiring or constructing assets - - - -
that provide new sources of cash flow 18,740 256 417 18,901 2,528
Unrealized loss (gain) on derivative transactions - - -
excluding fair value hedges 1,766 2,154 2,062 1,674 (1,413)
Maintenance capital expenditures (979) (1,570) (591) - -
Maintenance capital utilized (3,731) - - (3,731) (922)
Non-cash tax expense (benefit) 2,879 700 608 2,787 1,745
Loss on debt extinguishment 19,225 - - 19,225 -
Gain on step up of historical basis (332,380) - - (332,380) -
Other items, net 1,974 (80) 291 2,345 61
Available Cash before Reserves $365,177 $97,794 $64,038 $331,421 $232,627
Distributions 285,121$ 73,961$ 60,774$ 271,934$ $209,551
Distribution Coverage Ratio 1.3x 1.3x 1.1x 1.2x 1.1x
3 months Ended March 31,

-37-
Pro Forma EBITDA Reconciliation
($ in 000s) Pro Forma LTM
3/31/2016 2016 2015 2015 2014
Net Income $437,616 $35,303 $20,215 $422,528 $106,202
Depreciation and amortization 169,650 46,635 27,125 150,140 90,908
Interest expense, net 115,768 34,387 19,215 100,596 66,639
Cash expenditures not included in Adjusted EBITDA - - - -
or net income 18,200 215 129 18,114 1,034
Adjustment to include distributions from equity investees - - - -
and exclude equity in investees net income 43,249 10,614 10,383 43,018 31,093
Non-cash legacy stock appreciation rights plan expense (2,145) (662) 686 (797) (1,996)
Non-cash executive equity award expense - - - - -
Other non-cash items 14,021 6,333 3,716 11,404 4,178
Income tax expense (benefit) 4,080 1,001 908 3,987 2,845
Other income (expense), net (314,851) - - (314,851)
Discontinued operations - - - - -
Adjusted EBITDA $485,588 $133,826 $82,377 $434,139 $300,903
Acquisitions and Material Projects EBITDA Adjustment 105,220 - - 132,818 49,953
Pro Forma EBITDA $590,808 $133,826 $82,377 $566,957 $350,856
3 months Ended March 31,

-38-
Adjusted Debt Reconciliation
($ in 000s) Pro Forma LTM
Long-term debt 3/31/2016 2015 2014
Senior secured credit facility $1,280,000 $1,115,000 $550,400
Senior Unsecured Notes 1,808,575 1,850,000 1,050,000
Adjustment for short-term hedged inventory (48,800) (33,800) (45,000)
Cash and cash equivalents (12,311) (10,895) (9,462)
Pro Forma Adjusted Debt $3,027,464 $2,920,305 $1,545,938
EBITDA (as reported) $485,588 $434,139 $300,903
Acquisitions and Material Projects EBITDA Adjustment 105,220 132,818 49,953
Pro Forma EBITDA $590,808 $566,957 $350,856
Pro Forma Adjusted Debt / Pro Forma EBITDA 5.12x 5.15x 4.41x