Embed Size (px)
Citation preview
Investor Presentation
May 2018
2
This presentation contains forward-looking statements within the meaning of the securities laws. Forward-looking statements can be identified by the fact that they do not relate strictly to historical or current facts. They often include words or variation of words such as "expects," "anticipates," "intends," "plans," "believes," "seeks," "estimates," "projects," "forecasts," "targets," "would," "will," "should," "goal," "could" or "may" or other similar expressions. Forward-looking statements provide management's current expectations or predictions of future conditions, events or results. All statements that address operating performance, events or developments that we expect or anticipate will occur in the future are forward-looking statements. They may include estimates of revenues, income, earnings per share, cost savings, capital expenditures, dividends, share repurchases, liquidity, capital structure, market share, industry volume, or other financial items, descriptions of management’s plans or objectives for future operations, or descriptions of assumptions underlying any of the above. All forward-looking statements speak only as of the date they are made and reflect the company's good faith beliefs, assumptions and expectations, but they are not guarantees of future performance or events. Furthermore, the company disclaims any obligation to publicly update or revise any forward-looking statement, except as required by law. By their nature, forward-looking statements are subject to risks and uncertainties that could cause actual results to differ materially from those suggested by the forward-looking statements. Factors that might cause such differences include, but are not limited to, a variety of economic, competitive and regulatory factors, many of which are beyond the company's control, that are described in our Annual Report on Form 10-K for the fiscal year ended Dec. 31, 2017, as well as additional factors we may describe from time to time in other filings with the SEC. You may get such filings for free at our website at www.peabodyenergy.com. You should understand that it is not possible to predict or identify all such factors and, consequently, you should not consider any such list to be a complete set of all potential risks or uncertainties.
Statement on Forward-Looking Information
3
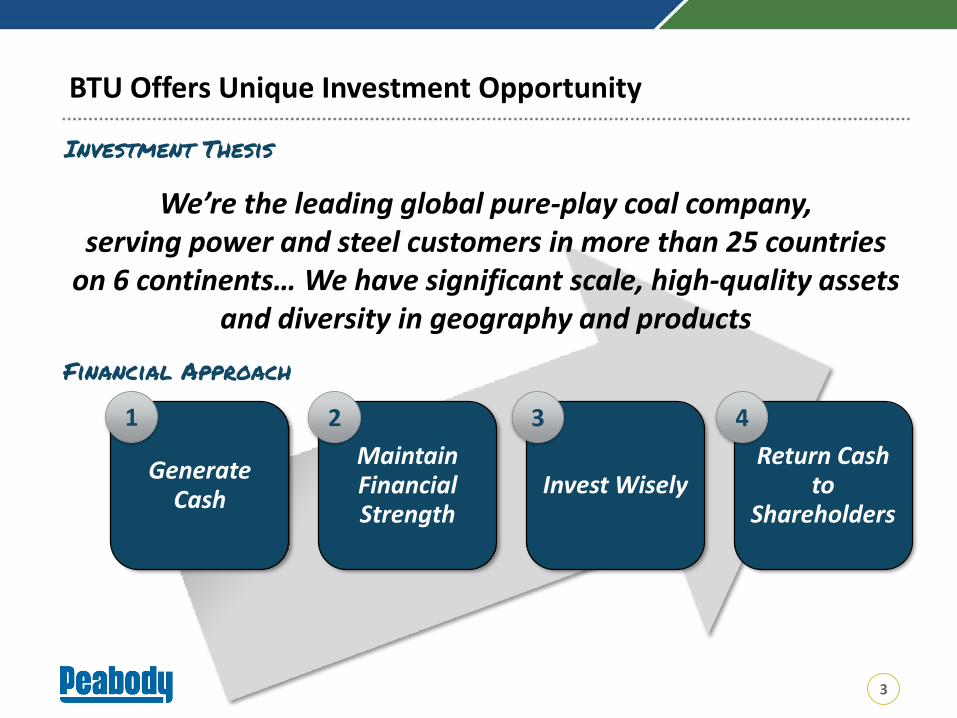
Generate Cash
Maintain Financial Strength
Invest WiselyReturn Cash
to Shareholders
We’re the leading global pure-play coal company, serving power and steel customers in more than 25 countries
on 6 continents… We have significant scale, high-quality assets and diversity in geography and products
1 2 3 4
Investment Thesis
Financial Approach
BTU Offers Unique Investment Opportunity
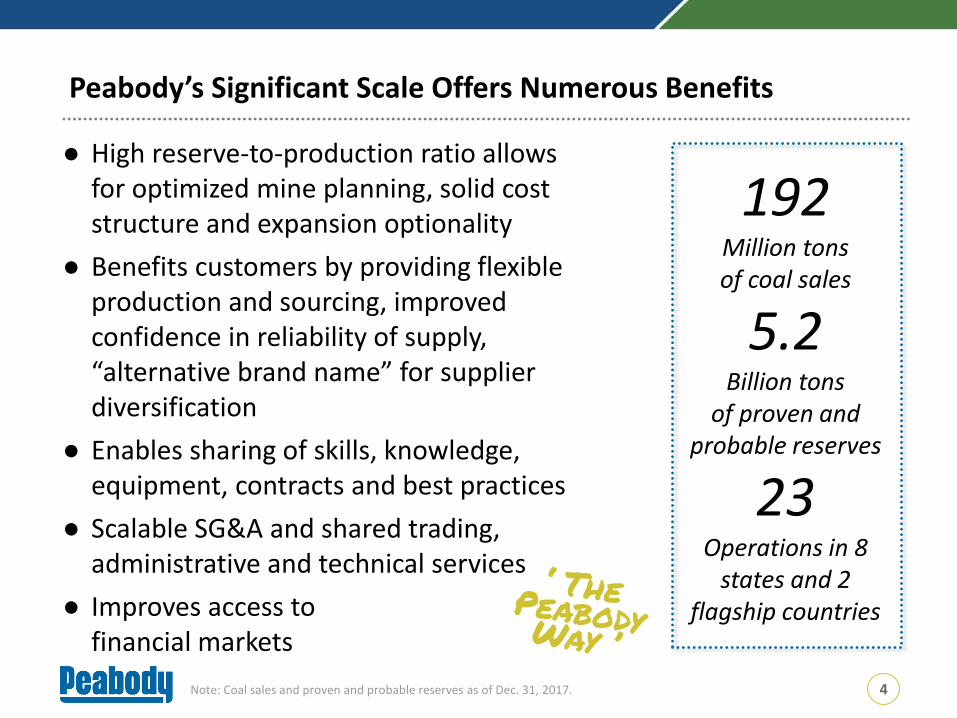
192Million tons of coal sales
5.2Billion tons
of proven and probable reserves
23 Operations in 8
states and 2 flagship countries
● High reserve-to-production ratio allows for optimized mine planning, solid cost structure and expansion optionality
● Benefits customers by providing flexible production and sourcing, improved confidence in reliability of supply, “alternative brand name” for supplier diversification
● Enables sharing of skills, knowledge, equipment, contracts and best practices
● Scalable SG&A and shared trading, administrative and technical services
● Improves access tofinancial markets
Note: Coal sales and proven and probable reserves as of Dec. 31, 2017.
Peabody’s Significant Scale Offers Numerous Benefits
4
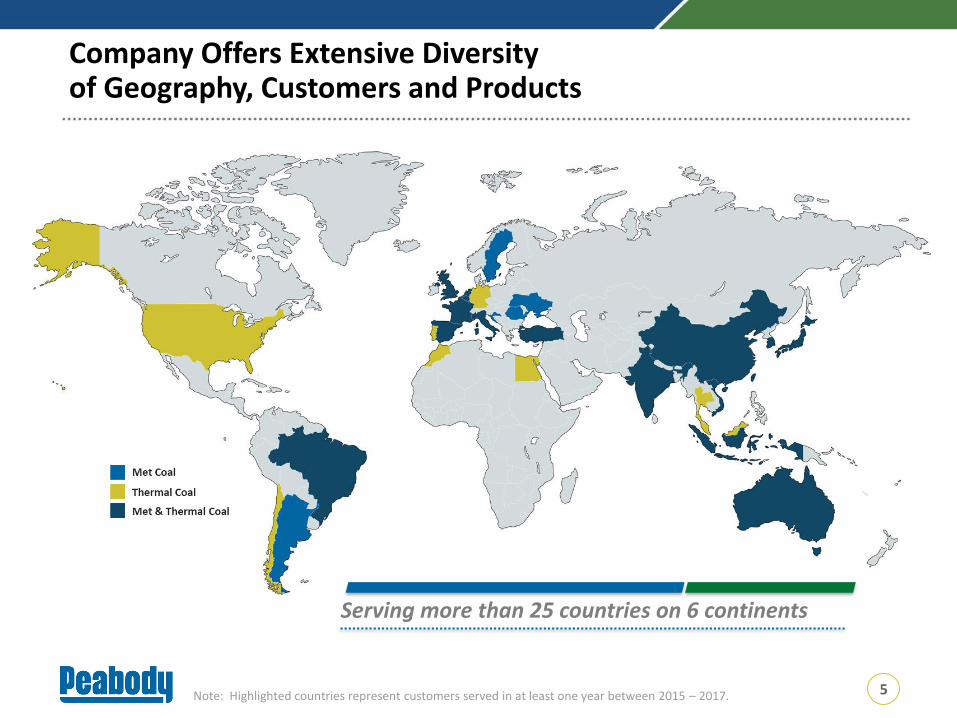
Company Offers Extensive Diversity of Geography, Customers and Products
5Note: Highlighted countries represent customers served in at least one year between 2015 – 2017.
Serving more than 25 countries on 6 continents
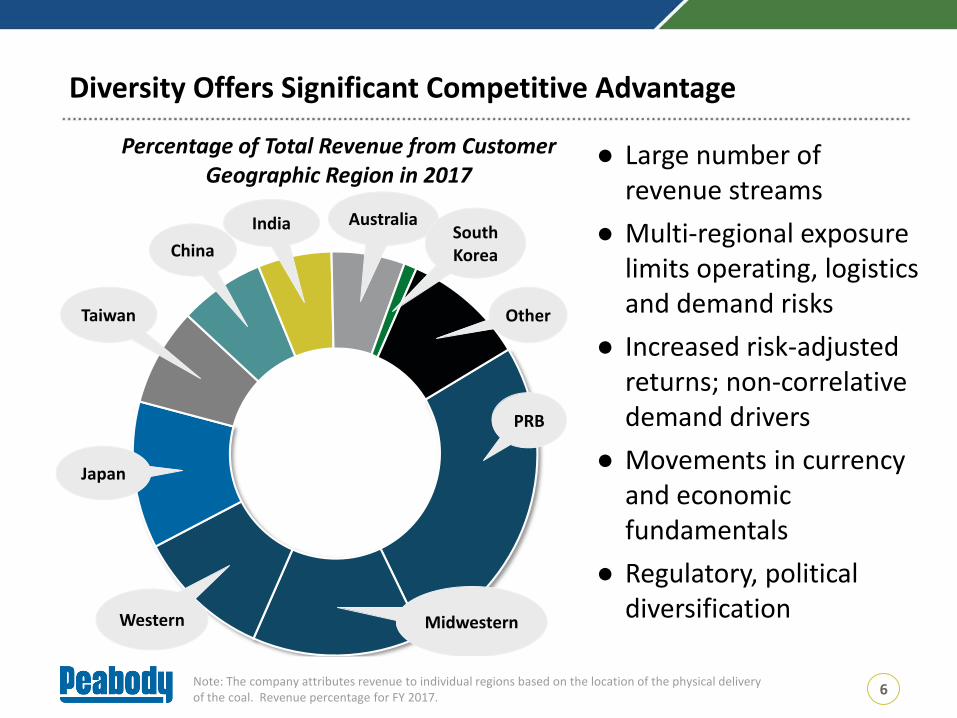
● Large number of revenue streams
● Multi-regional exposure limits operating, logistics and demand risks
● Increased risk-adjusted returns; non-correlative demand drivers
● Movements in currency and economic fundamentals
● Regulatory, political diversification
6
PRB
MidwesternWestern
Japan
Taiwan
China
India AustraliaSouth Korea
Other
Percentage of Total Revenue from Customer Geographic Region in 2017
Note: The company attributes revenue to individual regions based on the location of the physical delivery of the coal. Revenue percentage for FY 2017.
Diversity Offers Significant Competitive Advantage
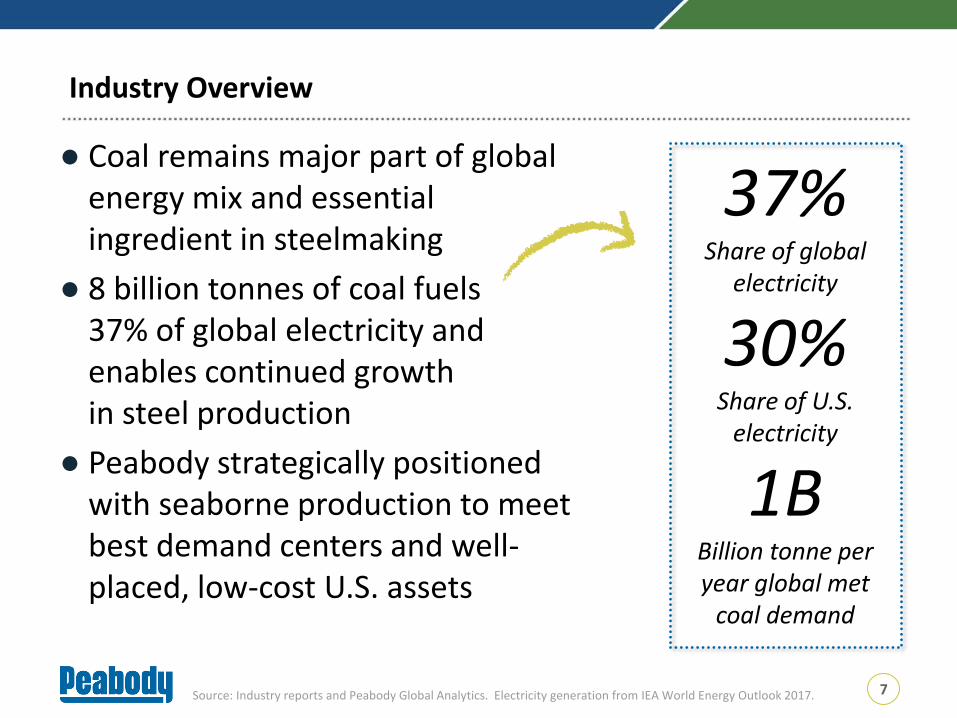
● Coal remains major part of global energy mix and essential ingredient in steelmaking
● 8 billion tonnes of coal fuels 37% of global electricity and enables continued growth in steel production
● Peabody strategically positioned with seaborne production to meet best demand centers and well-placed, low-cost U.S. assets
37% Share of global
electricity
30%Share of U.S.
electricity
1BBillion tonne per year global met
coal demand
Source: Industry reports and Peabody Global Analytics. Electricity generation from IEA World Energy Outlook 2017.
Industry Overview
7
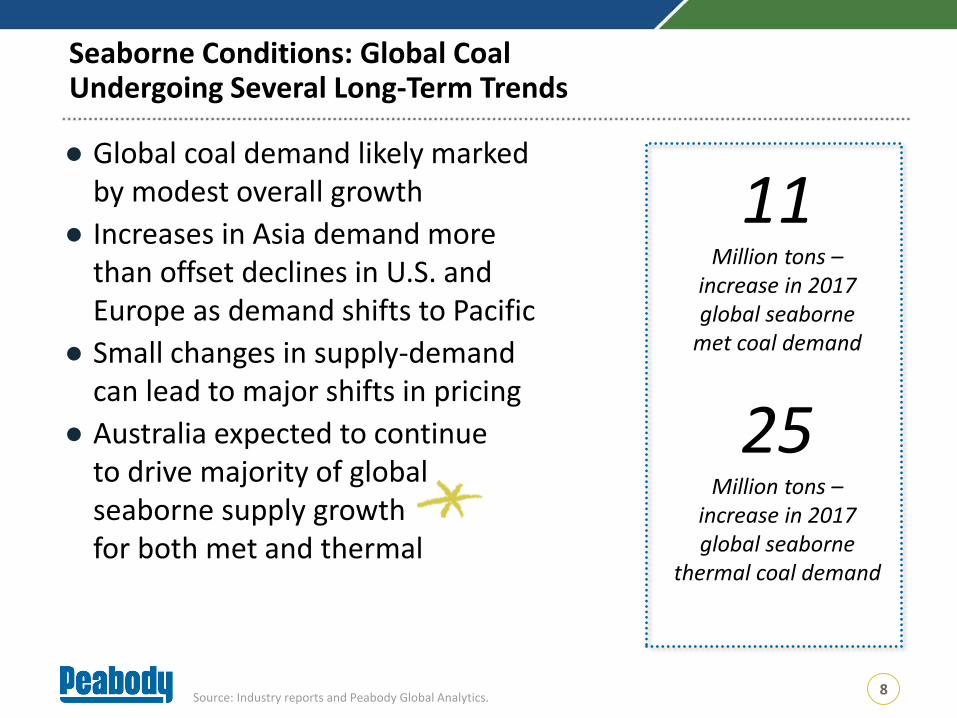
● Global coal demand likely marked by modest overall growth
● Increases in Asia demand more than offset declines in U.S. and Europe as demand shifts to Pacific
● Small changes in supply-demand can lead to major shifts in pricing
● Australia expected to continueto drive majority of global seaborne supply growth for both met and thermal
11Million tons –
increase in 2017 global seaborne
met coal demand
25Million tons –
increase in 2017 global seaborne
thermal coal demand
Source: Industry reports and Peabody Global Analytics.
Seaborne Conditions: Global Coal Undergoing Several Long-Term Trends
8
IHS Markit: Total Global Coal Generation Capacity to Increase 15% by 2030
9
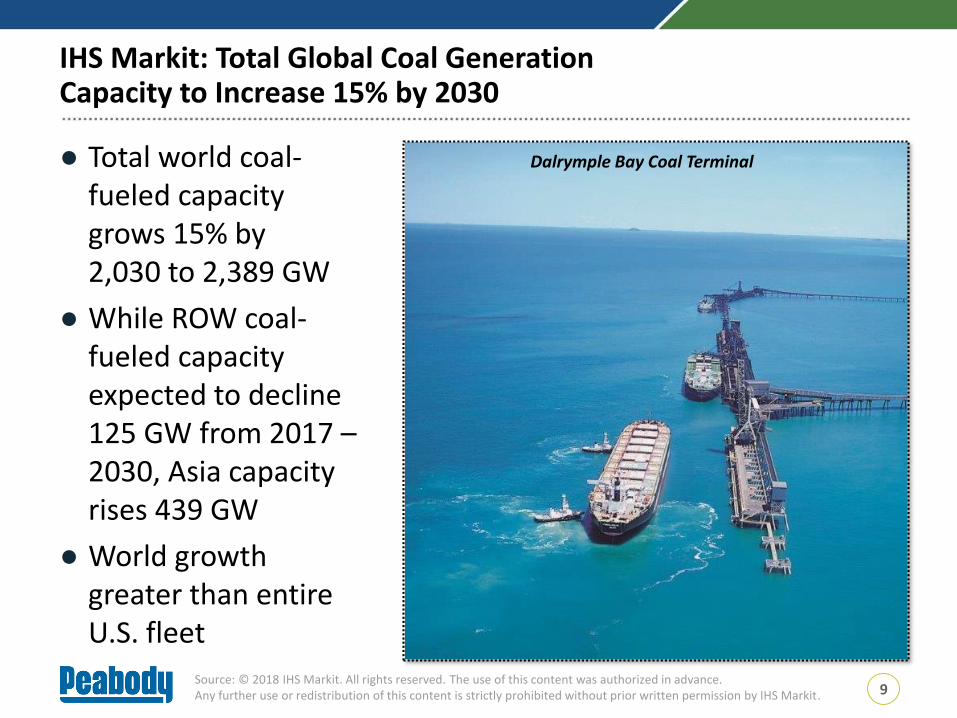
● Total world coal-fueled capacity grows 15% by 2,030 to 2,389 GW
● While ROW coal-fueled capacityexpected to decline 125 GW from 2017 –2030, Asia capacity rises 439 GW
● World growth greater than entire U.S. fleet
Source: © 2018 IHS Markit. All rights reserved. The use of this content was authorized in advance.Any further use or redistribution of this content is strictly prohibited without prior written permission by IHS Markit.
Dalrymple Bay Coal Terminal
$0
$50
$100
$150
$200
$250
$300
$350
Small Changes in Seaborne Metallurgical Supply and Demand Have Outsized Impact on Pricing
10
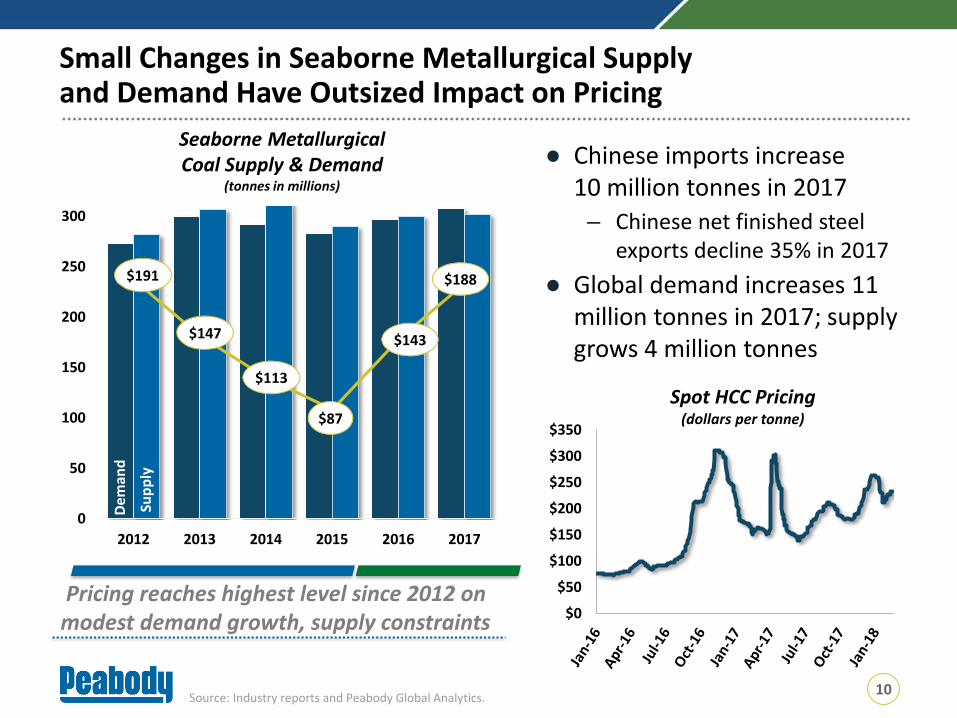
$191
$147
$113
$87
$143
$188
0
50
100
150
200
250
300
2012 2013 2014 2015 2016 2017
Seaborne Metallurgical Coal Supply & Demand
(tonnes in millions)
Source: Industry reports and Peabody Global Analytics.
Pricing reaches highest level since 2012 on modest demand growth, supply constraints
Dem
and
Sup
ply
Spot HCC Pricing (dollars per tonne)
● Chinese imports increase 10 million tonnes in 2017
– Chinese net finished steel exports decline 35% in 2017
● Global demand increases 11 million tonnes in 2017; supply grows 4 million tonnes
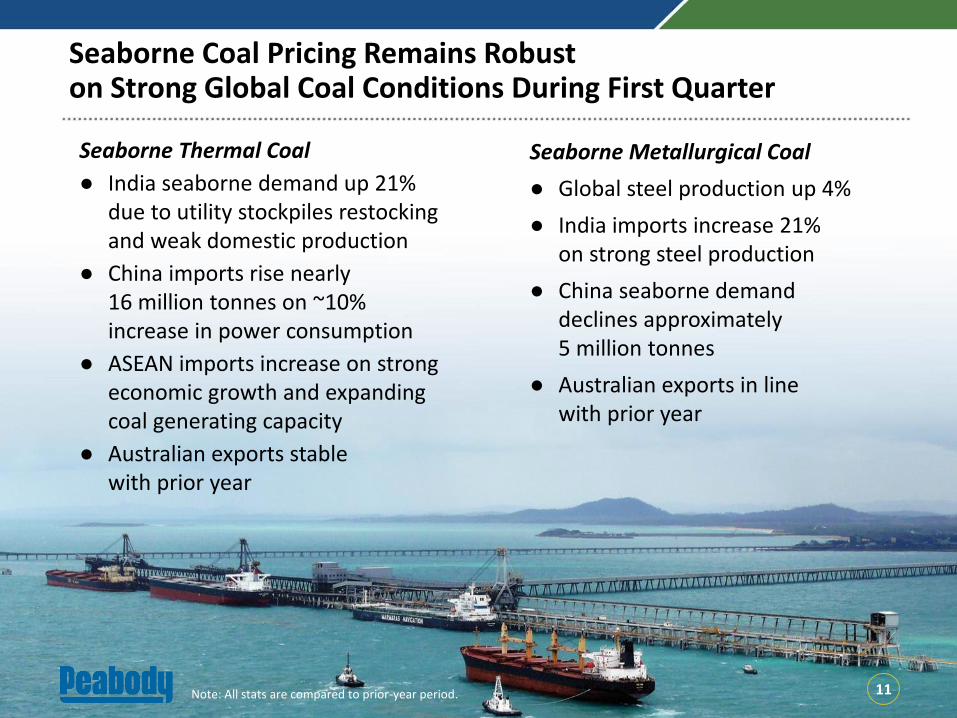
Seaborne Thermal Coal
● India seaborne demand up 21% due to utility stockpiles restocking and weak domestic production
● China imports rise nearly 16 million tonnes on ~10% increase in power consumption
● ASEAN imports increase on strong economic growth and expanding coal generating capacity
● Australian exports stable with prior year
11
Seaborne Coal Pricing Remains Robust on Strong Global Coal Conditions During First Quarter
Seaborne Metallurgical Coal
● Global steel production up 4%
● India imports increase 21% on strong steel production
● China seaborne demand declines approximately 5 million tonnes
● Australian exports in line with prior year
Note: All stats are compared to prior-year period.
12
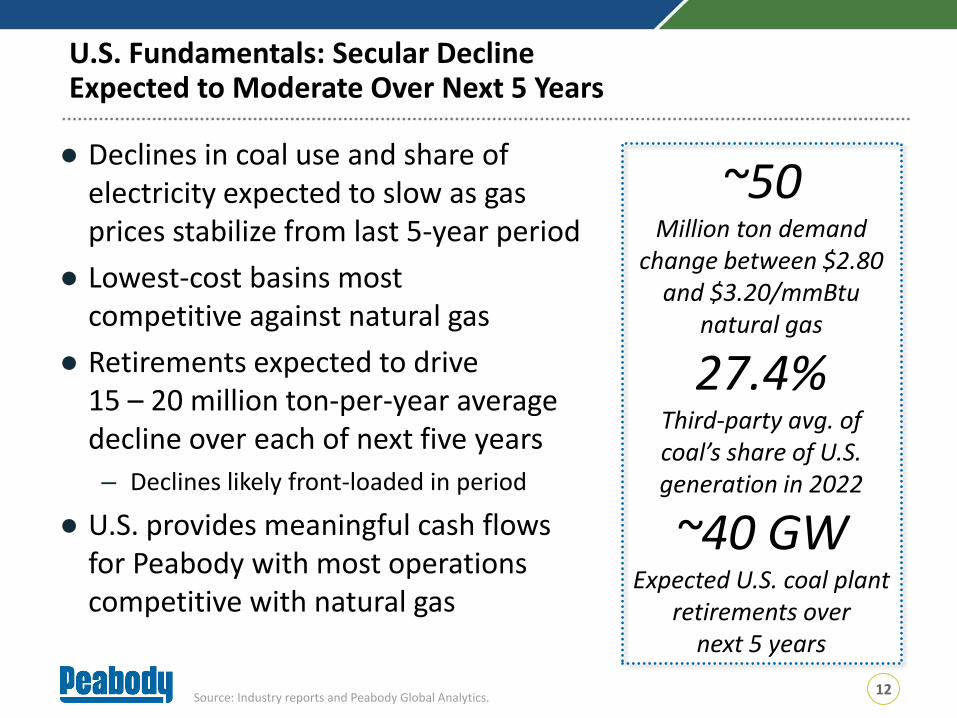
● Declines in coal use and share of electricity expected to slow as gas prices stabilize from last 5-year period
● Lowest-cost basins most competitive against natural gas
● Retirements expected to drive 15 – 20 million ton-per-year average decline over each of next five years
– Declines likely front-loaded in period
● U.S. provides meaningful cash flows for Peabody with most operations competitive with natural gas
~50Million ton demand
change between $2.80 and $3.20/mmBtu
natural gas
27.4%Third-party avg. of coal’s share of U.S. generation in 2022
~40 GWExpected U.S. coal plant
retirements over next 5 years
Source: Industry reports and Peabody Global Analytics.
U.S. Fundamentals: Secular Decline Expected to Moderate Over Next 5 Years
Source: Industry reports and Peabody Global Analytics. U.S. utility coal stockpiles as of quarter end.
U.S. Coal Demand Declines From First Quarter 2017 on Increased Gas and Wind Generation
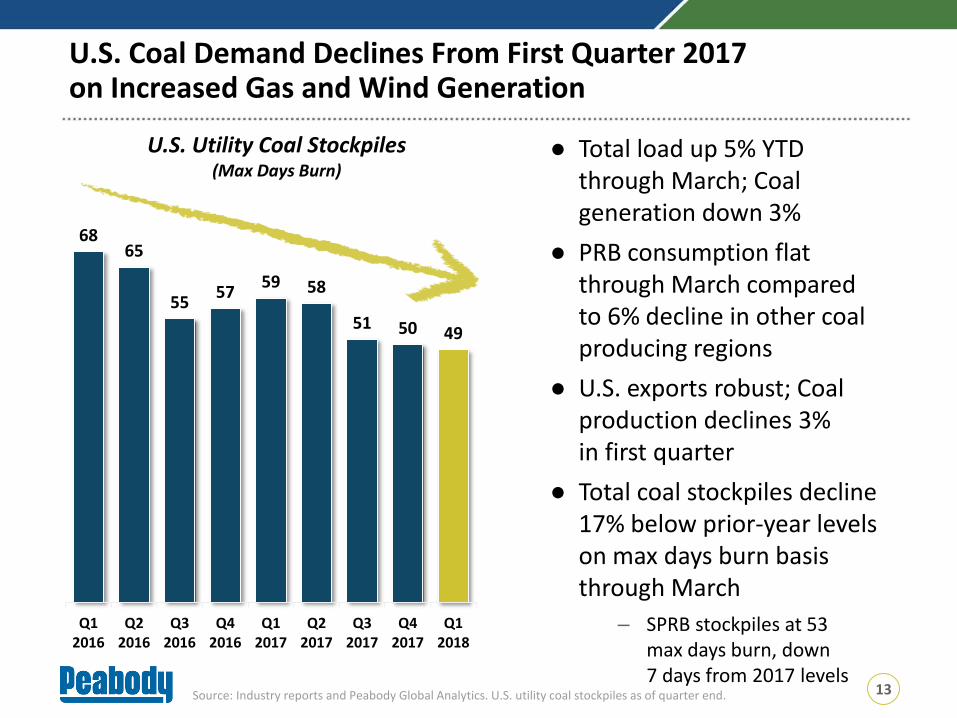
● Total load up 5% YTD through March; Coal generation down 3%
● PRB consumption flat through March compared to 6% decline in other coal producing regions
● U.S. exports robust; Coal production declines 3% in first quarter
● Total coal stockpiles decline 17% below prior-year levels on max days burn basis through March
– SPRB stockpiles at 53 max days burn, down 7 days from 2017 levels
13
6865
5557
59 58
51 50 49
Q12016
Q22016
Q32016
Q42016
Q12017
Q22017
Q32017
Q42017
Q12018
U.S. Utility Coal Stockpiles (Max Days Burn)
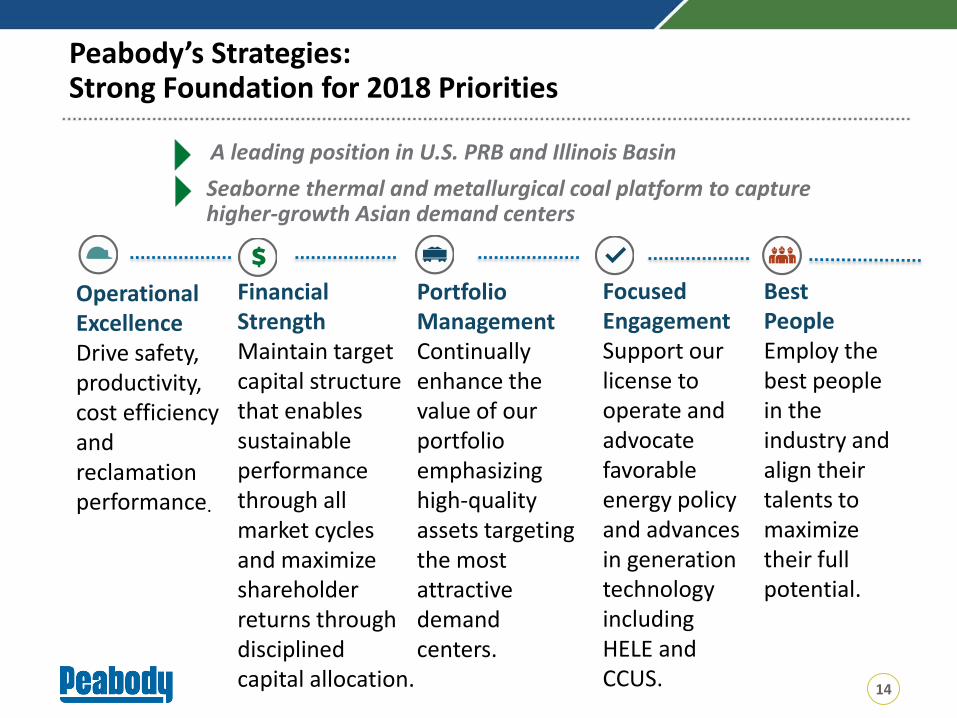
A leading position in U.S. PRB and Illinois Basin
Seaborne thermal and metallurgical coal platform to capture higher-growth Asian demand centers
Operational ExcellenceDrive safety, productivity, cost efficiency and reclamation performance.
Financial StrengthMaintain target capital structure that enables sustainable performance through all market cycles and maximize shareholder returns through disciplined capital allocation.
Portfolio ManagementContinually enhance the value of our portfolio emphasizing high-quality assets targeting the most attractive demand centers.
Focused EngagementSupport our license to operate and advocate favorable energy policy and advances in generation technology including HELE and CCUS.
Best PeopleEmploy the best people in the industry and align their talents to maximize their full potential.
14
Peabody’s Strategies: Strong Foundation for 2018 Priorities
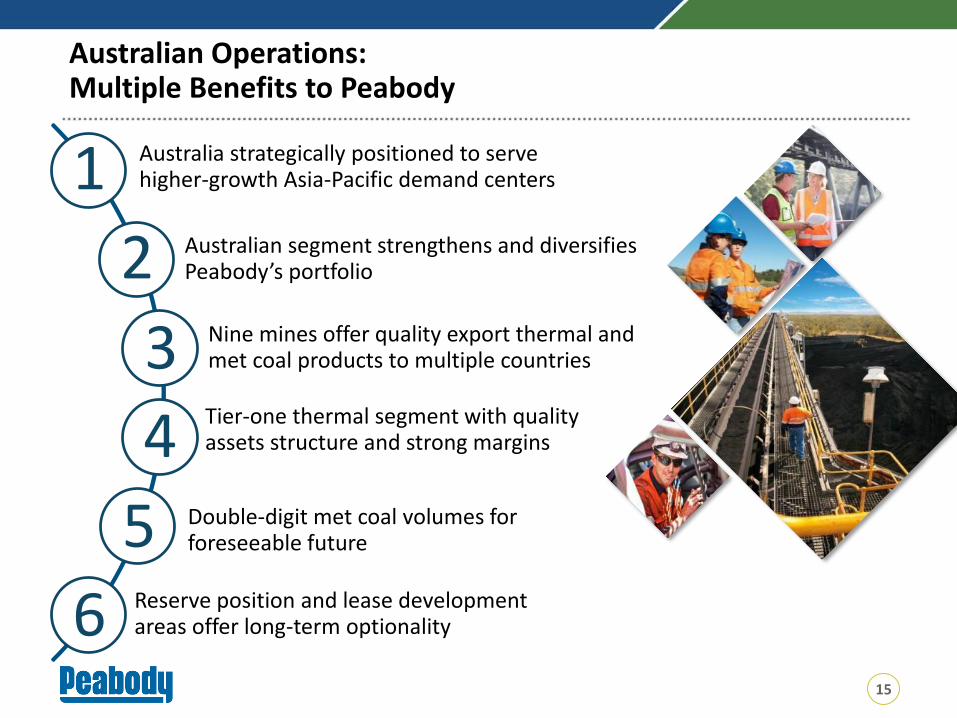
Australia strategically positioned to serve higher-growth Asia-Pacific demand centers
Australian segment strengthens and diversifies Peabody’s portfolio
Nine mines offer quality export thermal and met coal products to multiple countries
Tier-one thermal segment with quality assets structure and strong margins
Double-digit met coal volumes for foreseeable future
Reserve position and lease development areas offer long-term optionality
1
2
3
4
5
6
Australian Operations: Multiple Benefits to Peabody
15
16
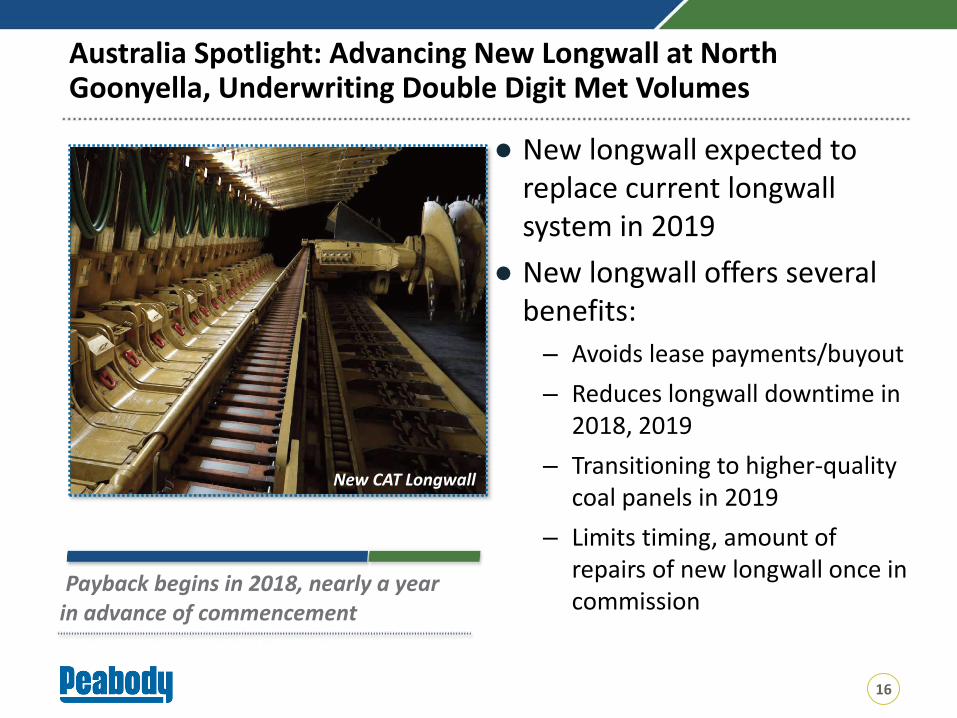
● New longwall expected to replace current longwall system in 2019
● New longwall offers several benefits:
– Avoids lease payments/buyout
– Reduces longwall downtime in 2018, 2019
– Transitioning to higher-quality coal panels in 2019
– Limits timing, amount of repairs of new longwall once in commission
New CAT Longwall
Australia Spotlight: Advancing New Longwall at North Goonyella, Underwriting Double Digit Met Volumes
Payback begins in 2018, nearly a year in advance of commencement
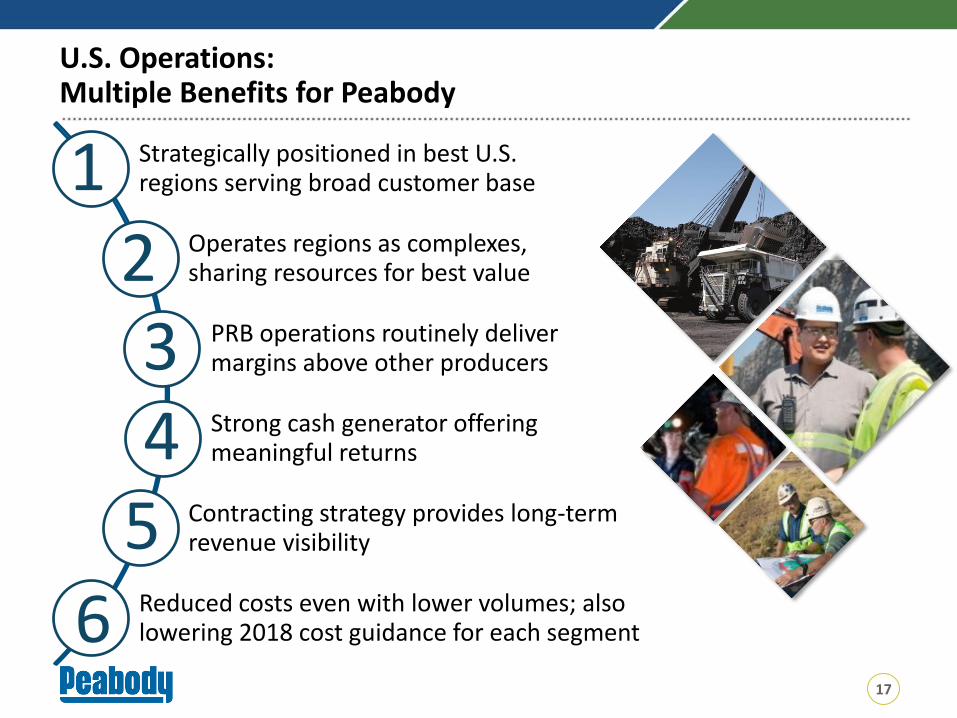
U.S. Operations:Multiple Benefits for Peabody
17
Strategically positioned in best U.S. regions serving broad customer base
Operates regions as complexes, sharing resources for best value
PRB operations routinely delivermargins above other producers
Strong cash generator offering meaningful returns
Contracting strategy provides long-term revenue visibility
Reduced costs even with lower volumes; also lowering 2018 cost guidance for each segment
1234
5
6

25%
21%
17%
11%
Adjusted EBITDA Margin of PRB Producers (2014 – 2017 Average)
18
U.S. Operations: PRB Adjusted EBITDA Margins Routinely Superior to Other PRB Coal Companies
Source: Public company reports. Other PRB producers include Alpha Natural Resources / Contura (through Sept. 30, 2017), Arch, and Cloud Peak (listed in alphabetical order). Adjusted EBITDA margin is a non-GAAP measure and may not be calculated identically by all companies. Please refer to the appendix for information on this non-GAAP measure.
BTU
● Consistently delivers Adjusted EBITDA margins superior to other PRB producers
– 56% higher Adjusted EBITDA margins than average of other PRB coal producers
– Lowest-cost producer
● Well-capitalized reserve position through prior reserve acquisitions
– No new LBAs required for nearly a decade
Peer Avg.
19
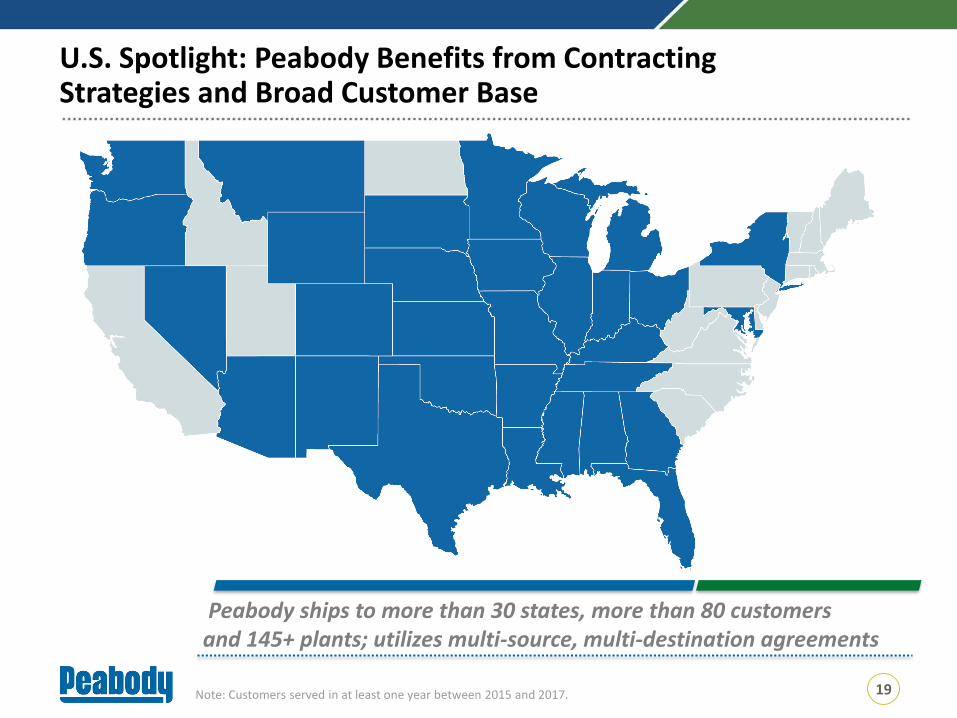
U.S. Spotlight: Peabody Benefits from Contracting Strategies and Broad Customer Base
Peabody ships to more than 30 states, more than 80 customers and 145+ plants; utilizes multi-source, multi-destination agreements
Note: Customers served in at least one year between 2015 and 2017.
20
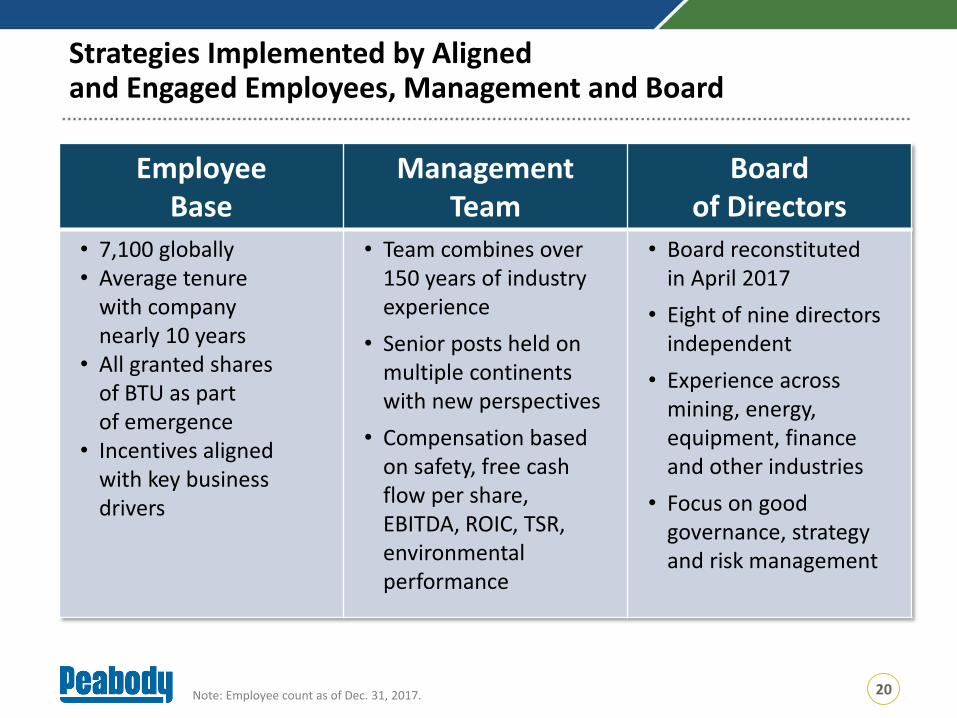
Strategies Implemented by Aligned and Engaged Employees, Management and Board
Employee Base
ManagementTeam
Boardof Directors
• 7,100 globally • Average tenure
with company nearly 10 years
• All granted shares of BTU as part of emergence
• Incentives aligned with key business drivers
• Team combines over 150 years of industry experience
• Senior posts held on multiple continents with new perspectives
• Compensation based on safety, free cash flow per share,EBITDA, ROIC, TSR, environmental performance
• Board reconstituted in April 2017
• Eight of nine directors independent
• Experience across mining, energy, equipment, finance and other industries
• Focus on good governance, strategy and risk management
Note: Employee count as of Dec. 31, 2017.
Operational Results
Non-Core Asset Sales
Utilizing NOLs
Releasing Restricted
Cash
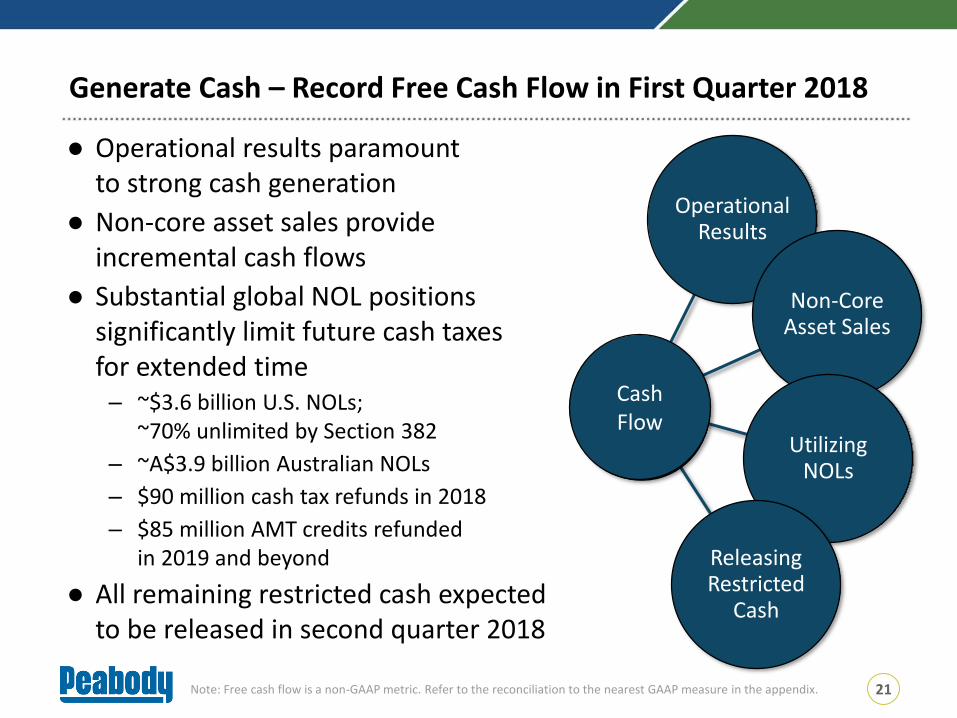
● Operational results paramount to strong cash generation
● Non-core asset sales provide incremental cash flows
● Substantial global NOL positions significantly limit future cash taxes for extended time – ~$3.6 billion U.S. NOLs;
~70% unlimited by Section 382
– ~A$3.9 billion Australian NOLs
– $90 million cash tax refunds in 2018
– $85 million AMT credits refunded in 2019 and beyond
● All remaining restricted cash expected to be released in second quarter 2018
Cash Flow
Generate Cash – Record Free Cash Flow in First Quarter 2018
21Note: Free cash flow is a non-GAAP metric. Refer to the reconciliation to the nearest GAAP measure in the appendix.
22
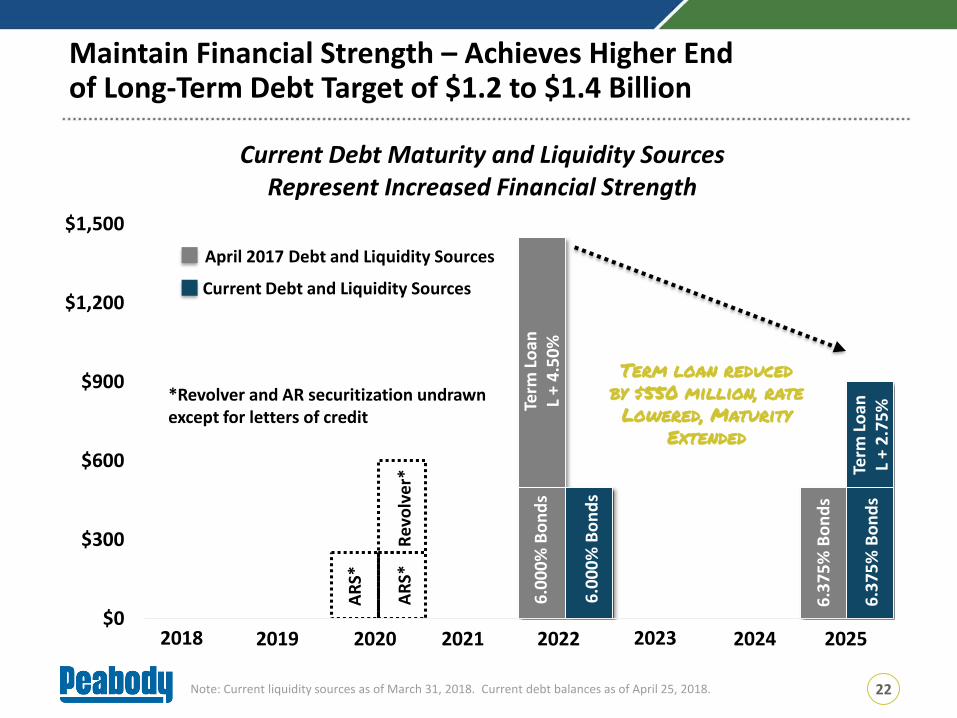
Maintain Financial Strength – Achieves Higher End of Long-Term Debt Target of $1.2 to $1.4 Billion
$0
$300
$600
$900
$1,200
$1,500
Current Debt Maturity and Liquidity SourcesRepresent Increased Financial Strength
Re
volv
er*
April 2017 Debt and Liquidity Sources
6.0
00
% B
on
ds
Term
Lo
anL
+ 4
.50
%
6.0
00
% B
on
ds
Term
Lo
anL
+ 2
.75
%6
.37
5%
Bo
nd
s
6.3
75
% B
on
ds
202220192018 2020 2021 2023 2024 2025
Current Debt and Liquidity Sources
*Revolver and AR securitization undrawn except for letters of credit
Term loan reduced
by $550 million, rate
Lowered, Maturity
Extended
AR
S*
AR
S*
Note: Current liquidity sources as of March 31, 2018. Current debt balances as of April 25, 2018.
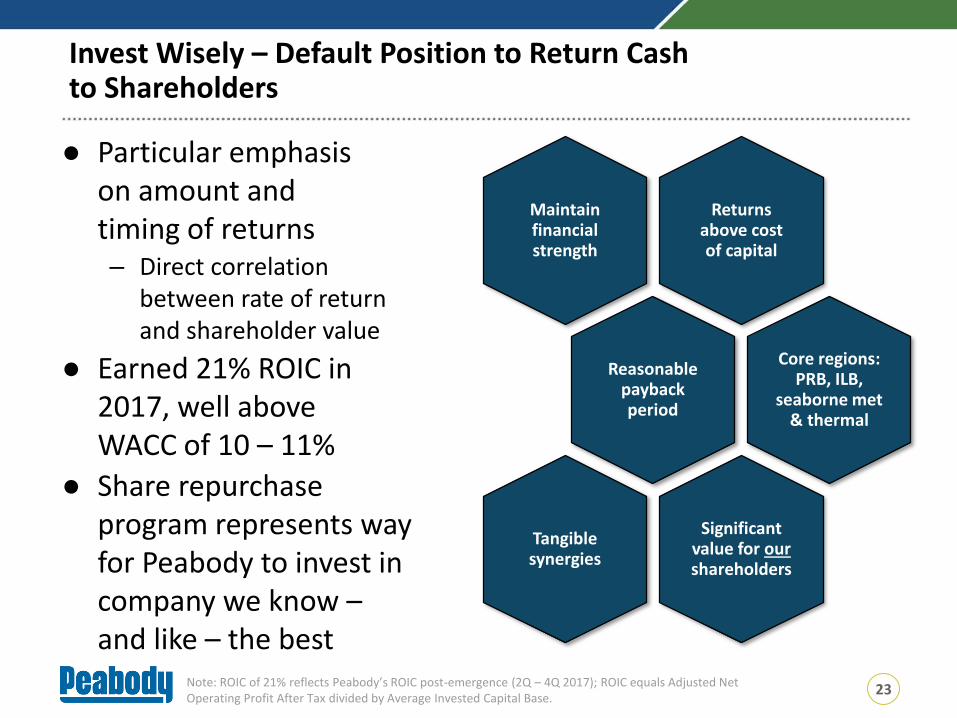
Returns above cost of capital
Maintain financial strength
Reasonable payback period
Core regions: PRB, ILB,
seaborne met & thermal
Significant value for ourshareholders
Tangible synergies
23
● Particular emphasis on amount and timing of returns – Direct correlation
between rate of return and shareholder value
● Earned 21% ROIC in 2017, well above WACC of 10 – 11%
● Share repurchase program represents way for Peabody to invest in company we know –and like – the best
Invest Wisely – Default Position to Return Cash to Shareholders
Note: ROIC of 21% reflects Peabody’s ROIC post-emergence (2Q – 4Q 2017); ROIC equals Adjusted Net Operating Profit After Tax divided by Average Invested Capital Base.
24
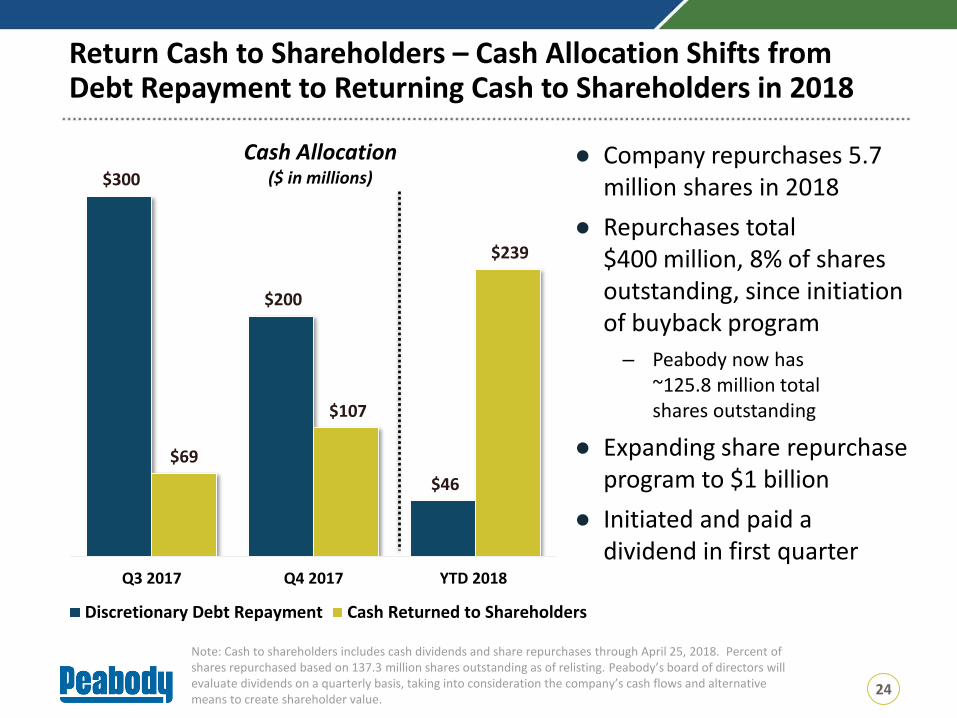
$300
$200
$46
$69
$107
$239
Q3 2017 Q4 2017 YTD 2018
Cash Allocation($ in millions)
Discretionary Debt Repayment Cash Returned to Shareholders
● Company repurchases 5.7 million shares in 2018
● Repurchases total $400 million, 8% of shares outstanding, since initiation of buyback program
– Peabody now has ~125.8 million total shares outstanding
● Expanding share repurchase program to $1 billion
● Initiated and paid a dividend in first quarter
Note: Cash to shareholders includes cash dividends and share repurchases through April 25, 2018. Percent of shares repurchased based on 137.3 million shares outstanding as of relisting. Peabody’s board of directors will evaluate dividends on a quarterly basis, taking into consideration the company’s cash flows and alternative means to create shareholder value.
Return Cash to Shareholders – Cash Allocation Shifts from Debt Repayment to Returning Cash to Shareholders in 2018
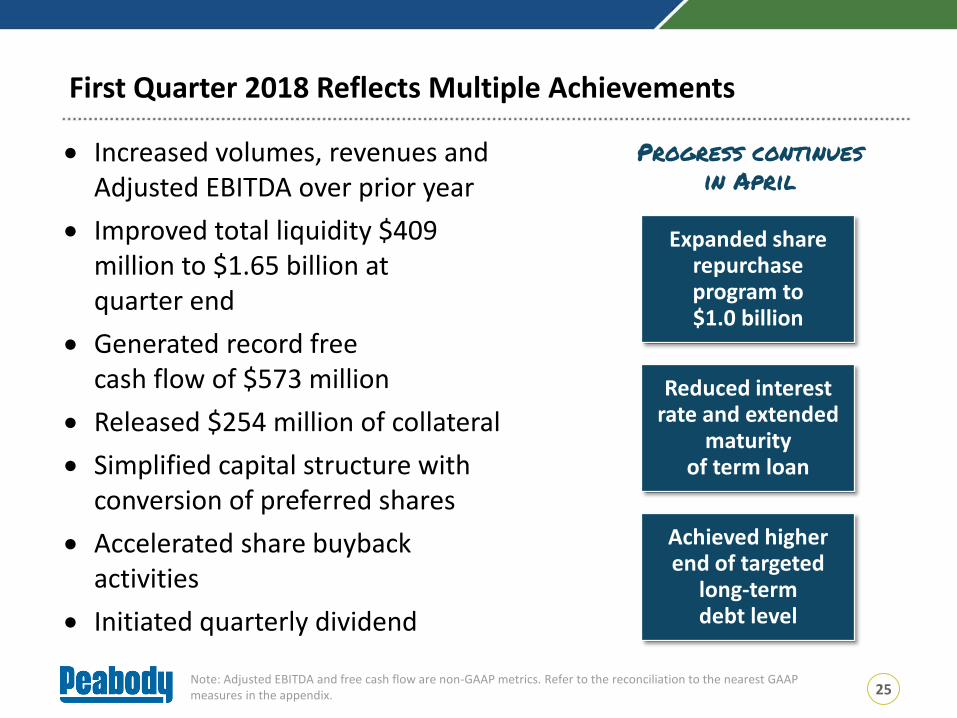
• Increased volumes, revenues and Adjusted EBITDA over prior year
• Improved total liquidity $409 million to $1.65 billion at quarter end
• Generated record free cash flow of $573 million
• Released $254 million of collateral
• Simplified capital structure with conversion of preferred shares
• Accelerated share buyback activities
• Initiated quarterly dividend
25
First Quarter 2018 Reflects Multiple Achievements
Expanded share repurchase program to $1.0 billion
Reduced interest rate and extended
maturity of term loan
Achieved higher end of targeted
long-term debt level
Progress continues
in April
Note: Adjusted EBITDA and free cash flow are non-GAAP metrics. Refer to the reconciliation to the nearest GAAP measures in the appendix.
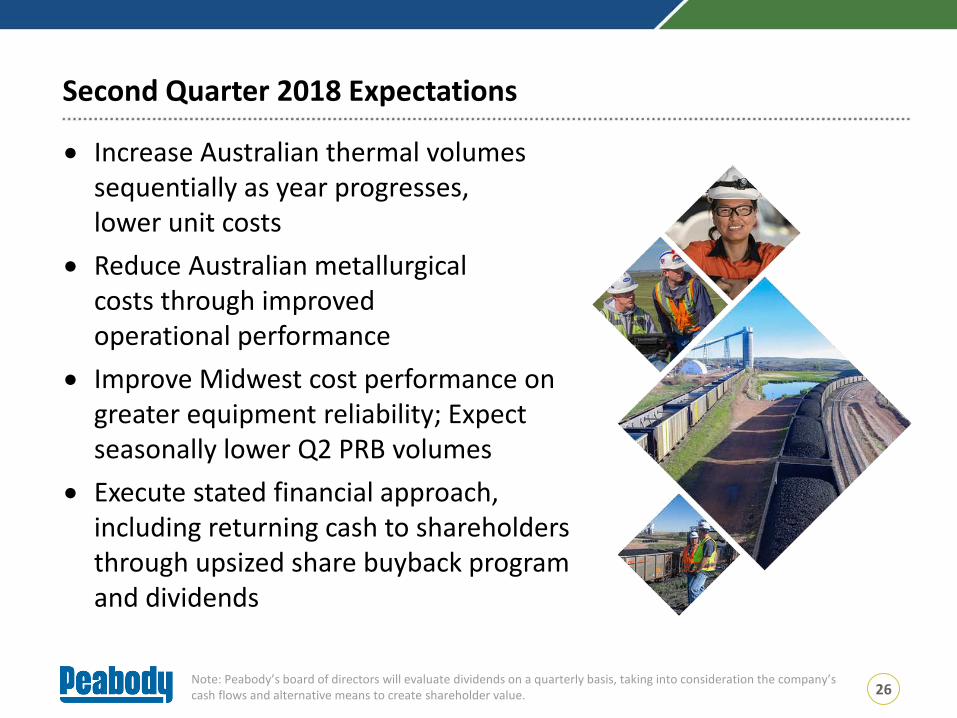
Second Quarter 2018 Expectations
• Increase Australian thermal volumes sequentially as year progresses, lower unit costs
• Reduce Australian metallurgical costs through improved operational performance
• Improve Midwest cost performance on greater equipment reliability; Expect seasonally lower Q2 PRB volumes
• Execute stated financial approach, including returning cash to shareholders through upsized share buyback program and dividends
26Note: Peabody’s board of directors will evaluate dividends on a quarterly basis, taking into consideration the company’s cash flows and alternative means to create shareholder value.
27
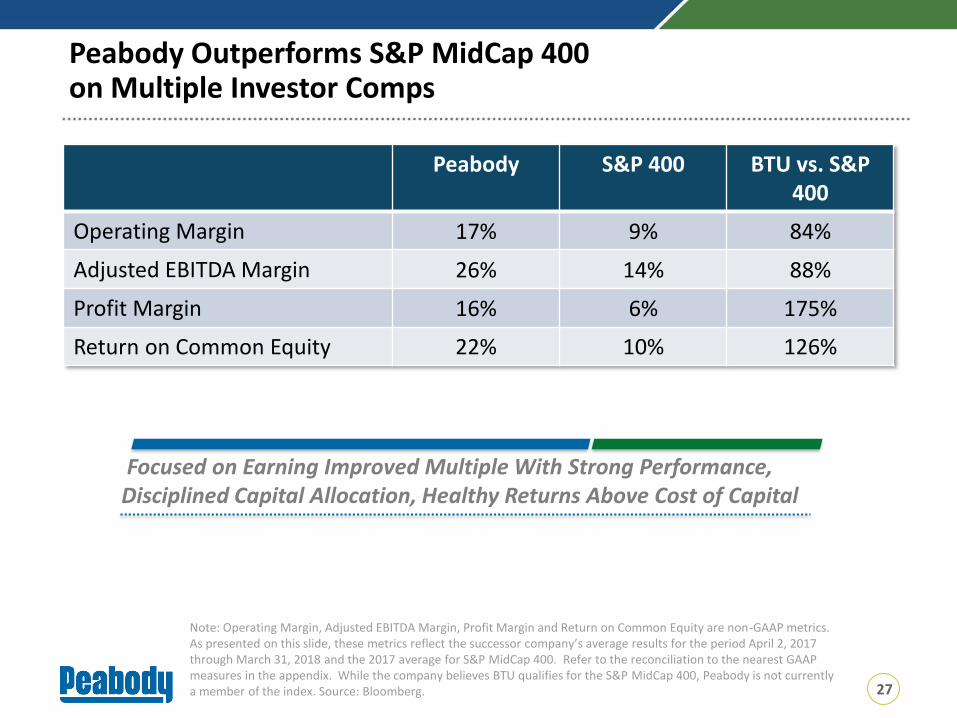
Focused on Earning Improved Multiple With Strong Performance, Disciplined Capital Allocation, Healthy Returns Above Cost of Capital
Peabody S&P 400 BTU vs. S&P 400
Operating Margin 17% 9% 84%
Adjusted EBITDA Margin 26% 14% 88%
Profit Margin 16% 6% 175%
Return on Common Equity 22% 10% 126%
Note: Operating Margin, Adjusted EBITDA Margin, Profit Margin and Return on Common Equity are non-GAAP metrics. As presented on this slide, these metrics reflect the successor company’s average results for the period April 2, 2017 through March 31, 2018 and the 2017 average for S&P MidCap 400. Refer to the reconciliation to the nearest GAAP measures in the appendix. While the company believes BTU qualifies for the S&P MidCap 400, Peabody is not currently a member of the index. Source: Bloomberg.
Peabody Outperforms S&P MidCap 400 on Multiple Investor Comps
• The Peabody team delivered powerful achievements in 2017, and we’re not about to stop
• We are committed to outlining approach and then delivering
• We have the right assets, financial strength, people and strategies to succeed
• We are continuing to progress actions that will drive continued valuation uplifts throughout the commodity cycles
NYSE: BTU PeabodyEnergy.com
Peabody: Integrated Approach Creates Maximum Value
28
Appendix
2018 Guidance Targets
30
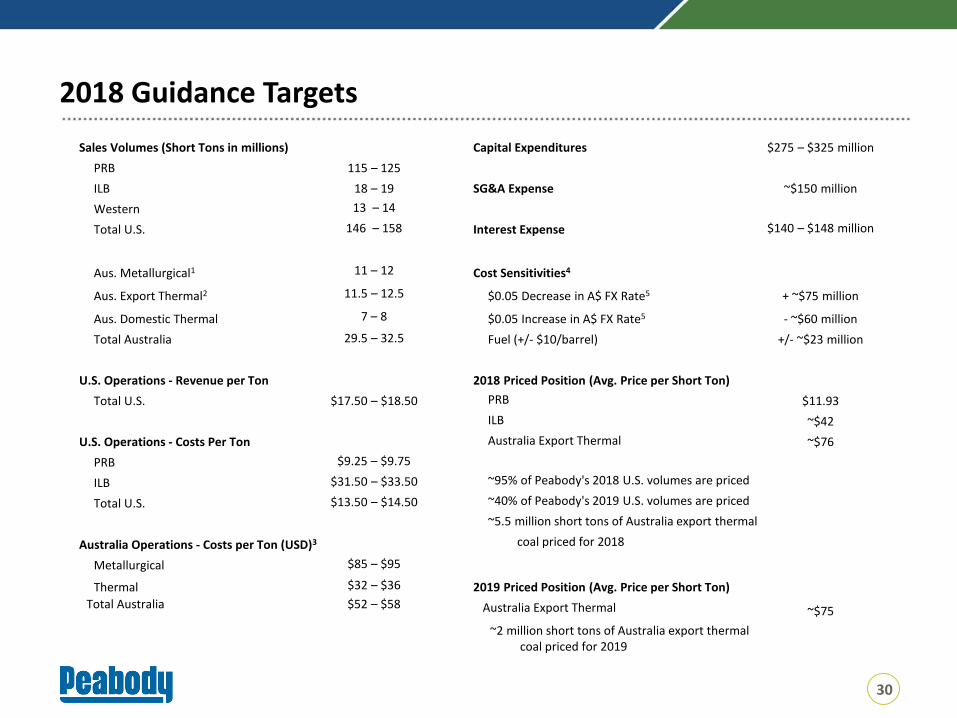
Sales Volumes (Short Tons in millions) Capital Expenditures $275 – $325 million
PRB 115 – 125
ILB 18 – 19 SG&A Expense ~$150 million
Western 13 – 14
Total U.S. 146 – 158 Interest Expense $140 – $148 million
Aus. Metallurgical1 11 – 12 Cost Sensitivities4
Aus. Export Thermal2 11.5 – 12.5 $0.05 Decrease in A$ FX Rate5 + ~$75 million
Aus. Domestic Thermal 7 – 8 $0.05 Increase in A$ FX Rate5 - ~$60 million
Total Australia 29.5 – 32.5 Fuel (+/- $10/barrel) +/- ~$23 million
U.S. Operations - Revenue per Ton 2018 Priced Position (Avg. Price per Short Ton)
Total U.S. $17.50 – $18.50 PRB $11.93
ILB ~$42
U.S. Operations - Costs Per Ton Australia Export Thermal ~$76
PRB $9.25 – $9.75
ILB $31.50 – $33.50 ~95% of Peabody's 2018 U.S. volumes are priced
Total U.S. $13.50 – $14.50 ~40% of Peabody's 2019 U.S. volumes are priced
~5.5 million short tons of Australia export thermal
Australia Operations - Costs per Ton (USD)3 coal priced for 2018
Metallurgical $85 – $95
Thermal $32 – $36 2019 Priced Position (Avg. Price per Short Ton)
Total Australia $52 – $58 Australia Export Thermal ~$75
~2 million short tons of Australia export thermalcoal priced for 2019
2018 Guidance Targets
31
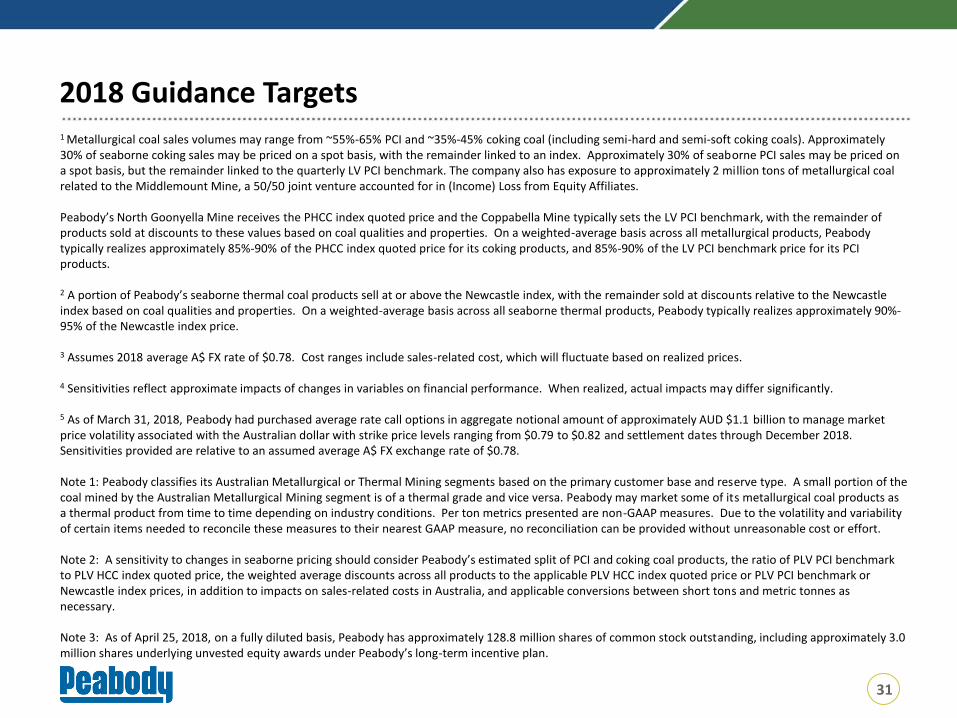
1 Metallurgical coal sales volumes may range from ~55%-65% PCI and ~35%-45% coking coal (including semi-hard and semi-soft coking coals). Approximately 30% of seaborne coking sales may be priced on a spot basis, with the remainder linked to an index. Approximately 30% of seaborne PCI sales may be priced on a spot basis, but the remainder linked to the quarterly LV PCI benchmark. The company also has exposure to approximately 2 million tons of metallurgical coal related to the Middlemount Mine, a 50/50 joint venture accounted for in (Income) Loss from Equity Affiliates.
Peabody’s North Goonyella Mine receives the PHCC index quoted price and the Coppabella Mine typically sets the LV PCI benchmark, with the remainder of products sold at discounts to these values based on coal qualities and properties. On a weighted-average basis across all metallurgical products, Peabody typically realizes approximately 85%-90% of the PHCC index quoted price for its coking products, and 85%-90% of the LV PCI benchmark price for its PCI products.
2 A portion of Peabody’s seaborne thermal coal products sell at or above the Newcastle index, with the remainder sold at discounts relative to the Newcastle index based on coal qualities and properties. On a weighted-average basis across all seaborne thermal products, Peabody typically realizes approximately 90%-95% of the Newcastle index price.
3 Assumes 2018 average A$ FX rate of $0.78. Cost ranges include sales-related cost, which will fluctuate based on realized prices.
4 Sensitivities reflect approximate impacts of changes in variables on financial performance. When realized, actual impacts may differ significantly.
5 As of March 31, 2018, Peabody had purchased average rate call options in aggregate notional amount of approximately AUD $1.1 billion to manage market price volatility associated with the Australian dollar with strike price levels ranging from $0.79 to $0.82 and settlement dates through December 2018. Sensitivities provided are relative to an assumed average A$ FX exchange rate of $0.78.
Note 1: Peabody classifies its Australian Metallurgical or Thermal Mining segments based on the primary customer base and reserve type. A small portion of the coal mined by the Australian Metallurgical Mining segment is of a thermal grade and vice versa. Peabody may market some of its metallurgical coal products as a thermal product from time to time depending on industry conditions. Per ton metrics presented are non-GAAP measures. Due to the volatility and variability of certain items needed to reconcile these measures to their nearest GAAP measure, no reconciliation can be provided without unreasonable cost or effort.
Note 2: A sensitivity to changes in seaborne pricing should consider Peabody’s estimated split of PCI and coking coal products, the ratio of PLV PCI benchmark to PLV HCC index quoted price, the weighted average discounts across all products to the applicable PLV HCC index quoted price or PLV PCI benchmark or Newcastle index prices, in addition to impacts on sales-related costs in Australia, and applicable conversions between short tons and metric tonnes as necessary.
Note 3: As of April 25, 2018, on a fully diluted basis, Peabody has approximately 128.8 million shares of common stock outstanding, including approximately 3.0 million shares underlying unvested equity awards under Peabody’s long-term incentive plan.
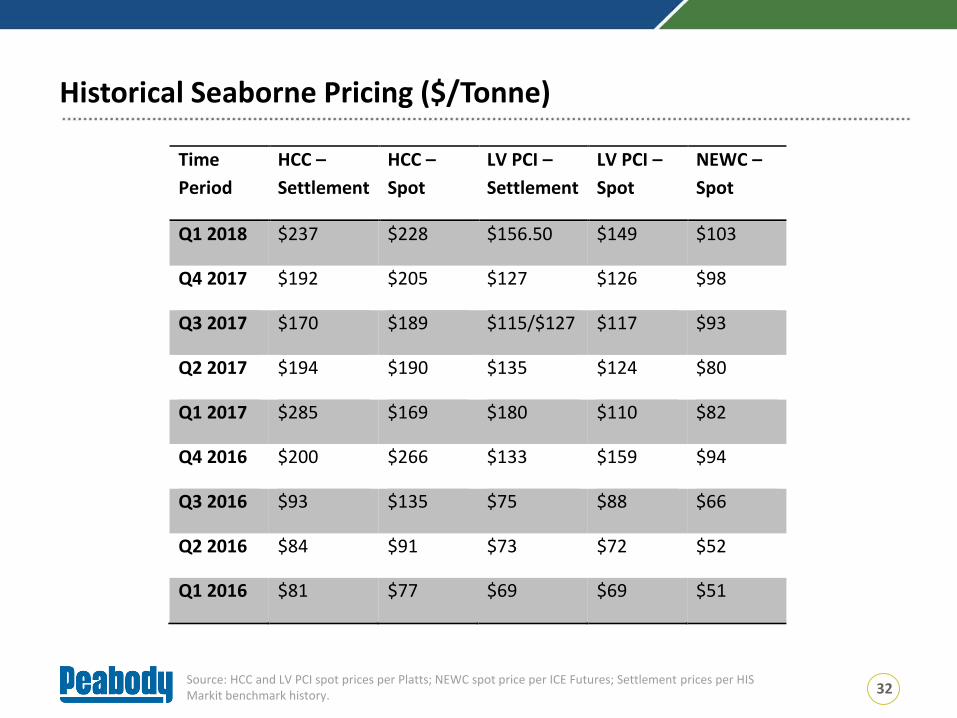
Historical Seaborne Pricing ($/Tonne)
32Source: HCC and LV PCI spot prices per Platts; NEWC spot price per ICE Futures; Settlement prices per HIS Markit benchmark history.
Time
Period
HCC –
Settlement
HCC –
Spot
LV PCI –
Settlement
LV PCI –
Spot
NEWC –
Spot
Q1 2018 $237 $228 $156.50 $149 $103
Q4 2017 $192 $205 $127 $126 $98
Q3 2017 $170 $189 $115/$127 $117 $93
Q2 2017 $194 $190 $135 $124 $80
Q1 2017 $285 $169 $180 $110 $82
Q4 2016 $200 $266 $133 $159 $94
Q3 2016 $93 $135 $75 $88 $66
Q2 2016 $84 $91 $73 $72 $52
Q1 2016 $81 $77 $69 $69 $51
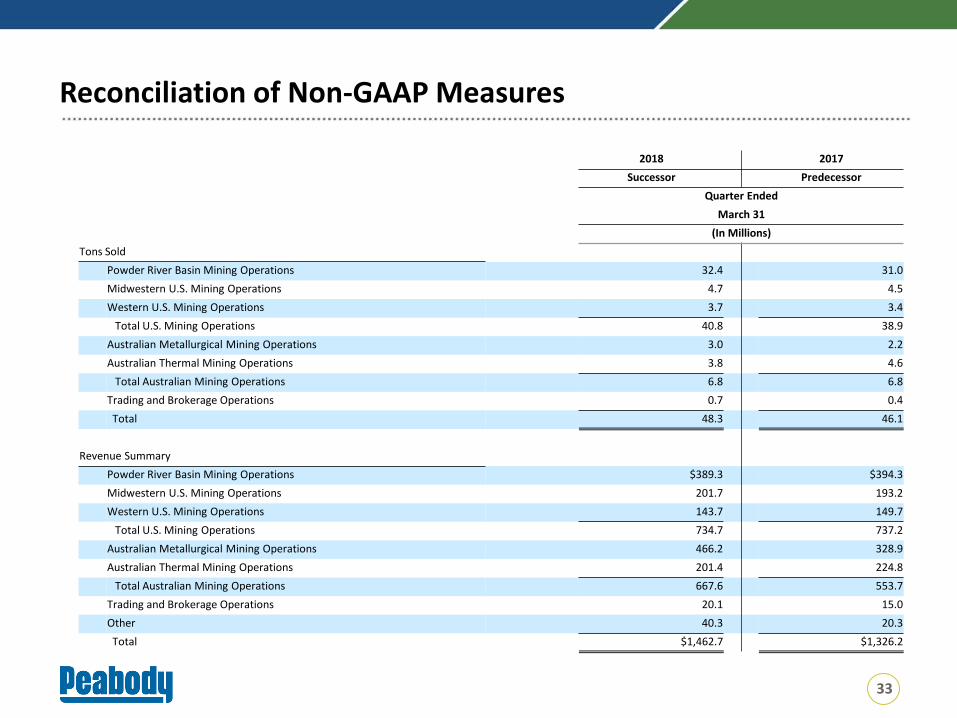
Reconciliation of Non-GAAP Measures
33
2018 2017
Successor Predecessor
Quarter Ended
March 31
(In Millions)
Tons Sold
Powder River Basin Mining Operations 32.4 31.0
Midwestern U.S. Mining Operations 4.7 4.5
Western U.S. Mining Operations 3.7 3.4
Total U.S. Mining Operations 40.8 38.9
Australian Metallurgical Mining Operations 3.0 2.2
Australian Thermal Mining Operations 3.8 4.6
Total Australian Mining Operations 6.8 6.8
Trading and Brokerage Operations 0.7 0.4
Total 48.3 46.1
Revenue Summary
Powder River Basin Mining Operations $389.3 $394.3
Midwestern U.S. Mining Operations 201.7 193.2
Western U.S. Mining Operations 143.7 149.7
Total U.S. Mining Operations 734.7 737.2
Australian Metallurgical Mining Operations 466.2 328.9
Australian Thermal Mining Operations 201.4 224.8
Total Australian Mining Operations 667.6 553.7
Trading and Brokerage Operations 20.1 15.0
Other 40.3 20.3
Total $1,462.7 $1,326.2
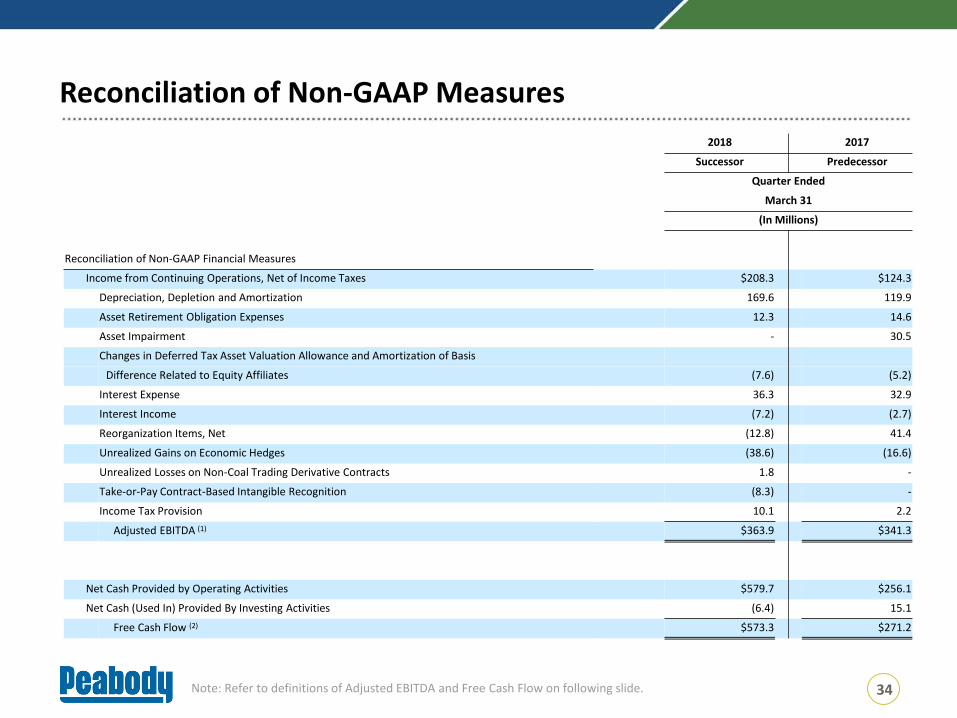
Reconciliation of Non-GAAP Measures
34Note: Refer to definitions of Adjusted EBITDA and Free Cash Flow on following slide.
2018 2017
Successor Predecessor
Quarter Ended
March 31
(In Millions)
Reconciliation of Non-GAAP Financial Measures
Income from Continuing Operations, Net of Income Taxes $208.3 $124.3
Depreciation, Depletion and Amortization 169.6 119.9
Asset Retirement Obligation Expenses 12.3 14.6
Asset Impairment - 30.5
Changes in Deferred Tax Asset Valuation Allowance and Amortization of Basis
Difference Related to Equity Affiliates (7.6) (5.2)
Interest Expense 36.3 32.9
Interest Income (7.2) (2.7)
Reorganization Items, Net (12.8) 41.4
Unrealized Gains on Economic Hedges (38.6) (16.6)
Unrealized Losses on Non-Coal Trading Derivative Contracts 1.8 -
Take-or-Pay Contract-Based Intangible Recognition (8.3) -
Income Tax Provision 10.1 2.2
Adjusted EBITDA (1) $363.9 $341.3
Net Cash Provided by Operating Activities $579.7 $256.1
Net Cash (Used In) Provided By Investing Activities (6.4) 15.1
Free Cash Flow (2) $573.3 $271.2
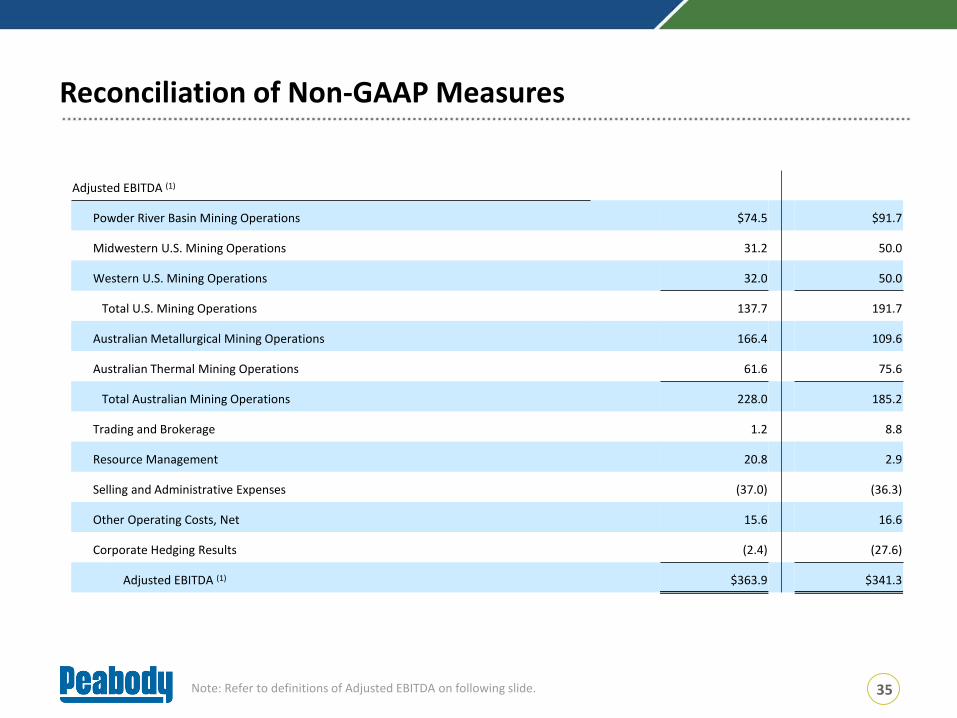
Reconciliation of Non-GAAP Measures
35Note: Refer to definitions of Adjusted EBITDA on following slide.
Adjusted EBITDA (1)
Powder River Basin Mining Operations $74.5 $91.7
Midwestern U.S. Mining Operations 31.2 50.0
Western U.S. Mining Operations 32.0 50.0
Total U.S. Mining Operations 137.7 191.7
Australian Metallurgical Mining Operations 166.4 109.6
Australian Thermal Mining Operations 61.6 75.6
Total Australian Mining Operations 228.0 185.2
Trading and Brokerage 1.2 8.8
Resource Management 20.8 2.9
Selling and Administrative Expenses (37.0) (36.3)
Other Operating Costs, Net 15.6 16.6
Corporate Hedging Results (2.4) (27.6)
Adjusted EBITDA (1) $363.9 $341.3
Reconciliation of Non-GAAP Measures: Definitions
36
1 Adjusted EBITDA is a non-GAAP measure defined as income (loss) from continuing operations before deducting net interest expense, income taxes, asset retirement obligation expenses, depreciation, depletion and amortization and reorganization items, net. Adjusted EBITDA is also adjusted for the discrete items that management excluded in analyzing the segments' operating performance as displayed in the reconciliation. Adjusted EBITDA is used by management as one of the primary metricsto measure our operating performance. Management also believes non-GAAP performance measures are used by investors to measure our operating performance and lenders to measure our ability to incur and service debt. Adjusted EBITDA is not intended to serve as an alternative to U.S. GAAP measures of performance and may not be comparable to similarly-titled measures presented by other companies.
2 Free Cash Flow is a non-GAAP measure defined as net cash provided by operating activities less net cash (used in) provided by investing activities. Free Cash Flow is used by management as a measure of our financial performance and our ability to generateexcess cash flow from our business operations. Free Cash Flow is not intended to serve as an alternative to U.S. GAAP measures of performance and may not be comparable to similarly-titled measures presented by other companies.
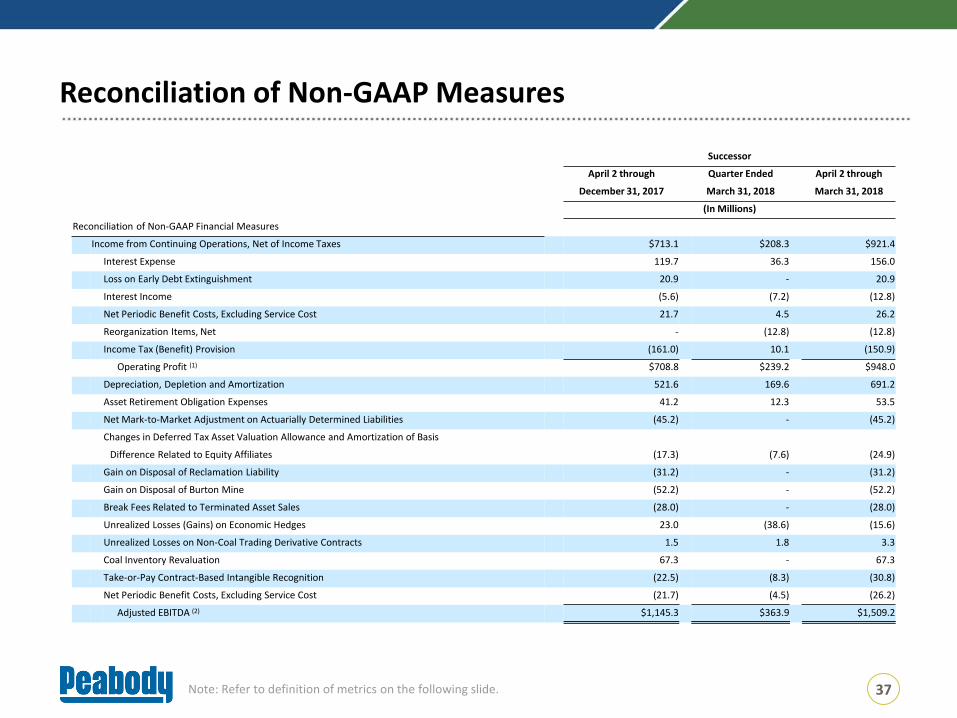
Reconciliation of Non-GAAP Measures
37Note: Refer to definition of metrics on the following slide.
Successor
April 2 through Quarter Ended April 2 through
December 31, 2017 March 31, 2018 March 31, 2018
(In Millions)
Reconciliation of Non-GAAP Financial Measures
Income from Continuing Operations, Net of Income Taxes $713.1 $208.3 $921.4
Interest Expense 119.7 36.3 156.0
Loss on Early Debt Extinguishment 20.9 - 20.9
Interest Income (5.6) (7.2) (12.8)
Net Periodic Benefit Costs, Excluding Service Cost 21.7 4.5 26.2
Reorganization Items, Net - (12.8) (12.8)
Income Tax (Benefit) Provision (161.0) 10.1 (150.9)
Operating Profit (1) $708.8 $239.2 $948.0
Depreciation, Depletion and Amortization 521.6 169.6 691.2
Asset Retirement Obligation Expenses 41.2 12.3 53.5
Net Mark-to-Market Adjustment on Actuarially Determined Liabilities (45.2) - (45.2)
Changes in Deferred Tax Asset Valuation Allowance and Amortization of Basis
Difference Related to Equity Affiliates (17.3) (7.6) (24.9)
Gain on Disposal of Reclamation Liability (31.2) - (31.2)
Gain on Disposal of Burton Mine (52.2) - (52.2)
Break Fees Related to Terminated Asset Sales (28.0) - (28.0)
Unrealized Losses (Gains) on Economic Hedges 23.0 (38.6) (15.6)
Unrealized Losses on Non-Coal Trading Derivative Contracts 1.5 1.8 3.3
Coal Inventory Revaluation 67.3 - 67.3
Take-or-Pay Contract-Based Intangible Recognition (22.5) (8.3) (30.8)
Net Periodic Benefit Costs, Excluding Service Cost (21.7) (4.5) (26.2)
Adjusted EBITDA (2) $1,145.3 $363.9 $1,509.2
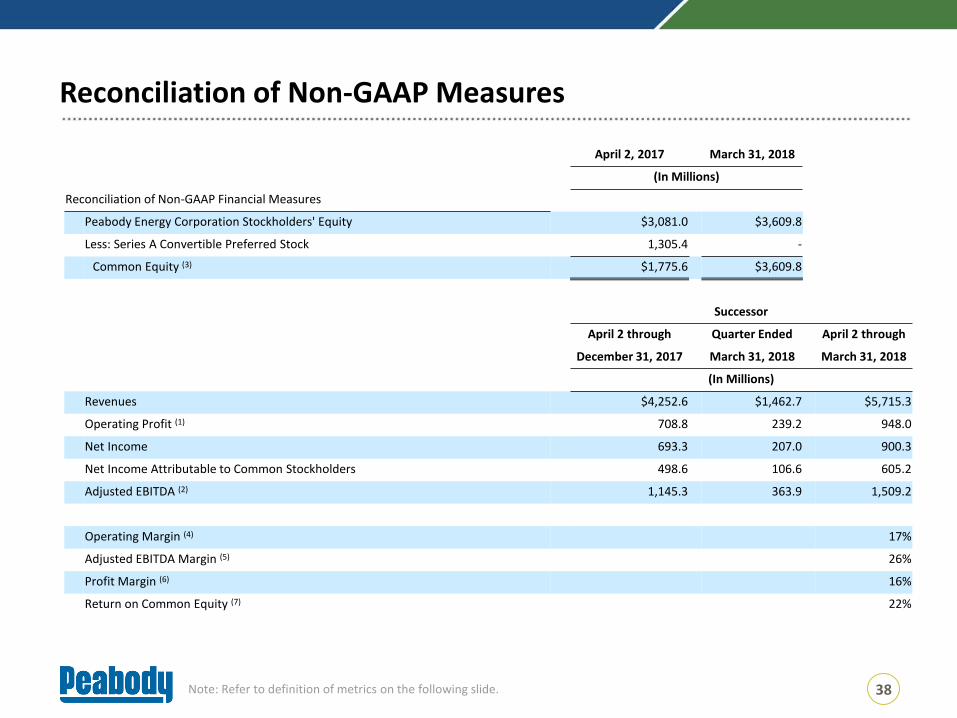
Reconciliation of Non-GAAP Measures
38Note: Refer to definition of metrics on the following slide.
April 2, 2017 March 31, 2018
(In Millions)
Reconciliation of Non-GAAP Financial Measures
Peabody Energy Corporation Stockholders' Equity $3,081.0 $3,609.8
Less: Series A Convertible Preferred Stock 1,305.4 -
Common Equity (3) $1,775.6 $3,609.8
Successor
April 2 through Quarter Ended April 2 through
December 31, 2017 March 31, 2018 March 31, 2018
(In Millions)
Revenues $4,252.6 $1,462.7 $5,715.3
Operating Profit (1) 708.8 239.2 948.0
Net Income 693.3 207.0 900.3
Net Income Attributable to Common Stockholders 498.6 106.6 605.2
Adjusted EBITDA (2) 1,145.3 363.9 1,509.2
Operating Margin (4) 17%
Adjusted EBITDA Margin (5) 26%
Profit Margin (6) 16%
Return on Common Equity (7) 22%
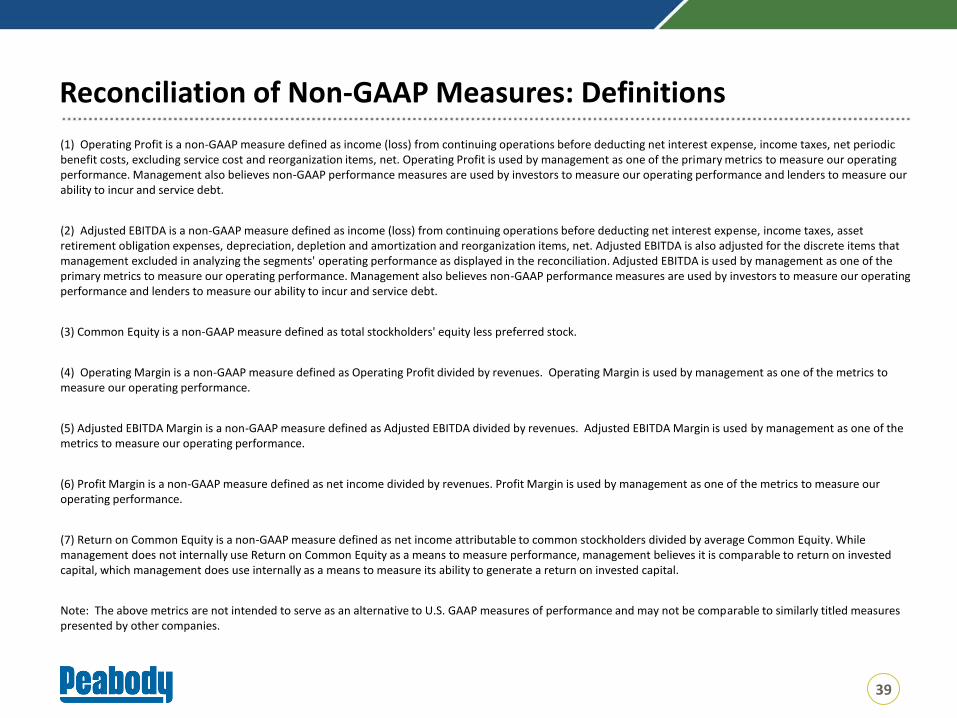
Reconciliation of Non-GAAP Measures: Definitions
39
(1) Operating Profit is a non-GAAP measure defined as income (loss) from continuing operations before deducting net interest expense, income taxes, net periodic benefit costs, excluding service cost and reorganization items, net. Operating Profit is used by management as one of the primary metrics to measure our operating performance. Management also believes non-GAAP performance measures are used by investors to measure our operating performance and lenders to measure our ability to incur and service debt.
(2) Adjusted EBITDA is a non-GAAP measure defined as income (loss) from continuing operations before deducting net interest expense, income taxes, asset retirement obligation expenses, depreciation, depletion and amortization and reorganization items, net. Adjusted EBITDA is also adjusted for the discrete items that management excluded in analyzing the segments' operating performance as displayed in the reconciliation. Adjusted EBITDA is used by management as one of the primary metrics to measure our operating performance. Management also believes non-GAAP performance measures are used by investors to measure our operating performance and lenders to measure our ability to incur and service debt.
(3) Common Equity is a non-GAAP measure defined as total stockholders' equity less preferred stock.
(4) Operating Margin is a non-GAAP measure defined as Operating Profit divided by revenues. Operating Margin is used by management as one of the metrics to measure our operating performance.
(5) Adjusted EBITDA Margin is a non-GAAP measure defined as Adjusted EBITDA divided by revenues. Adjusted EBITDA Margin is used by management as one of the metrics to measure our operating performance.
(6) Profit Margin is a non-GAAP measure defined as net income divided by revenues. Profit Margin is used by management as one of the metrics to measure our operating performance.
(7) Return on Common Equity is a non-GAAP measure defined as net income attributable to common stockholders divided by average Common Equity. While management does not internally use Return on Common Equity as a means to measure performance, management believes it is comparable to return on invested capital, which management does use internally as a means to measure its ability to generate a return on invested capital.
Note: The above metrics are not intended to serve as an alternative to U.S. GAAP measures of performance and may not be comparable to similarly titled measures presented by other companies.
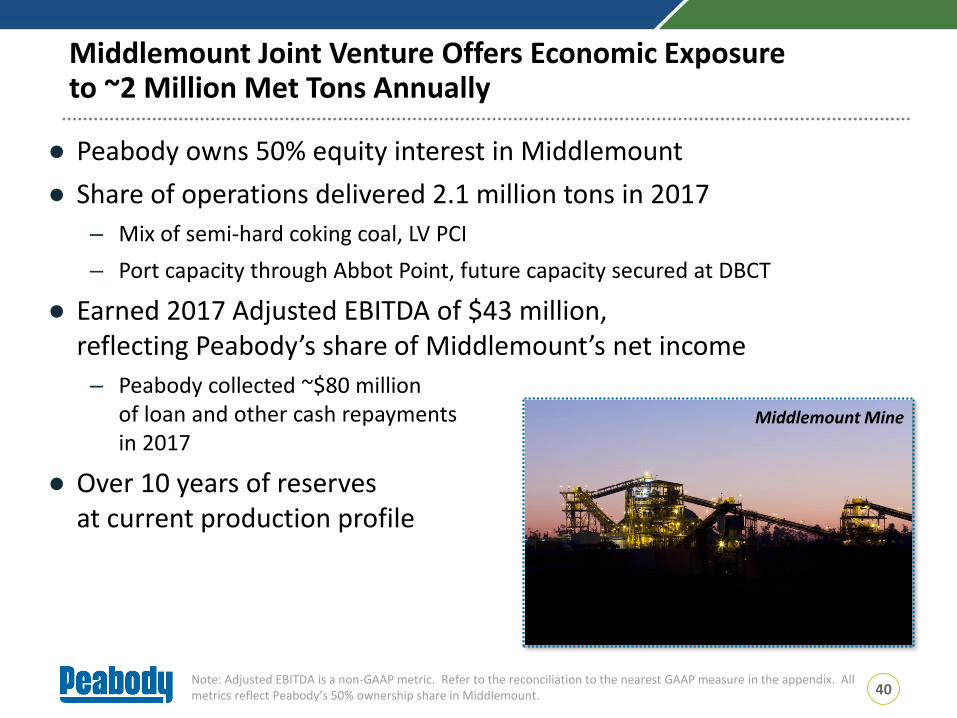
● Peabody owns 50% equity interest in Middlemount
● Share of operations delivered 2.1 million tons in 2017
– Mix of semi-hard coking coal, LV PCI
– Port capacity through Abbot Point, future capacity secured at DBCT
● Earned 2017 Adjusted EBITDA of $43 million, reflecting Peabody’s share of Middlemount’s net income
– Peabody collected ~$80 million of loan and other cash repayments in 2017
● Over 10 years of reserves at current production profile
Middlemount Mine
Note: Adjusted EBITDA is a non-GAAP metric. Refer to the reconciliation to the nearest GAAP measure in the appendix. All metrics reflect Peabody’s 50% ownership share in Middlemount.
Middlemount Joint Venture Offers Economic Exposureto ~2 Million Met Tons Annually
40
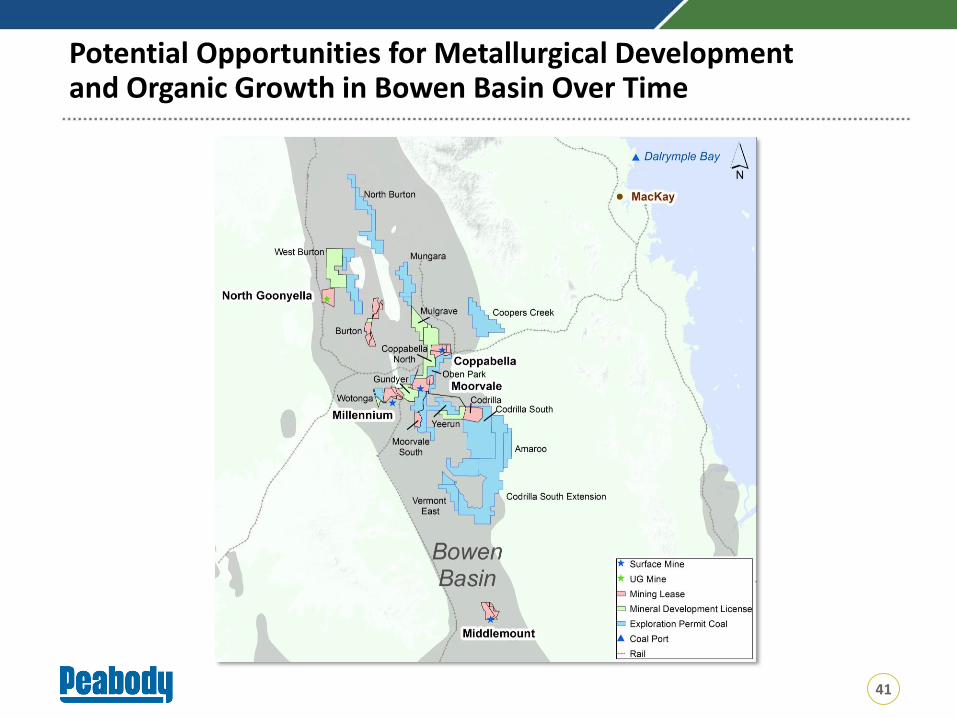
Potential Opportunities for Metallurgical Development and Organic Growth in Bowen Basin Over Time
41
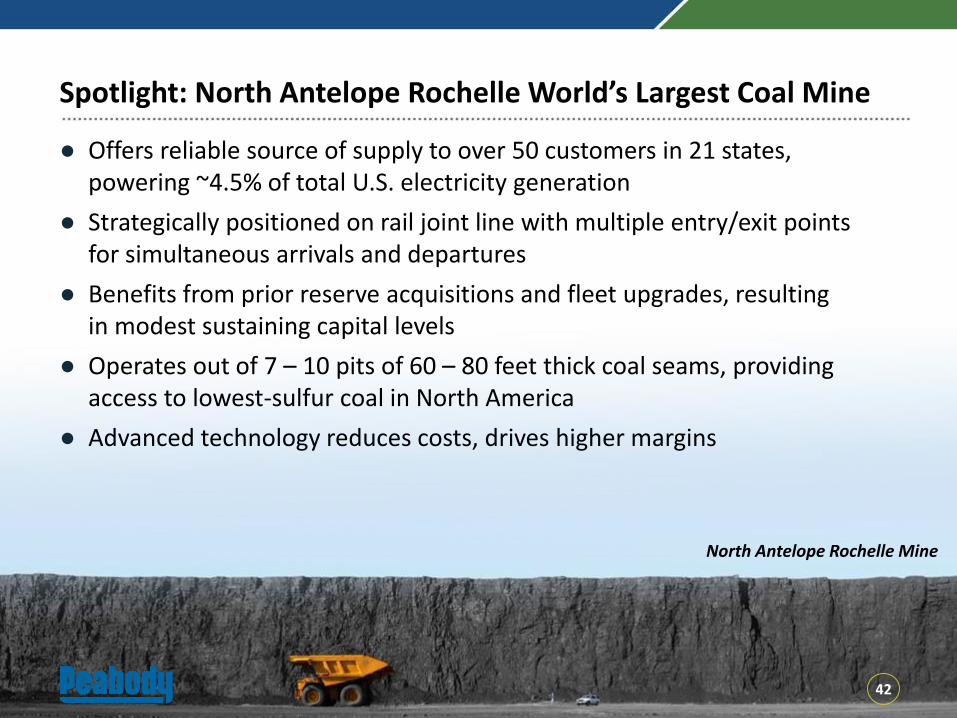
Spotlight: North Antelope Rochelle World’s Largest Coal Mine
● Offers reliable source of supply to over 50 customers in 21 states, powering ~4.5% of total U.S. electricity generation
● Strategically positioned on rail joint line with multiple entry/exit points for simultaneous arrivals and departures
● Benefits from prior reserve acquisitions and fleet upgrades, resulting in modest sustaining capital levels
● Operates out of 7 – 10 pits of 60 – 80 feet thick coal seams, providing access to lowest-sulfur coal in North America
● Advanced technology reduces costs, drives higher margins
North Antelope Rochelle Mine
42
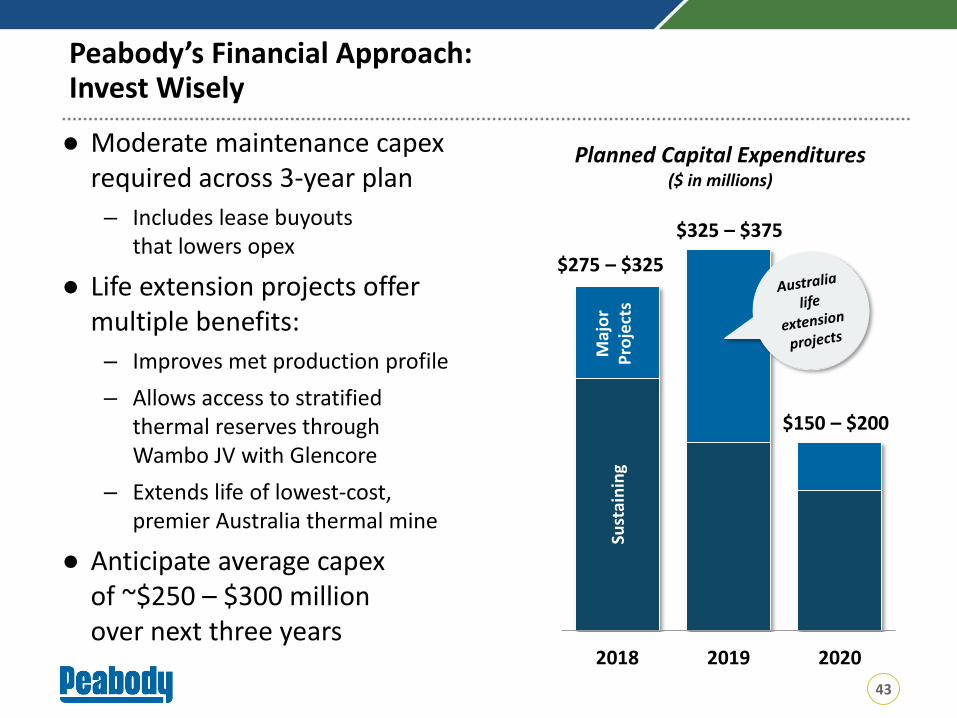
● Moderate maintenance capex required across 3-year plan
– Includes lease buyouts that lowers opex
● Life extension projects offer multiple benefits:
– Improves met production profile
– Allows access to stratified thermal reserves through Wambo JV with Glencore
– Extends life of lowest-cost, premier Australia thermal mine
● Anticipate average capex of ~$250 – $300 million over next three years
Sust
ain
ing
2018 2019 2020
$275 – $325
$325 – $375
$150 – $200
Planned Capital Expenditures ($ in millions)
Maj
or
Pro
ject
s
Peabody’s Financial Approach: Invest Wisely
43
Equity holders
44
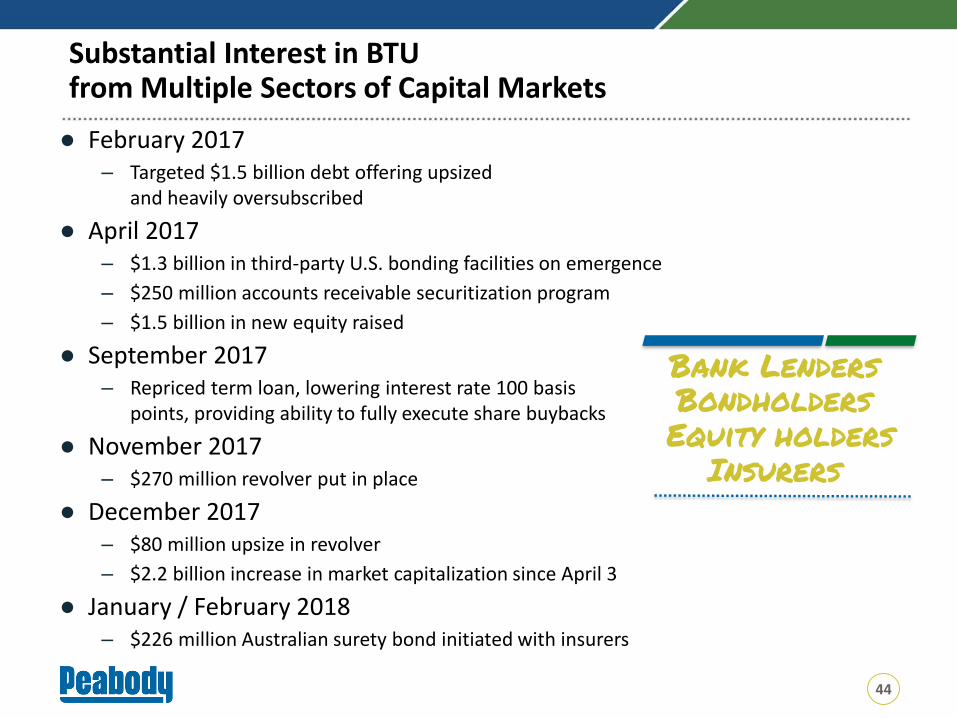
● February 2017– Targeted $1.5 billion debt offering upsized
and heavily oversubscribed
● April 2017– $1.3 billion in third-party U.S. bonding facilities on emergence
– $250 million accounts receivable securitization program
– $1.5 billion in new equity raised
● September 2017– Repriced term loan, lowering interest rate 100 basis
points, providing ability to fully execute share buybacks
● November 2017– $270 million revolver put in place
● December 2017– $80 million upsize in revolver
– $2.2 billion increase in market capitalization since April 3
● January / February 2018 – $226 million Australian surety bond initiated with insurers
Bank Lenders
Bondholders
Insurers
Substantial Interest in BTU from Multiple Sectors of Capital Markets
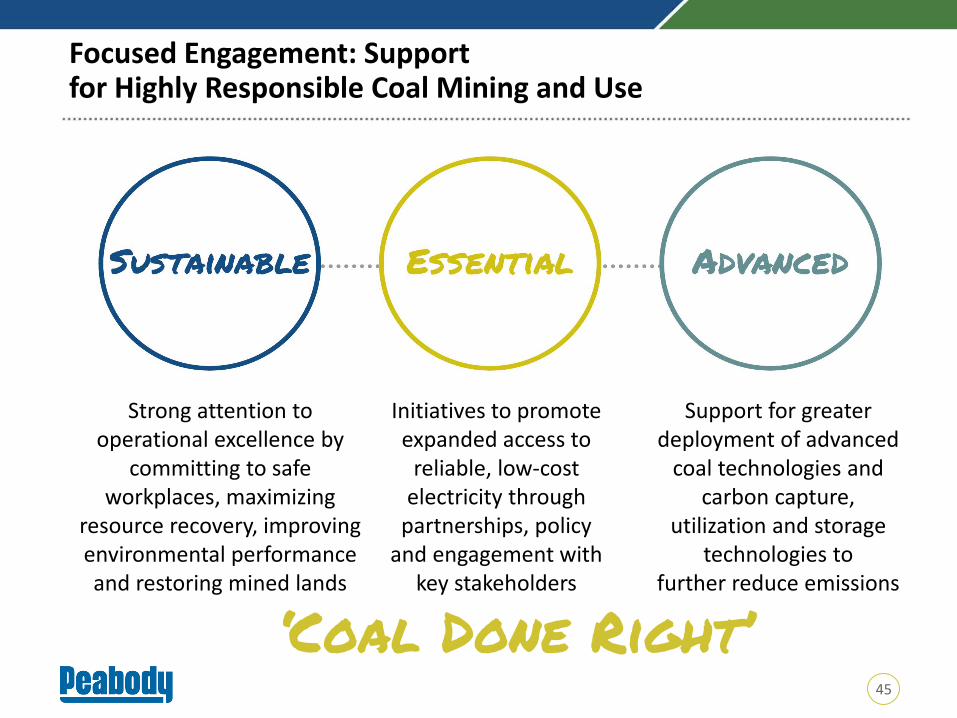
45
Strong attention to operational excellence by
committing to safe workplaces, maximizing
resource recovery, improving environmental performance and restoring mined lands
Initiatives to promote expanded access to
reliable, low-cost electricity through
partnerships, policy and engagement with
key stakeholders
Support for greaterdeployment of advanced
coal technologies andcarbon capture,
utilization and storage technologies to
further reduce emissions
‘Coal Done Right’
Focused Engagement: Support for Highly Responsible Coal Mining and Use