Embed Size (px)
Citation preview
Al Monaco, Chief Executive Officer | John Whelen, Chief Financial Officer
May 10, 2018
Q1 2018: Financial Results & Business Update
Legal Notice
Forward Looking Information This presentation includes certain forward looking statements and information (FLI) to provide potential investors, shareholders and unitholders of Enbridge Inc. (Enbridge or the Company), Enbridge Income Fund Holdings Inc. (ENF), Enbridge Energy Partners, L.P. (EEP) and Spectra Energy Partners, LP (SEP) with information about Enbridge, ENF, EEP, SEP and their respective subsidiaries and affiliates, including management’s assessment of their future plans and operations, which FLI may not be appropriate for other purposes. FLI is typically identified by words such as “anticipate”, “expect”, “project”, “estimate”, “forecast”, “plan”, “intend”, “target”, “believe”, “likely” and similar words suggesting future outcomes or statements regarding an outlook. All statements other than statements of historical fact may be FLI. In particular, this presentation contains FLI pertaining to, but not limited to, information with respect to the following: 2018 and future year strategic priorities and guidance; expected EBITDA or expected adjusted EBITDA; expected DCF and DCF/share; expected future debt/EBITDA; future financing options; expectations on sources and uses of funds and sufficiency of financial resources; secured growth projects and future growth, development and expansion program and opportunities; expected closing of announced dispositions and the timing thereof; future asset sales or other monetization transactions; distribution coverage; dividend and distribution growth and dividend and distribution payout expectations; expected impact of tax reform and FERC tax-related matters, including sponsored vehicle impacts; foreign exchange hedges; project execution, including capital costs, expected construction and in service dates and regulatory approvals; and system throughput, capacity and expansions.
Although we believe that the FLI is reasonable based on the information available today and processes used to prepare it, such statements are not guarantees of future performance and you are cautioned against placing undue reliance on FLI. By its nature, FLI involves a variety of assumptions, which are based upon factors that may be difficult to predict and that may involve known and unknown risks and uncertainties and other factors which may cause actual results, levels of activity and achievements to differ materially from those expressed or implied by the FLI, including, but not limited to, the following: the expected supply of, demand for and prices of crude oil, natural gas, natural gas liquids and renewable energy; exchange rates; inflation; interest rates; availability and price of labour and construction materials; operational reliability and performance; customer and regulatory approvals; maintenance of support and regulatory approvals for the projects; anticipated in-service dates; weather; governmental legislation; announced and potential dispositions and the timing and impact thereof; impact of capital project execution on the Company’s future cash flows; credit ratings; capital project funding; expected EBITDA or expected adjusted EBITDA; expected future cash flows and expected future DCF and DCF per share; estimated future dividends and distributions; financial strength and flexibility; debt and equity market conditions, including the ability to access capital markets on favourable terms or at all; cost of debt and equity capital; economic and competitive conditions; changes in tax laws and tax rates; and changes in trade agreements. We caution that the foregoing list of factors is not exhaustive. Additional information about these and other assumptions, risks and uncertainties can be found in applicable filings with Canadian and U.S. securities regulators (including the most recently filed Form 10-K and any subsequently filed Form 10-Q, as applicable). Due to the interdependencies and correlation of these factors, as well as other factors, the impact of any one assumption, risk or uncertainty on FLI cannot be determined with certainty.
Except to the extent required by applicable law, we assume no obligation to publicly update or revise any FLI made in this presentation or otherwise, whether as a result of new information, future events or otherwise. All FLI in this presentation and all subsequent FLI, whether written or oral, attributable to Enbridge, ENF, EEP or SEP, or persons acting on their behalf, are expressly qualified in its entirety by these cautionary statements.
Non-GAAP Measures This presentation makes reference to non-GAAP measures, including adjusted earnings before interest, income taxes, depreciation and amortization (EBITDA), ongoing EBITDA; distributable cash flow (DCF), ongoing DCF and DCF per share. Adjusted EBITDA represents EBITDA adjusted for unusual, non-recurring or non-operating factors on both a consolidated and segmented basis. Management uses adjusted EBITDA to set targets and to assess the performance. DCF is defined as cash flow provided by operating activities before changes in operating assets and liabilities (including changes in environmental liabilities) less distributions to noncontrolling interests and redeemable noncontrolling interests, preference share dividends and maintenance capital expenditures, and further adjusted for unusual, non-recurring or non-operating factors. Management also uses DCF to assess the performance and to set its dividend or distribution payout target. Management believes the presentation of these measures gives useful information to investors, shareholders and unitholders as they provide increased transparency and insight into the performance of Enbridge, ENF, EEP and SEP. Reconciliations of forward looking non-GAAP financial measures to comparable GAAP measures are not available due to the challenges and impracticability with estimating some of the items, particularly with estimates for certain contingent liabilities, and estimating non-cash unrealized derivative fair value losses and gains and ineffectiveness on hedges which are subject to market variability and therefore a reconciliation is not available without unreasonable effort.
These measures are not measures that have a standardized meaning prescribed by generally accepted accounting principles in the United States of America (U.S. GAAP) and may not be comparable with similar measures presented by other issuers. A reconciliation of non-GAAP measures to the most directly comparable GAAP measures is available on the applicable entity’s website. Additional information on non-GAAP measures may be found in the earnings news releases or additional information on the applicable entity’s website, www.sedar.com or www.sec.gov.
2

Agenda
3
• First Quarter Highlights • Business Update • Financial Results Review
Line 3 Replacement
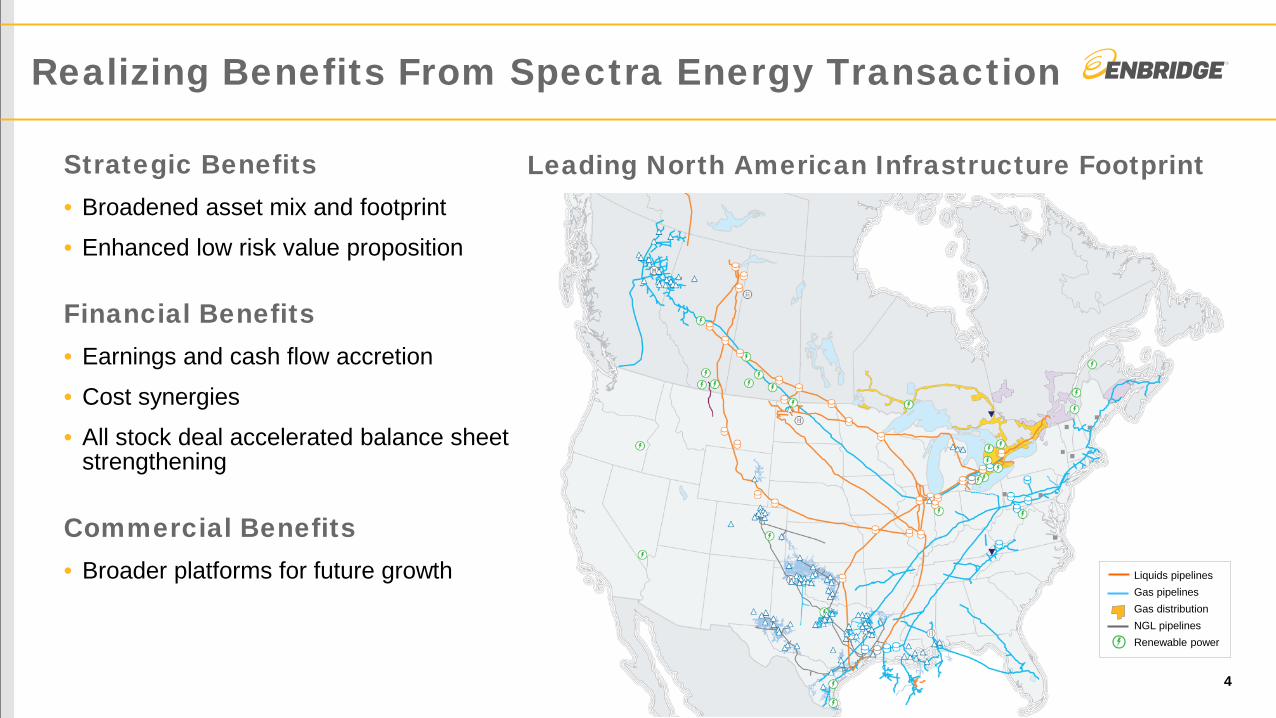
Realizing Benefits From Spectra Energy Transaction
4
Strategic Benefits • Broadened asset mix and footprint
• Enhanced low risk value proposition
Financial Benefits • Earnings and cash flow accretion
• Cost synergies
• All stock deal accelerated balance sheet strengthening
Commercial Benefits • Broader platforms for future growth
Leading North American Infrastructure Footprint
Liquids pipelines Gas pipelines Gas distribution NGL pipelines Renewable power

Solid operating performance across the businesses
Strong Q1 financial results
$3.2 billion of asset sales announced
$3.1 billion of hybrid security issuances
Advancing $7 billion of projects for 2018 in-service
Progressing Line 3 Replacement regulatory process
Assessing new project opportunities
Q1 Highlights
5 Sabal Trail – fully restored right of way L3 Replacement project
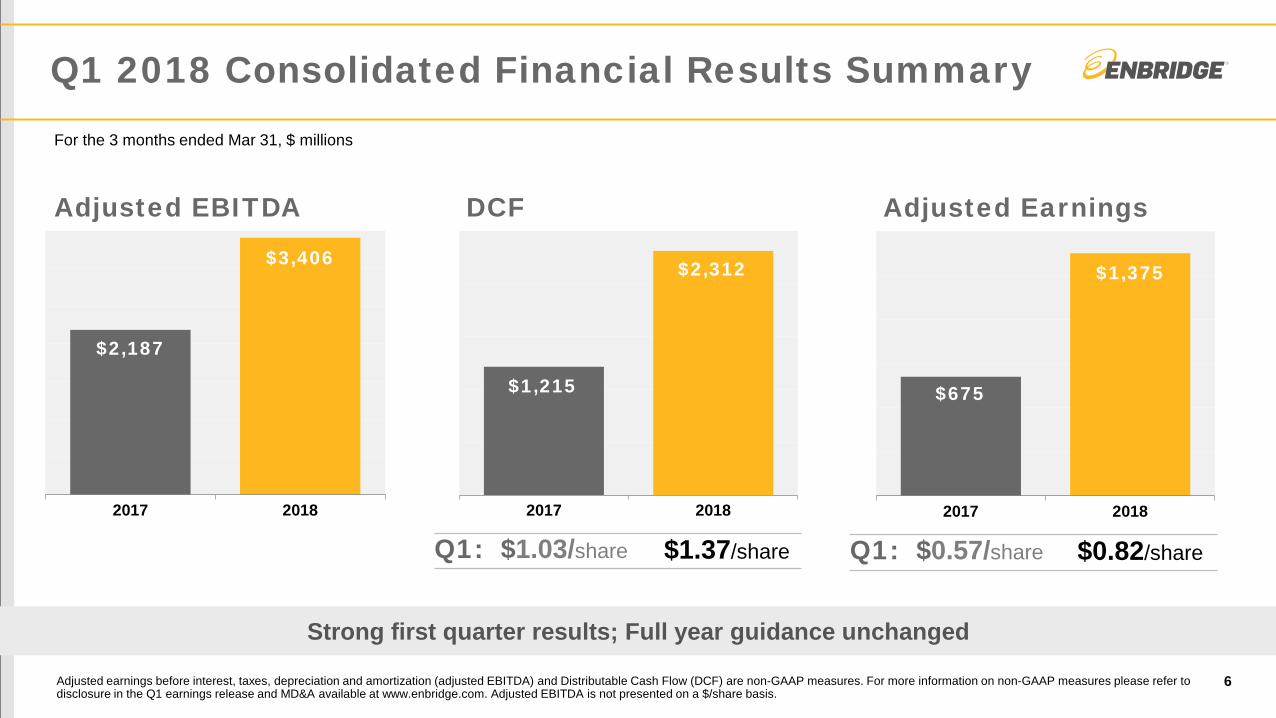
2017 2018
$2,187
$3,406
2017 2018
$675
$1,375
2017 2018
$1,215
$2,312
Q1 2018 Consolidated Financial Results Summary
6 Adjusted earnings before interest, taxes, depreciation and amortization (adjusted EBITDA) and Distributable Cash Flow (DCF) are non-GAAP measures. For more information on non-GAAP measures please refer to disclosure in the Q1 earnings release and MD&A available at www.enbridge.com. Adjusted EBITDA is not presented on a $/share basis.
Q1: $1.03/share $1.37/share
Adjusted EBITDA DCF
Strong first quarter results; Full year guidance unchanged
Adjusted Earnings
Q1: $0.57/share $0.82/share
For the 3 months ended Mar 31, $ millions
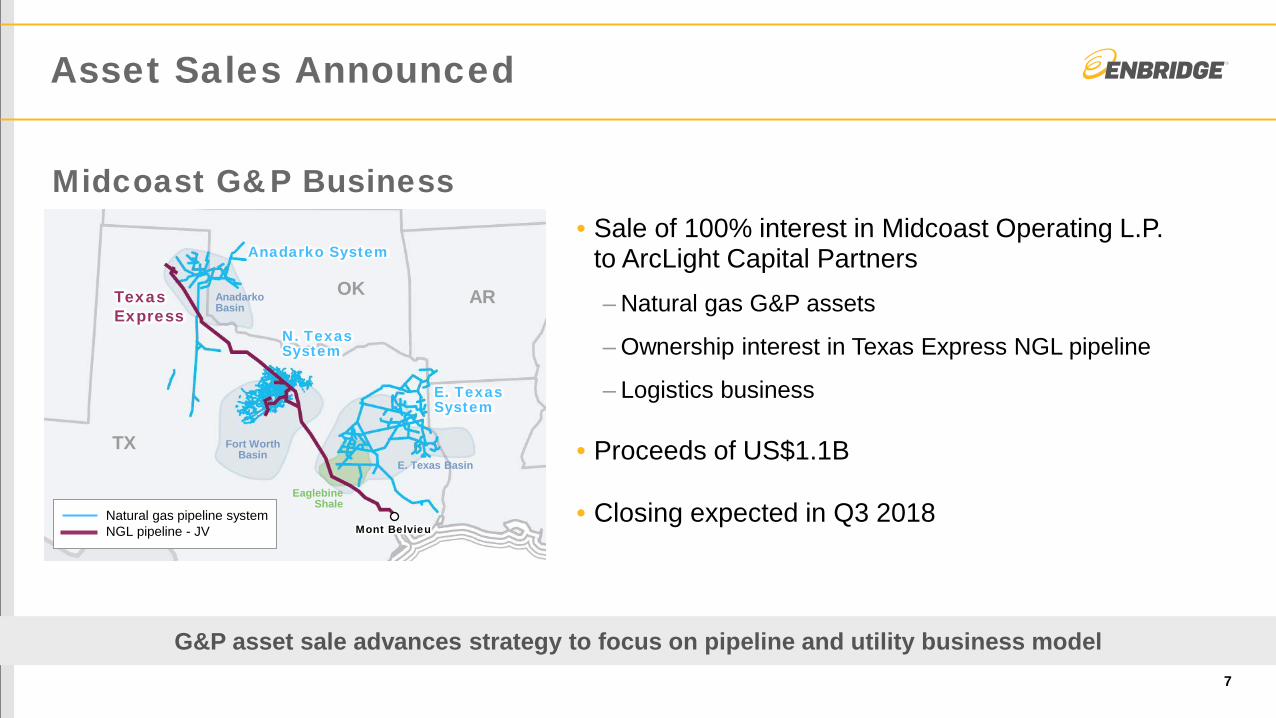
Asset Sales Announced
7
G&P asset sale advances strategy to focus on pipeline and utility business model
• Sale of 100% interest in Midcoast Operating L.P. to ArcLight Capital Partners – Natural gas G&P assets
– Ownership interest in Texas Express NGL pipeline
– Logistics business
• Proceeds of US$1.1B
• Closing expected in Q3 2018
Midcoast G&P Business
Anadarko System
N. Texas System
E. Texas System
Texas Express
Anadarko Basin
Fort Worth Basin
E. Texas Basin
Eaglebine Shale
Mont Belvieu Natural gas pipeline system NGL pipeline - JV
TX
OK AR

Asset Sales Announced
8
Reliable alternative source of capital for future investment
• Sale of 49% interest to Canada Pension Plan: – All Canadian and select US wind and solar power assets
– Hohe See offshore wind project in Germany
• Proceeds of C$1.75B
• CPP provides ~C$0.5B of additional funding contributions to Hohe See in 2018/19
• Closing expected in Q3 2018
Renewables Power Assets
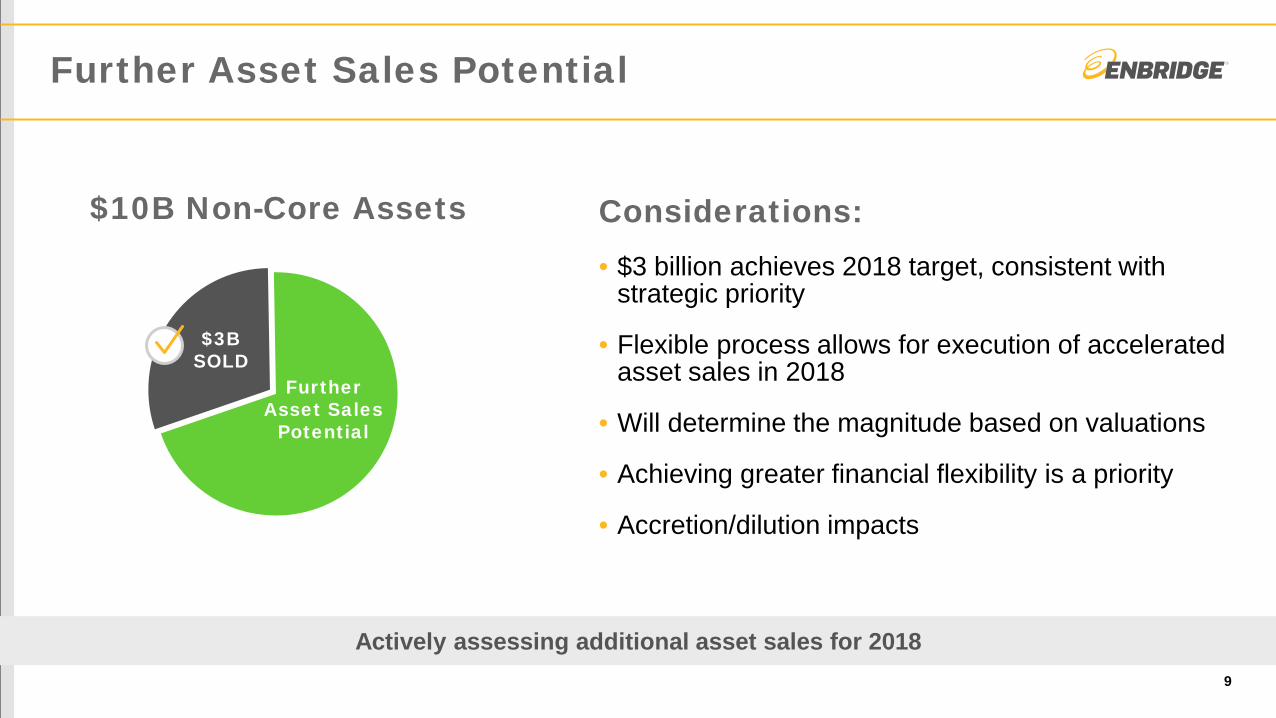
Further Asset Sales Potential
9
Actively assessing additional asset sales for 2018
Considerations: • $3 billion achieves 2018 target, consistent with
strategic priority
• Flexible process allows for execution of accelerated asset sales in 2018
• Will determine the magnitude based on valuations
• Achieving greater financial flexibility is a priority
• Accretion/dilution impacts
Further Asset Sales
Potential
$3B SOLD
$10B Non-Core Assets
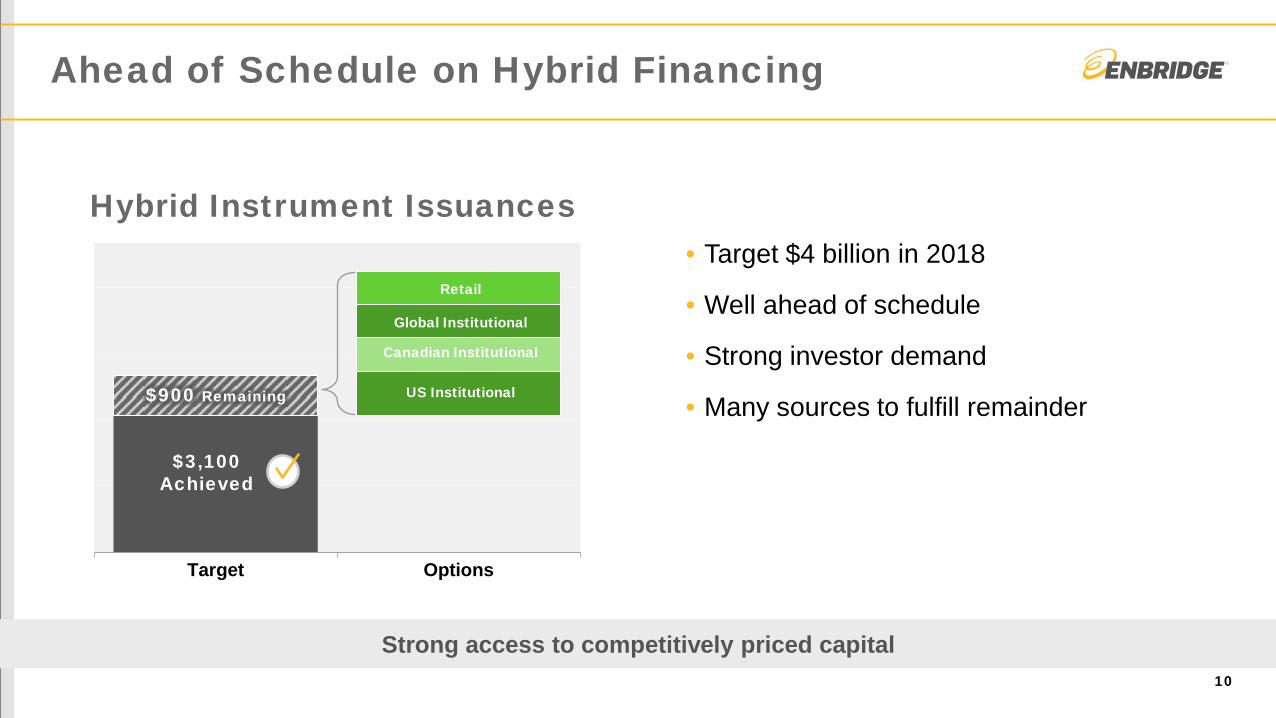
Ahead of Schedule on Hybrid Financing
10
Strong access to competitively priced capital
• Target $4 billion in 2018
• Well ahead of schedule
• Strong investor demand
• Many sources to fulfill remainder
Target Options
$3,100 Achieved
$900 Remaining US Institutional
Global Institutional
Canadian Institutional
Retail
Hybrid Instrument Issuances
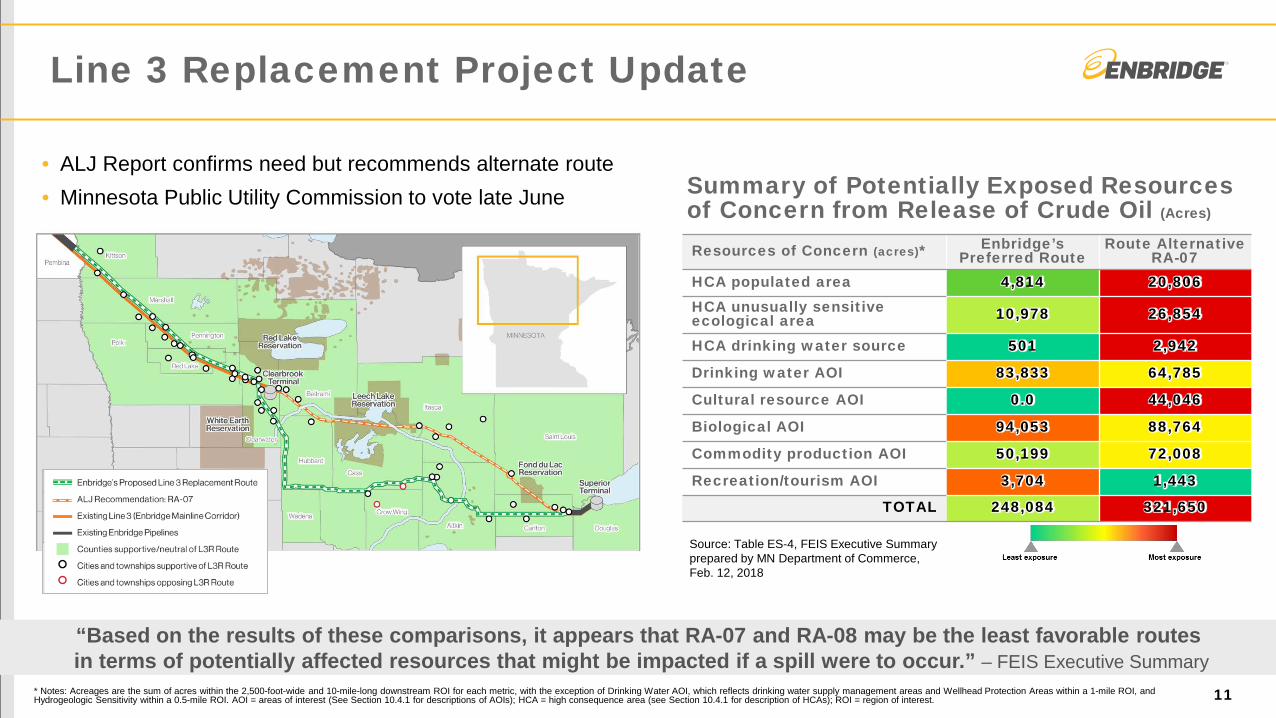
Line 3 Replacement Project Update
11
“Based on the results of these comparisons, it appears that RA-07 and RA-08 may be the least favorable routes in terms of potentially affected resources that might be impacted if a spill were to occur.” – FEIS Executive Summary
Resources of Concern (acres)* Enbridge’s Preferred Route
Route Alternative RA-07
HCA populated area 4,814 20,806 HCA unusually sensitive ecological area 10,978 26,854
HCA drinking water source 501 2,942
Drinking water AOI 83,833 64,785
Cultural resource AOI 0.0 44,046
Biological AOI 94,053 88,764
Commodity production AOI 50,199 72,008
Recreation/tourism AOI 3,704 1,443
TOTAL 248,084 321,650
Summary of Potentially Exposed Resources of Concern from Release of Crude Oil (Acres)
• ALJ Report confirms need but recommends alternate route • Minnesota Public Utility Commission to vote late June
* Notes: Acreages are the sum of acres within the 2,500-foot-wide and 10-mile-long downstream ROI for each metric, with the exception of Drinking Water AOI, which reflects drinking water supply management areas and Wellhead Protection Areas within a 1-mile ROI, and Hydrogeologic Sensitivity within a 0.5-mile ROI. AOI = areas of interest (See Section 10.4.1 for descriptions of AOIs); HCA = high consequence area (see Section 10.4.1 for description of HCAs); ROI = region of interest.
Source: Table ES-4, FEIS Executive Summary prepared by MN Department of Commerce, Feb. 12, 2018
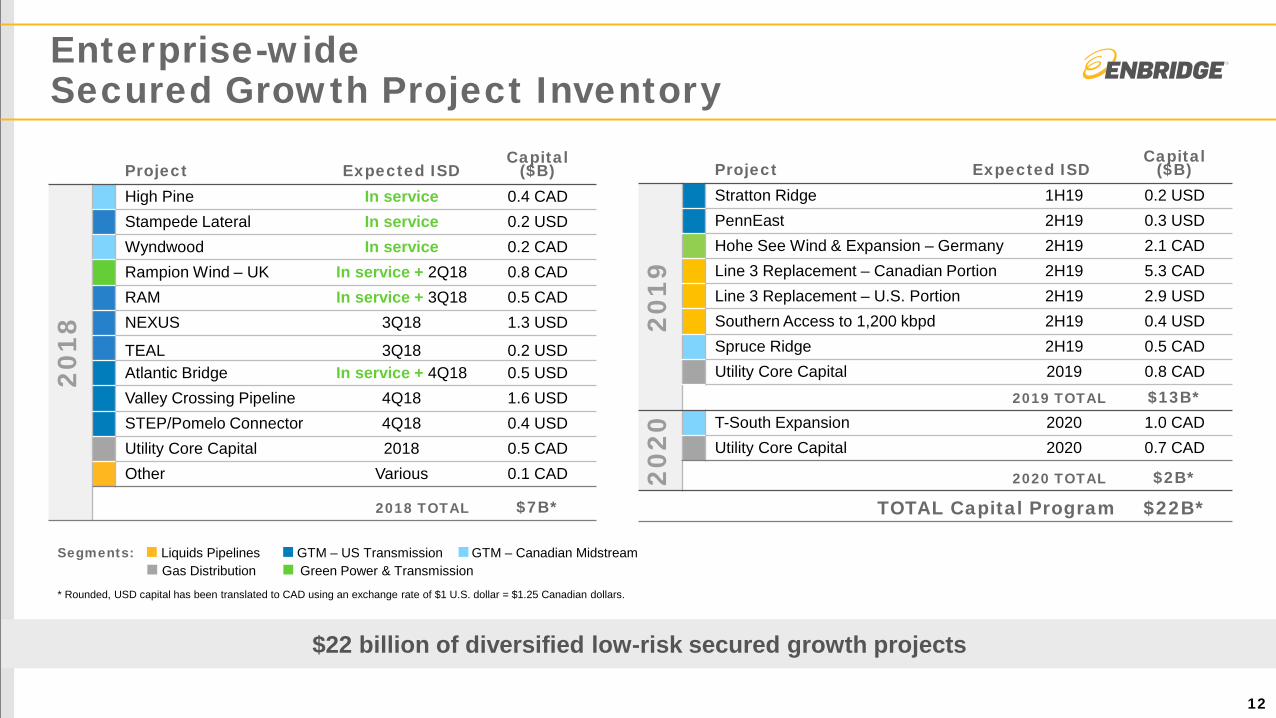
Enterprise-wide Secured Growth Project Inventory
12
Segments: Liquids Pipelines GTM – US Transmission GTM – Canadian Midstream Gas Distribution Green Power & Transmission
Project Expected ISD Capital
($B)
2019
Stratton Ridge 1H19 0.2 USD PennEast 2H19 0.3 USD Hohe See Wind & Expansion – Germany 2H19 2.1 CAD Line 3 Replacement – Canadian Portion 2H19 5.3 CAD Line 3 Replacement – U.S. Portion 2H19 2.9 USD Southern Access to 1,200 kbpd 2H19 0.4 USD Spruce Ridge 2H19 0.5 CAD Utility Core Capital 2019 0.8 CAD
2019 TOTAL $13B*
2020
T-South Expansion 2020 1.0 CAD Utility Core Capital 2020 0.7 CAD
2020 TOTAL $2B*
TOTAL Capital Program $22B*
* Rounded, USD capital has been translated to CAD using an exchange rate of $1 U.S. dollar = $1.25 Canadian dollars.
Project Expected ISD Capital
($B)
2018
High Pine In service 0.4 CAD Stampede Lateral In service 0.2 USD Wyndwood In service 0.2 CAD Rampion Wind – UK In service + 2Q18 0.8 CAD RAM In service + 3Q18 0.5 CAD NEXUS 3Q18 1.3 USD
TEAL 3Q18 0.2 USD Atlantic Bridge In service + 4Q18 0.5 USD Valley Crossing Pipeline 4Q18 1.6 USD STEP/Pomelo Connector 4Q18 0.4 USD Utility Core Capital 2018 0.5 CAD Other Various 0.1 CAD
2018 TOTAL $7B*
$22 billion of diversified low-risk secured growth projects
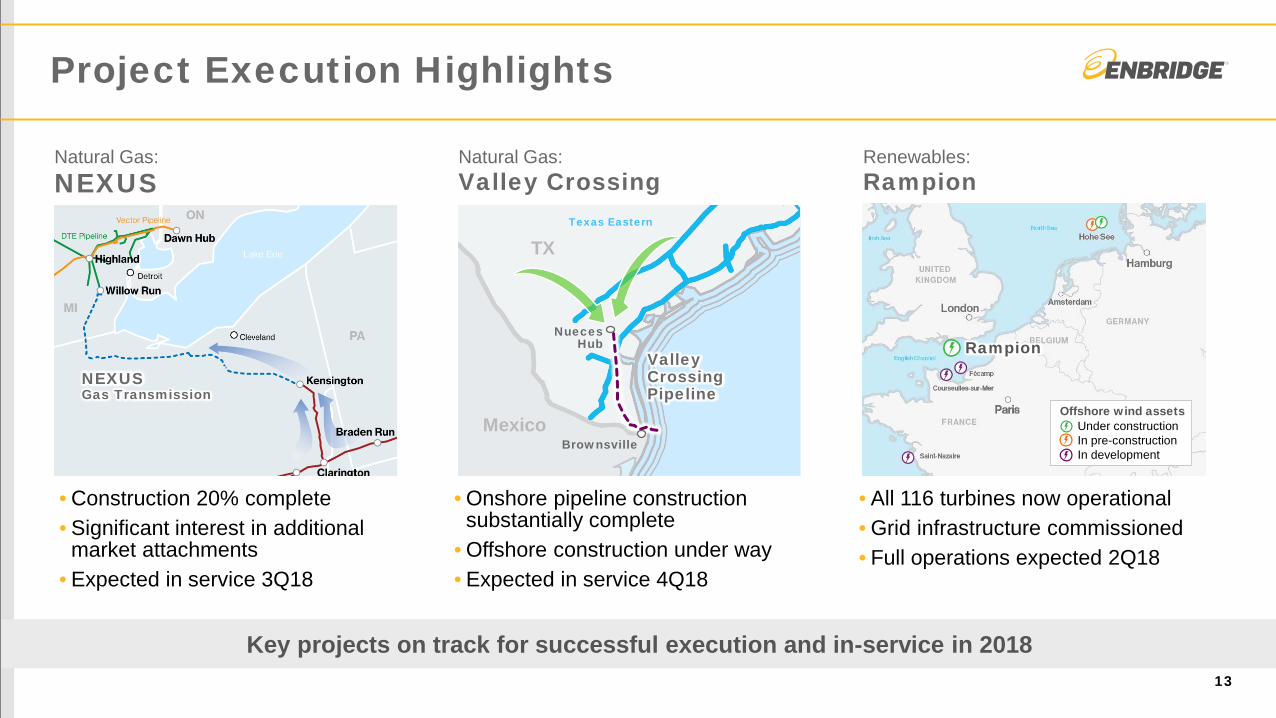
Project Execution Highlights
13
Natural Gas: NEXUS
Natural Gas: Valley Crossing
Renewables: Rampion
• Construction 20% complete • Significant interest in additional
market attachments • Expected in service 3Q18
• Onshore pipeline construction substantially complete
• Offshore construction under way • Expected in service 4Q18
• All 116 turbines now operational • Grid infrastructure commissioned • Full operations expected 2Q18
Rampion
Offshore wind assets Under construction In pre-construction In development
Key projects on track for successful execution and in-service in 2018
TX
Mexico
Valley Crossing Pipeline
Brownsville
Texas Eastern
Nueces Hub
NEXUS Gas Transmission
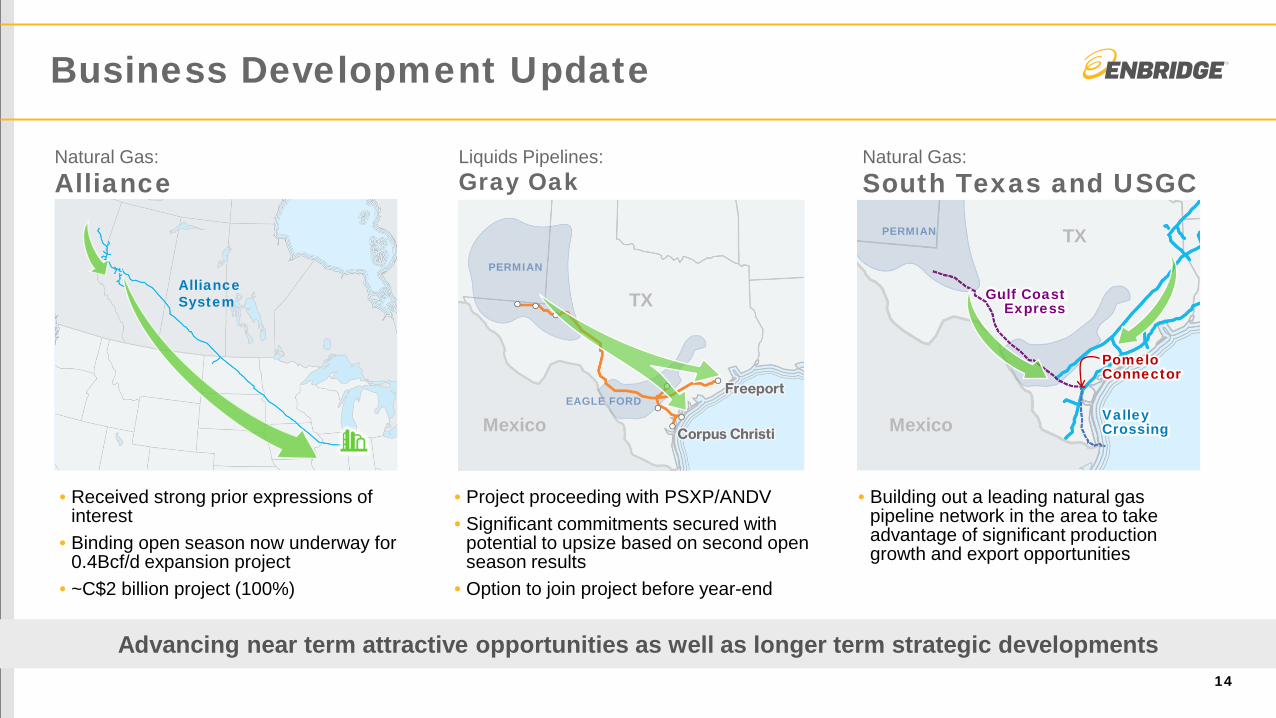
Natural Gas: Alliance
Liquids Pipelines: Gray Oak
Natural Gas: South Texas and USGC
• Received strong prior expressions of interest
• Binding open season now underway for 0.4Bcf/d expansion project
• ~C$2 billion project (100%)
• Project proceeding with PSXP/ANDV • Significant commitments secured with
potential to upsize based on second open season results
• Option to join project before year-end
• Building out a leading natural gas pipeline network in the area to take advantage of significant production growth and export opportunities
Alliance System
Business Development Update
14
Advancing near term attractive opportunities as well as longer term strategic developments
PERMIAN
EAGLE FORD
TX
Mexico
PERMIAN
Valley Crossing
Pomelo Connector
Mexico
TX
Gulf Coast Express
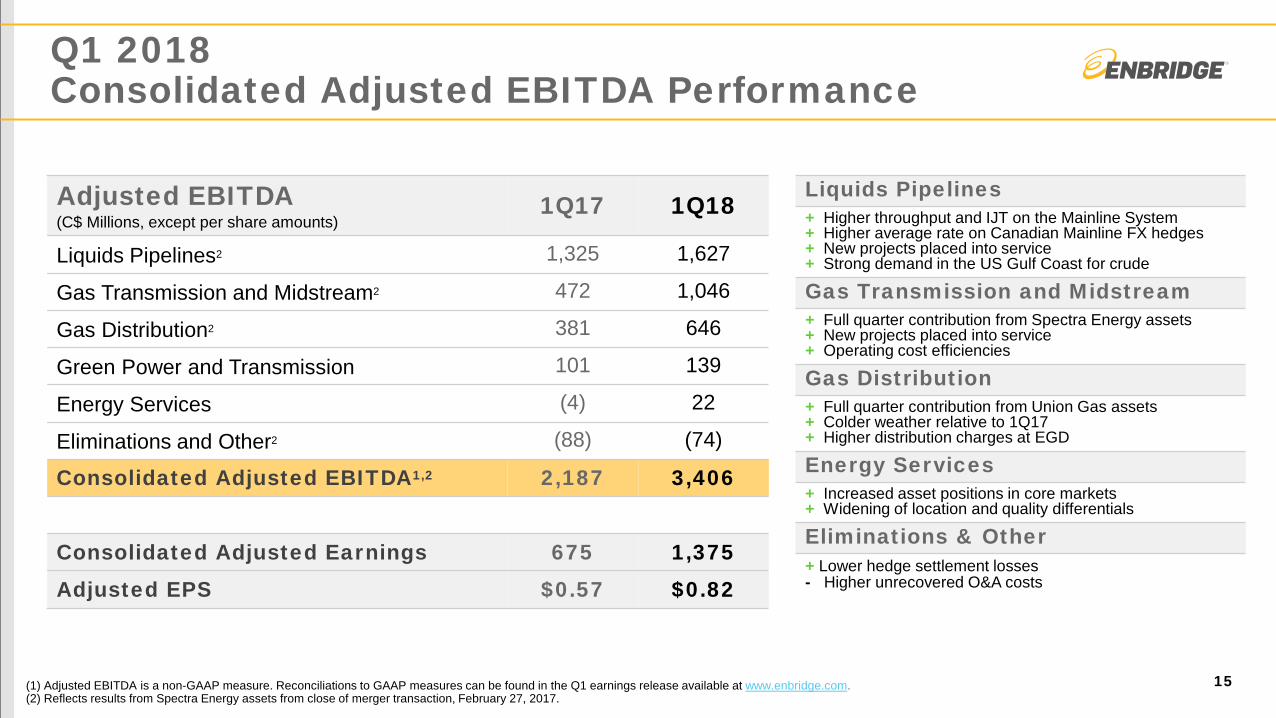
Q1 2018 Consolidated Adjusted EBITDA Performance
Liquids Pipelines + Higher throughput and IJT on the Mainline System + Higher average rate on Canadian Mainline FX hedges + New projects placed into service + Strong demand in the US Gulf Coast for crude
Gas Transmission and Midstream + Full quarter contribution from Spectra Energy assets + New projects placed into service + Operating cost efficiencies
Gas Distribution + Full quarter contribution from Union Gas assets + Colder weather relative to 1Q17 + Higher distribution charges at EGD
Energy Services + Increased asset positions in core markets + Widening of location and quality differentials
Eliminations & Other + Lower hedge settlement losses - Higher unrecovered O&A costs
Adjusted EBITDA (C$ Millions, except per share amounts)
1Q17 1Q18
Liquids Pipelines2 1,325 1,627
Gas Transmission and Midstream2 472 1,046
Gas Distribution2 381 646
Green Power and Transmission 101 139
Energy Services (4) 22
Eliminations and Other2 (88) (74)
Consolidated Adjusted EBITDA1,2 2,187 3,406
Consolidated Adjusted Earnings 675 1,375
Adjusted EPS $0.57 $0.82
(1) Adjusted EBITDA is a non-GAAP measure. Reconciliations to GAAP measures can be found in the Q1 earnings release available at www.enbridge.com. (2) Reflects results from Spectra Energy assets from close of merger transaction, February 27, 2017.
15
Q1 2018 Consolidated DCF Performance
16
(1) Adjusted EBITDA and DCF are non-GAAP measures. Reconciliations to GAAP measures can be found in the Q1 earnings release available at www.enbridge.com (2) Reflects results from Spectra Energy assets starting on close of transaction, February 27, 2017.
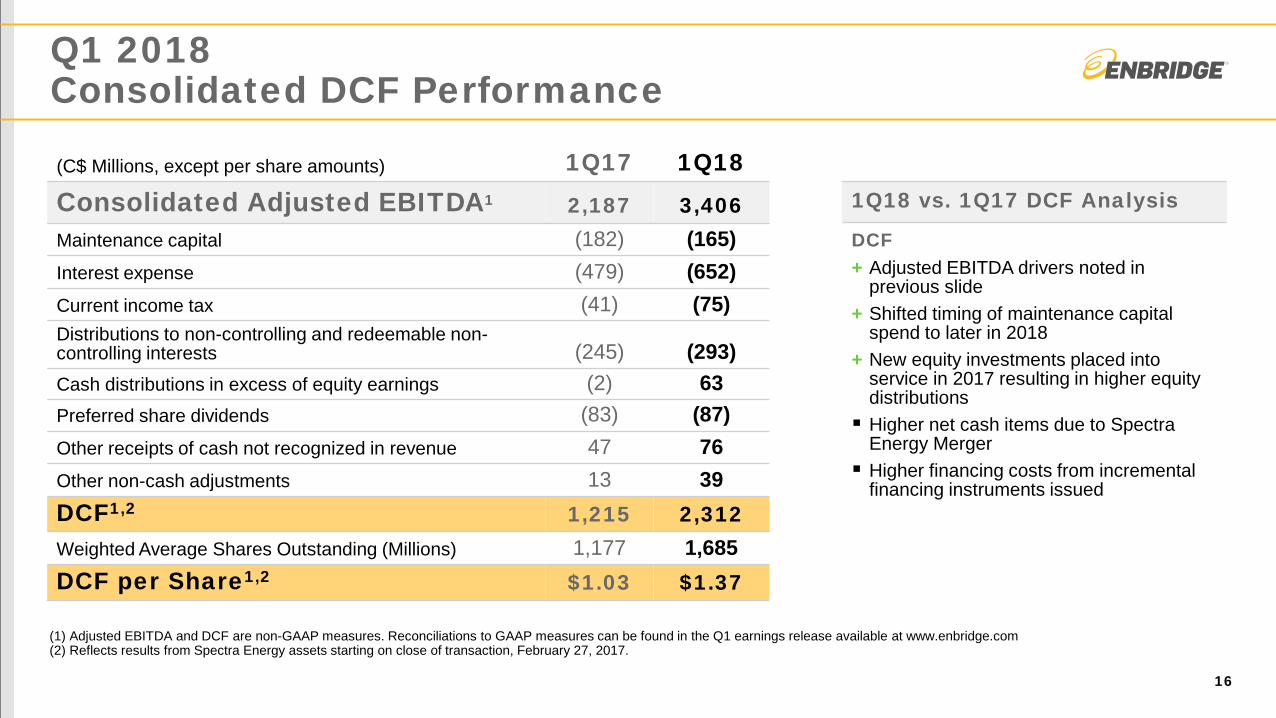
(C$ Millions, except per share amounts) 1Q17 1Q18 Consolidated Adjusted EBITDA1 2,187 3,406 Maintenance capital (182) (165) Interest expense (479) (652) Current income tax (41) (75) Distributions to non-controlling and redeemable non-controlling interests (245) (293) Cash distributions in excess of equity earnings (2) 63 Preferred share dividends (83) (87) Other receipts of cash not recognized in revenue 47 76 Other non-cash adjustments 13 39 DCF1,2 1,215 2,312 Weighted Average Shares Outstanding (Millions) 1,177 1,685 DCF per Share1,2 $1.03 $1.37
1Q18 vs. 1Q17 DCF Analysis
DCF + Adjusted EBITDA drivers noted in
previous slide + Shifted timing of maintenance capital
spend to later in 2018 + New equity investments placed into
service in 2017 resulting in higher equity distributions Higher net cash items due to Spectra
Energy Merger Higher financing costs from incremental
financing instruments issued

2018 Updated Quarterly Profile & FY Projection
17
Strong start to the year; remain on track to meet 2018 financial guidance (1) Adjusted EBITDA is a non-GAAP measure. Reconciliations to GAAP measures can be found in the Q1 earnings release available at www.enbridge.com.
2018 EBITDA Guidance ($MM) Guidance
2018e Updated 2018e
Liquids Pipelines ~6,350 ~6,425
Gas Transmission & Midstream ~3,900 ~3,975
Gas Distribution ~1,650 ~1,650
Green Power & Transmission ~425 ~425
Energy Services ~25 ~25
Eliminations & Other ~150 ~0
Consolidated EBITDA: ~12,500 ~12,500
DCF ~7,250
DCF/share $4.15 - $4.45
Re-allocation of FX Earnings Hedges 2018e Guidance
0%
10%
20%
30%
1Qa 2Qe 3Qe 4Qe
DCF (% of Full Year Projection)
Adjusted EBITDA (% of Full Year Projection)
0%
10%
20%
30%
1Qa 2Qe 3Qe 4Qe
Asset Monetizations originally included in Guidance
Previous Quarterly Profile
FX Earnings Hedge
Settlements
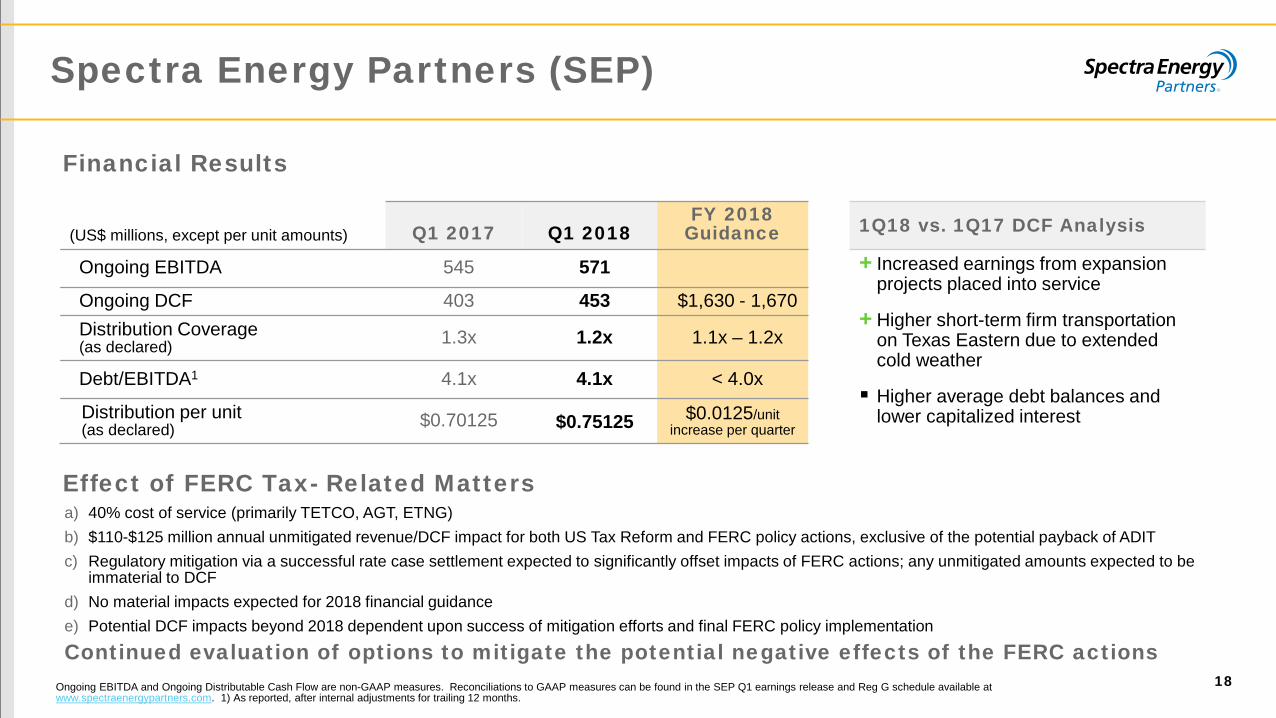
1Q18 vs. 1Q17 DCF Analysis
+ Increased earnings from expansion projects placed into service
+Higher short-term firm transportation on Texas Eastern due to extended cold weather
Higher average debt balances and lower capitalized interest
Spectra Energy Partners (SEP)
18 Ongoing EBITDA and Ongoing Distributable Cash Flow are non-GAAP measures. Reconciliations to GAAP measures can be found in the SEP Q1 earnings release and Reg G schedule available at www.spectraenergypartners.com. 1) As reported, after internal adjustments for trailing 12 months.
(US$ millions, except per unit amounts) Q1 2017 Q1 2018 FY 2018
Guidance
Ongoing EBITDA 545 571
Ongoing DCF 403 453 $1,630 - 1,670 Distribution Coverage (as declared) 1.3x 1.2x 1.1x – 1.2x
Debt/EBITDA1 4.1x 4.1x < 4.0x
Distribution per unit (as declared) $0.70125 $0.75125 $0.0125/unit
increase per quarter
Effect of FERC Tax- Related Matters a) 40% cost of service (primarily TETCO, AGT, ETNG) b) $110-$125 million annual unmitigated revenue/DCF impact for both US Tax Reform and FERC policy actions, exclusive of the potential payback of ADIT c) Regulatory mitigation via a successful rate case settlement expected to significantly offset impacts of FERC actions; any unmitigated amounts expected to be
immaterial to DCF d) No material impacts expected for 2018 financial guidance e) Potential DCF impacts beyond 2018 dependent upon success of mitigation efforts and final FERC policy implementation
Continued evaluation of options to mitigate the potential negative effects of the FERC actions
Financial Results
Enbridge Energy Partners (EEP)
19 Adjusted EBITDA and DCF are non-GAAP measures. Reconciliations to GAAP measures can be found in the supplemental slides available at www.enbridgepartners.com 1) As reported, after internal adjustments for trailing 12 months. 2) Revised for U.S. Tax Reform and FERC tax announcements.
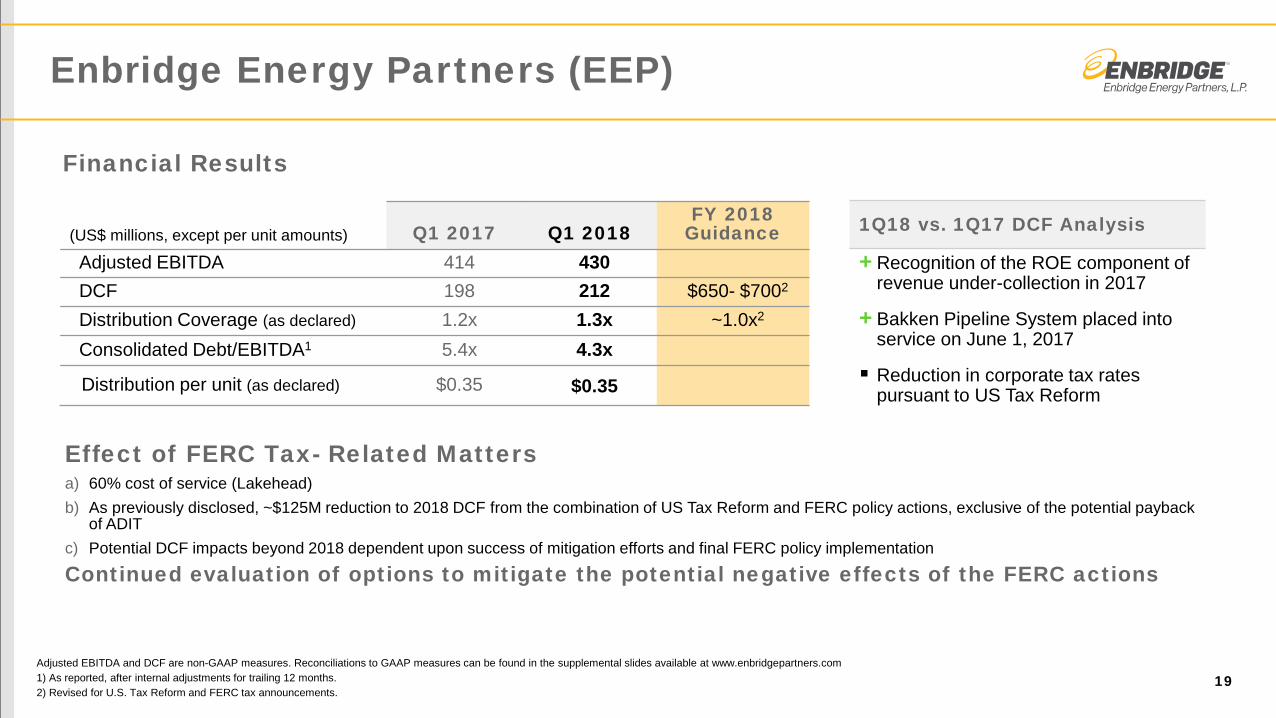
1Q18 vs. 1Q17 DCF Analysis
+Recognition of the ROE component of revenue under-collection in 2017
+Bakken Pipeline System placed into service on June 1, 2017
Reduction in corporate tax rates pursuant to US Tax Reform
(US$ millions, except per unit amounts) Q1 2017 Q1 2018 FY 2018
Guidance Adjusted EBITDA 414 430 DCF 198 212 $650- $7002
Distribution Coverage (as declared) 1.2x 1.3x ~1.0x2
Consolidated Debt/EBITDA1 5.4x 4.3x
Distribution per unit (as declared) $0.35 $0.35
Financial Results
Effect of FERC Tax- Related Matters a) 60% cost of service (Lakehead) b) As previously disclosed, ~$125M reduction to 2018 DCF from the combination of US Tax Reform and FERC policy actions, exclusive of the potential payback
of ADIT c) Potential DCF impacts beyond 2018 dependent upon success of mitigation efforts and final FERC policy implementation
Continued evaluation of options to mitigate the potential negative effects of the FERC actions

ENF & Fund Group
20
Adjusted EBITDA and DCF are non-GAAP measures. Reconciliations to GAAP measures can be found in the ENF Q1 earnings release and MD&A available at www.enbridgeincomefund.com.
1) As reported, after internal adjustments for trailing 12 months.
1Q18 vs. 1Q17 Fund Group DCF Analysis + Higher residual toll and higher
throughput on Canadian Mainline
+ Higher FX rate to translate Canadian Mainline US dollar revenues
+ Solid contribution from Alliance Pipeline
(C$ millions) Q1 2017 Q1 2018 FY 2018
Guidance Fund Group DCF 422 691 $2,450 - 2,650* Distributions Paid 403 498
Fund Group Debt/EBITDA1 6.0x 4.8x < 5.0x by end of 2018
Fund Group Payout Ratio 95% 72% 80-90% Over the plan horizon
ENF Adjusted Earnings 67 111
Financial Results
*Trending to upper end of 2018 Fund Group DCF guidance range after strong operating performance in first quarter Effect of FERC Tax- Related Matters • Under IJT, reduction in EEP tariff would create offsetting increase in Canadian Mainline tariff
No expected material impact to Fund Group DCF going forward; guidance range unchanged
Funding Progress
21
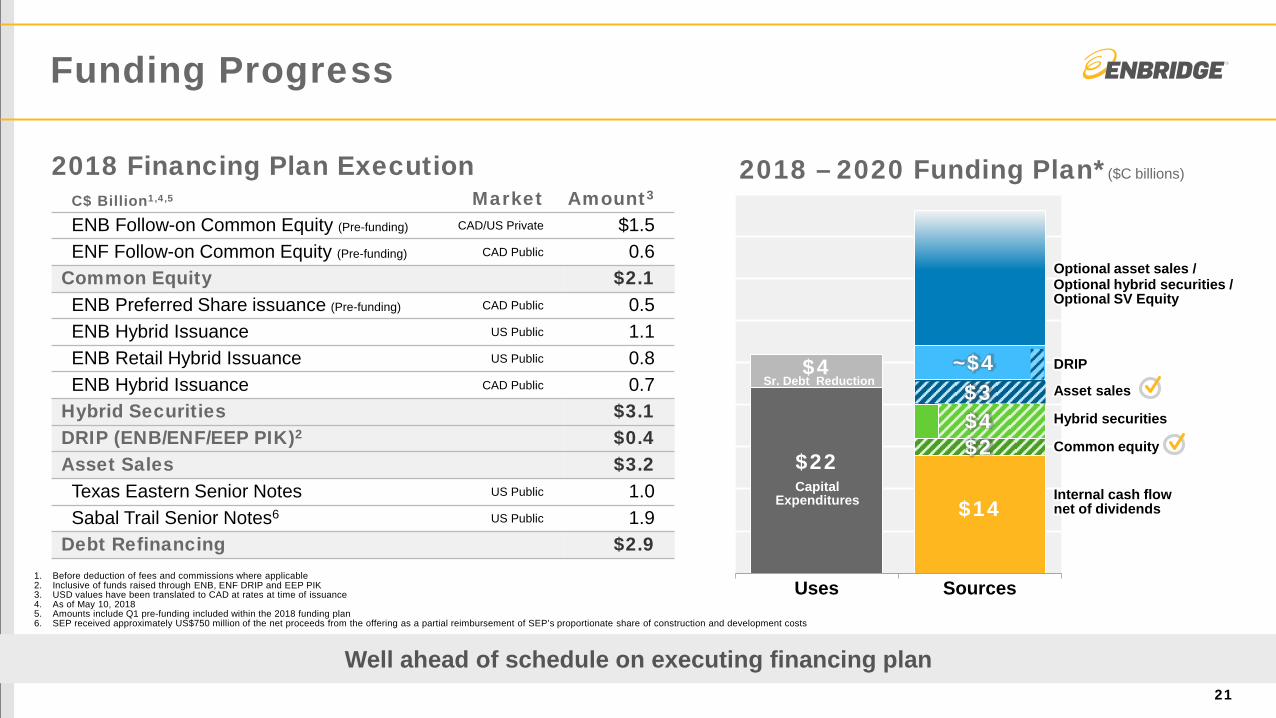
C$ Billion1,4,5 Market Amount3
ENB Follow-on Common Equity (Pre-funding) CAD/US Private $1.5 ENF Follow-on Common Equity (Pre-funding) CAD Public 0.6
Common Equity $2.1 ENB Preferred Share issuance (Pre-funding) CAD Public 0.5 ENB Hybrid Issuance US Public 1.1 ENB Retail Hybrid Issuance US Public 0.8 ENB Hybrid Issuance CAD Public 0.7
Hybrid Securities $3.1 DRIP (ENB/ENF/EEP PIK)2 $0.4 Asset Sales $3.2 Texas Eastern Senior Notes US Public 1.0 Sabal Trail Senior Notes6 US Public 1.9
Debt Refinancing $2.9 1. Before deduction of fees and commissions where applicable 2. Inclusive of funds raised through ENB, ENF DRIP and EEP PIK 3. USD values have been translated to CAD at rates at time of issuance 4. As of May 10, 2018 5. Amounts include Q1 pre-funding included within the 2018 funding plan 6. SEP received approximately US$750 million of the net proceeds from the offering as a partial reimbursement of SEP’s proportionate share of construction and development costs
2018 Financing Plan Execution 2018 – 2020 Funding Plan*($C billions)
$22
$14
$4
$0
$5
$10
$15
$20
$25
$30
$35
$40
$45
Uses Sources
Capital Expenditures
Sr. Debt Reduction
Optional hybrid securities / Optional SV Equity
Optional asset sales /
$4
Internal cash flow net of dividends
Common equity
Hybrid securities
Asset sales
$2
DRIP ~$4 $3
Well ahead of schedule on executing financing plan

2018 – 2020 Strategic Priorities
1. Move to pure regulated pipelines / utility model $3.2 billion of asset sales announced
2. Accelerate de-leveraging $3.1 billion of hybrid security issuances
3. Deliver premium cash flow & dividend growth Advancing $7B of projects for 2018 ISD
4. Streamline the business Strong Q1 financial results reflect synergies
5. Extend growth beyond 2020 Assessing new project opportunities
Executing on Our Strategic Priorities in Q1
22

Q&A

Enbridge Income Fund Holdings Inc. First Quarter 2018 Supplemental Slides
Investor Relations Nafeesa Kassam
403-266-8325 | [email protected]
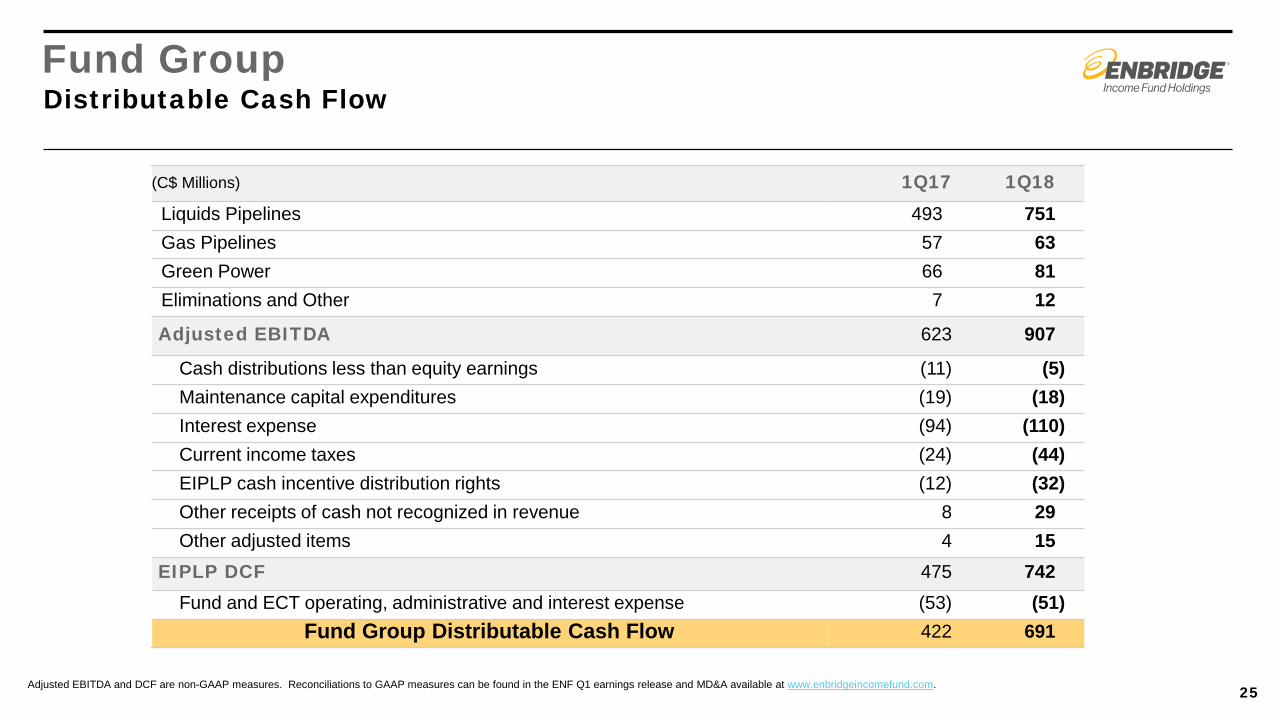
25 Adjusted EBITDA and DCF are non-GAAP measures. Reconciliations to GAAP measures can be found in the ENF Q1 earnings release and MD&A available at www.enbridgeincomefund.com.
Fund Group Distributable Cash Flow
(C$ Millions) 1Q17 1Q18 Liquids Pipelines 493 751 Gas Pipelines 57 63 Green Power 66 81 Eliminations and Other 7 12
Adjusted EBITDA 623 907
Cash distributions less than equity earnings (11) (5) Maintenance capital expenditures (19) (18) Interest expense (94) (110) Current income taxes (24) (44) EIPLP cash incentive distribution rights (12) (32) Other receipts of cash not recognized in revenue 8 29 Other adjusted items 4 15
EIPLP DCF 475 742 Fund and ECT operating, administrative and interest expense (53) (51)
Fund Group Distributable Cash Flow 422 691
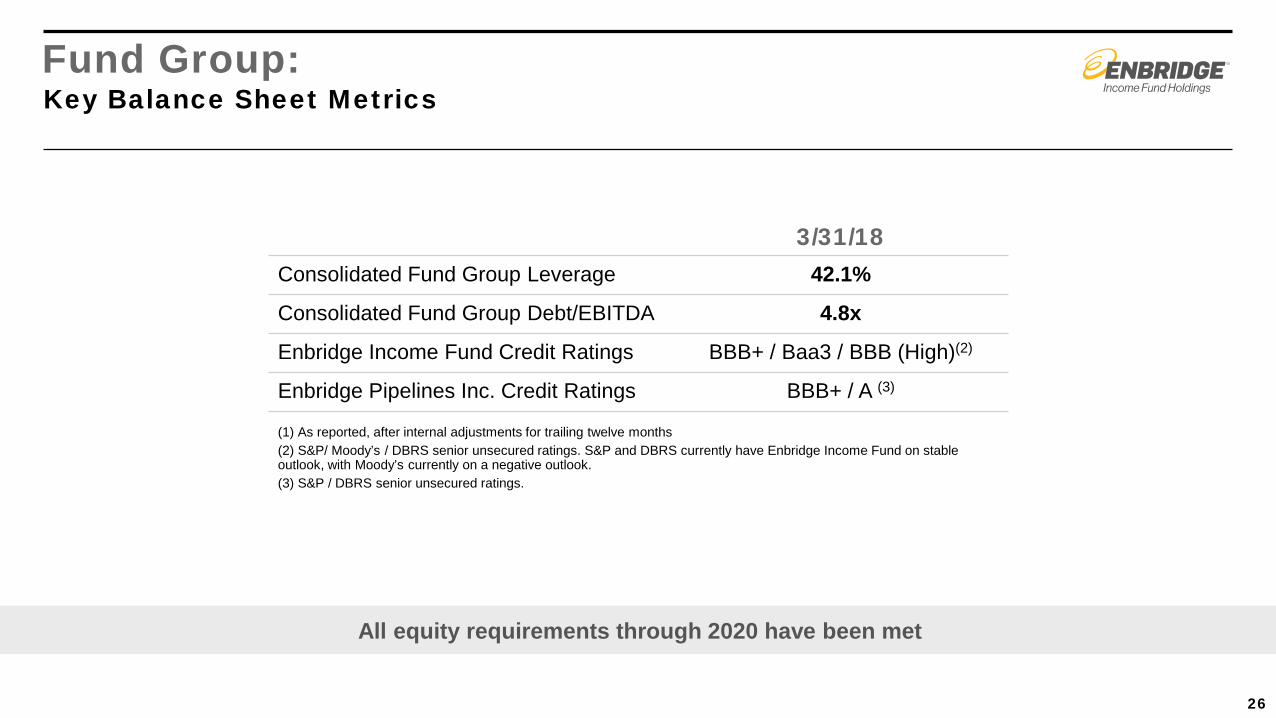
26
3/31/18 Consolidated Fund Group Leverage 42.1%
Consolidated Fund Group Debt/EBITDA 4.8x
Enbridge Income Fund Credit Ratings BBB+ / Baa3 / BBB (High)(2)
Enbridge Pipelines Inc. Credit Ratings BBB+ / A (3)
(1) As reported, after internal adjustments for trailing twelve months (2) S&P/ Moody’s / DBRS senior unsecured ratings. S&P and DBRS currently have Enbridge Income Fund on stable outlook, with Moody’s currently on a negative outlook. (3) S&P / DBRS senior unsecured ratings.
All equity requirements through 2020 have been met All equity requirements through 2020 have been met
Fund Group: Key Balance Sheet Metrics
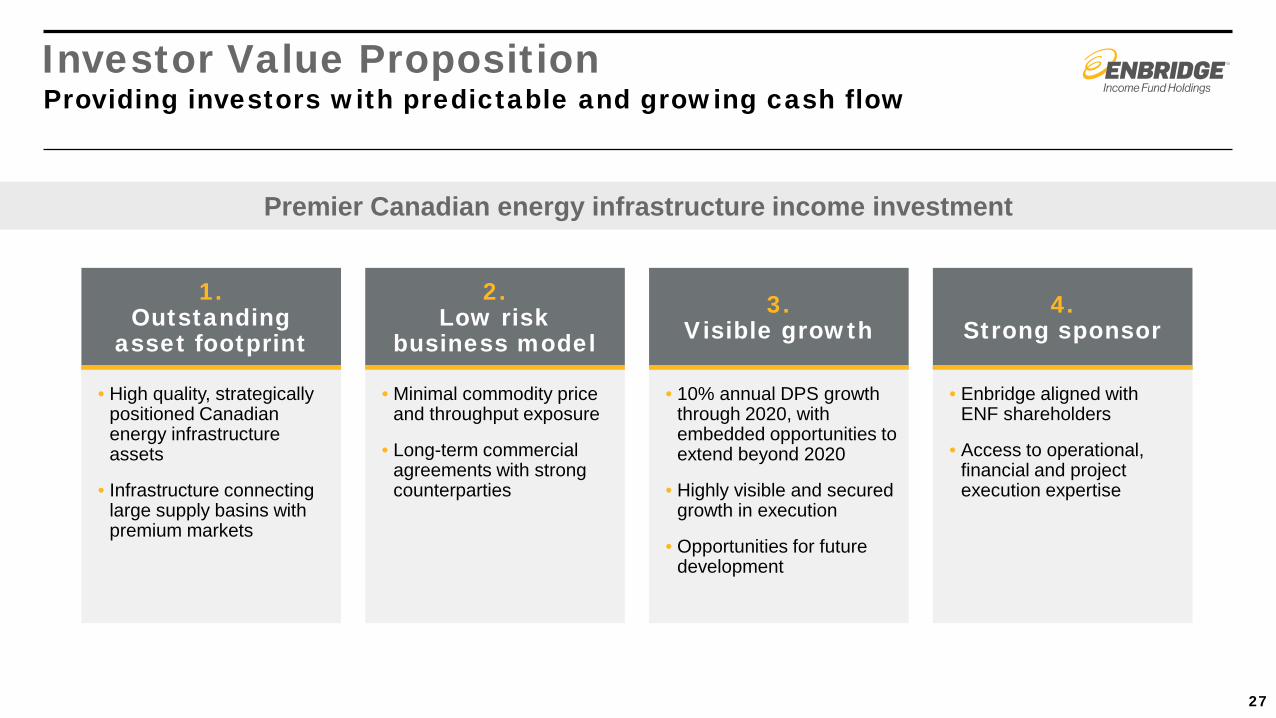
1. Outstanding
asset footprint
• High quality, strategically positioned Canadian energy infrastructure assets
• Infrastructure connecting large supply basins with premium markets
2. Low risk
business model
• Minimal commodity price and throughput exposure
• Long-term commercial agreements with strong counterparties
3. Visible growth
• 10% annual DPS growth through 2020, with embedded opportunities to extend beyond 2020
• Highly visible and secured growth in execution
• Opportunities for future development
4. Strong sponsor
• Enbridge aligned with ENF shareholders
• Access to operational, financial and project execution expertise
Premier Canadian energy infrastructure income investment
27
Investor Value Proposition Providing investors with predictable and growing cash flow

Spectra Energy Partners First Quarter 2018 Supplemental Slides
Investor Relations Roni Cappadonna
713-627-4778 | [email protected]
Spectra Energy Partners (SEP):
29
Distributable Cash Flow
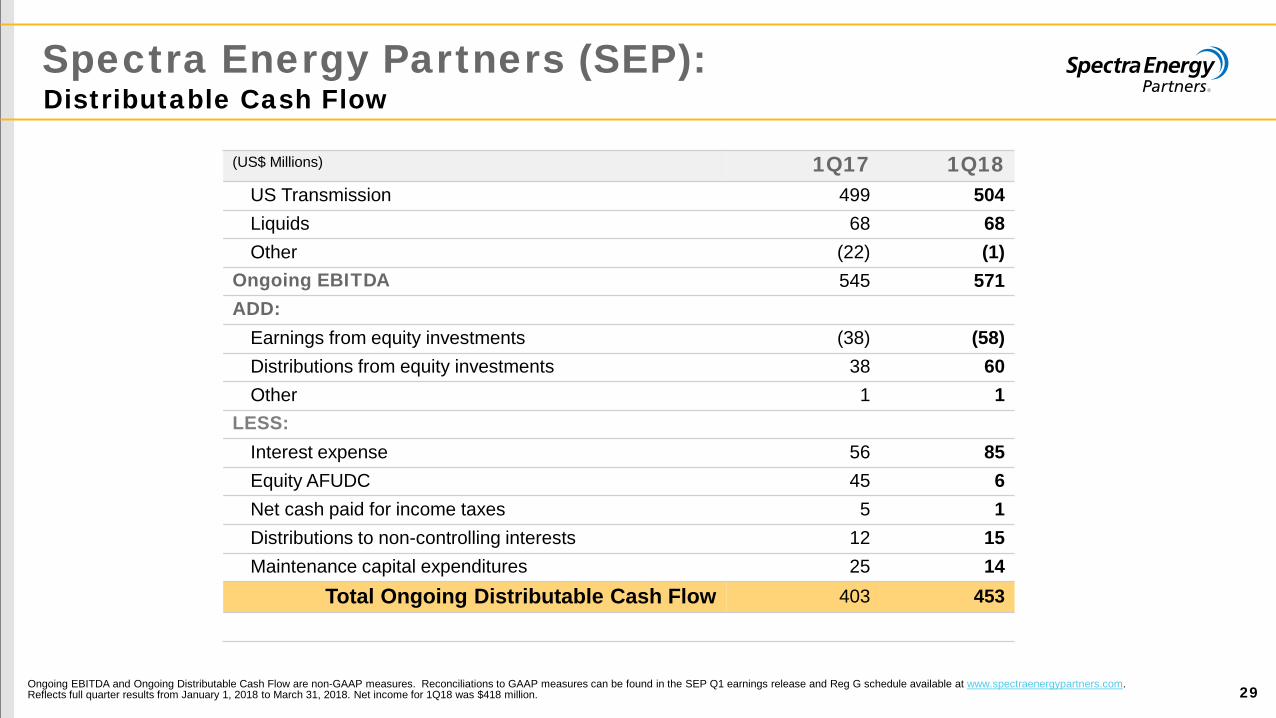
Ongoing EBITDA and Ongoing Distributable Cash Flow are non-GAAP measures. Reconciliations to GAAP measures can be found in the SEP Q1 earnings release and Reg G schedule available at www.spectraenergypartners.com. Reflects full quarter results from January 1, 2018 to March 31, 2018. Net income for 1Q18 was $418 million.
(US$ Millions) 1Q17 1Q18 US Transmission 499 504 Liquids 68 68 Other (22) (1)
Ongoing EBITDA 545 571 ADD:
Earnings from equity investments (38) (58) Distributions from equity investments 38 60 Other 1 1
LESS: Interest expense 56 85 Equity AFUDC 45 6 Net cash paid for income taxes 5 1 Distributions to non-controlling interests 12 15 Maintenance capital expenditures 25 14
Total Ongoing Distributable Cash Flow 403 453
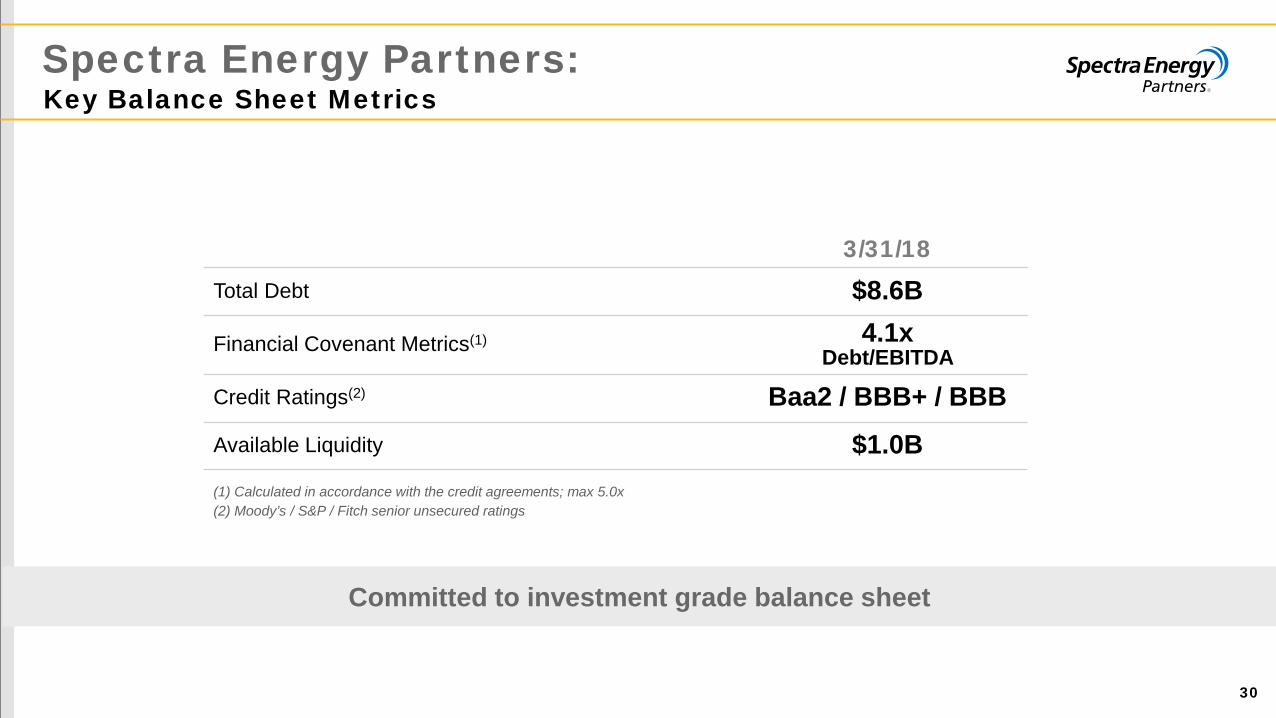
Spectra Energy Partners:
30
Key Balance Sheet Metrics
3/31/18 Total Debt $8.6B
Financial Covenant Metrics(1) 4.1x Debt/EBITDA
Credit Ratings(2) Baa2 / BBB+ / BBB Available Liquidity $1.0B (1) Calculated in accordance with the credit agreements; max 5.0x (2) Moody’s / S&P / Fitch senior unsecured ratings
Committed to investment grade balance sheet
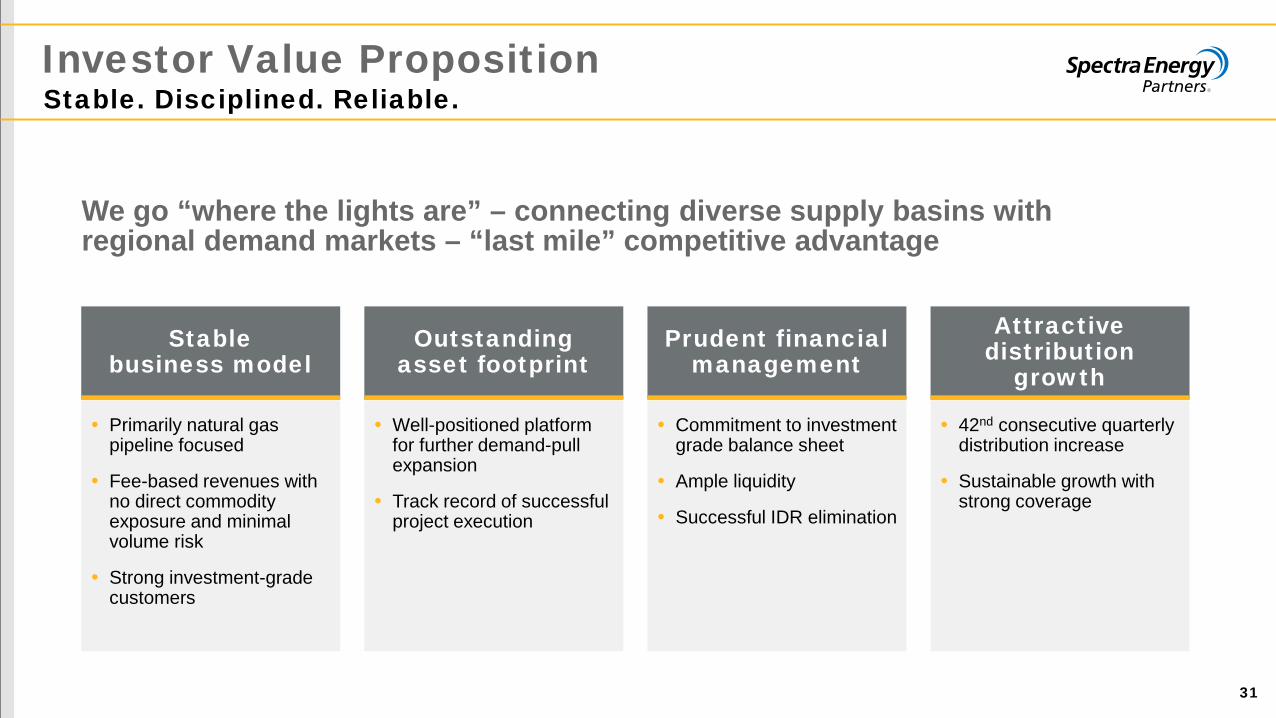
Investor Value Proposition
31
Stable. Disciplined. Reliable.
Stable business model
• Primarily natural gas pipeline focused
• Fee-based revenues with no direct commodity exposure and minimal volume risk
• Strong investment-grade customers
Outstanding asset footprint
• Well-positioned platform for further demand-pull expansion
• Track record of successful project execution
Prudent financial management
• Commitment to investment grade balance sheet
• Ample liquidity
• Successful IDR elimination
Attractive distribution
growth
• 42nd consecutive quarterly distribution increase
• Sustainable growth with strong coverage
We go “where the lights are” – connecting diverse supply basins with regional demand markets – “last mile” competitive advantage

Enbridge Energy Partners First Quarter 2018 Supplemental Slides
Investor Relations Roni Cappadonna
713-627-4778 | [email protected]
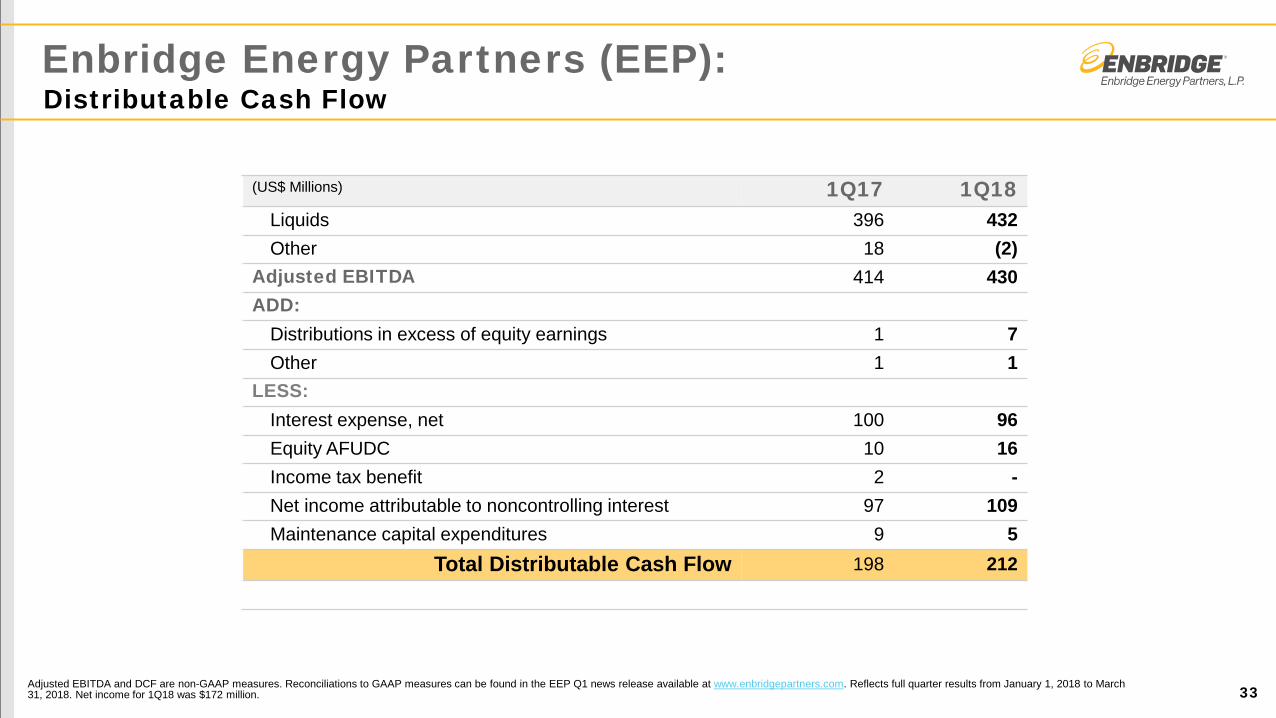
Enbridge Energy Partners (EEP):
33
Distributable Cash Flow
Adjusted EBITDA and DCF are non-GAAP measures. Reconciliations to GAAP measures can be found in the EEP Q1 news release available at www.enbridgepartners.com. Reflects full quarter results from January 1, 2018 to March 31, 2018. Net income for 1Q18 was $172 million.
(US$ Millions) 1Q17 1Q18 Liquids 396 432 Other 18 (2)
Adjusted EBITDA 414 430 ADD:
Distributions in excess of equity earnings 1 7 Other 1 1
LESS: Interest expense, net 100 96 Equity AFUDC 10 16 Income tax benefit 2 - Net income attributable to noncontrolling interest 97 109 Maintenance capital expenditures 9 5
Total Distributable Cash Flow 198 212
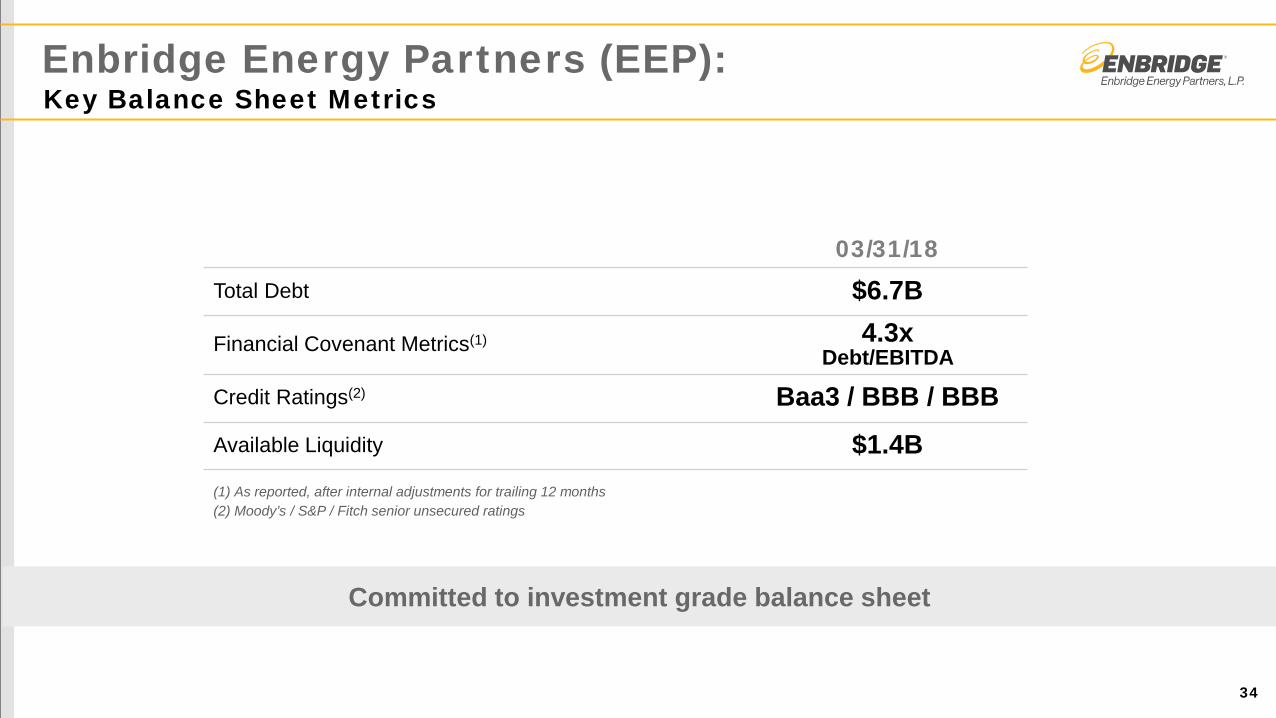
Enbridge Energy Partners (EEP):
34
Key Balance Sheet Metrics
Committed to investment grade balance sheet
03/31/18 Total Debt $6.7B
Financial Covenant Metrics(1) 4.3x Debt/EBITDA
Credit Ratings(2) Baa3 / BBB / BBB Available Liquidity $1.4B (1) As reported, after internal adjustments for trailing 12 months (2) Moody’s / S&P / Fitch senior unsecured ratings
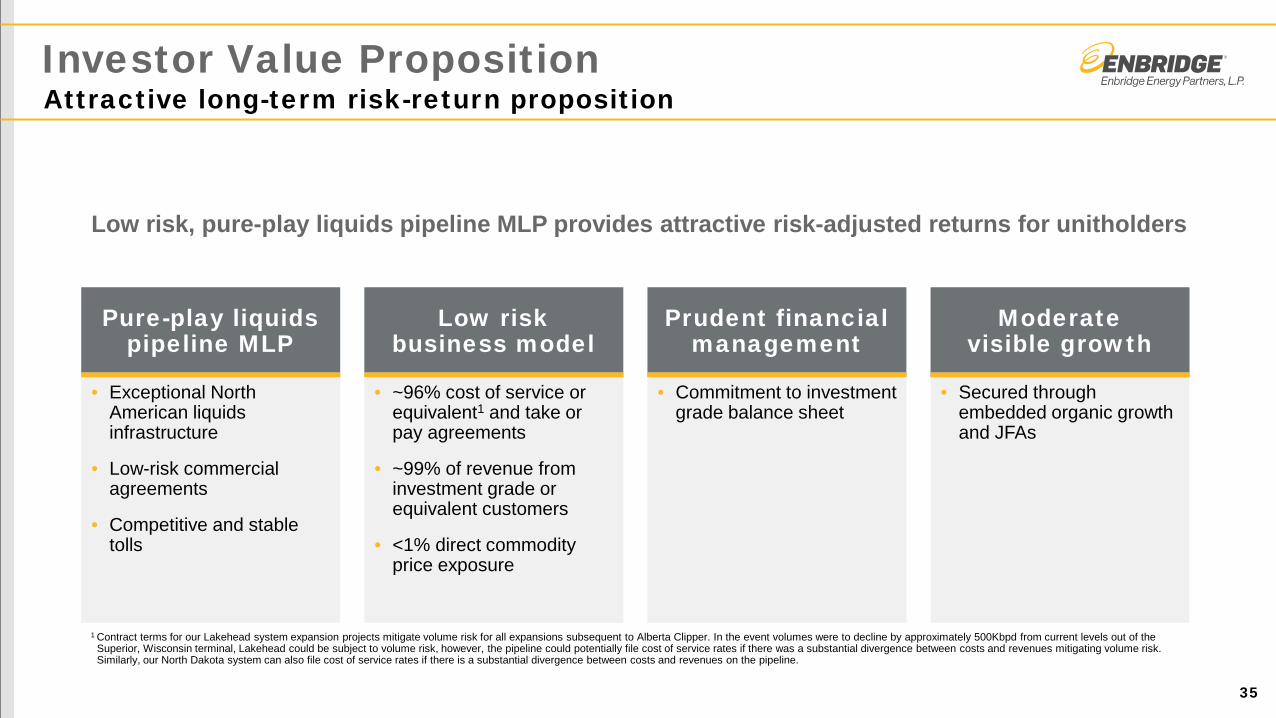
Investor Value Proposition
35
Attractive long-term risk-return proposition
Pure-play liquids pipeline MLP
• Exceptional North American liquids infrastructure
• Low-risk commercial agreements
• Competitive and stable tolls
Low risk business model
• ~96% cost of service or equivalent1 and take or pay agreements
• ~99% of revenue from investment grade or equivalent customers
• <1% direct commodity price exposure
Prudent financial management
• Commitment to investment grade balance sheet
Moderate visible growth
• Secured through embedded organic growth and JFAs
Low risk, pure-play liquids pipeline MLP provides attractive risk-adjusted returns for unitholders
1 Contract terms for our Lakehead system expansion projects mitigate volume risk for all expansions subsequent to Alberta Clipper. In the event volumes were to decline by approximately 500Kbpd from current levels out of the Superior, Wisconsin terminal, Lakehead could be subject to volume risk, however, the pipeline could potentially file cost of service rates if there was a substantial divergence between costs and revenues mitigating volume risk. Similarly, our North Dakota system can also file cost of service rates if there is a substantial divergence between costs and revenues on the pipeline.