Embed Size (px)
Citation preview

Investor PresentationMay 2018

This presentation and the accompanying slides (the “Presentation”), which have been prepared by PNB Housing
Finance Ltd (the “Company”), have been prepared solely for information purposes and do not constitute any offer,
recommendation or invitation to purchase or subscribe for any securities, and shall not form the basis or be relied on in
connection with any contract or binding commitment what so ever. No offering of securities of the Company will be
made except by means of a statutory offering document containing detailed information about the Company.
This Presentation has been prepared by the Company based on information and data which the Company considers
reliable, but the Company makes no representation or warranty, express or implied, whatsoever, and no reliance shall
be placed on, the truth, accuracy, completeness, fairness and reasonableness of the contents of this Presentation. This
Presentation may not be all inclusive and may not contain all of the information that you may consider material. Any
liability in respect of the contents of, or any omission from, this Presentation is expressly excluded.
Certain matters discussed in this Presentation may contain statements regarding the Company’s market opportunity
and business prospects that are individually and collectively forward-looking statements. Such forward-looking
statements are not guarantees of future performance and are subject to known and unknown risks, uncertainties and
assumptions that are difficult to predict. These risks and uncertainties include, but are not limited to, the performance of
the Indian economy and of the economies of various international markets, the performance of the industry in India and
world-wide, competition, the company’s ability to successfully implement its strategy, the Company’s future levels of
growth and expansion, technological implementation, changes and advancements, changes in revenue, income or cash
flows, the Company’s market preferences and its exposure to market risks, as well as other risks. The Company’s
actual results, levels of activity, performance or achievements could differ materially and adversely from results
expressed in or implied by this Presentation. The Company assumes no obligation to update any forward-looking
information contained in this Presentation. Any forward-looking statements and projections made by third parties
included in this Presentation are not adopted by the Company and the Company is not responsible for such third party
statements and projections.
Safe Harbor
2

About PNB Housing Finance
3

4
Loan Assets: INR 57,014 Crore (US$ 8,766 mn)
GNPA: 0.31% on AUM / 0.33% on Loan Assets
Fastest growing HFC amongst the Top 5 HFCs in India
*Data for FY17-18
No. of employees: 1,290
Leading Housing Finance Company…
ISO 9001:2015 certified COPS and CPC
ISO 9001:2015 Customer Service Operations
ISO 9001:2008 certified Contact Centre
Book Value Per Share: INR 378.5 per Share
Average Cost of Borrowing: 7.71%*
Asset Under Management: INR 62,252 Crore (US$ 9,571 mn)
COPS: Central Operations, CPC: Central Processing Center1 Crore= 10 million Data as on 31-Mar-18
Disbursement: INR 33,195 Crore* (US$ 5,104 mn)
All US$ numbers in the presentation are converted at 1US$ = INR 65.04

• Launched
business process
re-engineering
project- “Kshitij”
• AUM: ~INR 3,000
crore
• DEPL raises
stake from
26% to 49%
1 QIH (Quality Investment Holdings) is an affiliate of Carlyle Asia Partners IV, L.P.
5
*Source: Great Place to Work Institute (GPTW)
started in 1988
• Company
incorporated
• Destimoney
Enterprises
Private
Limited
(“DEPL”)
acquired 26%
stake in the
Company
• Introduced
new brand
image
• Robust and
scalable target
operating
model (“TOM”)
implementation
commenced
1988 2009
2010
2011
2012
2015
2016
• DEPL is
acquired by QIH,
of the Carlyle
Group (1)
• IPO - Raised
INR 3,000
Crore
• AUM
crossed INR
25,000 crore 2017
• AUM crossed
INR 50,000
crore
• Certified as a
“Great Place to
Work” by
building a ‘High
Trust, High
Performance
Culture’*
• Deposits: Over
INR 10,000
Crore
• Incorporated a
subsidiary
’’PHFL Home
Loans &
Services Ltd’’
2018
• MTN set-up
for $1bn to
raise off-
shore funds
• Certified as a
“Great Place
to Work” by
building a
‘High Trust,
High
Performance
Culture’*2014
• AUM crossed
INR 10,000
crore

HFC Sector well placed…
6

7
India’s Mortgage Market…
Indian mortgage market is significantly under-penetrated
Mortgage to GDP Ratio (%)
Under penetrated mortgage market, rising urbanization coupled with increase in housing demand is leading to mortgage market
expansion
Ramp-up expected in Indian mortgage market
Increasing urban population
Significant urban housing shortage
65%63%
51%45%
41%
34%31%
20% 18%
10%12 -14%
Un
ite
dK
ingd
om
Un
ite
dS
tate
s
Sin
ga
pore
Honk K
ong
Germ
any
Mala
ysia
Ko
rea
Thaila
nd
Ch
ina
India
India
(Mar'22
E)
Loan Assets (INR Trillion)
Source: ICRA Indian Mortgage Finance Market Update for 9MFY2018
Source: Ministry of Housing and Urban Poverty Alleviation
Source: NHB, RBI, CRISIL Research
Source: ICRA Indian Mortgage Finance Market Update for 9MFY2018
6.3 7.4 8.8 10.4 12.4
14.4 16.8
19.9 23.4
27.7
32.6
Ma
r-12
Ma
r-13
Ma
r-14
Ma
r-15
Ma
r-16
Ma
r-17
Ma
r-18E
Ma
r-19E
Ma
r-20E
Ma
r-21E
Ma
r-22E
+18% CAGR
+18%CAGR
EWS, 39.5%
LIG, 4.4%
MIG & above, 56.2%
Split of Urban Housing Shortage in FY2012 – 18.8 million units
30.93% 31.28% 31.63% 31.99% 32.37% 32.75% 33.14%
40.00%
2010 2011 2012 2013 2014 2015 2016 2030 ( E )

8
Increasing HFCs Share in a Steadily Expanding Home Loan Portfolio
(INR Lakh Crore)
Source: ICRA Indian Mortgage Finance Market Update for 9MFY2018
% Change is YoY
Outpacing Traditional Channels with…
15%
18% 17%18%
15% 14%
26%
20%21%
19%18%
20%
0%
5%
10%
15%
20%
25%
30%
2
4
6
8
10
12
14
16
18
20
Mar-13 Mar-14 Mar-15 Mar-16 Mar-17 Dec-17
Banks HFC's Banks Growth HFC's Growth

9
38%
18%
11%
9%
6%
2%
1%
1%
14%
HDFC Ltd LIC HF IBHF DHFL PNBHFL
Gruh Can Fin Repco HF Others
Total Loan of all HFCs: INR 8.9 Lakh Crore
as on 31-Dec-17
Source: ICRA Indian Mortgage Finance Market Update for 9MFY2018
% Change is YoY
Portfolio Composition of All HFCs
as on 31-Mar-17
67%
15%
10%
5% 3%
Home Loan LAP Construction Finance LRD Others
Portfolio Growth of HFCs
Top 5 HFCs: 82%
21%
26% 26%27%
30%
20%
22% 21%20%
23%
19%21%
19%18%
20%
Mar-14 Mar-15 Mar-16 Mar-17 Dec-17
Other Loans Overall Portfolio Home Loans
Sustainable Growth of HFCs

Government Initiatives
10

11
Growth Drivers
FinancersHome Buyers Developers
Improved AffordabilityUrbanization Favourable Demographics
• Incentives from PMAY subsidy
and tax deductions
• RERA : transparency and
delivery visibility to buyers
• 90% of government run pension
fund EPFO can be withdrawn for
house purchase
• 100% tax exemption on
affordable housing construction
for developers
• Faster building permissions
• RERA : increase in developers
accountability
• Infrastructure status for affordable
housing, enabling easier institutional
credit
• RBI, SEBI and IRDA have
coordinated policies to ease access
to funding
• Reduction in risk weights and
provisioning norms
• More effective recovery law

Changes / Inclusion in the scheme effective 1-Jan-17
• Existing scheme renamed as PMAY-CLSS for EWS/LIG
• Maximum tenure changed from 15 to 20 years
• Scheme extended to Middle Income Group (MIG) available upto March 2019
12
Effective Interest Rate of ~2.63% post PMAY and Tax Benefit
Source: ICRA, Report* Applicable on Construction, Improvement, Extension
PMAY-CLSS
Category
Loan Tenure
Household Income (INR Lakhs per annum)
Interest Subsidy
Carpet Area (Sq. Mtr.)
NPV Discount Rate (%)
Maximum Interest Subsidy Amount (INR)
Loan Amount eligible for subsidy (INR Lakhs)
EWS LIG MIG I MIG II
3
267,280
6
6.5%
20
30*
9%
6
267,280
6
6.5%
20
60*
9%
12
235,068
9
4%
20
120
9%
18
230,156
12
3%
20
150
9%

Expansion Led Growth and Robust TOM
13

14
No. of Branches
Map not to scale. All data, information and maps are provided “as is” without warranty or any representation of accuracy, timeliness or completeness.
Branches – Point of Sales & Services
Processing Hubs – Fountain head for Decision Making
Zonal Hubs - Guides, Supervises & Monitors the HUB
32%
29%
39%
North
South
West
AUM- Geographical Distribution
*Unique cities are part of Branches
^Branches made operational from FY16 onwards
27
8
7
84
TotalFY18
21
FY17
16
9 56
FY15FY14 FY16
32
Unique Cities*No. of Branches
47
Expanding Footprints…
As on 31-Mar-18
Geography Hub Branches
North 7 28
South 7 27
West 7 29
New Branches^ contributes
30% of Retail Disbursement
Central Support Office

15
DSA DST
File received at
hub
Fountain head
for decision
making
Fraud Control
Unit
Legal Team
Collection
Team
Technical
Service Group
Underwriter reviews
the reports, does the
financial assessment
and finally decides
on the loan
application
Digital
Platform
Field
Investigation
Lead
Aggregators
Driven by Scalable Hub & Spoke Model…
Customer acquisition /
servicing
Underwriting Post Disbursement Operations
CPC
COPS
√ Scalable and efficient operating
model with centralized processing
√ Effective risk management with
separation of responsibilities
√ Integrated IT platform
Spokes Regional Hub Central Operations
DSA: Direct Sales Agent; DST: Direct Sales Team

16
and Robust Risk Buying Processes…
Specialization
Professionally qualified
with vast mortgage
experience
Stable and vintage cadre
of hub heads and other
senior personnel
Specialized roles,
distinguished
responsibilities but
collective decision
making
Predictable service
standards
Customer profiling
Selective approach to
customer profiling and
their business model
Evidence based income
assessment and
established banking
relationship
Seasoned mass affluent
customers with multiple
assets and credit tested
Mandatory touch base
with self employed
customer at their work
premises
Other mitigating
measures
Mark to Market policies
with tailor made offering
Multiple checks and
balances with maker-
checker approach
Workflow based
assessment on single IT
platform
Use of technology in
verification of customer
data points and geo
tagging of properties
3C Approach
3C approach: Counsel,
Collect and Cure
Periodical portfolio scrub for
early warning signals
Efficiencies through
centralised banking
In house contact centre with
payment gateway integration
Special cadre of
professionals for resolution
through legal tools
Collections on-the-go
through mobility for effective
supervision
Adherence to regulatory
framework
Underwriting to Collections
An independent audit function for all departments and processes, directly reporting to Audit Committee of Board
Multi pronged control mechanism coupled with regular portfolio review
Enterprise Risk Management framework
17
(INR Crore)
33,195
20,639
14,456
9,440
FY17 FY18FY15 FY16
CAGR+52%
38,53127,177
16,819
57,014
31-Mar-1831-Mar-17
41,492
62,252
31-Mar-16
27,555
31-Mar-15
17,297
CAGR+53%
AUM Loan Assets
Asset
Disbursement
1 Crore = 10 million
leading to Strong Business growth…

18
0.20%0.22% 0.22%
0.33%
0.07%
0.14% 0.15%
0.25%
0.00%
0.05%
0.10%
0.15%
0.20%
0.25%
0.30%
0.35%
31-Mar-15 31-Mar-16 31-Mar-17 31-Mar-18
GNPA NNPA
63
31
64
87
1525
52
16
166
FY18FY17
577
84
FY16
37
FY15
6
Credit Costs (Regulatory Provisions)
25 3910278
130
194
281
23
22
27
42295%
295% 303%
228%
80%80%81%81%82%82%83%83%84%84%85%85%86%86%87%87%88%88%88%89%89%90%90%91%91%92%92%93%93%94%94%95%95%95%96%96%97%97%98%98%99%99%100%100%101%101%102%102%103%103%103%104%104%105%105%106%106%107%107%108%108%109%109%110%110%110%111%111%112%112%113%113%114%114%115%115%116%116%117%117%118%118%118%119%119%120%120%121%121%122%122%123%123%124%124%125%125%126%126%126%127%127%128%128%129%129%130%130%131%131%132%132%133%133%133%134%134%135%135%136%136%137%137%138%138%139%139%140%140%141%141%141%142%142%143%143%144%144%145%145%146%146%147%147%148%148%148%149%149%150%150%151%151%152%152%153%153%154%154%155%155%156%156%156%157%157%158%158%159%159%160%160%161%161%162%162%163%163%164%164%164%165%165%166%166%167%167%168%168%169%169%170%170%171%171%171%172%172%173%173%174%174%175%175%176%176%177%177%178%178%179%179%179%180%180%181%181%182%182%183%183%184%184%185%185%186%186%186%187%187%188%188%189%189%190%190%191%191%192%192%193%193%194%194%194%195%195%196%196%197%197%198%198%199%199%200%200%201%201%202%202%202%203%203%204%204%205%205%206%206%207%207%208%208%209%209%209%210%210%211%211%212%212%213%213%214%214%215%215%216%216%217%217%217%218%218%219%219%220%220%221%221%222%222%223%223%224%224%224%225%225%226%226%227%227%228%228%229%229%230%230%231%231%232%232%232%233%233%234%234%235%235%236%236%237%237%238%238%239%239%240%240%240%241%241%242%242%243%243%244%244%245%245%246%246%247%247%247%248%248%249%249%250%250%251%251%252%252%253%253%254%254%255%255%255%256%256%257%257%258%258%259%259%260%260%261%261%262%262%262%263%263%264%264%265%265%266%266%267%267%268%268%269%269%270%270%270%271%271%272%272%273%273%274%274%275%275%276%276%277%277%278%278%278%279%279%280%280%281%281%282%282%283%283%284%284%285%285%285%286%286%287%287%288%288%289%289%290%290%291%291%292%292%293%293%293%294%294%295%295%296%296%297%297%298%298%299%299%300%300%300%301%301%302%302%303%303%304%304%305%305%306%306%307%307%308%308%308%309%309%310%310%311%311%312%312%313%313%314%314%315%
050
100150200250300350400450
31-Mar-15 31-Mar-16 31-Mar-17 31-Mar-18
NPA Standard Asset Provision for Contingency PCR
with Lower NPAs and Adequate Credit Cost
1 Crore = 10 million
Provisions(INR Crore)
Non Performing Assets
NPA Provision Provision for ContingencyStandard Asset Provision
2-years lagged NPA*
0.5 0.6
0.5
0.67
1 1
1.2
31-Mar-15 31-Mar-16 31-Mar-17 31-Mar-18
PNBHFL Other HFCs
*Source: CRISIL
Awaited

Sustainable Portfolio Mix
19

Share of Housing Loans
(% of Incremental Disbursement)Product-wise Breakup (FY18)
69 71 70 69
31 29 30 31
FY18FY16 FY17FY15
Non-Housing Housing
20
Disbursement Mix
53%
16%
31% IndividualHousing Loan
ConstructionFinance
Non-HousingLoan
Disbursement Origination (FY18)
65%
35% In-House
DSA
Housing Loan- 69%
21
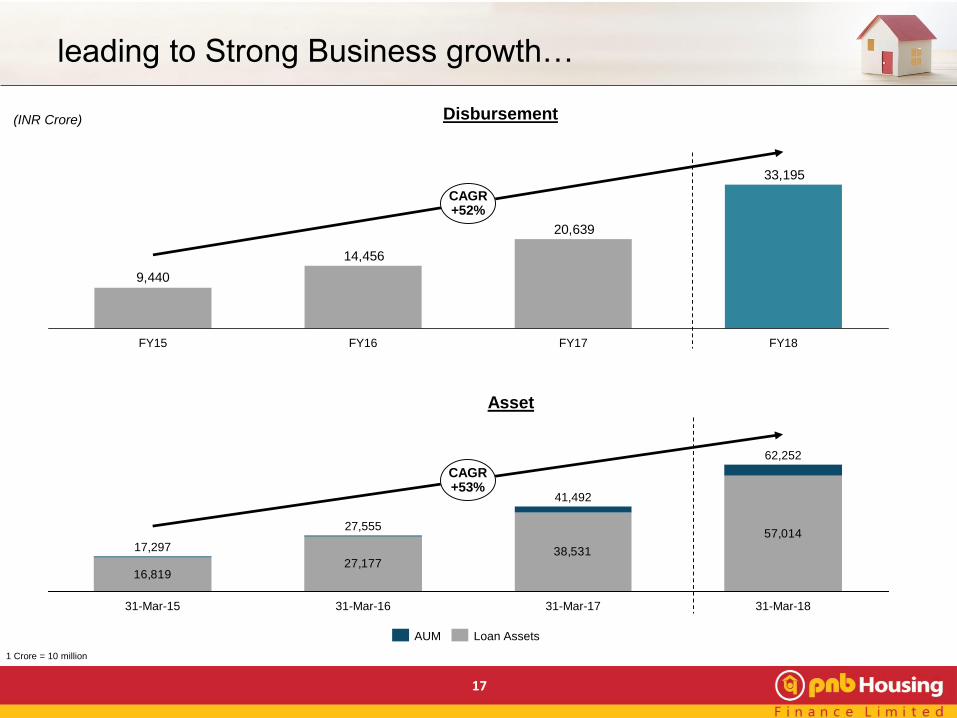
Asset Under Management
72 71 70 71
28 29 30 29
31-Mar-1831-Mar-1731-Mar-1631-Mar-15
Non-Housing Housing
59%
12%
29%Individual Housing Loan
Construction Finance
Non-Housing Loan
Wide Product Offering
(% of AUM)
Product-wise Break-up
(As on 31-Mar-18)
Loan Assets Walk (INR Crore)
(As on 31-Mar-18)
57,0145,23862,252
Loan AssetsSell downAUM1 Crore = 10 million
Housing Loan- 71%

22
Loan Assets
Wide Product Offering
(% of Loan Assets)
31-Mar-17
29
70
31-Mar-18
30
71
29
70
30
31-Mar-15 31-Mar-16
71
Construction Finance Loans– 13.6%
2,471
31-Mar-1631-Mar-15
4,382
31-Mar-18
7,727
31-Mar-17
1,682
(INR Crore)
Individual Housing Loans – 56.2%
10,260
16,645
31-Mar-15 31-Mar-16 31-Mar-17
22,880
(INR Crore)
31-Mar-18
32,043
ATS: INR 31
Lakh
(US$ 47.7 k)
Housing Loans – 69.8%
41.8%
36.8%
21.4%
Salaried
Self-Employed
Wholesale
Composition as on 31-Mar-18
Retail- 78.6%
1 Crore = 10 million
HousingNon-Housing
ATS: Average Ticket Size
83%
6%
6% 4% 1%
Home Purchase LoansResidential Plot LoansResidential Plot cum Construction LoansSelf Construction LoansHome Improvement/Extension Loans

56%16%
15%
12%
LAP LRD CTL NRPL
ATS:
INR 73 Lakh
(US$ 112.2 k)
ATS: Average Ticket Size
4,878
8,025
11,269
31-Mar-1731-Mar-1631-Mar-15 31-Mar-18
23
Non-Housing Loans - 30.2%
(INR Crore)
Data as on 31-Mar-18
1 Crore = 10 million
Non- Housing Loan Assets Distribution
17,244

24
Individual Housing Loan Profile
*Calculated on residual maturity
Data as on 31-Mar-18
Focus on Mass Housing
Individual Housing Loans
Salaried vs Self-Employed
% of Loan Assets
Weighted Average Loan to Value (at Origination)
Weighted Average Tenure*
Primary Security
Average Ticket Size
56.2%
Mortgage of Property
INR 31 Lakh
(US$ 47.7 k)
69%
68% : 32%
17.8 Years

25
Loan Against Property Profile
Data as on 31-Mar-18
Robust Credit Underwriting Process
Loan Against Property
Salaried vs Self-Employed
% of Loan Assets
Weighted Average Loan to Value (at Origination)
Weighted Average Tenure*
Primary Security
Average Ticket Size
17%
Mortgage of Property
INR 48 Lakh
(US$ 73.8 k)
48%
19% : 81%
12 Years
*Calculated on residual maturity

26
Construction Finance Profile
Data as on 31-Mar-18
Conservative Lending Processes
Construction Finance
% of Loan Assets
Number of Loan Accounts
Weighted Average Tenure*
Average Ticket Size
Number of Unique Developers
13.6%
INR 67 Crores
(US$ 10.3 mn)
106
180
Collection Methodology Escrow Mechanism
Security Coverage > 1.5x of specific security
Debt Service Coverage Charge on receivables
3.5 years
*Calculated on residual maturity

Operational and Financial Performance
27

Credit Rating
• Fixed Deposit has been rated “FAAA” by CRISIL and “AAA” by CARE. The rating of “FAAA”
and “AAA” indicates “High Safety” with regards to the repayment of interest and principal.
• Commercial Paper is rated at “A1(+)” by CARE & CRISIL and Non-Convertible Debenture
(NCD) are rated at “AAA” by CARE, “AAA” by India Ratings, “AA+” by CRISIL and “AA+” by
ICRA
• Bank Loans Long Term Rating is rated at “AAA” by CARE and ‘’AA+’’ by CRISIL
28
Total Borrowing
(INR Crore)
Access to a Diverse Base of Funding
1 Crore = 10 million
Well Diversified Borrowing Profile
Relationships with multiple lending partners
22 Mutual Funds
29 Pension Funds
41 Insurance
Companies
2 Multilateral Agencies
31 Banks
654 Provident
Funds
Over 58,000 Unique
Fixed Depositors
4 Foreign Portfolio
Investors
26.70%35.90% 40.90% 41.14%
9.60%
19.20% 12.30%19.16%29.20%
27.20% 28.00%21.35%
10.60% 7.90% 7.70% 7.17%
7.40%
20.30%
8.47%6.90%
31-Mar-1631-Mar-15 31-Mar-17
16,751 54,268
2.70%
31-Mar-18
35,65726,159
4.20%2.30%
3.60%
Bank Term Loans ECBsNHB Refinance NCDDeposits CP

29
Average Cost of BorrowingsAverage Yield
Spread Net Interest Margins
Margin Analysis
2.97%
FY18FY17FY16
3.10%
FY15
2.98% 3.07%
FY17
10.07%10.76%
FY16 FY18
11.65% 11.25%
FY15
9.07%
FY15 FY18FY16
9.42%
FY17
8.55%7.71%
FY18FY15
2.23%
FY17
2.18% 2.21%
FY16
2.36%
Ratios are calculated on Monthly Average

30
Cost to Income RatioOpex to ATA Ratio
Return on Asset Return on Equity
Operating Leverage playing out with Better Return Profile
FY17*
14.92%16.08%
FY16 FY18
17.12%
14.00%
FY15
0.83%
FY18FY17FY16
0.73%0.68%
0.98%
FY15
19.54%
30.87%
FY15
22.43%
FY17 FY18FY16
25.15%
FY18
1.37%
FY17FY16FY15
1.54%1.46%
1.28%
Ratios are calculated on Monthly AverageOpex to ATA is calculated as Operating Expenditure(Employee Cost + Other Expenses + Depreciation - Acquisition Cost - CSR cost)/Average Total Assets as per Balance sheetCost to Income Ratio is calculated as Operating Expenditure(Employee Cost + Other Expenses + Depreciation - Acquisition Cost - CSR cost) / (Net Revenue-Acquisition Cost)Return on Asset is on Average Total Assets as per Balance sheet* Capital of INR 3,000 Crore raised through IPO of 3,87,19,309 fresh equity shares

31
Loans Outstanding / EmployeeDisbursement / Employee
Total Revenue / Employee Profitability / Employee
Employee Efficiency
0.72
0.62
0.48
0.36
FY16 FY18FY17FY15
28.99
24.2521.23
17.16
FY15 FY17 FY18FY16
49.7945.28
39.91
30.58
31-Mar-1831-Mar-1731-Mar-15 31-Mar-16
4.824.59
3.96
3.23
FY15 FY18FY17FY16
Calculated on average number of employee for the Year1 Crore = 10 million
(INR Crore)

32
Return to Shareholders
49.8
36.7
27.524.4
FY15 FY18FY17FY16
9.0
6.0
3.43.0
FY15 FY18FY16 FY17
Book Value Per Share (INR)
Earnings Per Share (INR) Dividend Per Share (INR)
378.5336.7
169.1152.3
31-Mar-15 31-Mar-1831-Mar-1731-Mar-16

Maintaining Prudence…
33

(INR Crore)
34
Data as on 31-Mar-18
1 Crore = 10 million
17,98017,324
10,442
18,056
19,642
23,442
9,178
11,540
Upto 1 yr 1-3 yrs 3-5 yrs Over 5 yrs
Assets Liabilities
with balanced Asset Liability maturity profile

35
Capital to Risk Asset Ratio
Average Gearing (x)
Ratio is calculated on Monthly Average
7.608.72
10.7710.73
31-Mar-1831-Mar-15 31-Mar-1731-Mar-16
and adequate Capital & Comfortable Gearing
16.69%
21.62%
16.48%
5.14%
12.70%
12.77%
3.92%
9.04%
3.66%
31-Mar-16 31-Mar-1731-Mar-15 31-Mar-18
13.76%
10.41%
3.35%
Tier 2 Tier 1

Shareholding
36

37
Shareholding
Top Shareholders
General Atlantic Singapore Fund, Birla
Sunlife MF, Motilal Oswal MF, Wasatch,
T.Rowe Price, Fidelity, Reliance MF,
Invesco, Malabar Investments
33.0%
37.3%
16.3%
6.5%
4.0%1.9% 1.0%
Shareholding as on 31-Mar-18
Promoters Quality Investment Holdings
Foreign Inst. Investors Mutual Funds
Public & Others Bodies Corporates
Financial Institutions / Banks
Outstanding Shares – 16,65,86,482

Detailed Financials
38

Profit & Loss Statement
39
1 Crore = 10 million
* Q4 FY18 & FY18 numbers are on consolidated basis
Particulars (INR Crore) Q4 FY18* Q4 FY17 Y-o-Y Q3 FY18 Q-o-Q FY18* FY17 Y-o-Y
Interest Income 1,468.6 1,010.6 45.3% 1,335.7 10.0% 5,123.4 3,678.5 39.3%
Fee & Other Operating Income 101.4 65.3 102.8 393.0 229.2
Other Income 0.2 0.1 0.1 0.6 0.2
Total Revenue 1,570.2 1,076.0 45.9% 1,438.6 9.2% 5,517.0 3,907.9 41.2%
Expenditure:
Finance Cost 1,016.8 677.9 925.0 3,530.8 2,643.7
Employee Benefit Expenses 40.2 27.6 34.9 137.1 101.3
Other Expenses 119.4 57.4 82.1 347.4 237.4
Depreciation Expense 7.0 4.8 6.8 24.1 18.6
Provisions and Write-Offs 44.4 66.7 56.1 198.8 102.9
Total Expenditure 1,227.9 834.3 47.2% 1,104.8 11.1% 4,238.3 3,103.8 36.6%
Profit Before Tax 342.3 241.6 333.9 1,278.7 804.0
Tax Expenses 123.1 89.2 116.4 449.3 280.3
Net Profit After Tax 219.2 152.4 43.8% 217.5 0.8% 829.4 523.7 58.3%
EPS (Basic) 13.2 9.2 13.1 49.8 36.7

40
Particulars (INR Crore) 31-Mar-18* 31-Mar-17
Equity and Liabilities
Shareholder's Funds 6,305.5 5,577.3
Share Capital 166.6 165.6
Reserves and Surplus 6,139.0 5,411.7
Non-Current Liabilities 36,988.2 24,477.2
Long-Term Borrowings 36,388.7 24,084.0
Deferred Tax Liabilities (Net) 57.7 46.9
Other Long-Term Liabilities 142.0 103.9
Long-Term Provisions 399.8 242.5
Current Liabilities 20,505.1 12,905.1
Short-Term Borrowings 14,242.0 7,947.4
Short-Term Provisions 44.2 28.0
Trade Payables 121.3 93.6
Other Current Liabilities 6,097.7 4,836.1
Total 63,798.8 42,959.6
Particulars (INR Crore) 31-Mar-18* 31-Mar-17
Assets
Non-Current Assets 55,834.3 37,744.0
Fixed Assets 85.8 60.4
-Tangible Assets 59.0 47.8
-Intangible Assets 17.1 10.6
-Capital Work-in-Progress 9.7 2.0
Non-Current Investments 1,161.4 961.4
Loans and Advances 54,121.8 36,443.8
Other Non-Current Assets 465.3 278.4
Current Assets 7,964.6 5,215.6
Current Investments 1,218.5 2,318.2
Cash and Bank Balances 2,816.9 151.5
Short-Term Loans and
Advances81.0 39.9
Other Current Assets 3,848.1 2,705.9
Total 63,798.8 42,959.6
Balance Sheet
1 Crore = 10 million*31-Mar-18 numbers are on consolidated basis

Saksham – Contributing to the Society
41

42
Glimpses of Social Interventions
Enhancing Human Potential
• Partnered with The Confederation of Real Estate Developers
Association of India (CREDAI) to conduct Onsite & Offsite skill
enhancement training programmes for construction workers
Reaching Out, Reaching Far
• Collaborated with various NGOs and real estate developers to
establish 32 day care centres on various construction sites for
children of construction workers to provide them with education,
hygiene and nutrition
Investing in Education
• Partnered with VIDYA, a NGO working for the underprivileged
children
• Adopted two schools with VIDYA to provide quality education to
the underprivileged children
Improving Access to Health Care
• Supported two government hospitals with an aim to improve
infrastructure
• Supported operational cost to run cancer patient helpline and
outreach clinic for the patients
• Launched a reproductive health and hygiene programme for
young adolescent girls in four villages in UP
Touched 15,000 lives during the year

43
winning Awards & Accolades
PNB Housing Penguin TV Commercial has bagged the Gold Award at FICCI’s Best Animated Frames (BAF) Awards
2018.
Conferred as the ‘Best Housing Finance Company of the Year’ by ET Now Rise with India – BFSI Awards. This is a
testament to our persistent efforts towards realizing the dreams of our fellow citizens of owning a home is on the right path.
Recognized as ‘Symbol of Excellence in the BFSI Sector’ at The Economic Times Best BFSI Brands 2018.
“Leading Housing Finance Company 2017” at National Awards for Best Housing Finance Companies organized by CMO
Asia in Nov, 2017.
Won bronze award at Outdoor Advertising Awards 2017, in the financial services category for its innovative outdoor
campaign executed during the IPO.
Bagged silver award from ABCI (Association of business communication of India) for our Annual Report of FY17.
Mr. Nitant Desai (Chief Centralized Operation & Technology Officer) has been awarded amongst Top 100 CIOs of India.
Our IPO has been awarded “IPO of the Year” by Finance Monthly Magazine (M&A Award)- A leading international
business publication. This award is a testimony of investor confidence in our Organization and recognition of ‘Kshitij
– Our transformation journey’.
Awarded ‘Excellence in Customer Relation’ at GIHED CREDAI Property Show 2017. This award testaments our
belief in customer relations.
Certified as a “Great Place to Work” second year in a row. This is testament to our work culture which is based on our core values
and on the tenants of Trust, Pride and Camaraderie.

Strong Management Team…
44

45
with Extensive Industry Experience…
Age : 46 Years
No. of Years with
PNBHF : 6 Years
Prior Engagements :
IndusInd Bank
ABN AMRO Bank NV
ICICI Bank Limited
Age : 45 Years
Prior Engagements :
Xander Finance, Au Small Finance Bank, ICICI Prudential Life Insurance, Deutsche Bank
Age : 52 Years
No. of Years with
PNBHF : 6 Years
Prior Engagements :
Religare Finvest Ltd
GE Money Indiabulls
Financial Services
Shaji Varghese
ED - Business Development
Kapish Jain
Chief Financial Officer
Ajay Gupta
ED - Risk Management
Age : 56 Years
No. of Years with
PNBHF : 7 Years
Prior Engagements :
HDFC Standard Life
Insurance, Union National
Bank, ICICI Bank
Age : 54 Years
No. of Years with
PNBHF : 23 Years
Prior Engagements :
Ansal Group
Age : 51 Years
No. of Years with
PNBHF : 7 Years
Prior Engagements :
ARMS (Arcil)
Indian Army
Nitant Desai
Chief Centralised Operation &
Technology Officer
Sanjay Jain
Company Secretary & Head
Compliance
Anshul Bhargava
Chief People Officer
Sanjaya Gupta
Managing Director
Age : 55 Years
No. of Years with PNBHF : 8 Years
Prior Engagements : AIG, ABN Amro Bank N.V. and HDFC Limited

under the Aegis of a Highly Experienced Board
46
Sunil Mehta
Chairman – Non Executive
Age:
58 Years
Current Position:
MD & CEO of PNB
Sunil Kaul
Non Executive Director
Age:
58 Years
Current Position:
MD, Carlyle
Head, SE Asia, FIG,
Carlyle
Shital Kumar Jain
Independent Director
Age:
78 Years
Current Position: Ex
Banker & Credit
Head India, Citigroup
Nilesh S. Vikamsey
Independent Director
Age:
53 Years
Current Position:
Sr. Partner, Khimji
Kunverji and Co
President-ICAI
Sanjaya Gupta
Managing Director
Age:
55 Years
Current Position:
MD, PNB Housing
Finance
Ashwani Kumar Gupta
Independent Director
Age:
63 Years
Current Position:
Financial Consultant
Gourav Vallabh
Independent Director
Age:
40 Years
Current Position:
Professor of Finance,
XLRI
Shubhalakshmi Panse
Independent Director
Age:
64 Years
Current
Position:
Ex-Banker, CMD,
Allahabad Bank
R Chandrasekaran
Independent Director
Age:
60 Years
Current Position:
Founder and Executive
Vice Chairman,
Cognizant
Jayant Dang
Independent Director
Age:
68 Years
Current Position:
Financial Consultant

47
Corporate Governance
Audit Committee (ACB)
It has 3 members, all are independent directors
Nomination and Remuneration Committee (NRC)
Corporate Social Responsibility Committee (CSR)
Credit Committee of the Board (CCB)
It has 3 members, 2 are independent directors and 1 is a non-executive director
It has 3 members, 1 is independent director, 1 is non-executive director and Managing Director
It has 3 members, 2 are independent directors and Managing Director
Risk Management Committee (RMC)
It has 5 members, 3 are independent directors, 1 non-executive director and Managing Director
Stakeholders Relationship Committee (SRC)
It has 3 members, 2 are independent directors and Managing Director
Board of Directors
It has 10 members, 2 are non-executive directors, 7 are independent directors and Managing Director

48
Key Takeaways
Strong Distribution
Network and Robust
TOM
Strong distribution
network with pan India
presence and over
13,000 channel partners
across India
Growth in
Loan Book
5th largest by Loan Assets(1) and 2nd largest by
deposits
Loan Assets of INR 57,014
Crore(2)
One of the Lowest
NPA’s amongst
HFC’s
Robust Asset Quality
with one of the lowest
GNPAs at 0.33(2)
Efficient
Borrowing Mix
Diverse and cost
effective funding mix
with average cost of
borrowing at 7.71%(3)
Improving Cost to
Income Ratio
Operating leverage
playing out, thereby
improving our C/I Ratio
1. Source: : ICRA Indian Mortgage Finance Market Update for 9MFY2018
2. As of 31-Mar-18
3. Data for FY17-18

Annexure
49

50
Glossary
ATA Average Total Assets
ATS Average Ticket Size
AUM Asset Under Management
BVPS Book Value per Share
C/I Cost to Income
CRAR Capital to Risk Asset Ratio
CP Commercial Paper
CTL Corporate Term Loan
DPS Dividend per Share
DSA Direct Selling Agents
ECB External Commercial Borrowing
EPS Earning Per Share
GNPA Gross Non-Performing Asset
HFCs Housing Finance Companies
LAP Loan against Property
LRD Lease Rental Discounting
NCDs Non-Convertible Debentures
NII Net Interest Income
NIM Net Interest Margin
NNPA Net Non-Performing Asset
NPA Non-Performing Asset
NRPLs Non-Residential Premises Loans
PAT Profit After Tax
PCR Provision Coverage Ratio
ROA Return on Asset
ROE Return on Equity

51
Formulas
Ratios Formulas Used
Average Borrowings (%) Interest Expense / Average Borrowings
Average Gearing Ratio (x) Average Borrowings / Average Net worth
Average Yield (%) Interest Income on Loans / Average Loan Assets
Cost to Income (%)Operating Expenditure(Employee Cost + Other Expenses + Depreciation - Acquisition
Cost - CSR cost) / (Net Revenue-Acquisition Cost)
NII (INR) Interest Income - Interest Expenses
NIM (%) NII / Average Earning Assets
Opex to ATA (%)Operating Expenditure(Employee Cost + Other Expenses + Depreciation - Acquisition
Cost - CSR cost)/Average Total Assets as per Balance sheet
PCR (%) Standard Asset, NPA and Provision for contingency as a % of GNPA
ROA (%) Profit After Tax / Average Total Assets
ROE (%) Profit After Tax / Average Net worth
Spread (%) Average Yield - Average Cost of Borrowings
Ratio is calculated on Monthly Average

Thank You
Company:
PNB Housing Finance Limited
CIN: L65922DL1988PLC033856
Ms. Deepika Gupta Padhi (Head-Investor Relations)
Phone: +91 11 23445214
www.pnbhousing.com