Embed Size (px)
Citation preview

Investor Relations Presentation June, 2019.

AGENDA1) COMPANY OVERVIEW2) COMPETITIVE ADVANTAGENS3) MAIN BUSINES DIVISIONS
1. CAR RENTAL2. FLEET RENTAL3. SEMINOVOS
4) FINANCIALS5) EARNINGS RELEASE 1Q19

1973
Founded in Belo Horizonte with 6 VW
Beetles
1979
Expasion to 11 capital cities
becoming marketleader in 1981
1984
Expansionstrategy
by adjacencies: Franchising
1991
Expansion strategyby adjacencies:
Seminovos
1992
Internationalizationthrough Franchising
1997
PE firm DL&J entersat a market cap of
US$150 mm
1999
Expansion strategyby adjacencies:
Fleet Rental
2005
IPO with a Market Capof US$295 mm
2014
Beginning ofDigital Transformation
2017
Strategic partnership withHertz -
Phase I: Rise to #1 Phase II: ExpansionPhase III:
Reaching ScalePhase IV: Digital Transformation
COMPANY HISTORY:MILESTONES
20182006
50,000 cars
2011
100,000 cars
150,000 cars
+248,000 cars
1982
1.000 carsFollow-on:
R$1,8 billion
3
2019
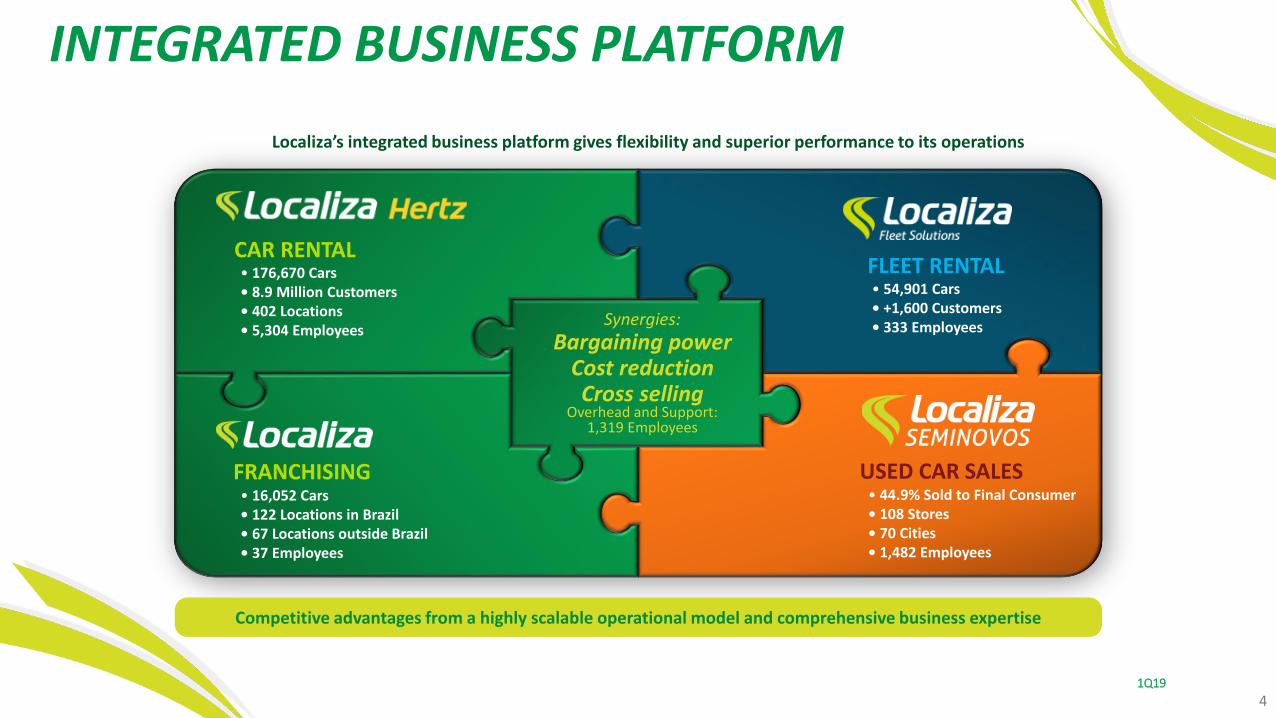
Localiza’s integrated business platform gives flexibility and superior performance to its operations
• 176,670 Cars• 8.9 Million Customers• 402 Locations• 5,304 Employees
CAR RENTAL
FRANCHISING• 16,052 Cars• 122 Locations in Brazil• 67 Locations outside Brazil• 37 Employees
Synergies:
Bargaining powerCost reductionCross selling
Overhead and Support:1,319 Employees
USED CAR SALES• 44.9% Sold to Final Consumer• 108 Stores• 70 Cities• 1,482 Employees
FLEET RENTAL• 54,901 Cars• +1,600 Customers• 333 Employees
Competitive advantages from a highly scalable operational model and comprehensive business expertise
INTEGRATED BUSINESS PLATFORM
1Q19
4

COMPANY:BUSINESS PLATFORM DIVISIONS
5
1
CAR RENTALFRANCHISING FLEET RENTAL USED CAR SALES
CONTRIBUTES TO EXPANSION OF LOCALIZA’S NETWORK
AND ITS BRAND AWARENESS
OUTSOURCES FLEET FOR 2-3 YEARS CONTRACTS
RENTS TO INDIVIDUALS AND COMPANIES AT AIRPORTS AND OTHER LOCATIONS
SELLS THE USED CARS AFTER THE END OF CARS’ SERVICES AS
RENTAL CARS AND ESTIMATES THE RESIDUAL VALUES
• HIGH FIXED COST STRUCTURE
• STANDARDIZED FLEET
• 1 YEAR CYCLE
• HIGHER ENTRY BARRIERS
• GAINS OF SCALE
• CAPITAL INTENSIVE
• CONCENTRATED AIRPORT MARKET
• FRAGMENTED OFF AIRPORT MARKET
• HIGH PROFITABILITY
• LOW CONTRIBUTION TO EARNINGS
• RESPONSIBLE TO DEVELOP NEW
MARKETS
• LOW FIXED COST STRUCTURE
• CUSTOMIZED FLEET
• 2-3 YEARS CYCLE
• LOWER ENTRY BARRIERS
• CAPITAL INTENSIVE
• EFFICIENCY AREA RESPONSIBLE TO SELL
CARS FROM RAC AND FLEET DIVISIONS
• KNOW HOW OF USED CARS MARKET
• REDUCE DEPENDENCE OF INTERMEDIATES
• ALLOWING FOR LOWER DEPRECIATION
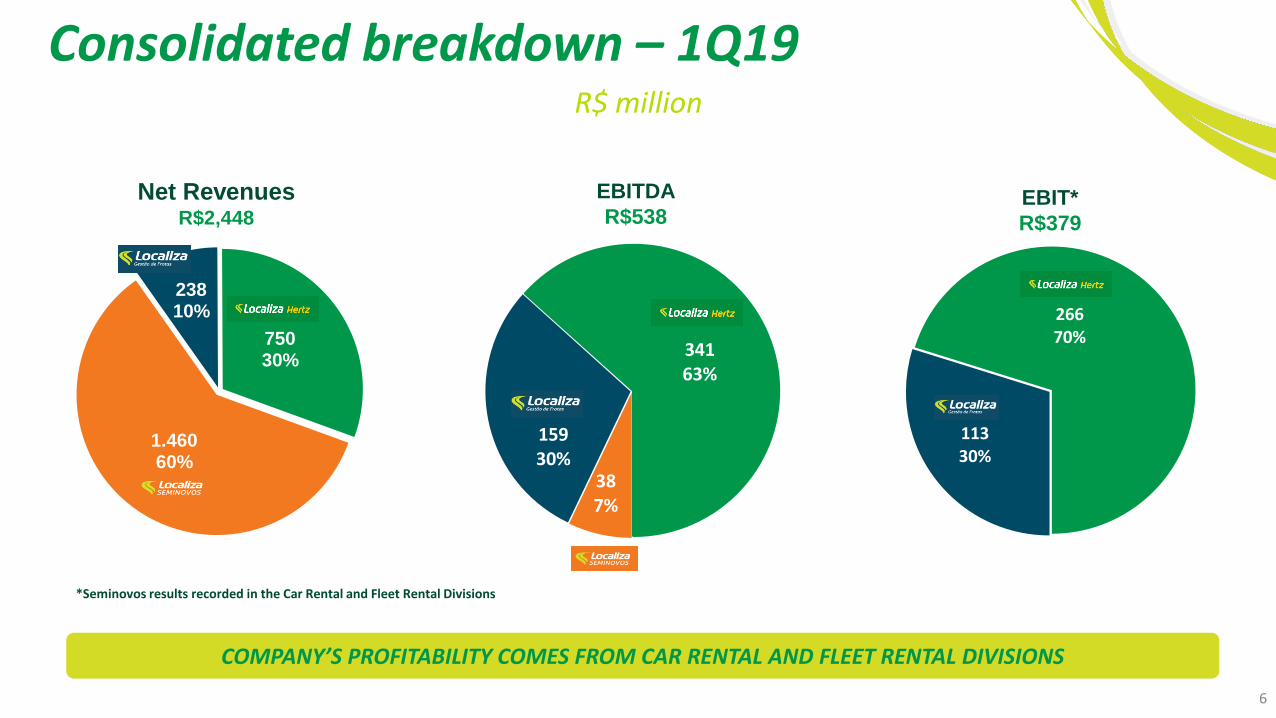
Net RevenuesR$2,448
EBITDA
R$538EBIT*
R$379
Consolidated breakdown – 1Q19R$ million
*Seminovos results recorded in the Car Rental and Fleet Rental Divisions
COMPANY’S PROFITABILITY COMES FROM CAR RENTAL AND FLEET RENTAL DIVISIONS
387%
15930%
34163%
11330%
26670%
1.460 60%
238 10%
750 30%
6

AGENDA1) COMPANY OVERVIEW2) COMPETITIVE ADVANTAGENS3) MAIN BUSINES DIVISIONS
1. CAR RENTAL2. FLEET RENTAL3. SEMINOVOS
4) FINANCIALS5) EARNINGS RELEASE 1Q19
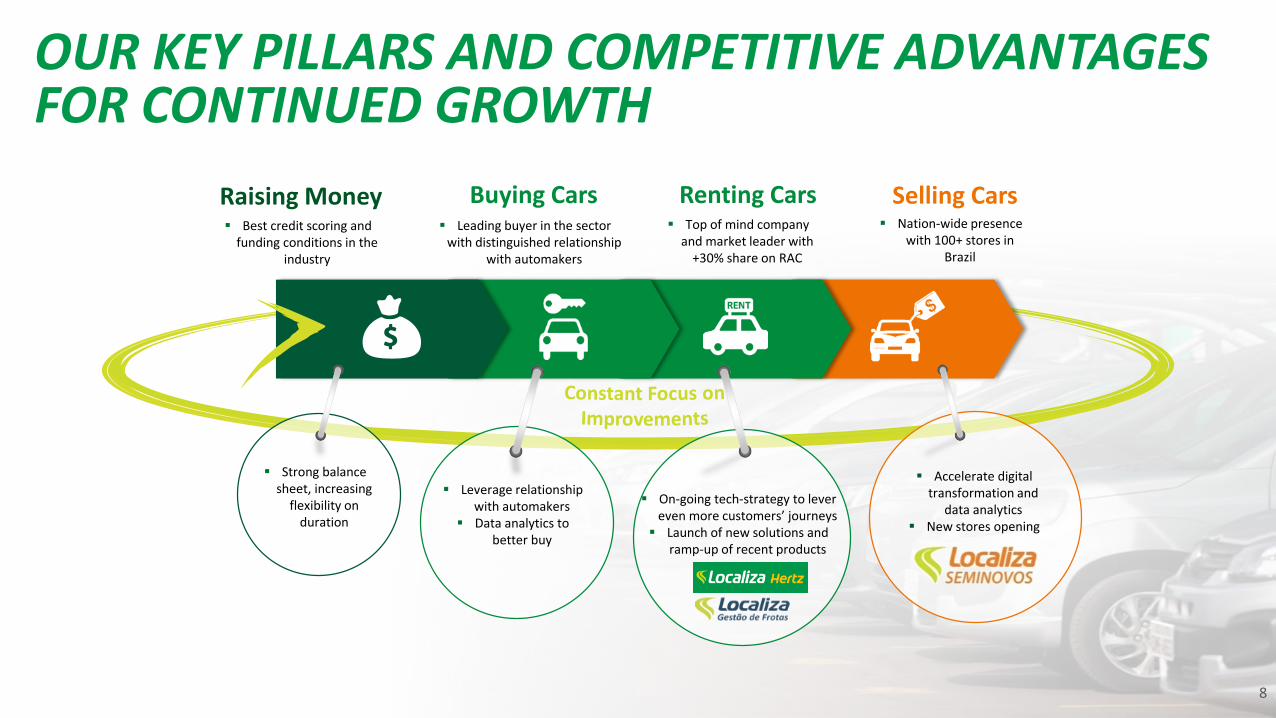
▪ Strong balance sheet, increasing
flexibility on duration
▪ On-going tech-strategy to lever even more customers’ journeys
▪ Launch of new solutions and ramp-up of recent products
▪ Accelerate digital transformation and
data analytics▪ New stores opening
▪ Leverage relationship with automakers
▪ Data analytics to better buy
Raising Money Renting Cars Selling CarsBuying Cars▪ Best credit scoring and
funding conditions in the industry
▪ Leading buyer in the sector with distinguished relationship
with automakers
▪ Top of mind company and market leader with
+30% share on RAC
▪ Nation-wide presence with 100+ stores in
Brazil
OUR KEY PILLARS AND COMPETITIVE ADVANTAGES FOR CONTINUED GROWTH
8
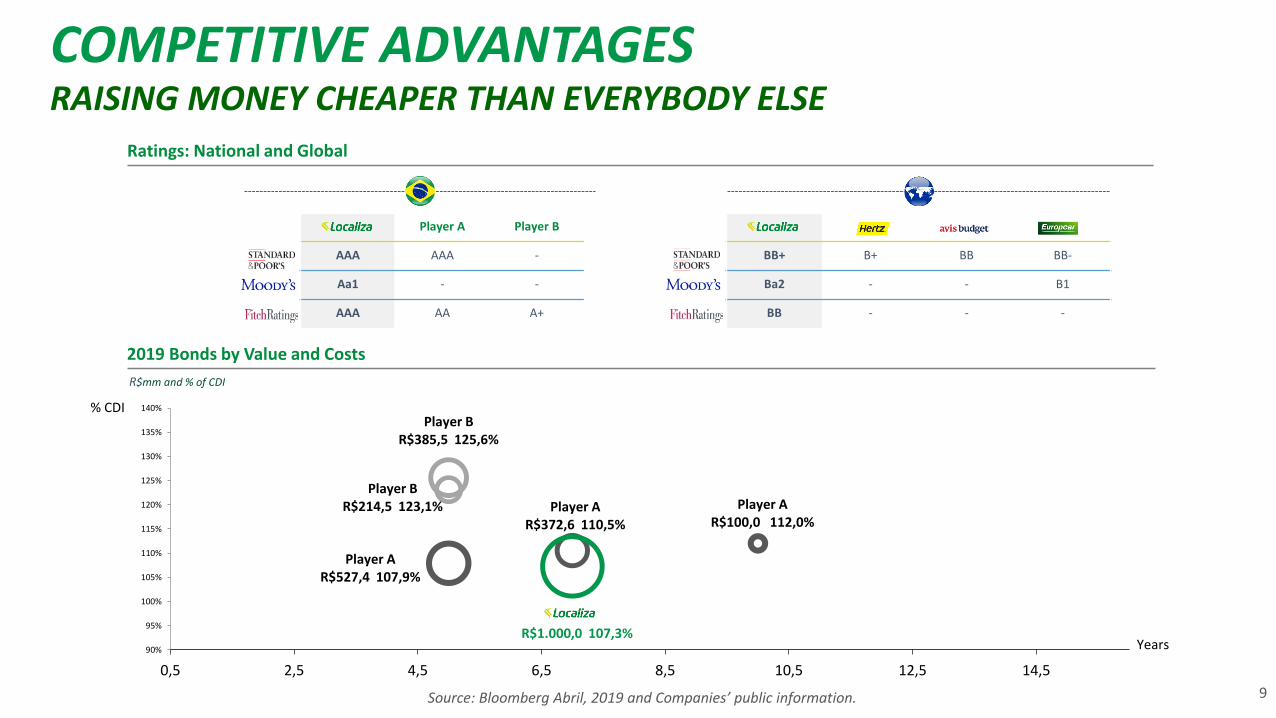
Player A Player B
AAA AAA -
Aa1 - -
AAA AA A+
BB+ B+ BB BB-
Ba2 - - B1
BB - - -
R$mm and % of CDI
2019 Bonds by Value and Costs
Ratings: National and Global
COMPETITIVE ADVANTAGESRAISING MONEY CHEAPER THAN EVERYBODY ELSE
% CDI
Player A R$527,4 107,9%
Player A R$372,6 110,5%
Player AR$100,0 112,0%
Player BR$214,5 123,1%
Player BR$385,5 125,6%
R$1.000,0 107,3%90%
95%
100%
105%
110%
115%
120%
125%
130%
135%
140%
0,5 2,5 4,5 6,5 8,5 10,5 12,5 14,5
Years
Source: Bloomberg Abril, 2019 and Companies’ public information. 9

64
170
2015 2018
73
56
170
Car RentalCompany A
Car RentalCompany B
Share in Brazilian Automakers’ Sales
% of total sales, 2018
Purchased Vehicles: Competitive Landscape
Thousand, 2018Thousand
Total Purchased Vehicles
COMPETITIVE ADVANTAGESBUYING CARS
LOCALIZA BUYS CARS WITH BETTER CONDITIONS DUE TO THE VOLUME OF PURCHASES.
Source: website of each company and ANFAVEA. 10
7,7%
2.3x 3.0x

Highly awarded and top of mind in the sector, Localiza has a solid presence throughout Brazil with its RAC division…
22nd Most Valuable
Brand in Brazil
Four-timeConsecutive Winner
Superior qualityCulture of delightingModern and diversified fleet
Awards
BestCar Rental Company
BestRental Company for SME
BestServices Company
# of Cities(1)
# of Locations(1)
Top of Mindin the Sector
3rd largest NPS over the
200 most well-rated companies
1st
COMPETITIVE ADVANTAGESRENTING CARS
Source: Companies, ABLANote: (1) As of 1Q19 for Localiza and according to each competitors` website as of December, 2018 11
210
187
524
397
Car Rental Competitors
358
139 97
Player A Player B

Tech
no
logy
Strong focus on improving client experience throughout the entire journey as the one-stop solution for fleet rental
Connected Fleet
✓ Whole fleet rental information available at any time
✓ Fleet monitoring reports with information to support decision-making process
Strategic information adding value to customers
Integrated applications to deliver a seamless experience
✓ User-friendly mobile applications connecting
users to fleet manager, enabling clients to rapidly
anticipate and address potential issues
✓ Integration of different platforms through an
omni-channel approach
✓ Ability to customize reports according to customers’ needs, with data such as vehicle age, accidents, mileage, maintenance history
• Improving traffic safety• Transparency in management• Content offer through lectures and courses• Cost reduction
• Consultancy, customized panels, results monitoring• Definition of indexes related to costs productivity and
safety
Good Practices
Security andcitizenship
Mobile Solutions
COMPETITIVE ADVANTAGENSFLEET RENTAL: ONE-STOP-SHOP FOR THE BEST CUSTOMERS JOURNEY
12

100+ used car stores
Online channel
70 cities in BrazilPresence in all regions
PA
MT
MS
MA
DF
GO MG
PI
BA
CE
SP
PR
RS
SC
ES
RJ
SE
AL
PE
RN
PB
AM
COMPETITIVE ADVANTAGESSELLING CARS
EFFICIENCY AREA TO REDUCE DEPRECIATION
Distribution70 cities in BrazilDigital sale
Sales final consumerLower depreciationLoyalty of costumers, generating good repurchase rates and indication
Big dataBest understanding of
costumer preference
Pricing estimate
- Depreciation /+ Residual Value
Input for car purchase
BufferAdditional fleet during peaks of demand
Selling cars
13

COMPETITIVE ADVANTAGESWITH OPERATIONAL EXCELLENCE
CAR PREPARATION
• Quality control of the cars delivered by OEM’S
• Car licensing
DELIVERY IN THE BRANCHES
• Transport tracking• Logistic management
optimization
OPERATING CAR
• Maintanance and repair• Traffic fines processing• Licensing renewal
CAR DECOMISSIONING
• Car checking • Preparation for sales• Transportation to
Seminovos stores
RAISING MONEY
BUYINGCARS
SELLINGCARS
RENTINGCARS
14

Localiza is focused on improving clients’ experience in line with recent trends in the car rental market towards tech
Chatbot®
✓ Facebook / messenger✓ booking assistant
Anti fraud
✓ Tailor-made solution for fraud prevention in car rentals
Enterprise WhatsApp
✓ Booking and customer assistance channels via Whatsapp
NEW
Digital and Self Check-in
✓ Automatic capture of the driver’s license for new costumers and expedited check-in
Connected Fleet
✓ Integrated technology solution that increases competitive intelligence and leverages productivity gains
Mobile Solution
✓ Integrated mobile solution to fleet rental services for driver and contract manager
Online Fleet Rental
✓ Fast diagnosis and friendly dashboard for fleet manager
Rent a Car Fleet Rental
Localiza FAST
✓ Mobile-based counter bypass. Customers can pickup car bypassing our counter
Localiza Driver
✓ Digital solution for ride-hailing drivers
NEWYield Management
✓ Dynamic pricing system for rental, maximizing profitability
Data Analytics✓ Usage of Big Data to customize
and optimize fleet mix, pricing and operations of each used car store
Back Office Technology✓ Automated back office system to
streamline operations and improve efficiency
Used Cars Sales
Localiza is in the forefront of innovation in its industry, bringing several pioneer digital solutions
... AND INNOVATION
15

R$40.7
Average car price
(2 years)
Car sale revenue
net of SG&A
R$38.41 year cycle
1 2 3 4 5 6 7 8 9 10 11 12Expenses, interest and tax
Revenue
CAR RENTAL: FINANCIAL CYCLE 2018Per car
Total
1 year
R$ % R$ % R$
Net revenues 19.4 100.0% 41.2 100.0% 60.6
Costs - fixed and variable (9.1) -46.8% (9.1)
SG&A (3.4) -17.4% (2.8) -6.9% (6.2)
Net revenues of car sold 38.4 93.1% 38.4
Book value of car sold (37.3) -90.6% (37.3)
EBITDA 7.0 35.9% 1.1 2.5% 8.0
Cars Depreciation (1.0) -2.5% (1.0)
Others depreciation (0.2) -1.1% (0.1) -0.2% (0.3)
Financial expenses (2.0) -5.0% (2.0)
Taxes (1.7) -9.0% 0.5 1.3% (1.2)
Net Income (Loss) 5.0 25.8% (1.6) -3.8% 3.5
NOPAT 5.0
ROIC (it consideres only cars in capital invested) 12.2%
Cost of debt after taxes 5.0%
Car Rental Seminovos
Per car soldPer operating car
16

1 2 3 4 5 6 31 32 33 34 35 36Expenses, interest and tax
Revenue
Car sale revenue
net of SG&A
R$34.5
R$43.9
Average car price
(3 years)
3 year cycle
FLEET RENTAL: FINANCIAL CYCLE 2018Per car
Total
3 years
R$ % Seminovos % R$
Net revenues 57.3 100.0% 36.6 100.0% 94.0
Costs - fixed and variable (16.6) -29.0% (16.6)
SG&A (4.0) -7.0% (2.2) -6.1% (6.3)
Net revenues of car sold 34.4 93.9% 34.4
Book value of car sold (32.2) -87.9% (32.2)
EBITDA 36.7 64.0% 2.2 6.0% 38.9
Cars Depreciation (10.8) -29.5% (10.8)
Others depreciation (0.3) -0.6% (0.1) -0.3% (0.4)
Financial expenses (5.4) -14.7% (5.4)
Taxes (9.2) -16.1% 3.6 9.8% (5.7)
Net Income (Loss) 27.1 47.3% (10.5) -28.7% 16.6
Net Income (Loss) - per year 9.0 47.3% (3.5) -28.7% 5.5
NOPAT 6.9
ROIC (it consideres only cars in capital invested) 15.7%
Cost of debt after taxes 5.0%
Per operating car
Fleet Rental Seminovos
Per car sold
17

HIGHER SPREAD IN AN ACCELERATED GROWTH ENVIRONMENT
17,8% 17,0%15,4% 15,6%
12,9% 13,2%
8,0%9,5% 10,2%
7,6%
5,0% 4,9%
13,0%
4,9%
2014 2015 2016 2017 2018 1Q19 annualizedwithout IFRS 16
1Q19 annualized
ROIC Cost of debt after taxes
9.8p.p.
7.9p.p.
7.5p.p. 5.2p.p.8.0p.p.
ROIC considered each year´s effective income tax and social contribution rate
*
(*)Adjusted by the one-time costs incurred - Hertz Brasil acquisition and Franchisees incorporation
8.1p.p.8.3p.p.
18
ROIC VERSUS COST OF DEBT AFTER TAXES
AGENDA1) COMPANY OVERVIEW2) COMPETITIVE ADVANTAGENS3) MAIN BUSINES DIVISIONS
1. CAR RENTAL2. FLEET RENTAL3. SEMINOVOS
4) FINANCIALS5) EARNINGS RELEASE 1Q19

CAR RENTAL: MARKET SHAREGROSS REVENUE
Source: ABLA, considering the breakdown reported applied on the revenues
*Localiza’s market share includes revenues from franchisees in Brazil. There are no public data on the revenue of other players’ franchisees.
29,3% 32,3%37,7%
6,7%7,8%
9,2%11,8%13,9%
13,6%
52,2%46,0%
39,5%
2016 2017 2018
Localiza Player A Player B Others
MARKET SIZE2018: R$7.3 BILLION
MARKET SIZE2017: R$6.5 BILLION
MARKET SIZE2016: R$5.8 BILLION
20
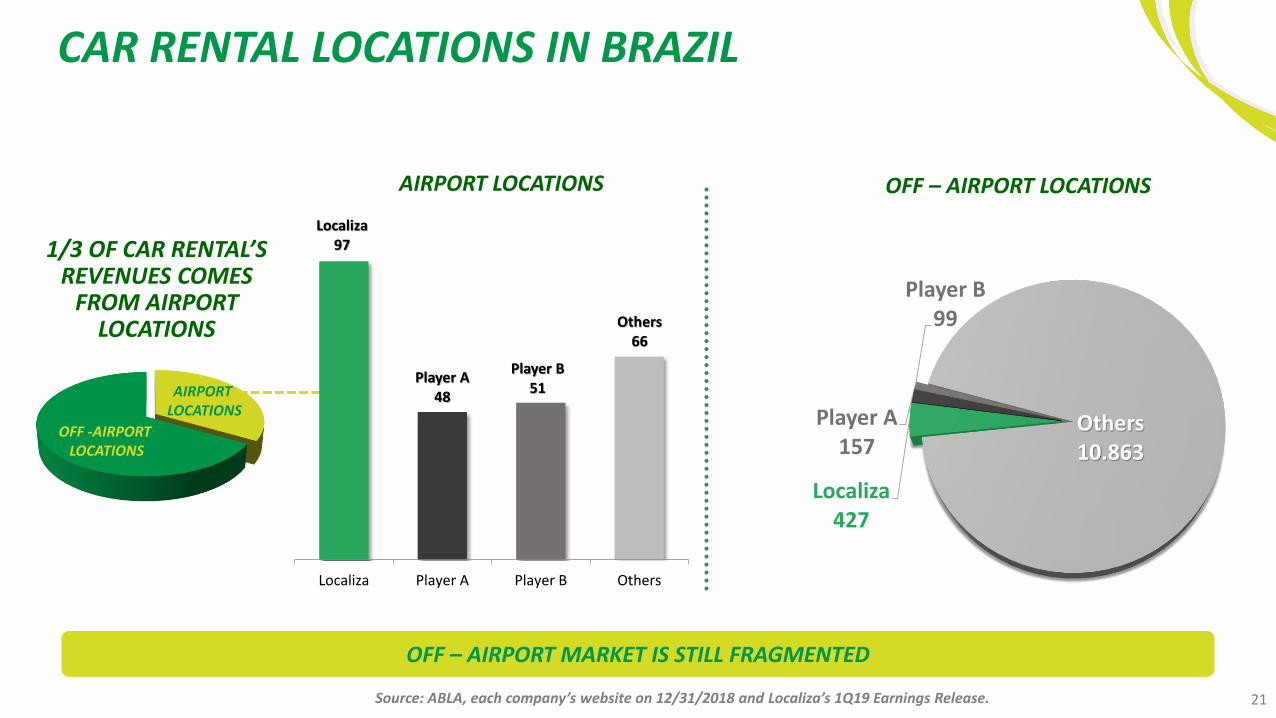
CAR RENTAL LOCATIONS IN BRAZIL
AIRPORT LOCATIONS OFF – AIRPORT LOCATIONS
Source: ABLA, each company’s website on 12/31/2018 and Localiza’s 1Q19 Earnings Release..
1/3 OF CAR RENTAL’S REVENUES COMES
FROM AIRPORT LOCATIONS
OFF -AIRPORT LOCATIONS
AIRPORT LOCATIONS
OFF – AIRPORT MARKET IS STILL FRAGMENTED
21
Localiza97
Player A48
Player B51
Others66
Localiza Player A Player B Others
Localiza427
Player A157
Player B99
Others10.863

CAR RENTAL AFFORDABILITY
Source: BCB and Localiza rates
Sources: IPEADATA, Localiza’s loyalty program and BCB as of 2016
*Considering that each credit card owner owns 1,3 credit cards, BCB estimated that were 84 million active credit cards in Brazil in 2016.
CAR RENTAL: DRIVERS
INCREASING AFFORDABILITY AND LOW PENETRATION BRINGS GROWTH OPPORTUNITIES.
3,1 3,8
4,3
5,7 6,4
7,6
8,9
2012 2013 2014 2015 2016 2017 2018
LOCALIZA RAC USERS (MILLION)*84,0
64,0
8,9
Credit Card owners Adult population (age>20years) Class A+B+C
Users
In million*considering only the individual segment.
180 200 240260
300 350 380 415 465 510 545622
678 724 788880
937 954
38% 37%35% 31%
27%22% 20% 18% 16% 15% 15% 13% 13% 12% 11% 9% 8% 8%
0
200
400
600
800
1000
1200
2001 2002 2003 2004 2005 2006 2007 2008 2009 2010 2011 2012 2013 2014 2015 2016 2017 2018
Salário mínimo (R$) Preço diária/ salário mínimo (%)
22

AGENDA1) COMPANY OVERVIEW2) COMPETITIVE ADVANTAGENS3) MAIN BUSINES DIVISIONS
1. CAR RENTAL2. FLEET RENTAL3. SEMINOVOS
4) FINANCIALS5) EARNINGS RELEASE 1Q19

FLEET RENTAL: MARKET SHAREGROSS REVENUE - FLEET RENTAL
Source: ABLA, considering the breakdown reported applied on the revenues
8,3% 8,4% 10,8%4,4% 3,6%
12,9%5,5% 7,6%2,6% 2,6%
4,6%
79,2% 77,8%71,7%
2016 2017 2018
Localiza Player A Player C Player B Others
MARKET SIZE 2018: R$8.0 BILLION
MARKET SIZE 2017: R$9.0 BILLION
MARKET SIZE2016: R$8.0 BILLION
9.9% (Player B + Player C) 11.2% (Player B + Player C)
24

FLEET RENTAL: DRIVERS
Corporate fleet:5,000,000*
Total fleet:429,692**
54,901
BRAZILIAN MARKET
*Frost&Sullivan research **ABLA 2019
WORLD
8,6% 8,9%13,3%
16,5%
24,5%
37,4%
46,9%
58,3%
Source: Datamonitor for European countries and Localiza’s estimate for Brazil
LOW PENETRATION OF RENTED FLEET IN BRAZIL
25

AGENDA1) COMPANY OVERVIEW2) COMPETITIVE ADVANTAGENS3) MAIN BUSINES DIVISIONS
1. CAR RENTAL2. FLEET RENTAL3. SEMINOVOS
4) FINANCIALS5) EARNINGS RELEASE 1Q19
SEMINOVOS: NEW vs USED CAR MARKET (BRAZIL)
Source: Fenabrave for used cars, Anfavea for new cars (light and commercial cars) March 31,2019.
New cars
Used cars
TOTAL MARKET OF 12.2 MILLION CARS.
8,48,9 9,0
9,410,1 9,9 10,0
10,7 10,79,9
3,3 3,4 3,6 3,6 3,32,5
2,0 2,2 2,5 2,3
2010 2011 2012 2013 2014 2015 2016 2017 2018 1Q19annualized
Used cars New cars
2.5x2.5x2.6x
2.6x 3.1x 4.0x 5.0x 4.9x 4.3x
27
4.3x

SEMINOVOS: DRIVERS
VEHICLE DENSITY BY NATION AFFORDABILITY TO BUY CARS – AVERAGE PUBLIC PRICE
OF ECONOMIC CARS
AFFORDABILITY AND PENETRATION
Source: BCB and Localiza
Reference: for calculation was considered the cheapest car in our fleet
300 350 380 415
465
510 545 622
678 724
788 880
934 954 84
71 6961
5551 49
43 43 43 41 4147 47
-
10
20
30
40
50
60
70
80
90
-100
100
300
500
700
900
1.100
20052006200720082009201020112012201320142015201620172018
Minimum wage (R$) Minimum wages needed to buy a new car
Source: Ward’s Automotive; CIA World Factbook; JP Morgan Analysis
28
0,8
0,7 0,70,7
0,6 0,6 0,6 0,6 0,6 0,6 0,6 0,6 0,60,5
0,4
0,3 0,3
0,20,2
0,1 0,1
0,0

15.1%
Up to 3 years - 2018736,046
SEMINOVOS: CARS SALESOPERATING DATA
1.0%
Used cars – 201810,732,462
4.5%
Main players
Examples • Retailers • Dealers • Rental Operators
Points of sale • 48,545 (Fenauto) • 5,226 (Anfavea) • 146 (Unidas and Movida)
Source: Anfavea 2018 and Fenabrave 2018 / Companies website / Fenauto.
Brand new- 20182,470,053
29
AGENDA1) COMPANY OVERVIEW2) COMPETITIVE ADVANTAGENS3) MAIN BUSINES DIVISIONS
1. CAR RENTAL2. FLEET RENTAL3. SEMINOVOS
4) FINANCIALS5) EARNINGS RELEASE 1Q19
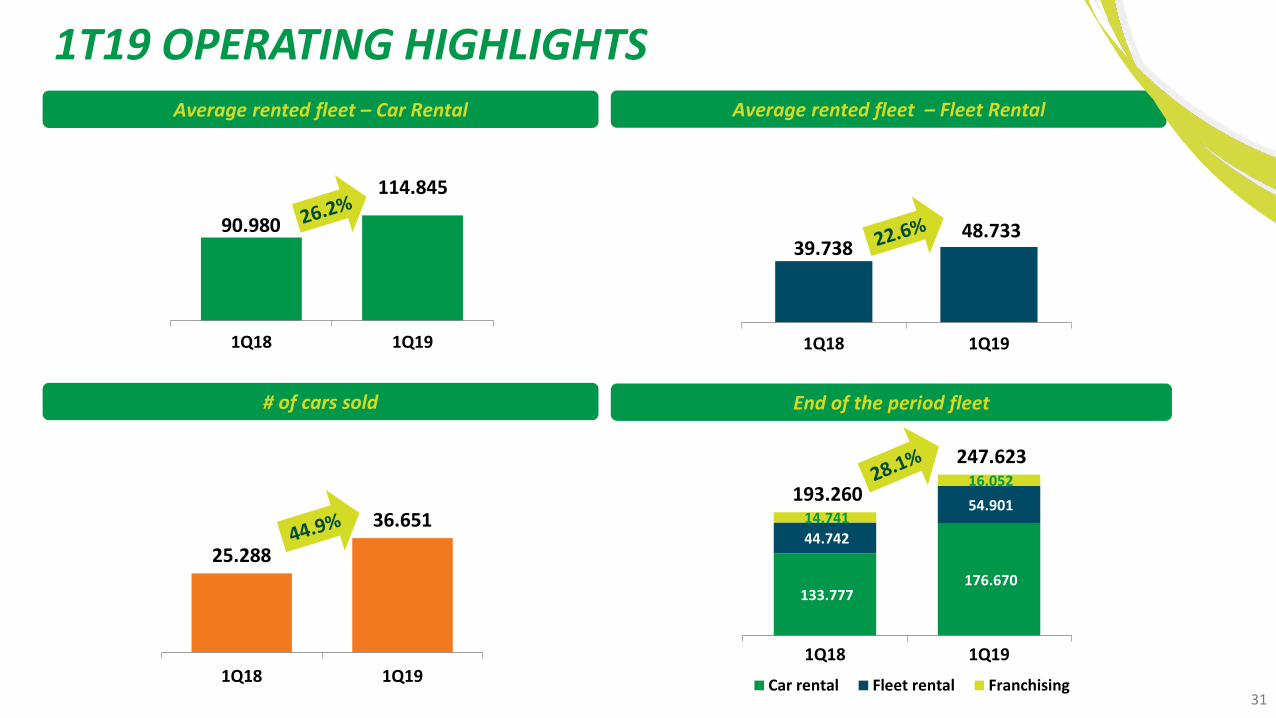
31
# of cars sold
Average rented fleet – Car Rental
End of the period fleet
Average rented fleet – Fleet Rental
1T19 OPERATING HIGHLIGHTS
133.777 176.670
44.742
54.901 14.741
16.052 193.260
247.623
1Q18 1Q19
Car rental Fleet rental Franchising
25.288
36.651
1Q18 1Q19
39.738 48.733
-
20.000
40.000
60.000
80.000
100.000
120.000
1Q18 1Q19
90.980
114.845
-
20.000
40.000
60.000
80.000
100.000
120.000
140.000
160.000
180.000
1Q18 1Q19

Net revenues (R$ million)
Net income (R$ million)EBIT (R$ million)
EBITDA (R$ million)
1T19 FINANCIAL HIGHLIGHTS
397,4498,5 538,2
1Q18 1Q19 without IFRS 16 1Q19
176,0216,3 210,8
1Q18 1Q19 without IFRS 16 1Q19
329,9370,2 378,6
1Q18 1Q19 without IFRS 16 1Q19
802,2 987,6
1.020,5 1.460,1
1.822,7
2.447,7
1Q18 1Q19Car Rental Seminovos
32

CAR RENTAL
1.284,4 1.258,0 1.428,0 1.848,5
2.519,4
594,7 744,3
2014 2015 2016 2017 2018 1Q18 1Q19
Average rented fleet
26.2% RAC GROWTH EVEN AT STRONG COMPARISON BASIS
42.999 43.315 51.515 69.762
97.245 90.980 114.845
2014 2015 2016 2017 2018 1Q18 1Q19
Net revenues (R$ million)
33

34
Average rental rate (in R$)
87,784,6
79,775,2 72,9 74,7 74,1
2014 2015 2016 2017 2018 1Q18 1Q19
Utilization rate (%)
75,4%78,0% 78,6% 79,6% 78,7% 79,8%
2015 2016 2017 2018 1Q18 1Q19
DECELERATION OF THE AVERAGE RENTAL RATE DECREASE IN A HIGHER LEVEL OF UTILIZATION RATE
CAR RENTAL
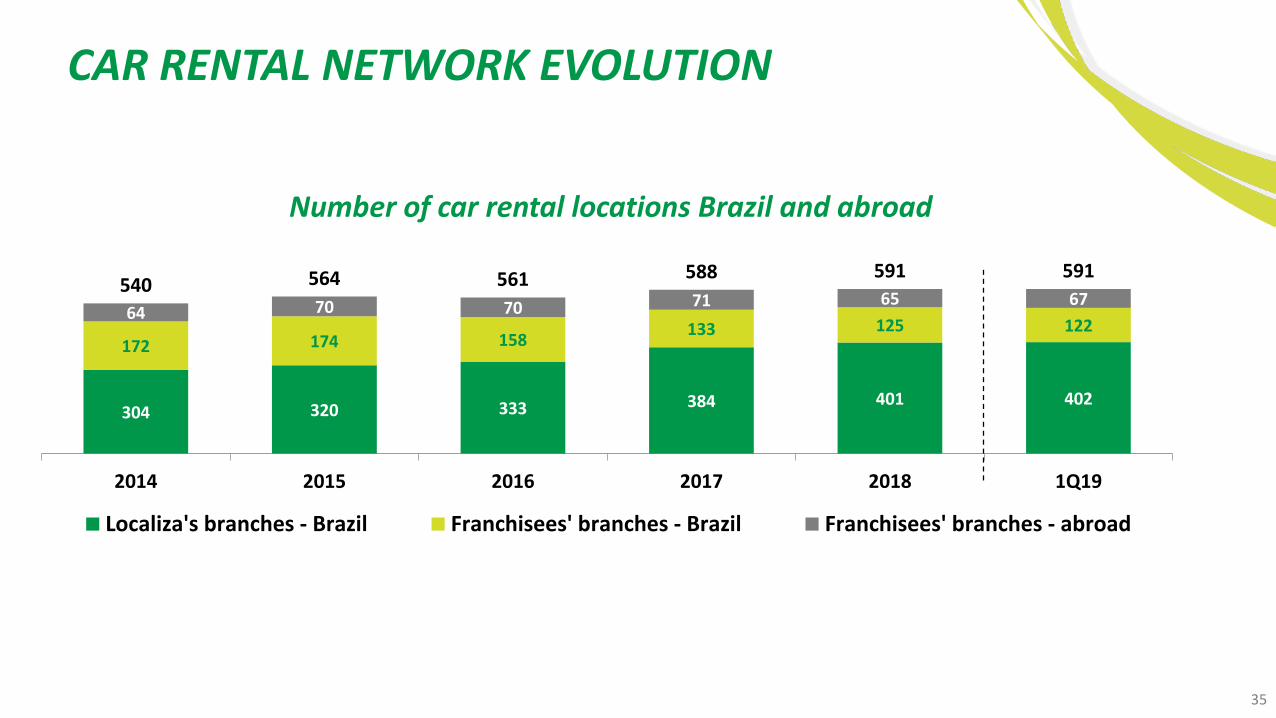
CAR RENTAL NETWORK EVOLUTION
Number of car rental locations Brazil and abroad
304 320 333 384 401 402
172 174 158133 125 122
64 70 70 71 65 67540 564 561 588 591 591
2014 2015 2016 2017 2018 1Q19
Localiza's branches - Brazil Franchisees' branches - Brazil Franchisees' branches - abroad
35

28.787 30.280 31.222 35.42442.321 39.738
48.733
-
10.0 00
20.0 00
30.0 00
40.0 00
50.0 00
60.0 00
2014 2015 2016 2017 2018 1Q18 1Q19
FLEET RENTAL Average rented fleet
COMERCIAL AND OPERATING EXCELENCE, ACCELERATING FLEET RENTAL GROWTH IN A HIGHLY COMPETITIVE SCENARIO
571,9 608,5 651,8 742,1
848,8
203,2 237,8
2014 2015 2016 2017 2018 1Q18 1Q19
Net revenues (R$ million)
36

NET INVESTMENT Car purchase and sales (quantity)
PURCHASES IN THE SAME LEVEL OF SALES IN A QUARTER AFTER HIGH PEAK SEASON
Net investment in fleet (R$ million)
Cars purchased Cars sold Hertz Brasil
Purchases (includes accessories) Used car sales net revenues Hertz Brasil
79.804 64.032
87.833
143.414 165.421
23.847 36.943
70.62164.305 68.449
90.554
111.279
25.288 36.651
2014 2015 2016 2017 2018 1Q18 1Q19
9,183
(273)19,384
135,252
8,162
52,860
2.483,22.278,4
3.289,6
5.753,6
6.981,8
933,81.595,2
2.018,2 2.044,92.342,5
3.451,2
4.510,4
1.020,5 1.460,1
2014 2015 2016 2017 2018 1Q18 1Q19
465.0233.5
947.1
5,467.9
285.7
2,302.4
54,142
2,471.4
(1,441)
(86.7)
292
135.1
37

38
NUMBER OF POINTS OF SALE
75 7784
99107
99108
70.621 64.305 68.449
90.554
111.279
25.288 36.651
-
20.0 00
40.0 00
60.0 00
80.0 00
100 .000
120 .000
140 .000
160 .000
0
20
40
60
80
100
120
140
2014 2015 2016 2017 2018 1Q18 1Q19
Points of sale Cars sold
MORE THAN 12,000 CARS SOLD PER MONTH ON AVERAGE IN 1Q19

39
END OF PERIOD FLEET
247,623 CARS IN OUR FLEET, STABLE IN COMPARISSON WITH LAST YEAR
(Quantity)
77.573 76.755 94.156 135.578
177.672 133.777
176.670 34.312 33.948 34.960
44.877
54.430
44.742
54.901
13.339 13.992 14.015
13.824
15.922
14.741
16.052
125.224 124.695143.131
194.279
248.024
193.260
247.623
2014 2015 2016 2017 2018 1Q18 1Q19
Car Rental Fleet Rental Franchising

40
CONSOLIDATED NET REVENUES(R$ million)
34.3% GROWTH IN 1Q19 NET REVENUES
1.874,0 1.883,1 2.096,8 2.607,1 3.385,3
802,2 987,6
2.018,2 2.044,9 2.342,5 3.451,2
4.510,4
1.020,5 1.460,1
3.892,2 3.928,0 4.439,3
6.058,3
7.895,7
1.822,7 2.447,7
2014 2015 2016 2017 2018 1Q18 1Q19
Rental Used car sales

41
CONSOLIDATED EBITDA(R$ million)
(*) It considers the new appropriation criteria of the overhead, which is also appropriated to Seminovos.(**) Adjusted by the one-time costs incurred - Hertz Brasil acquisition and Franchisees incorporation
EBITDA margin:
OPERATING LEVERAGE CHANGING THE MARGIN LEVEL IN RAC AND FLEET
Divisions 2014* 2015 2016 2017** 2018 1Q18 1Q19 without IFRS 16
1Q19 with
IFRS 16
Car Rental 38.7% 31.8% 32.3% 34.9% 35.9% 35.7% 41.9% 45.3%
Fleet Rental 60.0% 62.2% 64.5% 61.9% 64.0% 61.3% 66.9% 66.9%
Rental Consolidated 45.3% 41.7% 42.3% 42.6% 43.0% 42.2% 48.0% 50.6%
Used Car Sales 6.0% 7.3% 5.5% 5.9% 3.0% 5.7% 1.7% 2.6%
969,8 934,8 1.015,6
1.314,2
1.590,1
397,4498,5 538,2
2014 2015 2016 2017 OTC Hertz 2018 1Q18 1Q19 without IFRS 16 1Q19

42
AVERAGE ANNUALIZED DEPRECIATION PER CAR(In R$)
Fleet Rental
Car Rental
LOWER NEW CAR PRICES IMPACTING THE USED CAR PRICES WITH HIGHER DEPRECIATION, ALREADY REFLECTED IN 1Q19
1.270,0
622,1
1.251,2 1.250,11.012,4
1.610,5
2014 2015 2016 2017 2018 1Q19
4.202,1 3.935,2 3.714,03.104,3
3.601,14.326,5
2014 2015 2016 2017 2018 1Q19

43
CONSOLIDATED EBIT(R$ million)
(*) Adjusted by the one-time costs incurred - Hertz Brasil acquisition and Franchisees incorporation
EBIT MARGINS IMPACTED BY HIGHER DEPRECIATION
726,7 735,5 771,1
1.043,1
1.254,6
329,9 370,2 378,6
2014 2015 2016 2017 OTC Hertz 2018 1Q18 1Q19 withoutIFRS 16
1Q19
Divisions 2014 2015 2016 2017* 2018 1Q181Q19 without
IFRS 161Q19 with
IFRS 16
Car Rental 36.2% 34.3% 30.2% 35.5% 33.2% 38.8% 34.1% 35.2%
Fleet Rental 44.3% 48.9% 51.2% 51.4% 48.6% 48.0% 47.6% 47.6%
Consolidated 38.8% 39.1% 36.8% 40.0% 37.1% 41.1% 37.5% 38.3%
EBIT Margin:

44
CONSOLIDATED NET INCOME(R$ million)
(*)Adjusted by the one-time costs incurred - Hertz Brasil acquisition and Franchisees incorporation
RECORD NET INCOME OF R$216.3 (EX-IFRS 16)
410,6 402,4 409,3
563,4659,2
176,0216,3 210,8
2014 2015 2016 2017 OTC Hertz 2018 1Q18 1Q19 without IFRS 16 1Q19
Reconciliation EBITDA x Net income 2014 2015 2016 2017* 2018 Var. R$ Var. % 1Q181Q19
withoutIFRS 16
Var. R$ Var. %1Q19 with
IFRS 16
Consolidated EBITDA 969.8 934.8 1.015.6 1,314.2 1,590.1 275.9 21.0% 397.4 498.5 101.1 25.4% 538.2
Cars depreciation (207.4) (163.6) (206.3) (232.0) (291.6) (59.6) 25.7% (56.9) (117.1) (60.2) 105.8% (117.1)
Other property depreciation and amortization (35.7) (35.7) (38.2) (39.1) (43.9) (4.8) 12.3% (10.6) (11.2) (0.6) 5.7% (42.5)
EBIT 726.7 735.5 771.1 1,043.1 1,254.6 211.5 20.3% 329.9 370.2 40.3 12.2% 378.6
Financial expenses, net (151.1) (202.7) (243.5) (315.0) (368.9) (53.9) 17.1% (88.9) (89.6) (0.7) 0.8% (105.2)
Income tax and social contribution (165.0) (130.4) (118.3) (164.7) (226.5) (61.8) 37.5% (65.0) (64.3) 0.7 (1.1%) (62.6)
Net income of the period 410.6 402.4 409.3 563.4 659.2 95.8 17.0% 176.0 216.3 40.3 22.9% 210.8

FREE CASH FLOW
45
In the free cash flow, short-term financial assets were considered as cash equivalents since they have immediately liquidity(*) Adjusted by one-time costs incurred -Hertz Brasil acquisition and franchisees incorporation(**) Discount of credit card receivables and anticipation of accounts payable were demonstrated in a different line so that the Free Cash Flow From Operations, Before Growth considered only the contractual terms, reflectingthe Company's operation
Free cash flow - R$ million 2013 2014 2015 2016 2017 2018 1Q19
EBITDA 916.5 969.8 934.8 1,015.7 1,314.2 1590.1 538.2
Used car sale revenue, net from taxes (1,747.3) (2,018.2) (2,044.9) (2,342.6) (3,451.2) (4,510.4) (1,460.1)
Depreciated cost of cars sold 1,543.8 1,777.0 1,769.1 2,102.5 3,106.6 4,198.5 1,405.2
(-) Income tax and social contribution (108.5) (113.1) (110.7) (93.3) (108.3) (131.2) (42.0)
Change in working capital 2.9 (27.1) (30.0) (40.8) (47.9) (117.4) (203.3)
Cash generated by rental operations 607.4 588.4 518.3 641.5 813.4 1,029.6 238.0
Used car sale revenue, net from taxes – fleet renewal 1,747.3 2,018.2 2,036.3 2,342.6 3,451.2 4,510.4 1,460.1
Fleet renewal investment (1,819.7) (2,197.7) (2,278.4) (2,563.6) (3,660.9) (4,696.7) (1,582.6)
Change in accounts payable to car suppliers for fleet renewal 144.3 120.0 (25.4) 219.8 227.6 250.1 788.6
Net investment for fleet renewal 71.9 (59.5) (267.5) (1.2) 17.9 63.8 666.1
Fleet renewal – quantity 62,641 70,621 64,032 68,449 90,554 111,279 36,651
(47.5) (46.3) (29.7) (40.9) (28.8) (42.8) (6.7)
631.8 482.6 221.1 599.4 802.5 1,050.6 897.4
Fleet (growth) investment fleet reduction (209.4) (286.8) 8.6 (726.0) (1,807.0) (2,285.1) (12.6)
Change in accounts payable to car suppliers for fleet growth (54.6) 214.4 (23.9) 26.8 168.7 509.4 (863.0)
Hertz Brazil acquisition - fleet - - - - (285.7) - -
Fleet growth capex (264.0) (72.4) (15.3) (699.2) (1,924.0) (1,775.7) (875.6)
Fleet increase / (reduction) – quantity 7,103 9,183 (273) 19,384 52,860 54,142 292
367.8 410.2 205.8 (99.8) (1,121.5) (725.1) 21.8
Hertz Acquisition (Except fleet) / Incurred one-time costs effect - - - - (121.5) - -
New headquarters construction and furniture (6.5) (148.3) (30.7) (85.7) (146.2) - -
361.3 261.9 175.1 (185.5) (1,389.2) (725.1) 21.8
- - (71.9) 98.0 88.3 (113.2) (100.7)
361.3 261.9 103.2 (87.5) (1,300.9) (838.3) (78.9)
Op
era
tio
ns
Cap
ex
- re
ne
wal
Investment, property and intangible
Free cash flow from operations, before growth
Cap
ex
- G
row
th
Cap
ex
-
no
n-
recu
rrin
g
Free cash generated before the cash effects of discounts and anticipation of payables to suppliers
Free cash flow after growth
Cash effects of receivables and anticipation of payables to suppliers (**)
Free cash flow before interest
*

46
R$1.5 BILLION LOWER NET DEBT AFTER FOLLOW ON
CHANGE IN NET DEBT(R$ million)
24,

47
DEBT MATURITY PROFILE (PRINCIPAL)(R$ million)
As of March 31, 2019
EVEN MORE COMFORTABLE DEBT PROFILE AFTER THE NEW DEBENTURE ISSUANCE
3.959,6
474,9
1.187,7
330,6
1.093,4 1.096,7
1.973,0
628,1 425,1258,3
Cash and financialassets
2019 2020 2021 2022 2023 2024 2025 2026 2027 to 2032
3,086.6
3,318.7
3.959,6
628,1 425,1
62,5
500,0 500,0
4.022,1
260,3
737,7
130,6
1.093,4 1.096,7
1.973,0
1.128,1 925,1
258,3
Cash and financialassets
2019 2020 2021 2022 2023 2024 2025 2026 2027 to 2032
Proforma after 15th debenture issuance

48
DEBT RATIOS
RATIOS BACK TO HISTORICAL LEVELS
Net debt versus fleet value
1.322,3 1.588,62.084,0
3.864,7
5.241,0
3.702,53.296,3 3.642,74.623,6
7.038,1
9.533,4 9.607,8
2014 2015 2016 2017 2018 1Q19
Net debt Fleet value
(R$ million)
BALANCE AT THE END OF PERIOD 2014 2015 2016 2017 20181Q19
withoutIRFS 16
1Q19 with IFRS
16
Net debt / Fleet value 40% 44% 45% 55% 55% 39% 39%
Net debt / annualized EBITDA 1.4x 1.7x 2.1x 2.9x 3.3x 1.9x 1.7x
Net debt / Equity 0.8x 0.8x 0.9x 1.5x 1.7x 0.7x 0.7x
EBITDA / Net financial expenses 6.4x 4.6x 4.2x 4.2x 4.3x 5.6x 5.1x

ROIC VERSUS COST OF DEBT AFTER TAXES
HIGHER SPREAD IN AN ACCELERATED GROWTH ENVIRONMENT
17,8% 17,0%15,4% 15,6%
12,9% 13,2%
8,0%9,5% 10,2%
7,6%
5,0% 4,9%
13,0%
4,9%
2014 2015 2016 2017 2018 1Q19 annualizedwithout IFRS 16
1Q19 annualized
ROIC Cost of debt after taxes
9.8p.p.
7.9p.p.
7.5p.p. 5.2p.p.8.0p.p.
ROIC considered each year´s effective income tax and social contribution rate
*
(*)Adjusted by the one-time costs incurred - Hertz Brasil acquisition and Franchisees incorporation
8.1p.p.8.3p.p.
49
Website: www.localiza.com/ir E-mail: [email protected] Phone: 55 31 3247-7024
The material presented is a presentation of general background information about LOCALIZA as of the date of the presentation. It is information in summary form and does not purport to becomplete. It is not intended to be relied upon as advice to potential investors. No representation or warranty, express or implied, is made concerning, and no reliance should be placed on, theaccuracy, fairness, or completeness of the information presented herein.
This presentation contains statements that are forward-looking within the meaning of Section 27A of the Securities Act of 1933 and Section 21E of the Securities Exchange Act of 1934. Such forward-looking statements are only projections and are not guarantees of future performance. Investors are cautioned that any such forward-looking statements are and will be, as the case may be, subjectto many risks, uncertainties and factors relating to the operations and business environments of LOCALIZA and its subsidiaries that may cause the actual results of the companies to be materiallydifferent from any future results expressed or implied in such forward-looking statements.
Although LOCALIZA believes that the expectations and assumptions reflected in the forward-looking statements are reasonable based on information currently available to LOCALIZA’s management,LOCALIZA cannot guarantee future results or events. LOCALIZA expressly disclaims a duty to update any of the forward-looking statement.
Securities may not be offered or sold in the United States unless they are registered or exempt from registration under the Securities Act of 1933.
This presentation does not constitute an offer, invitation or solicitation of an offer to subscribe to or purchase any securities. Neither this presentation nor anything contained herein shall form the basis ofany contract or commitment whatsoever.
DISCLAIMER