Embed Size (px)
Citation preview
GE Capital
imagination at work
The State of Car Policies in Europe and Key Fleet Challenges2013-2014 Edition
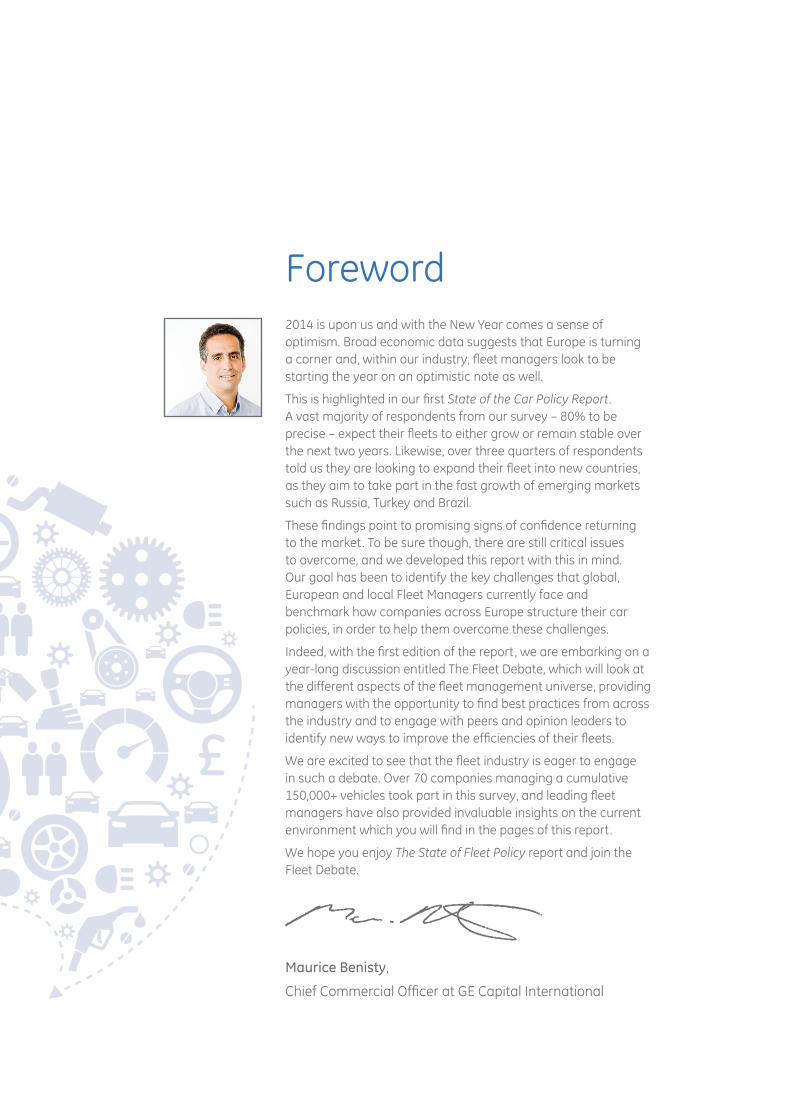
2014 is upon us and with the New Year comes a sense of optimism. Broad economic data suggests that Europe is turning a corner and, within our industry, fleet managers look to be starting the year on an optimistic note as well.
This is highlighted in our first State of the Car Policy Report. A vast majority of respondents from our survey – 80% to be precise – expect their fleets to either grow or remain stable over the next two years. Likewise, over three quarters of respondents told us they are looking to expand their fleet into new countries, as they aim to take part in the fast growth of emerging markets such as Russia, Turkey and Brazil.
These findings point to promising signs of confidence returning to the market. To be sure though, there are still critical issues to overcome, and we developed this report with this in mind. Our goal has been to identify the key challenges that global, European and local Fleet Managers currently face and benchmark how companies across Europe structure their car policies, in order to help them overcome these challenges.
Indeed, with the first edition of the report, we are embarking on a year-long discussion entitled The Fleet Debate, which will look at the different aspects of the fleet management universe, providing managers with the opportunity to find best practices from across the industry and to engage with peers and opinion leaders to identify new ways to improve the efficiencies of their fleets.
We are excited to see that the fleet industry is eager to engage in such a debate. Over 70 companies managing a cumulative 150,000+ vehicles took part in this survey, and leading fleet managers have also provided invaluable insights on the current environment which you will find in the pages of this report.
We hope you enjoy The State of Fleet Policy report and join the Fleet Debate.
Foreword
Maurice Benisty,
Chief Commercial Officer at GE Capital International
ContentsExecutive summary: 10 Key findings 2
Data and methodology 3
Section 1: The state of car policy 4
• Bytypeoffleet:comparingpersonnelonlyandcommercialandpersonnelcarpolicies 5
• Byfleetsize:comparinglargeandsmallfleets 6
• Bygeographicregion:comparinggloballyandlocallymanagedfleets 7
Section 2: The three key challenges 9
• Driverbehaviour 10
• Globalfleetmanagement 12
• Fuelmanagement 13
The information materials and opinions contained in this document are for general information purposes only, are not intended to constitute legal or other professional advice, and should not be relied on or treated as a substitute for specific advice relevant to particular circumstances.
Except as required by law, neither GE Capital EMEA Services Limited, nor its affiliated companies or businesses accept any responsibility and shall not be liable for any loss or damage whatsoever, whether in contract, tort (including negligence) or otherwise arising from reliance on the information, materials and opinions contained in this document.
1
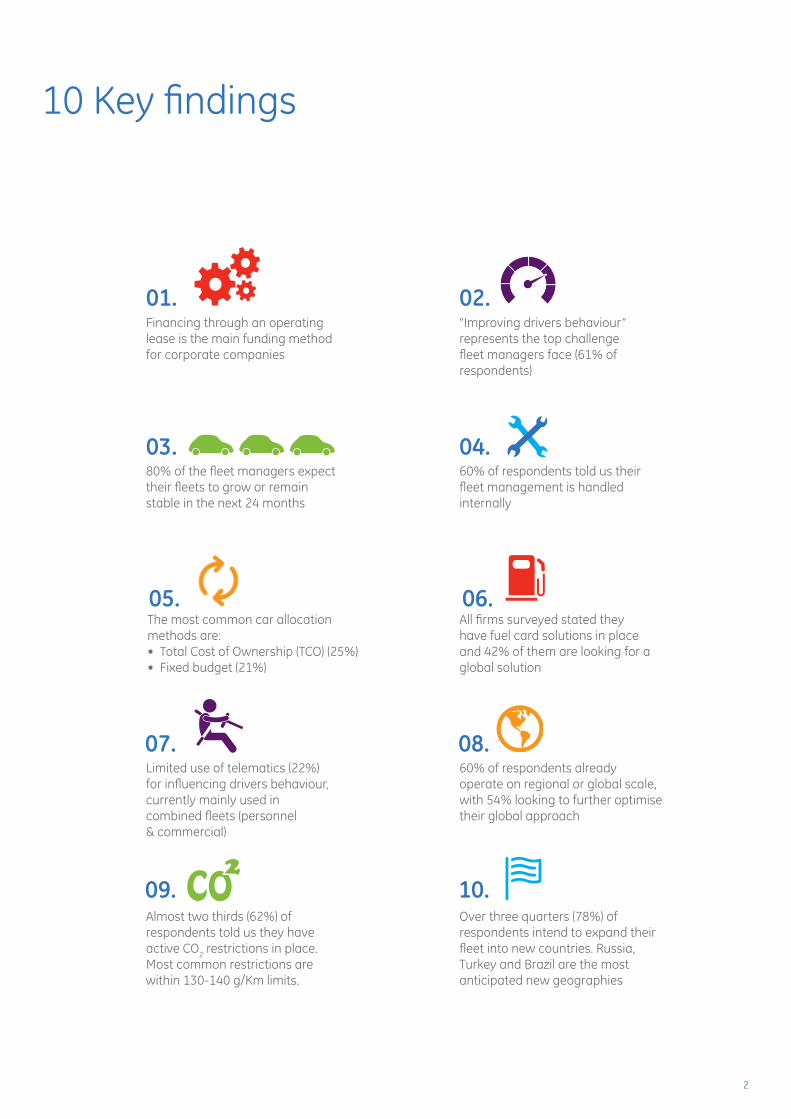
10 Key findings
80% of the fleet managers expect their fleets to grow or remain stable in the next 24 months
Financing through an operating lease is the main funding method for corporate companies
60%ofrespondentstoldustheirfleet management is handled internally
The most common car allocation methods are: •TotalCostofOwnership(TCO)(25%)•Fixedbudget(21%)
“Improving drivers behaviour” represents the top challenge fleetmanagersface(61%ofrespondents)
Limited use of telematics (22%) for influencing drivers behaviour, currently mainly used in combined fleets (personnel & commercial)
All firms surveyed stated they have fuel card solutions in place and 42% of them are looking for a global solution
Almosttwothirds(62%)ofrespondents told us they have active CO2 restrictions in place. Most common restrictions are within 130-140 g/Km limits.
60%ofrespondentsalreadyoperate on regional or global scale, with 54% looking to further optimise their global approach
Over three quarters (78%) of respondents intend to expand their fleet into new countries. Russia, Turkey and Brazil are the most anticipated new geographies
01. 02.
03. 04.
05. 06.
07. 08.
09. 10.
2
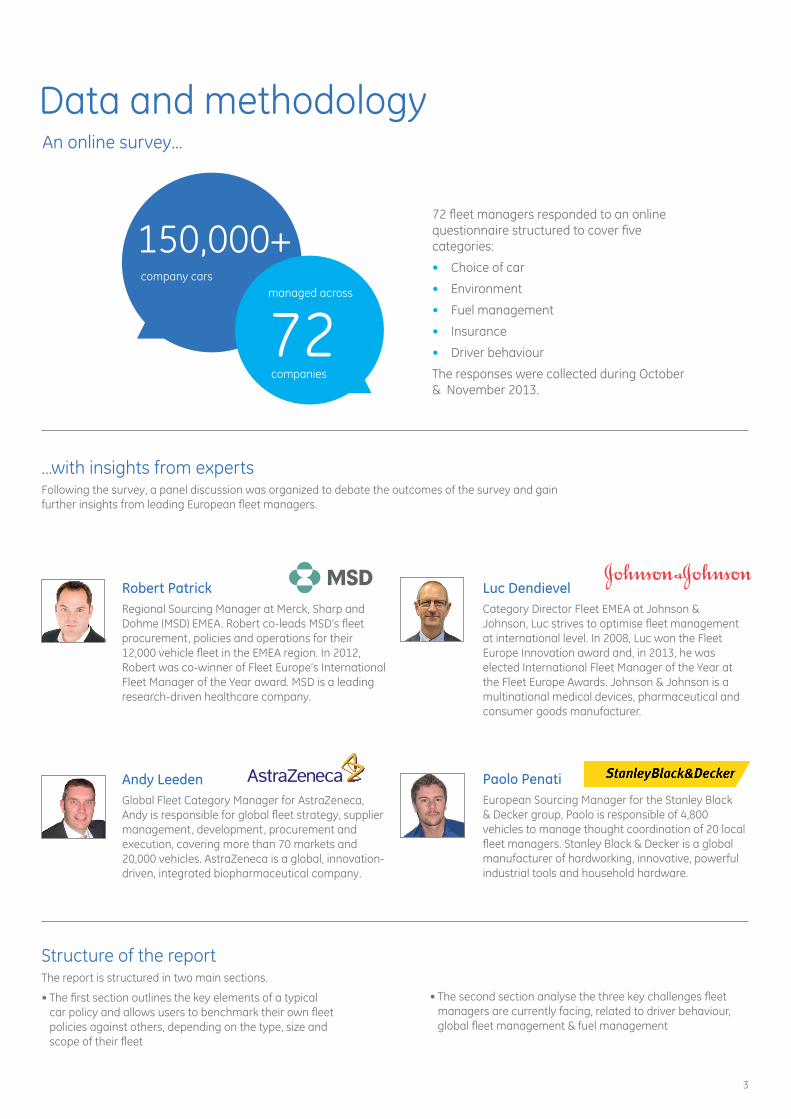
Data and methodology
…with insights from expertsFollowing the survey, a panel discussion was organized to debate the outcomes of the survey and gain further insights from leading European fleet managers.
An online survey...
Structure of the reportThe report is structured in two main sections.
•Thefirstsectionoutlinesthekeyelementsofatypicalcar policy and allows users to benchmark their own fleet policies against others, depending on the type, size and scope of their fleet
•Thesecondsectionanalysethethreekeychallengesfleetmanagers are currently facing, related to driver behaviour, global fleet management & fuel management
MSD
Paolo PenatiEuropean Sourcing Manager for the Stanley Black & Decker group, Paolo is responsible of 4,800 vehicles to manage thought coordination of 20 local fleet managers. Stanley Black & Decker is a global manufacturer of hardworking, innovative, powerful industrial tools and household hardware.
Luc DendievelCategory Director Fleet EMEA at Johnson & Johnson, Luc strives to optimise fleet management at international level. In 2008, Luc won the Fleet Europe Innovation award and, in 2013, he was elected International Fleet Manager of the Year at the Fleet Europe Awards. Johnson & Johnson is a multinational medical devices, pharmaceutical and consumer goods manufacturer.
Andy LeedenGlobal Fleet Category Manager for AstraZeneca, Andy is responsible for global fleet strategy, supplier management, development, procurement and execution, covering more than 70 markets and 20,000 vehicles. AstraZeneca is a global, innovation-driven, integrated biopharmaceutical company.
Robert PatrickRegional Sourcing Manager at Merck, Sharp and Dohme (MSD) EMEA. Robert co-leads MSD’s fleet procurement, policies and operations for their 12,000 vehicle fleet in the EMEA region. In 2012, Robert was co-winner of Fleet Europe’s International Fleet Manager of the Year award. MSD is a leading research-driven healthcare company.
72 fleet managers responded to an online questionnaire structured to cover five categories:
• Choice of car
• Environment
• Fuel management
• Insurance
• Driver behaviour
The responses were collected during October & November 2013.
150,000+managed across
72companies
company cars
3
Section 1:
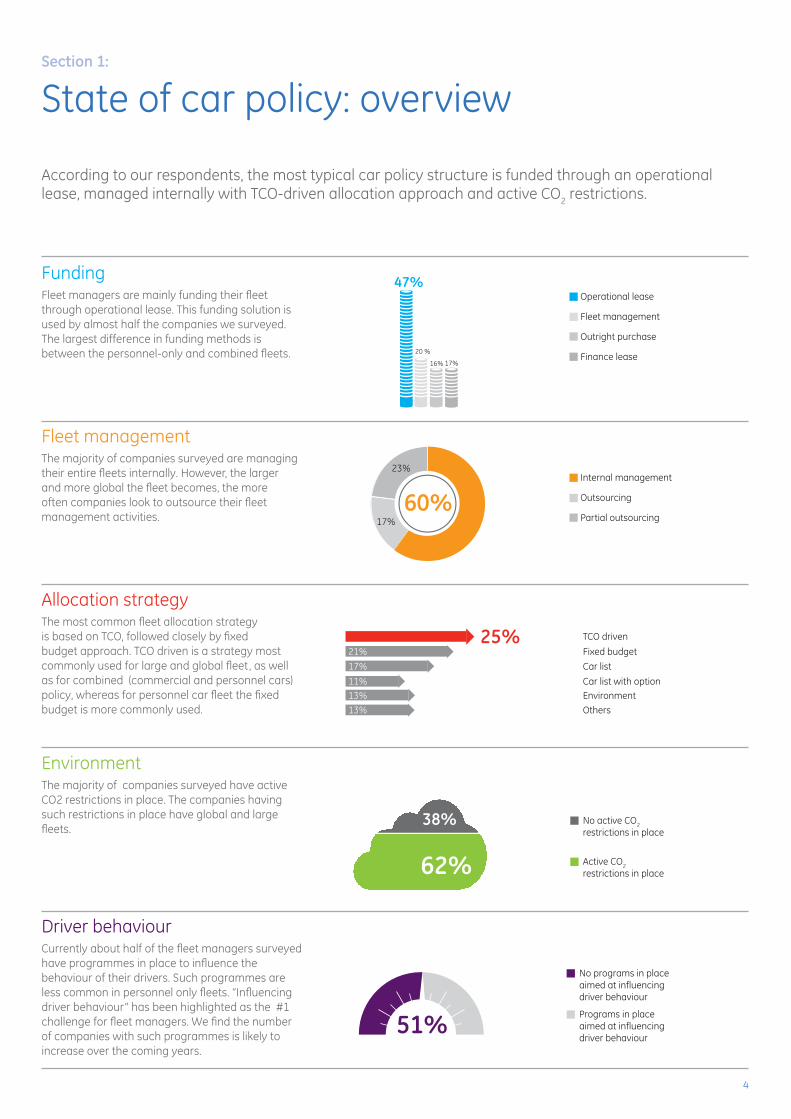
State of car policy: overview
FundingFleet managers are mainly funding their fleet through operational lease. This funding solution is used by almost half the companies we surveyed. The largest difference in funding methods is between the personnel-only and combined fleets.
Fleet managementThe majority of companies surveyed are managing their entire fleets internally. However, the larger and more global the fleet becomes, the more often companies look to outsource their fleet management activities.
Allocation strategyThe most common fleet allocation strategy is based on TCO, followed closely by fixed budget approach. TCO driven is a strategy most commonly used for large and global fleet, as well as for combined (commercial and personnel cars) policy, whereas for personnel car fleet the fixed budget is more commonly used.
EnvironmentThe majority of companies surveyed have active CO2 restrictions in place. The companies having such restrictions in place have global and large fleets.
Driver behaviourCurrently about half of the fleet managers surveyed have programmes in place to influence the behaviour of their drivers. Such programmes are less common in personnel only fleets. “Influencing driver behaviour” has been highlighted as the #1 challenge for fleet managers. We find the number of companies with such programmes is likely to increase over the coming years.
According to our respondents, the most typical car policy structure is funded through an operational lease, managed internally with TCO-driven allocation approach and active CO2 restrictions.
60%
Operational lease
Fleet management
Outright purchase
Finance lease
Internal management
Outsourcing
Partial outsourcing
No active CO2 restrictions in place
Active CO2 restrictions in place62%
38%
No programs in placeaimed at influencing driver behaviour
Programs in placeaimed at influencing driver behaviour
51%
25%21%
17%
11%13%
13%
Fixed budget
TCO driven
Car list
Car list with optionEnvironment
Others
17%
23%
47%
20 %
17%16%
4
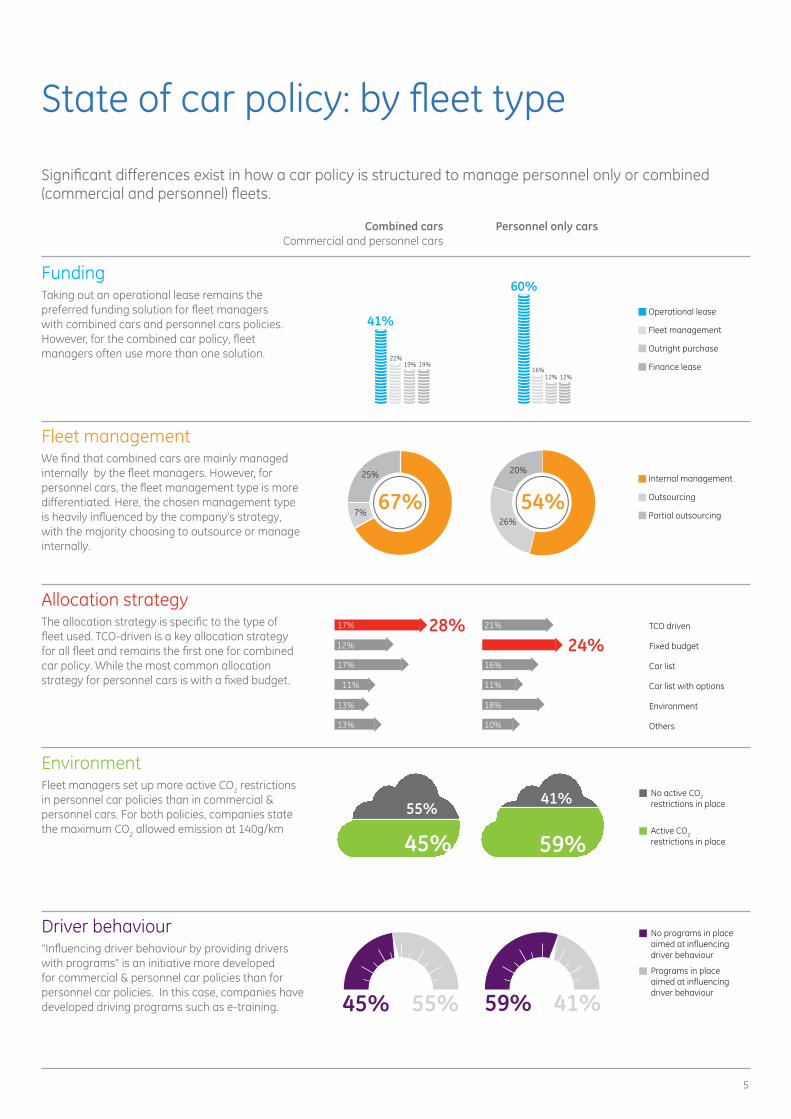
State of car policy: by fleet type
FundingTaking out an operational lease remains the preferred funding solution for fleet managers with combined cars and personnel cars policies. However, for the combined car policy, fleet managers often use more than one solution.
Fleet managementWe find that combined cars are mainly managed internally by the fleet managers. However, for personnel cars, the fleet management type is more differentiated. Here, the chosen management type is heavily influenced by the company’s strategy, with the majority choosing to outsource or manage internally.
Allocation strategyThe allocation strategy is specific to the type of fleet used. TCO-driven is a key allocation strategy for all fleet and remains the first one for combined car policy. While the most common allocation strategy for personnel cars is with a fixed budget.
EnvironmentFleet managers set up more active CO2 restrictions in personnel car policies than in commercial & personnel cars. For both policies, companies state the maximum CO2 allowed emission at 140g/km
Driver behaviour“Influencing driver behaviour by providing drivers with programs” is an initiative more developed for commercial & personnel car policies than for personnel car policies. In this case, companies have developed driving programs such as e-training.
Significant differences exist in how a car policy is structured to manage personnel only or combined (commercial and personnel) fleets.
67%Internal management
Outsourcing
Partial outsourcing7%
25%
54%26%
20%
Operational lease
Fleet management
Outright purchase
Finance lease
No active CO2 restrictions in place
Active CO2 restrictions in place
No programs in placeaimed at influencing driver behaviour
Programs in placeaimed at influencing driver behaviour
45%
55%
45% 55%
28%24%
17% 21%
17%
11%
13%
59%
41%
59% 41%
TCO driven
Fixed budget
Car list
Car list with options
Environment
Others13%
12%
16%
11%
18%
10%
60%
41%
22%
16%19% 19%
12% 12%
Combined carsCommercial and personnel cars
Personnel only cars
5
83%Internal management
Outsourcing
Partial outsourcing
11%
6%
38%
27%
35%
Operational lease
Fleet management
Outright purchase
Finance lease
No active CO2 restrictions in place
Active CO2 restrictions in place
No programs in placeaimed at influencing driver behaviour
Programs in placeaimed at influencing driver behaviour
41%59%
39% 61%
65%
35%
46% 54%
23%30%17%
19%
8%
15%
TCO driven
Fixed budget
Car list
Car list with options
Environment
Others16%
13%
16%
13%
17%
11%
41%
14%
21%
24%
43%
23%
17% 17%
Small fleet(0-250 cars)
Large fleet(>2000 cars)
State of car policy: by fleet size
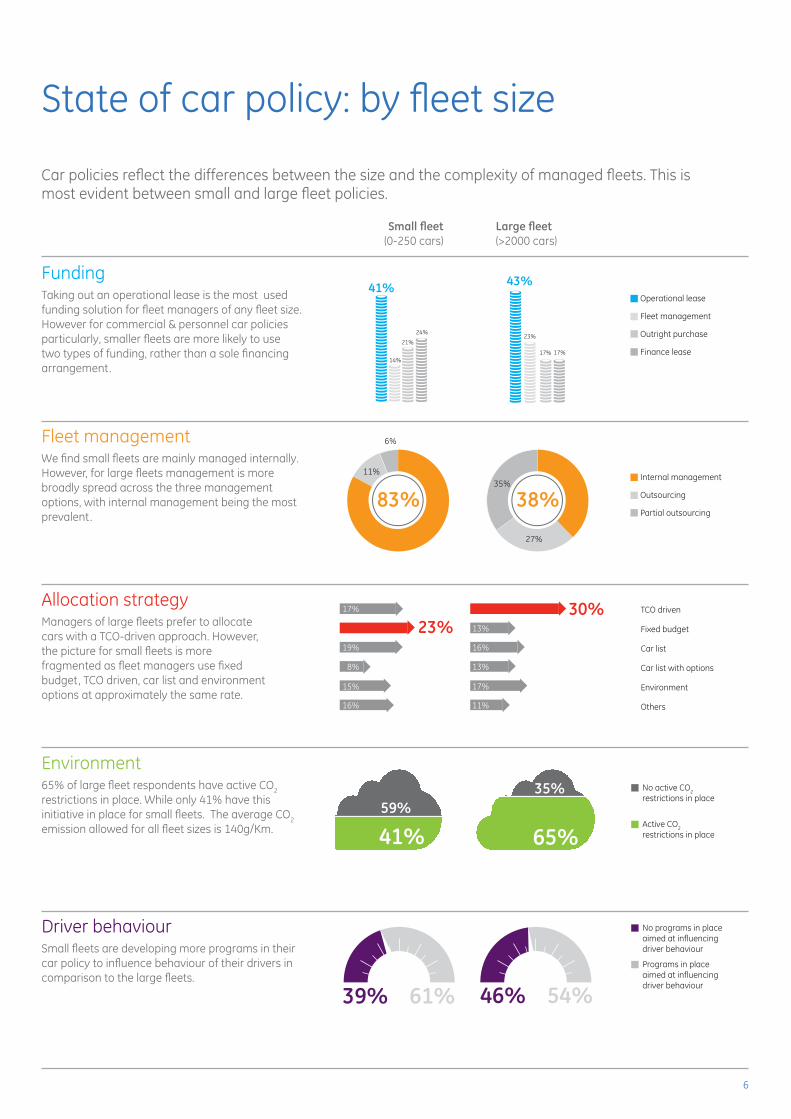
FundingTaking out an operational lease is the most used funding solution for fleet managers of any fleet size. However for commercial & personnel car policies particularly, smaller fleets are more likely to use two types of funding, rather than a sole financing arrangement.
Fleet managementWe find small fleets are mainly managed internally. However, for large fleets management is more broadly spread across the three management options, with internal management being the most prevalent.
Allocation strategyManagers of large fleets prefer to allocate cars with a TCO-driven approach. However, the picture for small fleets is more fragmented as fleet managers use fixed budget, TCO driven, car list and environment options at approximately the same rate.
Environment65%oflargefleetrespondentshaveactiveCO2 restrictions in place. While only 41% have this initiative in place for small fleets. The average CO2
emission allowed for all fleet sizes is 140g/Km.
Driver behaviourSmall fleets are developing more programs in their car policy to influence behaviour of their drivers in comparison to the large fleets.
Car policies reflect the differences between the size and the complexity of managed fleets. This is most evident between small and large fleet policies.
6
83%Internal management
Outsourcing
Partial outsourcing
7%
10%
37%
26%
37%
Operational lease
Fleet management
Outright purchase
Finance lease
No active CO2
restrictions in place
Active CO2
restrictions in place
No programs in placeaimed at influencing driver behaviour
Programs in placeaimed at influencing driver behaviour
45%
55%
48% 52%
28%28%17%
17%
11%
13%
67%
33%
47% 53%
TCO driven
Fixed budget
Car list
Car list with options
Environment
Others13%
12%
21%
7%
16%
16%
44%48%
13%
22%20% 21%
18%
12%
Local fleetSpecific to one country
Global fleetCentralised policy for multiple countries
State of car policy: by geographic region
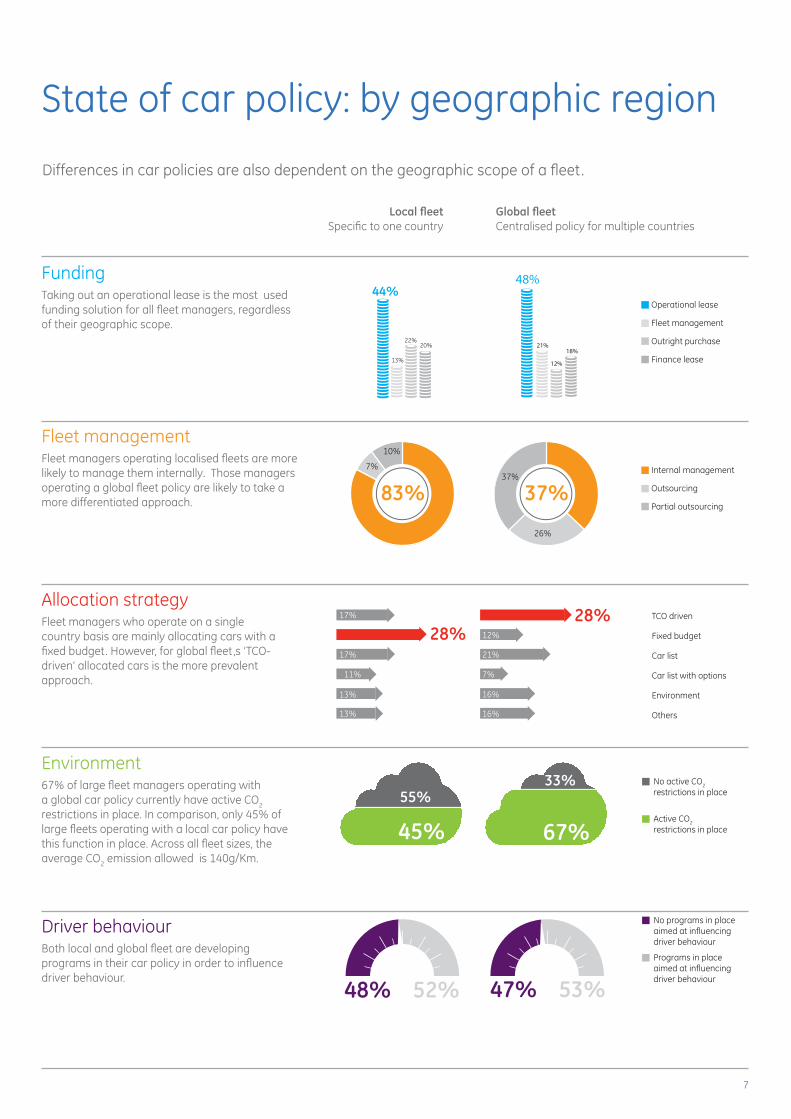
FundingTaking out an operational lease is the most used funding solution for all fleet managers, regardless of their geographic scope.
Fleet managementFleet managers operating localised fleets are more likely to manage them internally. Those managers operating a global fleet policy are likely to take a more differentiated approach.
Allocation strategyFleet managers who operate on a single country basis are mainly allocating cars with a fixed budget. However, for global fleet,s ‘TCO-driven’ allocated cars is the more prevalent approach.
Environment67%oflargefleetmanagersoperatingwitha global car policy currently have active CO2
restrictions in place. In comparison, only 45% of large fleets operating with a local car policy have this function in place. Across all fleet sizes, the average CO2 emission allowed is 140g/Km.
Driver behaviourBoth local and global fleet are developing programs in their car policy in order to influence driver behaviour.
Differences in car policies are also dependent on the geographic scope of a fleet.
7
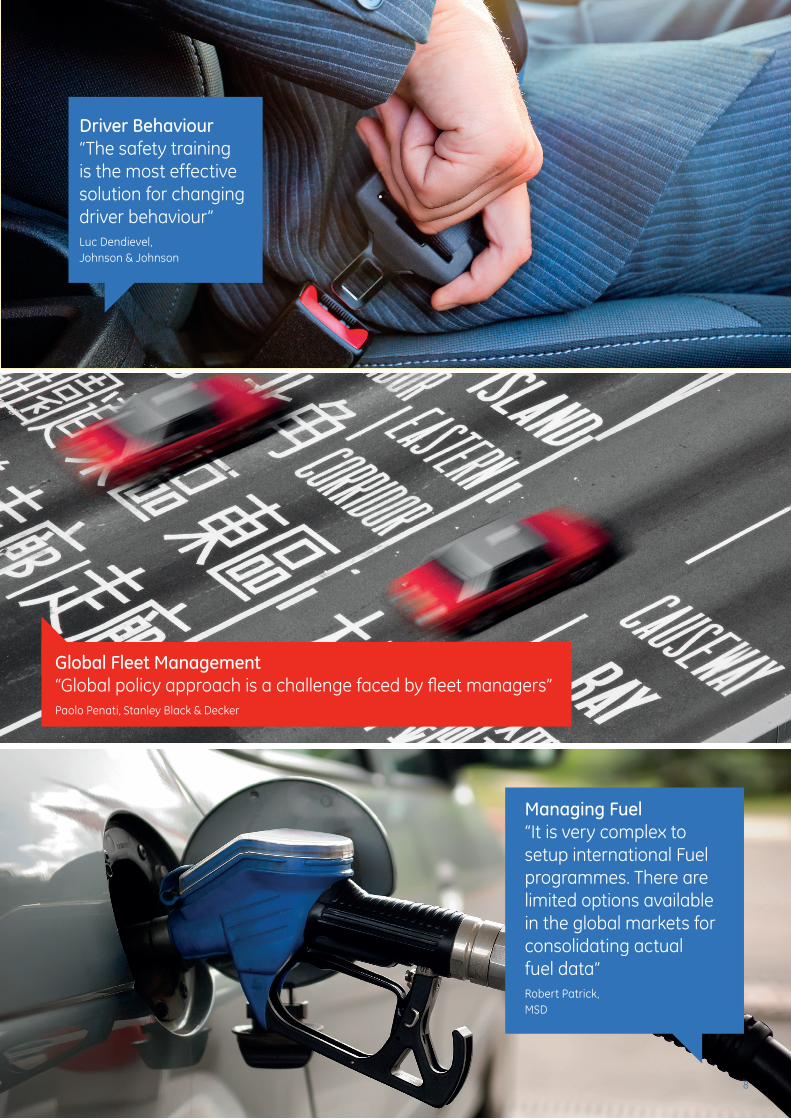
Driver Behaviour “The safety training is the most effective solution for changing driver behaviour”Luc Dendievel, Johnson & Johnson
Global Fleet Management “Global policy approach is a challenge faced by fleet managers”Paolo Penati, Stanley Black & Decker
Managing Fuel “It is very complex to setup international Fuel programmes. There are limited options available in the global markets for consolidating actual fuel data”Robert Patrick, MSD
8
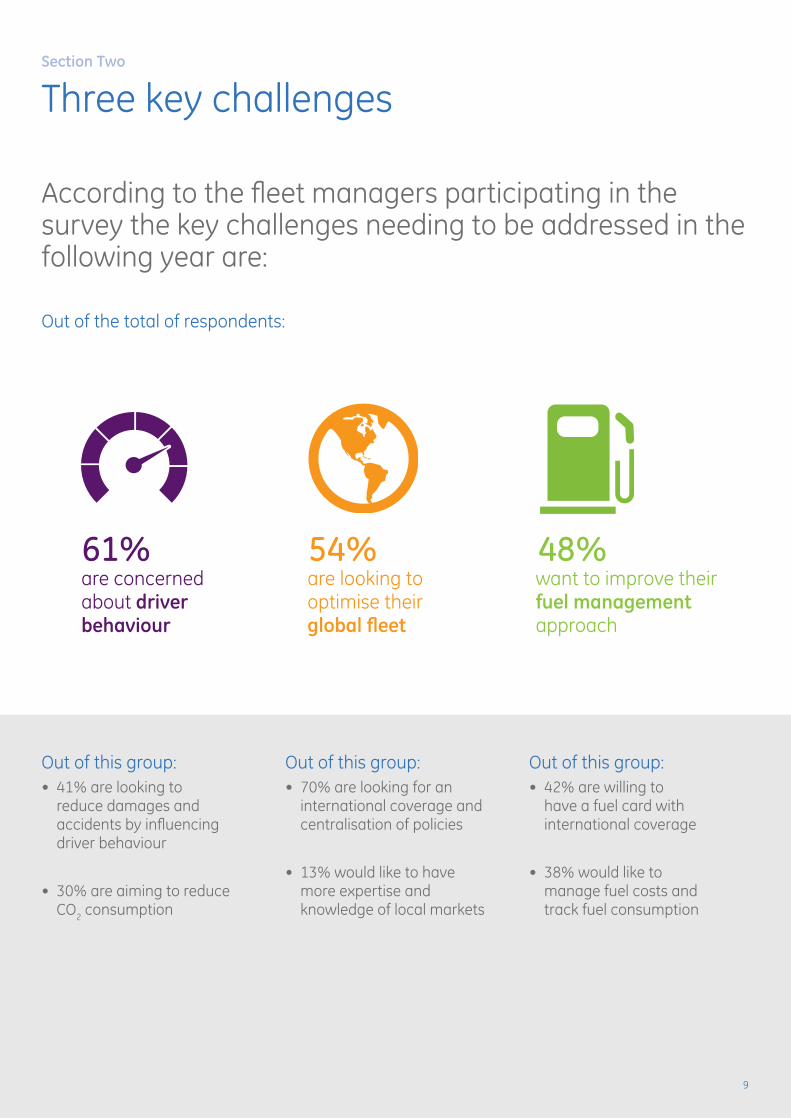
According to the fleet managers participating in the survey the key challenges needing to be addressed in the following year are:
Out of the total of respondents:
48%54%61%want to improve their fuel management approach
are looking to optimise their global fleet
are concerned about driver behaviour
Out of this group:• 42%arewillingto
have a fuel card with international coverage
• 38%wouldliketo manage fuel costs and track fuel consumption
Out of this group:• 41%arelookingto
reduce damages and accidents by influencing driver behaviour
• 30%areaimingtoreduce CO2 consumption
Out of this group:• 70%arelookingforan
international coverage and centralisation of policies
• 13%wouldliketohave more expertise and knowledge of local markets
Section Two
Three key challenges
9
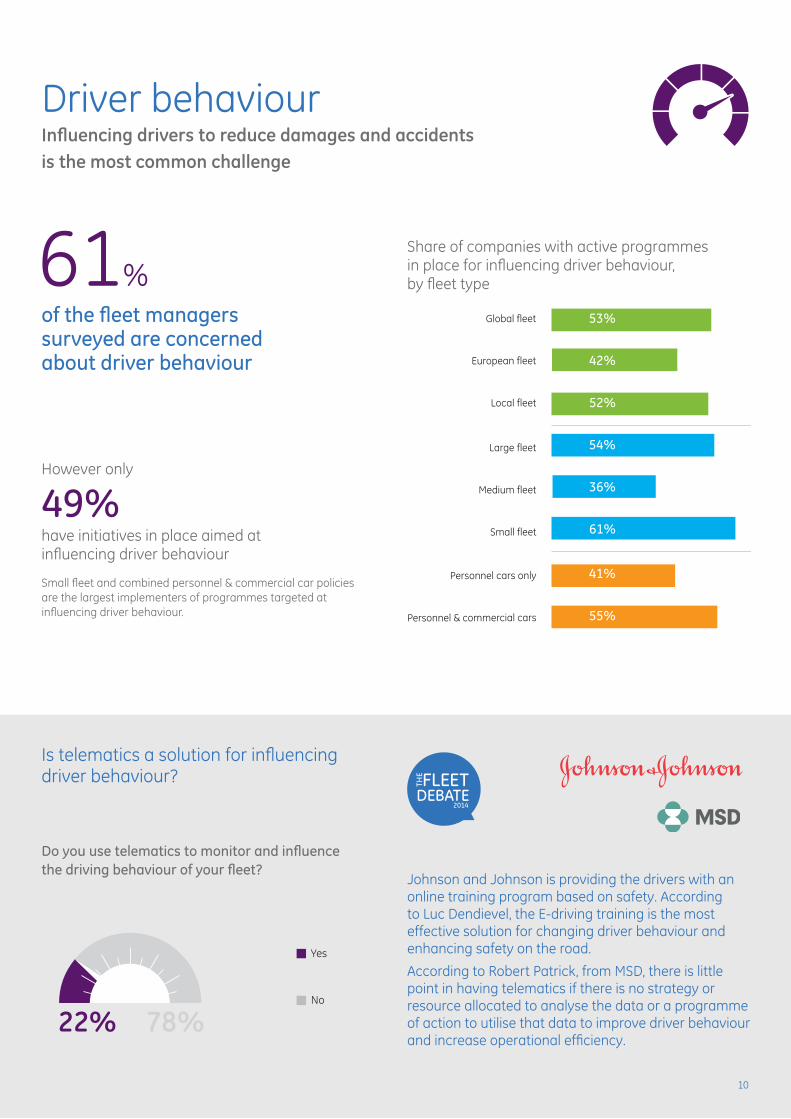
Driver behaviourInfluencing drivers to reduce damages and accidents is the most common challenge
of the fleet managers surveyed are concerned about driver behaviour
FLEETDEBATE
THE
2014
Do you use telematics to monitor and influence the driving behaviour of your fleet?
Is telematics a solution for influencing driver behaviour?
However only
49%
have initiatives in place aimed at influencing driver behaviour
Small fleet and combined personnel & commercial car policies are the largest implementers of programmes targeted at influencing driver behaviour.
Share of companies with active programmes in place for influencing driver behaviour, by fleet type61%
Johnson and Johnson is providing the drivers with an online training program based on safety. According to Luc Dendievel, the E-driving training is the most effective solution for changing driver behaviour and enhancing safety on the road.
According to Robert Patrick, from MSD, there is little point in having telematics if there is no strategy or resource allocated to analyse the data or a programme of action to utilise that data to improve driver behaviour and increase operational efficiency.
22% 78%
Yes
No
Personnel cars only
Personnel & commercial cars
Global fleet
European fleet
Local fleet
53%
42%
52%
54%
36%
61%
41%
55%
Large fleet
Medium fleet
Small fleet
MSD
10
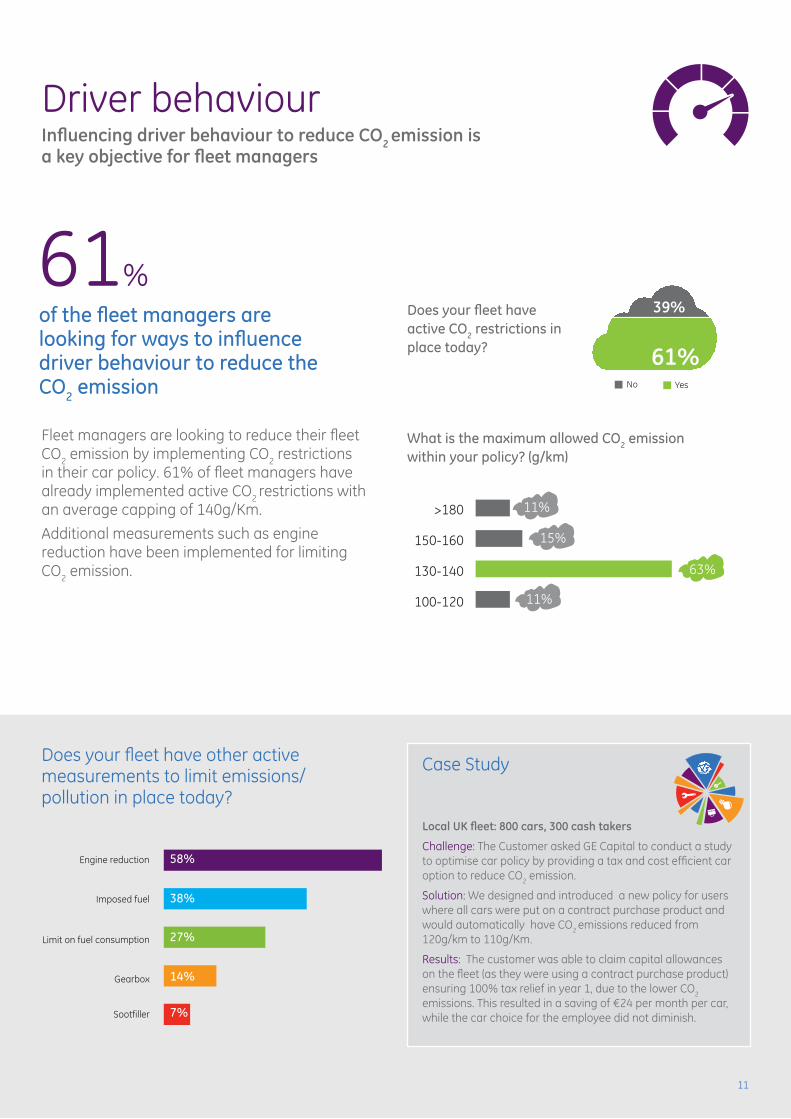
Driver behaviourInfluencing driver behaviour to reduce CO2 emission is a key objective for fleet managers
of the fleet managers are looking for ways to influence driver behaviour to reduce the CO2 emission
Does your fleet have other active measurements to limit emissions/pollution in place today?
Fleet managers are looking to reduce their fleet CO2 emission by implementing CO2 restrictions intheircarpolicy.61%offleetmanagershavealready implemented active CO2 restrictions with an average capping of 140g/Km.
Additional measurements such as engine reduction have been implemented for limiting CO2 emission.
Does your fleet have active CO2 restrictions in place today?
61%
Case Study
Local UK fleet: 800 cars, 300 cash takers
Challenge: The Customer asked GE Capital to conduct a study to optimise car policy by providing a tax and cost efficient car option to reduce CO2 emission.
Solution: We designed and introduced a new policy for users where all cars were put on a contract purchase product and would automatically have CO2 emissions reduced from 120g/km to 110g/Km.
Results: The customer was able to claim capital allowances on the fleet (as they were using a contract purchase product) ensuring 100% tax relief in year 1, due to the lower CO2 emissions. This resulted in a saving of €24 per month per car, while the car choice for the employee did not diminish.
What is the maximum allowed CO2 emission within your policy? (g/km)
No Yes
61%
39%
11%
15%
>180
150-160
130-140
100-120
63%
11%
Sootfiller
Engine reduction
Imposed fuel
58%
38%
27%
14%
7%
Limit on fuel consumption
Gearbox
11
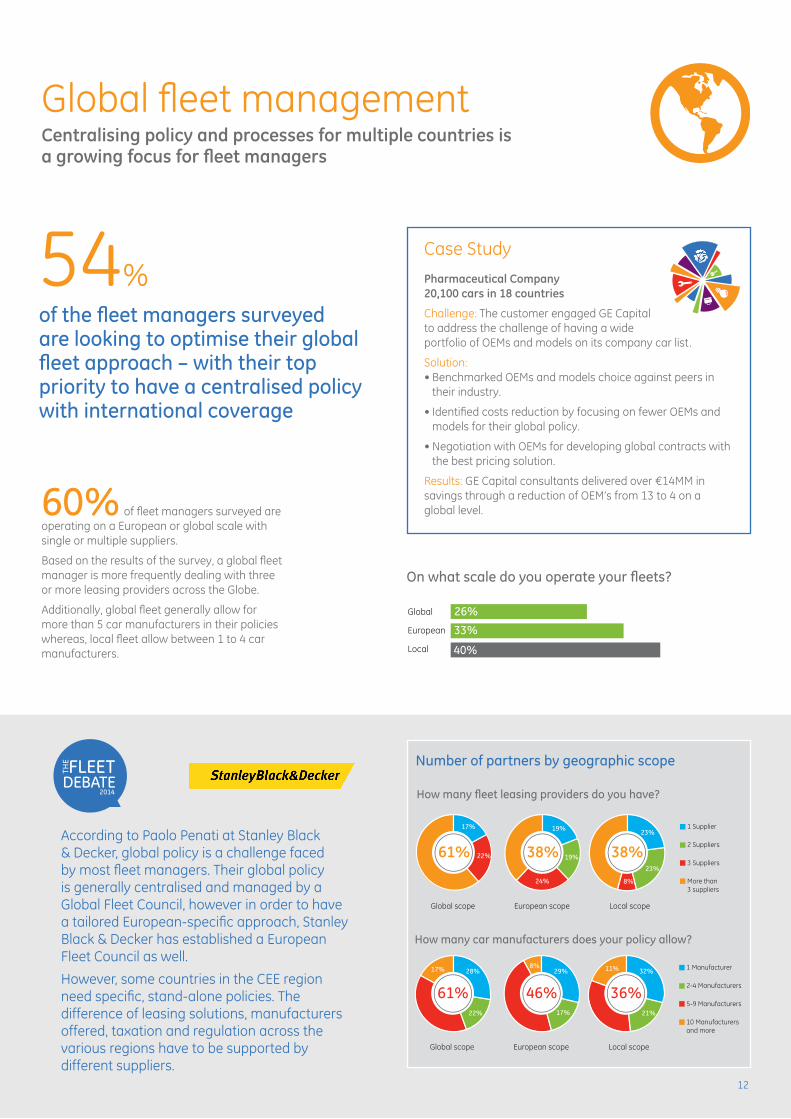
Global fleet managementCentralising policy and processes for multiple countries is a growing focus for fleet managers
of the fleet managers surveyed are looking to optimise their global fleet approach – with their top priority to have a centralised policy with international coverage
FLEETDEBATE
THE
2014
60% of fleet managers surveyed are operating on a European or global scale with single or multiple suppliers.
Based on the results of the survey, a global fleet manager is more frequently dealing with three or more leasing providers across the Globe.
Additionally, global fleet generally allow for more than 5 car manufacturers in their policies whereas, local fleet allow between 1 to 4 car manufacturers.
54%
According to Paolo Penati at Stanley Black & Decker, global policy is a challenge faced by most fleet managers. Their global policy is generally centralised and managed by a Global Fleet Council, however in order to have a tailored European-specific approach, Stanley Black & Decker has established a European Fleet Council as well.
However, some countries in the CEE region need specific, stand-alone policies. The difference of leasing solutions, manufacturers offered, taxation and regulation across the various regions have to be supported by different suppliers.
How many fleet leasing providers do you have?
61%3 Suppliers
2 Suppliers
More than 3 suppliers
1 Supplier
22%
17%
38%
24%
19%
38%23%
8%
19%
23%
Global scope European scope Local scope
How many car manufacturers does your policy allow?
61%5-9 Manufacturers
2-4 Manufacturers
10 Manufacturersand more
1 Manufacturer
22%
28%17%
46%17%
8%
36%
32%11%29%
21%
Global scope European scope Local scope
Case Study
Pharmaceutical Company 20,100 cars in 18 countries
Challenge: The customer engaged GE Capital to address the challenge of having a wide portfolio of OEMs and models on its company car list.
Solution: •BenchmarkedOEMsandmodelschoiceagainstpeersin
their industry.
•IdentifiedcostsreductionbyfocusingonfewerOEMsandmodels for their global policy.
•NegotiationwithOEMsfordevelopingglobalcontractswiththe best pricing solution.
Results: GE Capital consultants delivered over €14MM in savings through a reduction of OEM’s from 13 to 4 on a global level.
Number of partners by geographic scope
Global
European
Local
53%
26%
33%
40%
On what scale do you operate your fleets?
12
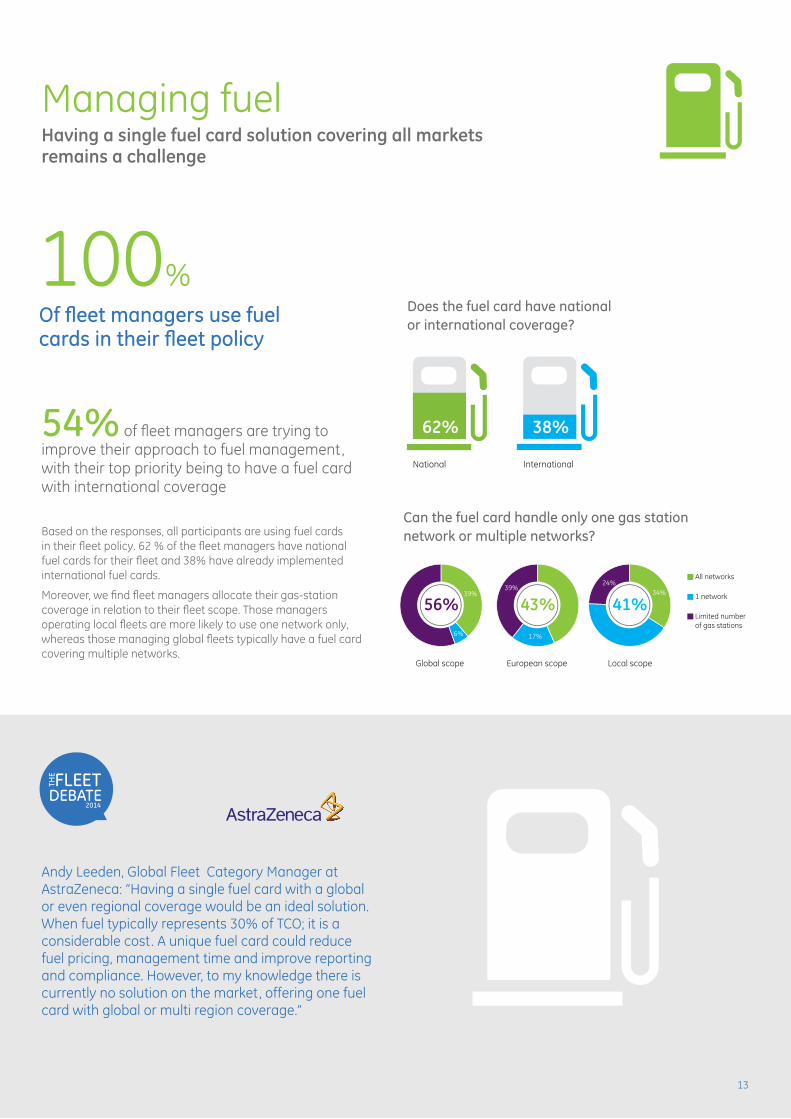
Andy Leeden, Global Fleet Category Manager at AstraZeneca: “Having a single fuel card with a global or even regional coverage would be an ideal solution. When fuel typically represents 30% of TCO; it is a considerable cost. A unique fuel card could reduce fuel pricing, management time and improve reporting and compliance. However, to my knowledge there is currently no solution on the market, offering one fuel card with global or multi region coverage.”
Managing fuelHaving a single fuel card solution covering all markets remains a challenge
Of fleet managers use fuel cards in their fleet policy
FLEETDEBATE
THE
2014
54% of fleet managers are trying to improve their approach to fuel management, with their top priority being to have a fuel card with international coverage
Based on the responses, all participants are using fuel cards intheirfleetpolicy.62%ofthefleetmanagershavenationalfuel cards for their fleet and 38% have already implemented international fuel cards.
Moreover, we find fleet managers allocate their gas-station coverage in relation to their fleet scope. Those managers operating local fleets are more likely to use one network only, whereas those managing global fleets typically have a fuel card covering multiple networks.
100%
Can the fuel card handle only one gas station network or multiple networks?
56%Limited numberof gas stations
1 network
All networks
6%
39%
43%
17%
39%
41%34%
24%
Global scope European scope Local scope
National International
National International
38%62%
Does the fuel card have national or international coverage?
13
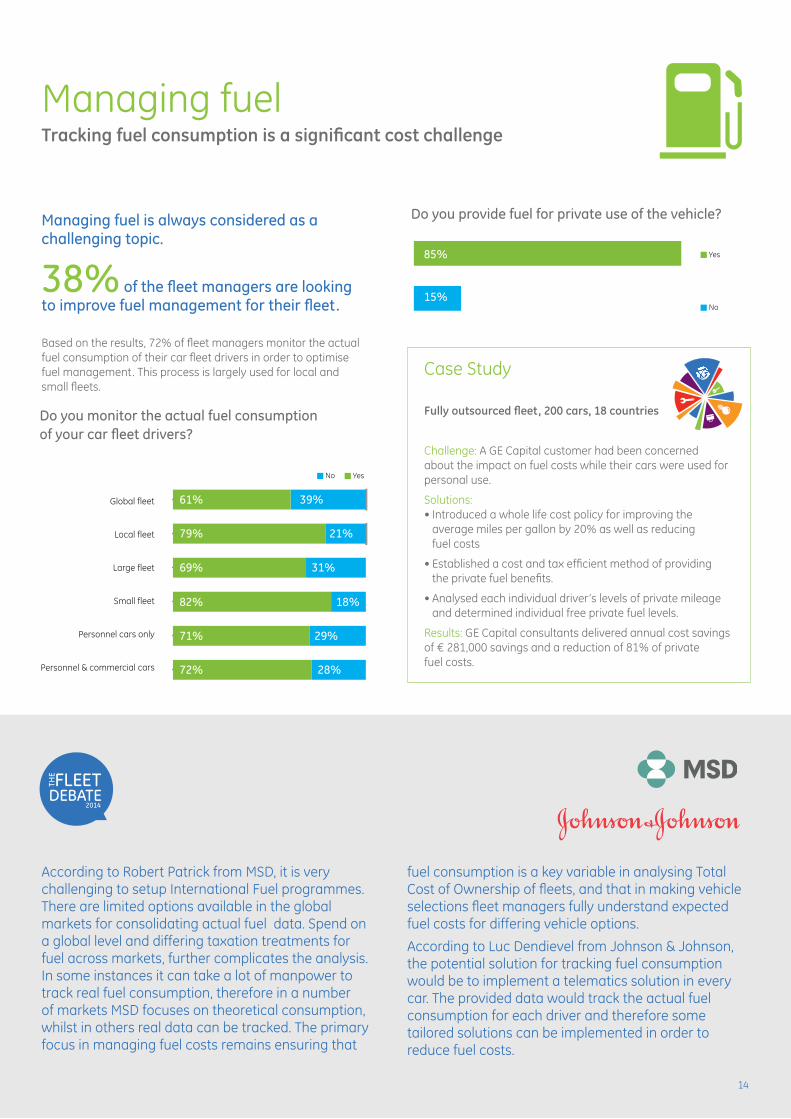
According to Robert Patrick from MSD, it is very challenging to setup International Fuel programmes. There are limited options available in the global markets for consolidating actual fuel data. Spend on a global level and differing taxation treatments for fuel across markets, further complicates the analysis. In some instances it can take a lot of manpower to track real fuel consumption, therefore in a number of markets MSD focuses on theoretical consumption, whilst in others real data can be tracked. The primary focus in managing fuel costs remains ensuring that
fuel consumption is a key variable in analysing Total Cost of Ownership of fleets, and that in making vehicle selections fleet managers fully understand expected fuel costs for differing vehicle options.
According to Luc Dendievel from Johnson & Johnson, the potential solution for tracking fuel consumption would be to implement a telematics solution in every car. The provided data would track the actual fuel consumption for each driver and therefore some tailored solutions can be implemented in order to reduce fuel costs.
Managing fuelTracking fuel consumption is a significant cost challenge
FLEETDEBATE
THE
2014
Managing fuel is always considered as a challenging topic.
38% of the fleet managers are looking to improve fuel management for their fleet.
Based on the results, 72% of fleet managers monitor the actual fuel consumption of their car fleet drivers in order to optimise fuel management. This process is largely used for local and small fleets.
Global fleet
Local fleet
Large fleet
Small fleet
Personnel cars only
Personnel & commercial cars
61%
79%
69%
82%
71%
72%
39%
21%
31%
18%
29%
28%
No Yes
Do you monitor the actual fuel consumption of your car fleet drivers?
Case Study
Fully outsourced fleet, 200 cars, 18 countries
Challenge: A GE Capital customer had been concerned about the impact on fuel costs while their cars were used for personal use.
Solutions: •Introducedawholelifecostpolicyforimprovingthe
average miles per gallon by 20% as well as reducing fuel costs
•Establishedacostandtaxefficientmethodofproviding the private fuel benefits.
•Analysedeachindividualdriver’slevelsofprivatemileageand determined individual free private fuel levels.
Results: GE Capital consultants delivered annual cost savings of € 281,000 savings and a reduction of 81% of private fuel costs.
Do you provide fuel for private use of the vehicle?
No
Yes85%
15%
MSD
14
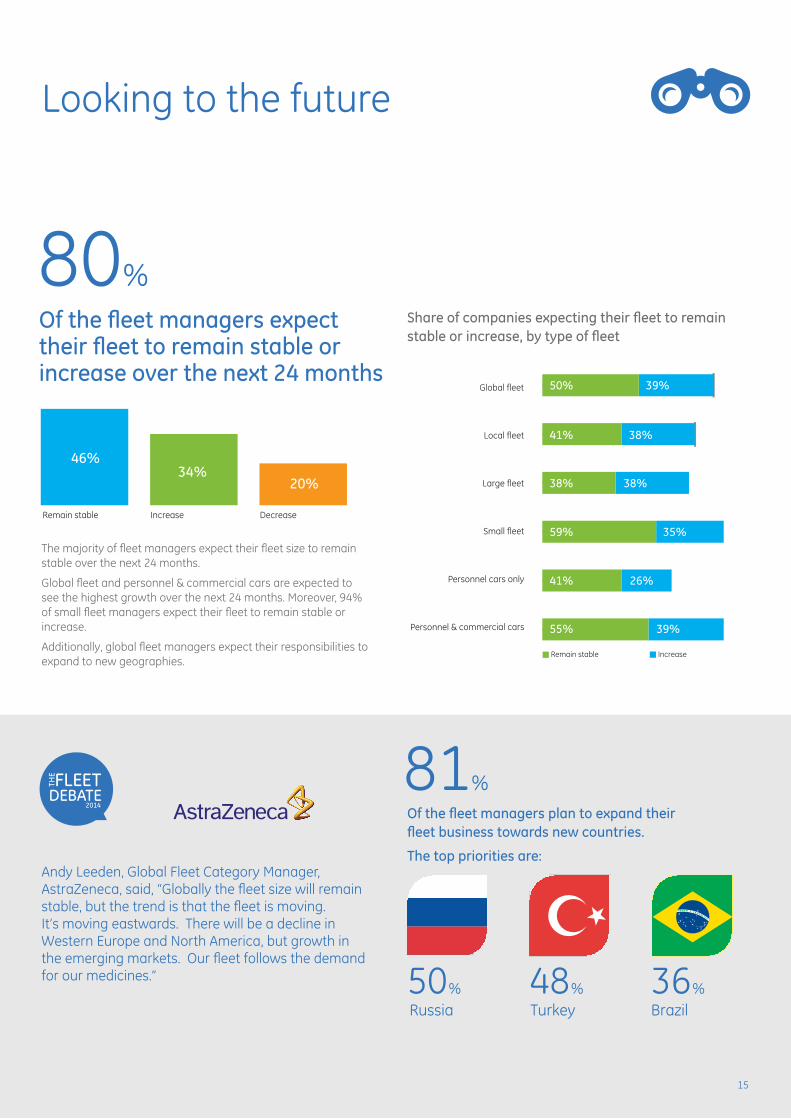
Andy Leeden, Global Fleet Category Manager, AstraZeneca, said, “Globally the fleet size will remain stable, but the trend is that the fleet is moving. It’s moving eastwards. There will be a decline in Western Europe and North America, but growth in the emerging markets. Our fleet follows the demand for our medicines.”
Looking to the future
Of the fleet managers expect their fleet to remain stable or increase over the next 24 months
FLEETDEBATE
THE
2014
The majority of fleet managers expect their fleet size to remain stable over the next 24 months.
Global fleet and personnel & commercial cars are expected to see the highest growth over the next 24 months. Moreover, 94% of small fleet managers expect their fleet to remain stable or increase.
Additionally, global fleet managers expect their responsibilities to expand to new geographies.
80%Share of companies expecting their fleet to remain stable or increase, by type of fleet
46%34%
20%
Remain stable Increase Decrease
Global fleet
Local fleet
Large fleet
Small fleet
Personnel cars only
Personnel & commercial cars
50%
41%
38%
59%
41%
55%
39%
38%
38%
35%
26%
39%
Remain stable Increase
Of the fleet managers plan to expand their fleet business towards new countries.
The top priorities are:
81%
Russia50%
Turkey48%
Brazil36%
15
FLEETDEBATE
THE
2014
Join the Fleet
Debate
If you would like to know more about The Fleet Debate please email
[email protected] or keep your eyes on the Fleet press for upcoming debates & insights.
imagination at work
© 2013 General Electric Company. All rights reserved.
Neither this publication nor any part of it may be reproduced, stored in a retrieval system or transmitted in any form or by any means, electronic, mechanical, photocopying, recording or otherwise, without the prior permission of General Electric Company.
GECapitalEMEAServicesLimited.RegisteredAddress:TheArk,201TalgarthRoad,LondonW68BJ,UnitedKingdom. Registered in England and Wales No. 00244759
We hope you found the State of Car Policy Report informative & useful for your involvement with Fleet management.
This report forms part of a wider range of activity from ‘The Fleet Debate’ – a community of industry discussion, peer debates & best practice sharing centred around Fleet Management.
Throughout the year, GE Capital will be arranging a series of webinars, roundtables & workshops with business leaders & peers to discuss current challenges, the evolving market, and to debate the future of Fleet Management; in addition to supporting an online hub for accessing useful Fleet insights & best practices.