Embed Size (px)
Citation preview

investor releaseNoida, NCR, India, January 19th, 2016
s e c o n d Q U A R T E R - F Y 2 0 1 6 R E S U LT S
Table of contentS
Financial Highlights 2
Corporate Overview 3
Performance Highlights 4
Financials in US$ 10
Revenue Analysis at Company Level 13
Constant Currency Reporting 14
Client Metrics 15
Headcount & Utilization 16
Facilities 16
Cash and Cash Equivalents, Investments & Borrowings 16
Financials in ` 17
Revenue at 10,341 crores; up 2.4% QoQ & up 11.4% YoY `
Net Income at 1,920 crores; up 11.2% QoQ & up 0.2% YoY`
Revenue in constant currency up 2.1% QoQ & up 9.3% YoY
Revenue at US$ 1,566 mn; up 1.4% QoQ & up 5.1% YoY
Net Income at US$ 291 mn; up 10.3% QoQ & down 5.4% YoY
Q2 FY’16 RESULTS
“We have never managed by contract, what so ever. It's always been what are the needs that we have today and tomorrow. HCL
has been a part of that without thinking that from a contract perspective. They really have performed in this account and it's just a
part of the DNA of HCL” – CIO of an American distribution company

Highlights for the Quarter ended 31st december, 2015
- 2 -
Corporate highlights
- Broad based growth during Calendar Year 2015 (CY’15) across all revenue segments driven by Engineering and R&D Services at 23.0%, Business Services at 23.9% and Infrastructure Services at 16.4% on Constant Currency basis.
- Strong client addition continues in CY’15: 50 Million dollar + clients up by 3, 30 Million dollar + clients up by 5, 20 Million dollar + clients up by 5.
- Announces dividend of ` 6 per share, 52nd consecutive quarter of dividend payout.
- Return on Equity (ROE) at 29% in CY’15
Amount in Crores
Amount in US $ Million
Q2 FY’16QoQ YoY
GROWTH
REVENUE 10,341 2.4% 11.4%
EBIT 2,072 5.9% -6.2%
NET INCOME 1,920 11.2% 0.2%
Q2 FY’16QoQ YoY
GROWTH
REVENUE 1,566 1.4% 5.1%
EBIT 314 5.0% -11.5%
NET INCOME 291 10.3% -5.4%
“The differentiator I look forward to is a Top level partnership and executive commitment for our account. We have absolutely had
that from HCL in a variety of ways. They are with us at every step in the way!” – Senior VP and CIO of an American Retailer

“HCL has always been at the forefront of changing market dynamics. As a company with good corporate
governance practices and robust financial performance we continue to create exceptional value, both for
businesses as well as communities in which we operate. We are proud to launch HCL Grant – an initiative to
empower, enhance and instutionalise the work being done by NGOs in India, by offering them strong
governance frameworks and management capabilities”, said Shiv Nadar, Chairman & Chief Strategy
Officer, HCL Technologies Ltd.
“As part of HCL's 21st Century Enterprise blueprint, our investments and focus on BEYONDigital, Next–Gen
ITO and IoT WoRKS is enabling us to stay ahead of the curve and achieve a healthy business growth and
financial performance. We have achieved a revenue growth of 13.5% YoY in constant currency terms this
calendar year”, said Anant Gupta, President & CEO, HCL Technologies Ltd. “Earlier this quarter, we faced
the challenging Chennai situation. Our resilient business models, robust business continuity and disaster
recovery practices, coupled with tremendous support from all our clients and employees helped us face the
challenge extremely well.”
“Our performance in this quarter continues to reflect the return from the investments we have been making. The
return on equity for calendar 2015 at 29% has been amongst the best in the Industry”, said Anil Chanana,
CFO, HCL Technologies.
- 3 -
“HCL's strength is that it has a lot of expertise in SAP and is an easy partner to work with, they are quite flexible. The team has come
forward in many instances providing feedback on improving services and better time management.” – VP of a Travel technology
company

performance highlights - calendar year
- 4 -
1,104
1,373
1,239
3 Year CAGR: 16%
EBIT
5,010
5,692
6,139
Revenues
3 Year CAGR: 12%
2013 2014 2015 2013 2014 2015
868
Cash Conversion
988
1,1841,069 1,103
906
OCF/NI at 94%
Net Income Operating Cash Flow
Net Income
868
1,1841,103
3 Year CAGR: 22%
2013 2014 2015 2013 2014 2015
Num
ber
of C
lient
s
Managed Services & Fixed Price Projects Client Category
100 Million Dollar + 50 Million Dollar + 30 Million Dollar + 10 Million Dollar +
53.8
56.156.4
107121
140
423730
12 16 19
776
2013 2014 2015 2013 2014 2015
“HCL puts relationship over anything else. I don't ever remember us talking about the contract. It's always about how do we move
forward and how do we make this happen. From an HCL perspective, this is what has attracted me. They've always serviced us with
a smile when we've had tough times.” – Director of a large US based office supply chain store
in U
SD
Mn
in U
SD
Mn
in U
SD
Mn
in U
SD
Mn
in %

• Revenue grew by 13.5%.
• Broad based growth across all revenue segments:
• Americas, Europe and ROW grew by 13.8%, 15.1% and 7.9% respectively.
• Driven by Engineering and R&D Services at 23.0%, Business Services at 23.9%, Infrastructure Services at 16.4%, and Application Services at 6.4%.
• Across verticals led by Lifesciences & Healthcare at 27.7%, Telecommunications, Media, Publishing & Entertainment at 23.6%, Public Services at 17.8%, Retail & CPG at 12.6%, Manufacturing at 12.3% and Financial Services at 10.1%.
REVENUE GROWTH IN CALENDAR 2015 OVER CALENDAR 2014 IN CONSTANT CURRENCY
REVENUE GROWTH (IN CONSTANT CURRENCY)
PARTICULARS SEGMENTS
QoQ
31-Dec-15
key catalysts for growth
- 5 -
CY(YoY)
For the Company 2.1% 9.3% 13.5%
Americas 5.5% 11.8% 13.8%
Europe -2.4% 8.5% 15.1%
ROW -3.4% -1.5% 7.9%
Application Services 2.0% 4.4% 6.4%
Infrastructure Services 3.4% 13.4% 16.4%
Business Services 8.0% 24.1% 23.9%
Engineering and R&D Services -1.5% 8.8% 23.0%
Financial Services 1.9% 8.3% 10.1%
Manufacturing -1.3% 3.9% 12.3%
Lifesciences & Healthcare 0.3% 18.0% 27.7%
Public Services 8.4% 22.1% 17.8%
Retail & CPG 10.3% 8.1% 12.6%
Telecommunications, Media, Publishing & Entertainment 3.4% 25.3% 23.6%
YoY
Note: Public Services include Oil & Gas, Energy & Utilities, Travel - Transport - Logistics and Government.
Geography
Services
Verticals
Consolidated

Continuing its momentum of deal wins, HCL booked business in excess of USD 1 billion in TCV this quarter, including 8 transformational deals. The broad–based business wins, across service lines and industry verticals were driven by our next–generation offerings – Next-Gen ITO, BEYONDigital and IoT WoRKS.
Ÿ HCL Foundation, the CSR arm of HCL Technologies, announced the launch of HCL Grant with an aim to identify, empower and support NGOs and individual social leaders who are doing exceptional work in rural India. The Grant committed a corpus of Rs 100 crores over the next 5 years. The winner, selected amongst applicants from all over the country through a robust selection process led by an “independent” eminent jury, was presented the Grant by Hon'ble President of India, Shri Pranab Mukherjee.
Ÿ Marking its expansion of operations into Baltics region, HCL launched a near–shore centre in Tallinn, Estonia, taking its total number of integrated global delivery centers to 39 across the world. President of Estonia, Hon'ble Toomas Hendrik Ilves, inaugurated the centre, which will cater to marquee customers across Continental Europe and become a key hub in HCL's global delivery network, providing cutting-edge digital and transformational IT services.
Ÿ IT Services Marketing Association (ITSMA), the leading marketing association for technology, communications and professional services providers, felicitated HCL with its Diamond award for “Delivering an Omnichannel Customer Experience” for its corporate positioning – 'Relationship Beyond the Contract', which has been recognized as industry's best-in-class, driving business with thought leadership.
Ÿ Interbrand, world's leading brand consultancy, recognized HCL as the fastest growing brand for the
second consecutive year, highlighting its ability to adapt to customers' needs. HCL is a part of the 30 best Indian brands listed by Interbrand. HCL has also been recognized as one of the most admired corporate brands by The Economic Times (ET), in its study on the Best Corporate brands 2015.
Ÿ HCL has been recognized at the Asian Customer Engagement Forum (ACEF) Awards, for “Creativity in
Digital Marketing” exhibited in its campaign, showcasing the impact of viral videos for building employer brand affinity amongst existing and prospective employees.
Ÿ Continuing its focus on best–in–class people practices, HCL has been awarded the Special
TMCommendation Prize for “Practice of Ideapreneurship ” at Asian Human Capital Awards 2015. The award recognized HCL for its people practices that engage, enable and empower the workforce to listen, create, ideate and collaborate, in a distinctive entrepreneurial environment.
Ÿ Tata Institute of Social Sciences (TISS) awarded HCL for its social–media based learning platforms at
its TISS Leapvault CLO awards. HCL's 'Career Connect' framework, that leverages social network of counsellors to guide employees in their career development, was awarded in the category of 'best social media based learning'.
Ÿ HCL continues to invest and progress on its vision for sustainability encompassing the 4Rs – Responsible Business, Redefine workplace, Renew Ecosystem and Repay Society. For the 3rd consecutive year, it improved its score and position on the Climate Disclosure Leadership Index (CDLI), a global index that recognizes companies around the world that are doing the most to combat climate change.
transformational and blue chip customer acquisition
corporate excellence
- 6 -

Modern Apps & Digitalization
Ÿ HCL completed the acquisition of Minneapolis-based PowerObjects – a leading North American integrator of Microsoft Dynamics CRM. This will bolster HCL's global applications business, which offers transformational and complex application services. This acquisition enables HCL to take advantage of the rapidly-growing global CRM industry driven by transforming the Customer Experience. Together HCL and PowerObjects will now offer one of the largest Microsoft CRM practices in North America.
Ÿ HCL has partnered with Cybersource (a Visa company) to offer its customers an integrated payment management solution. This helps make eCommerce expansion easier by offering a comprehensive, scalable commerce, payment and fraud management solution and also accelerates time to market, decreases system development requirements and reduces risk.
Ÿ HCL launched a digital care solution, aimed at transforming customer service operations. The solution allows unstructured and structured data from the digital channels to be captured and integrated with existing data. This enables customers to setup data analytics, gather competitive insights and drive better customer experience, loyalty and customer advocacy.
Ÿ HCL has been selected as a digital partner by a Fortune 200 integrated financial services company to transform their user experience around billing and improve the overall operating efficiencies.
Ÿ HCL has won a strategic engagement from a leading US–based telecom service provider to work on “Major Transformation Initiative & One Digital Experience Program”, an initiative aimed at delivering value in the areas of performance engineering, service and network virtualization.
Ÿ A leading member services organization in US has selected HCL to develop a digital marketing platform which improves speed of response, delivers campaign personalization, enables integrated and customized offer management while residing within the centralized content management system.
Ÿ HCL completed an enterprise-level digital E-signature platform implementation for a leading insurer in US. This solution is aimed at enhancing the customer experience, reduce the cycle time and reduce the operation costs.
Ÿ A leading global developer and manufacturer of coating systems has selected HCL to modernize, integrate, manage and support their standard applications portfolio across Non SAP and MAPI applications.
Internet of Things
Ÿ Strengthening its focus on Internet of Things, HCL has established a dedicated Business Unit, IoT WoRKS, in an endeavor to become the most valued IoT services provider globally. 'IoT WoRKS by HCL' offers end–to–end offerings for organizations across different IoT adoption levels by leveraging its capabilities to Define, Build and Run IoT ecosystems globally.
Ÿ HCL has won an engagement from a Leading Global Medical Devices company to provide an end–to–end integrated solution by implementing IoT–based remote monitoring solution, to capture machine data usage and create value-based applications for high-end modern hospital equipment.
Engineering and R&D Services (ERS)
Ÿ HCL has been recognized as an Outstanding Contributor to the VLSI/Embedded Design Industry in the Corporate Category, by Mentor Graphics Corporation and Silicon India, at the Leadership Awards 2015. The awards recognize the unparalleled contribution of various companies/individuals in driving the semiconductor industry.
market leadership
- 7 -

Ÿ Teradyne, a global leader in Automatic Test Equipment industry, awarded HCL a “Certificate of Appreciation” for its contribution to business and commemorating thirteen years of partnership.
Ÿ HCL has been selected by world's leading player in the global diagnostics space to launch a Sustenance Engineering Offshore Delivery Centre by setting up a full-fledged Diagnostics lab in HCL Campus, a first of its kind. HCL will take over the complete sustenance ownership of their legacy product lines.
Ÿ HCL has been selected as a digital devices production partner by a leading US–based independent software vendor, to enhance its digital web campaign quality and impact by providing integrated web production and support services.
Ÿ HCL will develop a next–gen platform which is central to building virtual network for a Europe–based multi-national communication technology & services provider.
Next-Gen IT Outsourcing (ITO)
Ÿ HCL continues to gain scale through Next–Gen ITO offerings and DryICE, its third generation automation framework, that builds further on the mature levels of mTaaS & myCloud and spans & integrates across service lines – applications services, infrastructure services and business services.
Ÿ HCL has been selected as the winner of the CA Technologies Partner of the Year Awards 2015 in the category of innovation and sales teaming for its ability to drive global innovation and sales teaming in both infrastructure management and service management.
Ÿ HCL will provide Digital, Services Integration and Management (SIAM) and Complex Security Solution offerings to a leading global Fortune 500 manufacturer of personal care products, for optimizing its end–to–end Infrastructure.
Ÿ HCL has signed a multi-year infrastructure services deal with a leading global medical devices company to provide global datacenter services and implement its proprietary cloud–based automation solution. HCL will architect and migrate the customer's environment to new datacenters using next–gen hyper–converged solutions.
Ÿ HCL has been selected by a leading insurance company to develop a flexible “Hybrid Managed services” support model to optimize and monitor the network, applications and end user support along with transforming its end-to-end IT infrastructure and applications portfolios.
Ÿ HCL has expanded the operations globally for a South African integrated energy and chemical company to now include the locations of America and Eurasia. HCL will expand existing Datacenter and SAP Basis services to these locations.
Ÿ HCL has won a deal to Design, Build, Host, and Operate a Primary Source Verification system for a US based healthcare services firm.
Ÿ HCL has been chosen as a preferred partner for application management services of the entire enterprise landscape by a US based software company that designs solutions for backup and recovery, business continuity & software-defined storage.
Ÿ HCL has been chosen as a partner by a US–based Fortune 200 integrated media services firm to drive operational efficiency and excellence in the applications space supporting customer's HR and Financial business processes.
Ÿ HCL has been selected by a leading US–based manufacturing company for medical devices, instrument systems for an end to end IT Infrastructure Transformation Engagement.
- 8 -

- 9 -
Ÿ HCL has been positioned as a leader in IDC MarketScape for Worldwide Application Modernization Services for Digital Transformation 2015 Vendor Assessment, Dec 2015. According to the report “HCL possesses a balance of application modernization service capabilities, with particular strengths in migrating custom-built applications to packaged applications and application instance consolidation”.
Ÿ HCL has been rated as a Leader in The Forrester Wave™: Global Workplace Services, North American Workplace Services, EMEA Workplace Services, Q4 2015 by Wolfgang Benkel and William Martorelli December 17, 2015. According to these reports “As an India-centric provider, HCL is among the Leaders in infrastructure services delivery, and this leadership position extends to its role in workplace services delivery, where it is similarly well equipped to compete head on with the global multinational suppliers”.
Ÿ HCL has been positioned as a Leader in IDC MarketScape for Worldwide Microsoft Enterprise Applications Implementation Services, 2015. According to the report “Buyers rate HCL highly for its project value delivered for fee paid, followed by its ability to “offer flexible pricing models” and for buyers' willingness to recommend”.
Ÿ IDC writes an exclusive report titled “HCL in the Nordics: Transformational Outsourcing Takes Clients to the Digital World”, Dec 2015. A key reason for HCL's success in outsourcing is its reputation for delivering high service quality, which is based on its internal culture of empowering its people, its flexibility and responsiveness to customer needs, and detailed methodologies for the transition of operations and staff.
Ÿ HCL Technologies has been positioned in the “Winner's Circle” for its Software Product Engineering services capabilities by the leading analyst firm HfS in its report "Blueprint Report on ISV Engineering Services". HCL was recognized as a leading service provider with strong account management, product development rigor and innovation credentials.
Ÿ HCL Technologies has been positioned as a Leader in the IDC MarketScape Worldwide Life Science Manufacturing and Supply Chain ITO Vendor Assessment 2015, released in October 2015. The report says, “HCL has extensive experience working with life science companies across all three sections of the industry: pharmaceutical, biotech, and medical devices. Nearly all of HCL's life science customers are large corporations with revenue over $1 billion, with a significant base of customers spread across North America, Europe and Asia Pacific.”
thought leadership

Financials in US$ for the Quarter ended 31st DECEMBER, 2015 (US GAAP)
- 10 -
“HCL has brought in delivery efficiency in overall network landscape. We are always on the look for a partner who is flexible in
meeting our demands and HCL is one of them. HCL does not believe in what is written in the contract; it's more on a mutual trust
and mutual relationship.” – Network Head of Multinational Confectionery company
consolidated income statementQUARTER ENDED
Amount in US $ Million
The options will vest in tranches till 2018.
WEIGHTED AVERAGE NUMBER#OF SHARES
31-Dec-14 30-Sep-15 31-Dec-15
OUTSTANDING OPTIONS#
(in equivalent no of shares)
Basic 1,403,370,126 1,406,092,785 1,407,635,747
Diluted 1,410,021,079 1,412,745,610 1,411,549,109
31-Dec-14 30-Sep-15 31-Dec-15
# Number of shares and outstanding options have been adjusted for bonus issue made on March 21, 2015. These have been restated for previous quarters to facilitate like to like comparison.
Options at less than market price 8,313,336 7,865,872 4,753,416
GROWTH
31-Dec-14 30-Sep-15 YoY QoQ
QUARTER ENDED INCOME STATEMENT
31-Dec-15
Revenues 1,490.8 1,544.5 1,566.1 5.1% 1.4%
Direct Costs 939.3 1,031.6 1,024.9
Gross Profits 551.4 512.9 541.2 -1.9% 5.5%
SG & A 179.1 193.2 204.2
EBITDA 372.3 319.8 337.0 -9.5% 5.4%
Depreciation 15.5 18.7 20.2
Amortisation 1.9 2.0 2.9
EBIT 354.8 299.1 313.9 -11.5% 5.0%
Foreign Exchange Gains/(loss) 2.6 3.4 1.7
Other Income, net 31.9 33.6 52.3
Provision for Tax 81.8 72.3 77.0
Net Income 307.5 263.7 290.8 -5.4% 10.3%
Gross Margin 37.0% 33.2% 34.6%
EBITDA Margin 25.0% 20.7% 21.5%
EBIT Margin 23.8% 19.4% 20.0%
Net Income Margin 20.6% 17.1% 18.6%
Earnings Per Share
Annualized in US $
Basic 0.88 0.75 0.83
Diluted 0.87 0.75 0.82
Note: The above financials for the previous quarter ended 30th September, 2015 are after taking into account the impact of one time provision for a project of $18.2 million ($14.8 million post-tax)

PARTICULARS AS ON
consolidated balance sheet
Amount in US $ Million
- 11 -
Assets
Cash and Cash Equivalents 212.3 124.3
Accounts Receivables, net 1,031.2 1,082.3
Unbilled Receivables 459.2 418.6
Fixed Deposits 1,519.2 1,545.3
Investment Securities, available for sale 120.6 92.7
Other Current Assets 367.3 421.0
Total Current Assets 3,709.8 3,684.2
Property and Equipments, net 600.1 601.3
Intangible Assets, net 817.6 868.7
Investments in Equity Investee 1.5 24.9
Other Assets 481.7 490.9
Total Assets 5,610.7 5,670.0
Liabilities & Stockholders Equity
Current Liabilities 1,450.5 1,388.2
Borrowings 73.6 24.2
Other Liabilities 197.8 172.4
Total Liabilities 1,721.9 1,584.8
Total Stockholders Equity 3,888.8 4,085.2
Total Liabilities and Stockholders Equity 5,610.7 5,670.0
31-Dec-1530-Jun-15

consolidated cash flow statement
- 12 -
Amount in US $ Million
PARTICULARS
CASH FLOWS FROM OPERATING ACTIVITIES
Net Income 290.8 554.6
Adjustments to Reconcile Net Income to Net Cash provided by Operating Activities
Depreciation and Amortization 23.1 43.8
Others (22.9) (41.1)
Changes in Assets and Liabilities, net
Accounts Receivable (10.9) (57.3)
Other Assets (56.4) (72.6)
Current Liabilities (50.2) (38.9)
Net Cash provided by Operating Activities 173.6 388.5
CASH FLOWS FROM INVESTING ACTIVITIES
Purchase of Property and Equipment (45.5) (93.5)
Proceeds from sale of property and equipment (including advance) 27.8 29.1
(Purchase) / Sale of Investments (42.7) 25.3
Fixed Deposits (increase) / decrease 61.5 (84.2)
Investment in equity affiliate (2.8) (3.0)
Payments for business acquisitions, net of cash acquired (29.0) (35.5)
Net Cash used in Investing Activities (30.7) (161.9)
CASH FLOWS FROM FINANCING ACTIVITIES
Proceeds from Issuance of Employees Stock Options 0.1 0.1
Dividend (127.6) (256.6)
Loans (10.3) (48.0)
Others 4.2 4.0
Net Cash used in Financing Activities (133.6) (300.5)
Effect of Exchange Rate on Cash and Cash Equivalents (3.5) (14.2)
Net increase/(decrease) in Cash and Cash Equivalents 5.8 (88.0)
CASH AND CASH EQUIVALENTS
Beginning of the Period 118.5 212.3
End of the Period 124.3 124.3
FOR QUARTERENDED Dec’15
FOR 6 MONTHSENDED Dec’15
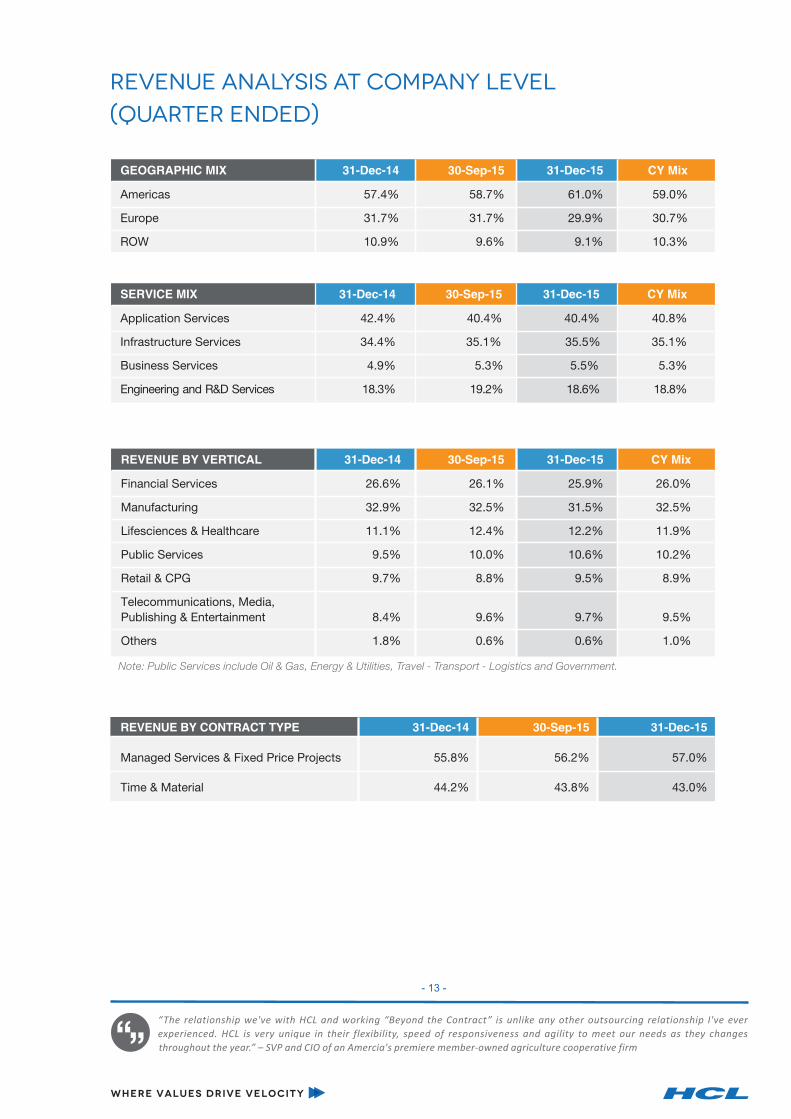
GEOGRAPHIC MIX 31-Dec-14 30-Sep-15 31-Dec-15 CY Mix
Americas 57.4% 58.7% 61.0% 59.0%
Europe 31.7% 31.7% 29.9% 30.7%
ROW 10.9% 9.6% 9.1% 10.3%
SERVICE MIX 31-Dec-14 30-Sep-15 31-Dec-15 CY Mix
Application Services 42.4% 40.4% 40.4% 40.8%
Infrastructure Services 34.4% 35.1% 35.5% 35.1%
Business Services 4.9% 5.3% 5.5% 5.3%
Engineering and R&D Services 18.3% 19.2% 18.6% 18.8%
REVENUE BY VERTICAL 31-Dec-14 30-Sep-15 31-Dec-15 CY Mix
Financial Services 26.6% 26.1% 25.9% 26.0%
Manufacturing 32.9% 32.5% 31.5% 32.5%
Lifesciences & Healthcare 11.1% 12.4% 12.2% 11.9%
Public Services 9.5% 10.0% 10.6% 10.2%
Retail & CPG 9.7% 8.8% 9.5% 8.9%
Telecommunications, Media, Publishing & Entertainment 8.4% 9.6% 9.7% 9.5%
Others 1.8% 0.6% 0.6% 1.0%
revenue analysis at company level (quarter ended)
REVENUE BY CONTRACT TYPE 31-Dec-14 30-Sep-15 31-Dec-15
Managed Services & Fixed Price Projects 55.8% 56.2% 57.0%
Time & Material 44.2% 43.8% 43.0%
- 13 -
Note: Public Services include Oil & Gas, Energy & Utilities, Travel - Transport - Logistics and Government.
“The relationship we've with HCL and working “Beyond the Contract” is unlike any other outsourcing relationship I've ever
experienced. HCL is very unique in their flexibility, speed of responsiveness and agility to meet our needs as they changes
throughout the year.” – SVP and CIO of an Amercia's premiere member-owned agriculture cooperative firm
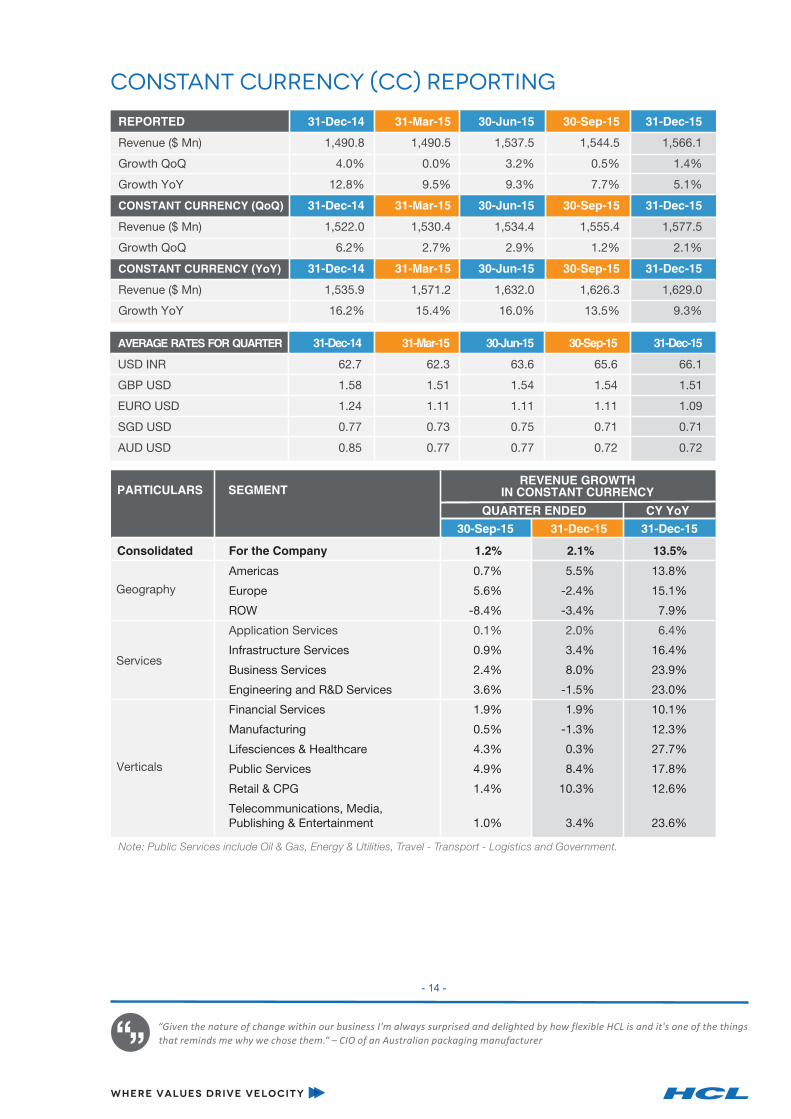
REPORTED 31-Dec-14 31-Mar-15 30-Jun-15 30-Sep-15 31-Dec-15
Revenue ($ Mn) 1,490.8 1,490.5 1,537.5 1,544.5 1,566.1
Growth QoQ 4.0% 0.0% 3.2% 0.5% 1.4%
Growth YoY 12.8% 9.5% 9.3% 7.7% 5.1%
CONSTANT CURRENCY (QoQ) 31-Dec-14 31-Mar-15 30-Jun-15 30-Sep-15 31-Dec-15
Revenue ($ Mn) 1,522.0 1,530.4 1,534.4 1,555.4 1,577.5
Growth QoQ 6.2% 2.7% 2.9% 1.2% 2.1%
CONSTANT CURRENCY (YoY) 31-Dec-14 31-Mar-15 30-Jun-15 30-Sep-15 31-Dec-15
Revenue ($ Mn) 1,535.9 1,571.2 1,632.0 1,626.3 1,629.0
Growth YoY 16.2% 15.4% 16.0% 13.5% 9.3%
constant currency (CC) reporting
AVERAGE RATES FOR QUARTER 31-Dec-14 31-Mar-15 30-Jun-15 30-Sep-15 31-Dec-15
USD INR 62.7 62.3 63.6 65.6 66.1
GBP USD 1.58 1.51 1.54 1.54 1.51
EURO USD 1.24 1.11 1.11 1.11 1.09
SGD USD 0.77 0.73 0.75 0.71 0.71
AUD USD 0.85 0.77 0.77 0.72 0.72
PARTICULARS SEGMENT
QUARTER ENDED
REVENUE GROWTH IN CONSTANT CURRENCY
CY YoY
30-Sep-15 31-Dec-15 31-Dec-15
Consolidated For the Company 1.2% 2.1% 13.5%
Americas 0.7% 5.5% 13.8%
Europe 5.6% -2.4% 15.1%
ROW -8.4% -3.4% 7.9%
Application Services 0.1% 2.0% 6.4%
Infrastructure Services 0.9% 3.4% 16.4%
Business Services 2.4% 8.0% 23.9%
Engineering and R&D Services 3.6% -1.5% 23.0%
Financial Services 1.9% 1.9% 10.1%
Manufacturing 0.5% -1.3% 12.3%
Lifesciences & Healthcare 4.3% 0.3% 27.7%
Public Services 4.9% 8.4% 17.8%
Retail & CPG 1.4% 10.3% 12.6%
Telecommunications, Media, Publishing & Entertainment 1.0% 3.4% 23.6%
- 14 -
“Given the nature of change within our business I'm always surprised and delighted by how flexible HCL is and it's one of the things
that reminds me why we chose them.“ – CIO of an Australian packaging manufacturer
Note: Public Services include Oil & Gas, Energy & Utilities, Travel - Transport - Logistics and Government.
Geography
Services
Verticals

NUMBER OF MILLION DOLLAR 31-Dec-14 30-Sep-15 31-Dec-15 QoQ YoYCLIENTS (CY) CHANGE CHANGE
100 Million dollar + 7 7 7 - -
50 Million dollar + 16 18 19 1 3
40 Million dollar + 22 24 26 2 4
30 Million dollar + 37 43 42 (1) 5
20 Million dollar + 69 75 74 (1) 5
10 Million dollar + 121 133 140 7 19
5 Million dollar + 205 224 227 3 22
1 Million dollar + 450 486 494 8 44
CLIENT BUSINESS 31-Dec-14 30-Sep-15 31-Dec-15
New Clients 4.9% 4.3% 4.0%
Existing Clients 95.1% 95.7% 96.0%
Days Sales Outstanding - excluding unbilled receivables 58 59 62
client metrics
CLIENT CONTRIBUTION TO REVENUE (CY) 31-Dec-14 30-Sep-15 31-Dec-15
Top 5 Clients 14.0% 13.6% 13.6%
Top 10 Clients 22.3% 21.9% 21.7%
Top 20 Clients 32.4% 32.4% 32.4%
- 15 -
“I can say that HCL has delivered excellent value for money. Delivered on our flexibility goals and freed up my team to engage in
other strategic initiatives. I feel I have tremendous partner in HCL. Together we have succeeded in delighting our customers which is
the best win of all” – SVP and CIO of an American data storage and data management company

Note: Attrition excludes involuntary attrition
*Note: For details please refer: http://www.hcltech.com/Q2FY16DetailsCashBorrowings
Amount in US $ Million
Dec-15
Cash & Cash Equivalents 124.3
Fixed Deposits 1,545.3
Investment Securities, Available for Sale 92.7
Total Funds 1,762.3
Dec-15
Short term borrowing 24.2
AS ON 31st DEC 2015 COMPLETED WORK IN PROGRESS
BUILT UP AREA(SQ. FT.) NO. OF SEATS NO. OF SEATSDELIVERY LOCATIONS
BUILT UP AREA(SQ. FT.)
headcount & utilization
facilities
cash & cash equivalents, investments and borrowings
India 9,346,431 87,762 2,302,077 9,666
Global 1,053,931 10,769 66,136 1,185
Total 10,400,361 98,531 2,368,213 10,851
MANPOWER DETAILS 31-Dec-14 30-Sep-15 31-Dec-15
Total Employee Count 100,240 105,571 103,696
Technical 91,595 96,541 94,652
Support 8,645 9,030 9,044
Gross Addition 11,734 7,889 6,234
Attrition - IT Services (LTM) 16.4% 16.3% 16.7%
Attrition - Business Services (Quarterly) 6.7% 7.1% 6.4%
Blended Utilization (Including Trainees) 82.9% 83.6% 84.7%
- 16 -
“HCL in my opinion is an absolute pioneer in the field of it. HCL's core philosophy of having conversations “Beyond the Contract” is
an invaluable concept that more organizations should embrace.” – Chief Compliance Officer of a Japanese foreign exchange bank
Financials in for the Quarter ended `̀Financials in for the Quarter ended `31st DECEMBER, 2015 (US GAAP)
- 17 -
“The HCL Customer Advisory Council is one of the few areas where I feel there is a clear return on investment on my time. It is a
great example of successful knowledge sharing among IT leaders and between them as a group and one of their IT partners.” VP IT
& CIO of an American technology company
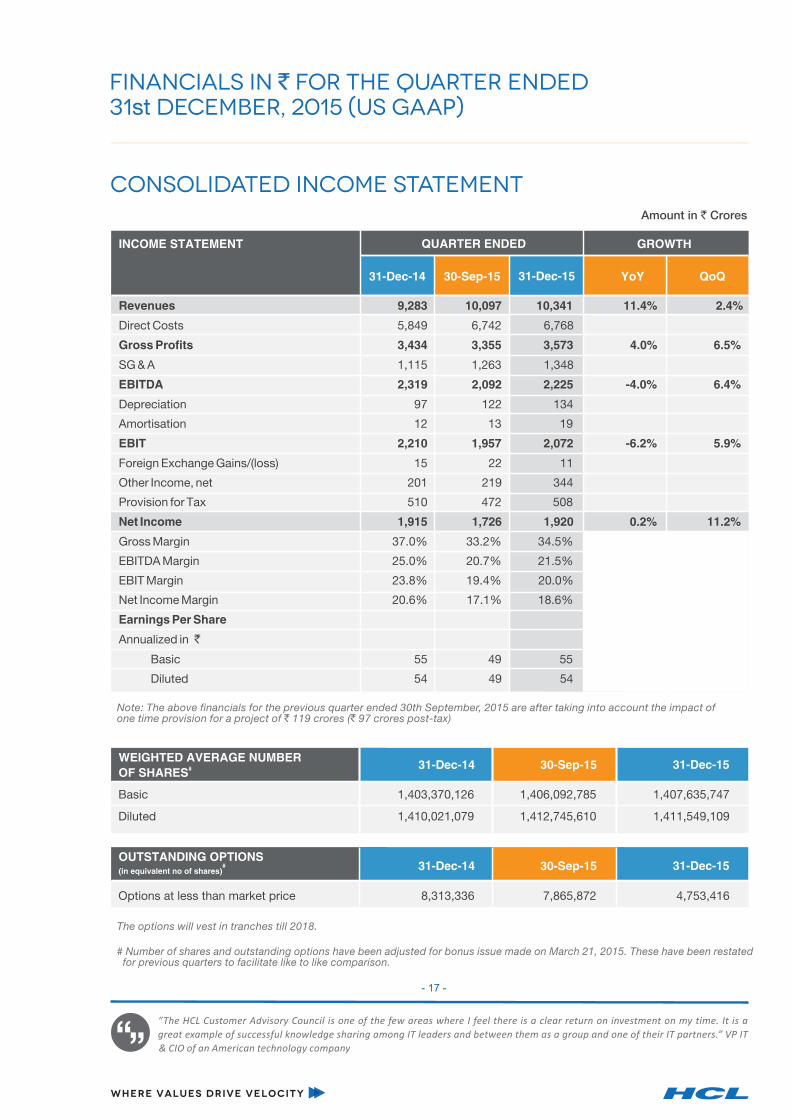
consolidated income statementQUARTER ENDED
Amount in ` Crores
# Number of shares and outstanding options have been adjusted for bonus issue made on March 21, 2015. These have been restated for previous quarters to facilitate like to like comparison.
GROWTH
31-Dec-14 30-Sep-15 YoY QoQ
QUARTER ENDED INCOME STATEMENT
31-Dec-15
Revenues 9,283 10,097 10,341 11.4% 2.4%
Direct Costs 5,849 6,742 6,768
Gross Profits 3,434 3,355 3,573 4.0% 6.5%
SG & A 1,115 1,263 1,348
EBITDA 2,319 2,092 2,225 -4.0% 6.4%
Depreciation 97 122 134
Amortisation 12 13 19
EBIT 2,210 1,957 2,072 -6.2% 5.9%
Foreign Exchange Gains/(loss) 15 22 11
Other Income, net 201 219 344
Provision for Tax 510 472 508
Net Income 1,915 1,726 1,920 0.2% 11.2%
Gross Margin 37.0% 33.2% 34.5%
EBITDA Margin 25.0% 20.7% 21.5%
EBIT Margin 23.8% 19.4% 20.0%
Net Income Margin 20.6% 17.1% 18.6%
Earnings Per Share
Annualized in ̀
Basic 55 49 55
Diluted 54 49 54
The options will vest in tranches till 2018.
WEIGHTED AVERAGE NUMBER#OF SHARES
31-Dec-14 30-Sep-15 31-Dec-15
OUTSTANDING OPTIONS#
(in equivalent no of shares)
Basic 1,403,370,126 1,406,092,785 1,407,635,747
Diluted 1,410,021,079 1,412,745,610 1,411,549,109
31-Dec-14 30-Sep-15 31-Dec-15
Options at less than market price 8,313,336 7,865,872 4,753,416
Note: The above financials for the previous quarter ended 30th September, 2015 are after taking into account the impact of one time provision for a project of ` 119 crores (` 97 crores post-tax)
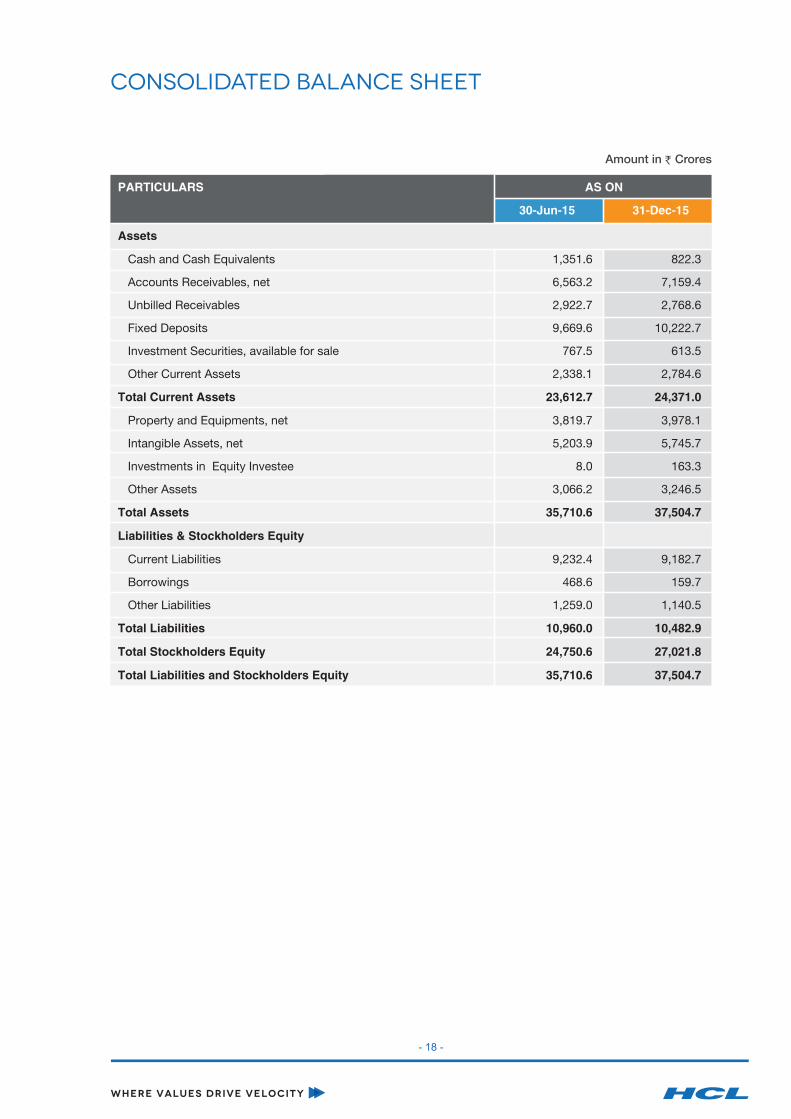
PARTICULARS AS ON
consolidated balance sheet
Amount in Crores
- 18 -
Assets
Cash and Cash Equivalents 1,351.6 822.3
Accounts Receivables, net 6,563.2 7,159.4
Unbilled Receivables 2,922.7 2,768.6
Fixed Deposits 9,669.6 10,222.7
Investment Securities, available for sale 767.5 613.5
Other Current Assets 2,338.1 2,784.6
Total Current Assets 23,612.7 24,371.0
Property and Equipments, net 3,819.7 3,978.1
Intangible Assets, net 5,203.9 5,745.7
Investments in Equity Investee 8.0 163.3
Other Assets 3,066.2 3,246.5
Total Assets 35,710.6 37,504.7
Liabilities & Stockholders Equity
Current Liabilities 9,232.4 9,182.7
Borrowings 468.6 159.7
Other Liabilities 1,259.0 1,140.5
Total Liabilities 10,960.0 10,482.9
Total Stockholders Equity 24,750.6 27,021.8
Total Liabilities and Stockholders Equity 35,710.6 37,504.7
31-Dec-1530-Jun-15

Certain statements in this release are forward-looking statements, which involve a number of risks, uncertainties, assumptions and other factors that could cause actual results to differ materially from those in such forward-looking statements. All statements, other than statements of historical fact are statements that could be deemed forward looking statements, including but not limited to the statements containing the words 'planned', 'expects', 'believes', 'strategy', 'opportunity', 'anticipates', 'hopes' or other similar words. The risks and uncertainties relating to these statements include, but are not limited to, risks and uncertainties regarding impact of pending regulatory proceedings, fluctuations in earnings, our ability to manage growth, intense competition in IT services, Business Process Outsourcing and consulting services including those factors which may affect our cost advantage, wage increases in India, customer acceptances of our services, products and fee structures, our ability to attract and retain highly skilled professionals, our ability to integrate acquired assets in a cost effective and timely manner, time and cost overruns on fixed-price, fixed-time frame contracts, client concentration, restrictions on immigration, our ability to manage our international operations, reduced demand for technology in our key focus areas, disruptions in telecommunication networks, our ability to successfully complete and integrate potential acquisitions, the success of our brand development efforts, liability for damages on our service contracts, the success of the companies / entities in which we have made strategic investments, withdrawal of governmental fiscal incentives, political instability, legal restrictions on raising capital or acquiring companies outside India, and unauthorized use of our intellectual property, other risks, uncertainties and general economic conditions affecting our industry. There can be no assurance that the forward looking statements made herein will prove to be accurate, and issuance of such forward looking statements should not be regarded as a representation by the Company, or any other person, that the objective and plans of the Company will be achieved. All forward looking statements made herein are based on information presently available to the management of the Company and the Company does not undertake to update any forward-looking statement that may be made from time to time by or on behalf of the Company.
HCL Technologies is a leading global IT services company working with clients in areas that impact and redefine the core of their businesses. Since its emergence on global landscape after its IPO in 1999 and listing in 2000, HCL Technologies, along with its subsidiaries, today operates out of 32 countries and has consolidated revenues of US$ 6.1 billion, as on 31st December 2015 (on CY basis). HCL focuses on 'transformational outsourcing', underlined by innovation and value creation, offering an integrated portfolio of services including Enterprise Digitalization, Internet of Things, Engineering Services Outsourcing and Next Generation IT Outsourcing that focuses on transformation-led infrastructure services, applications services and business services. HCL leverages its extensive global delivery capabilities and integrated innovation labs across the world to provide holistic, multi-service delivery in key industry verticals including Financial Services, Manufacturing, Telecommunications, Media, Publishing & Entertainment, Retail & CPG, Life sciences & Healthcare, Oil & Gas, Energy & Utilities, Travel, Transportation & Logistics and Government. With 103,696 professionals from diverse nationalities, HCL Technologies focuses on creating real value for customers by taking 'Relationships Beyond the Contract'. For more information, please visit www.hcltech.com
about hcl technologies
safe harbor statement
- 19 -

INVESTOR RELATIONS
For details, contact:
Sanjay Mendiratta
+91-120-2546043
Pulkit Mittal
+91-120-4013639
HCL Technologies Ltd., A 10-11, Sector-III, Noida - 201301, India. www.hcltech.com
www.hcltech.com/investors
CORPORATE COMMUNICATIONS
Ajay Davessar
+91-120-4382800
Kunal Takalkar
+91-120-4382800
Hi, I am an ideapreneur. I believe that sustainable business outcomes are driven by relationships
nurtured through values like trust, transparency and flexibility. I respect the contract, but will do
whatever it takes, over and above it, to ensure your success. Right now 100,000+ ideapreneurs are in
a Relationship Beyond the Contract™ with 500+ customers in 32 countries. How can I help you?
talk to me