Embed Size (px)
Citation preview

1
Investors Presentation(Updated with Quantitative details for 2011-12)
July, 2012
2
Disclaimer
This presentation contains forward-looking statements which may be identified by their use of words contains “plans,” “expects,” “will,” “anticipates,”“believes,” “intends,” “projects,” “estimates” or other words of similar meaning. All statements that address expectations or projections about the future, including, but not limited to, statements about the strategy for growth, product development, market position, expenditures, and financial results, are forward-looking statements.
Forward-looking statements are based on certain assumptions and expectations of future events. The companies referred to in this presentation cannot guarantee that these assumptions and expectations are accurate or will be realised. The actual results, performance or achievements, could thus differ materially from those projected in any such forward-looking statements. These companies assume no responsibility to publicly amend, modify or revise any forward looking statements, on the basis of any subsequent developments, information or events, or otherwise
3
SND 24-28SND 24-28
Crop protection 29-36Crop protection 29-36
Retail 37-40Retail 37-40
Financial Performance 41-54Financial Performance 41-54
Contents
Fertiliser 7-23Fertiliser 7-23
Awards and Accolades 55-57Awards and Accolades 55-57
Company Profile 4Company Profile 4
4
Coromandel Share in Murugappa Group
Coromandel Share in Murugappa Group
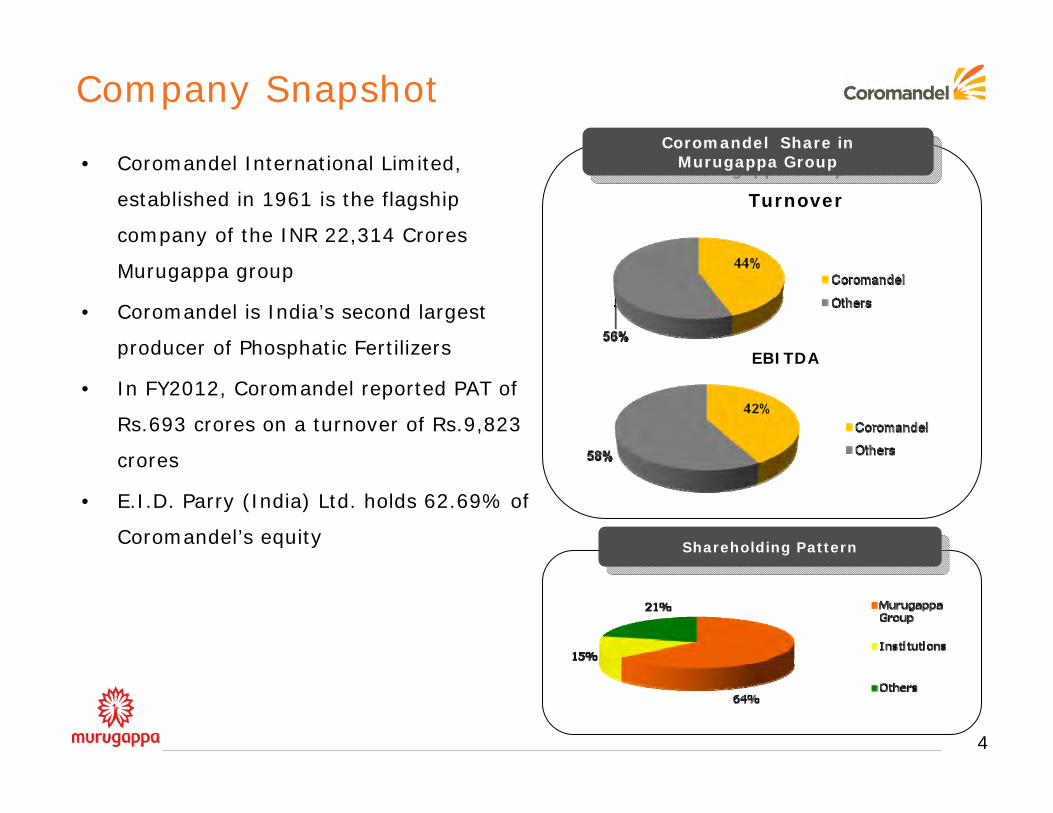
Company Snapshot
• Coromandel International Limited,
established in 1961 is the flagship
company of the INR 22,314 Crores
Murugappa group
• Coromandel is India’s second largest
producer of Phosphatic Fertilizers
• In FY2012, Coromandel reported PAT of
Rs.693 crores on a turnover of Rs.9,823
crores
• E.I.D. Parry (India) Ltd. holds 62.69% of
Coromandel’s equityShareholding PatternShareholding Pattern
Turnover
EBITDA
5
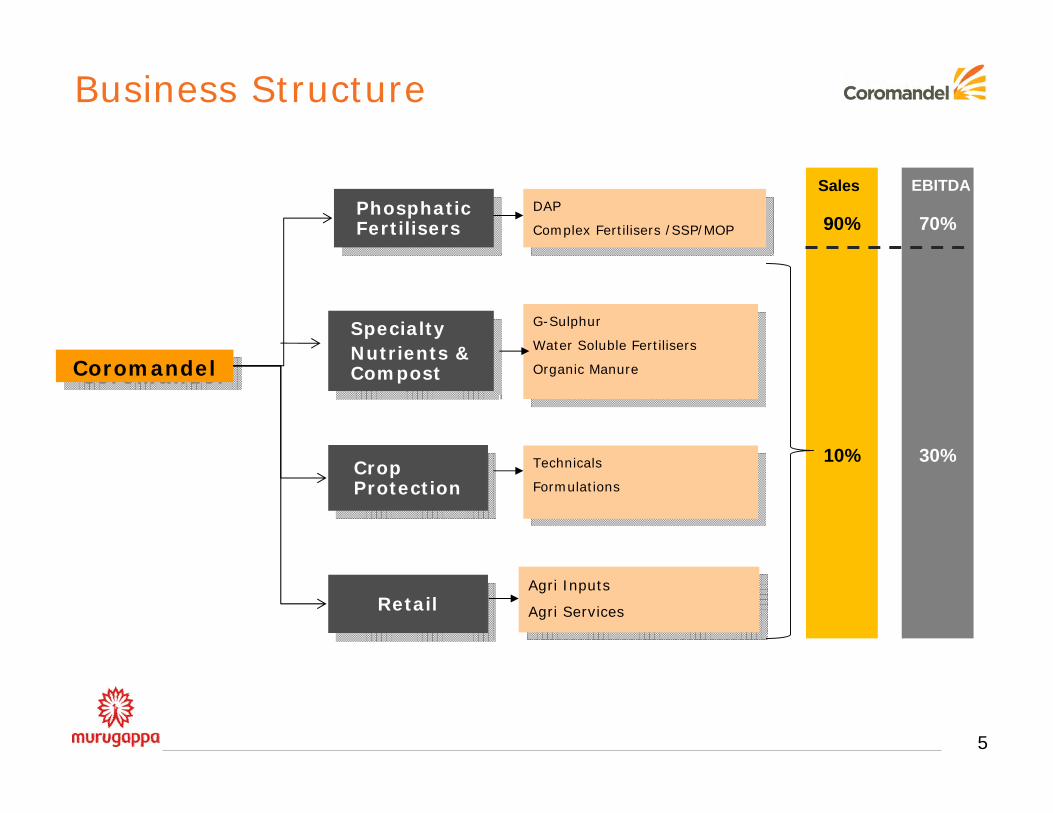
Business Structure
CoromandelCoromandel
Phosphatic Fertilisers
Phosphatic Fertilisers
Crop Protection
Crop Protection
RetailRetail
Specialty Nutrients & Compost
Specialty Nutrients & Compost
DAP
Complex Fertilisers /SSP/MOP
DAP
Complex Fertilisers /SSP/MOP
Technicals
Formulations
Technicals
Formulations
G-Sulphur
Water Soluble Fertilisers
Organic Manure
G-Sulphur
Water Soluble Fertilisers
Organic Manure
Agri Inputs
Agri Services
Agri Inputs
Agri Services
70%90%
30%10%
Sales EBITDA
6
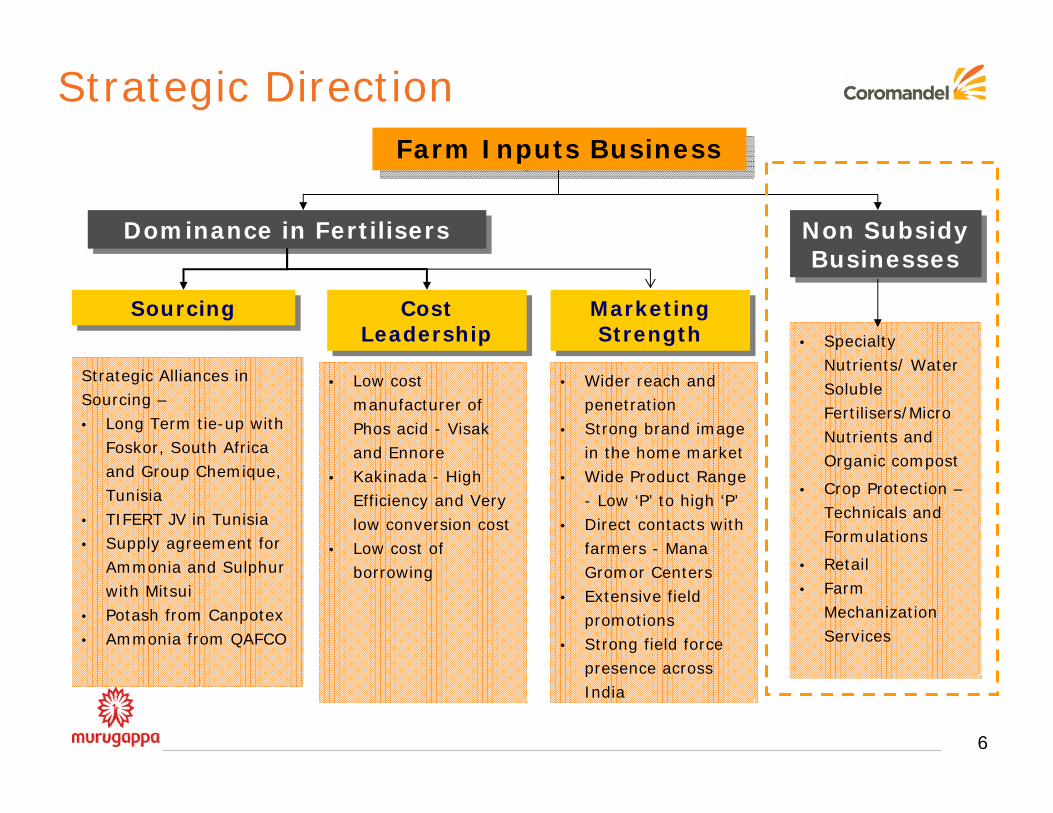
Strategic Direction
Farm Inputs BusinessFarm Inputs Business
Cost Leadership
Cost Leadership
Dominance in FertilisersDominance in Fertilisers Non Subsidy Businesses
Non Subsidy Businesses
SourcingSourcing
Strategic Alliances inSourcing –• Long Term tie-up with
Foskor, South Africa and Group Chemique, Tunisia
• TIFERT JV in Tunisia• Supply agreement for
Ammonia and Sulphur with Mitsui
• Potash from Canpotex • Ammonia from QAFCO
• Low cost manufacturer of Phos acid - Visak and Ennore
• Kakinada - High Efficiency and Very low conversion cost
• Low cost of borrowing
Marketing Strength
Marketing Strength
• Wider reach and penetration
• Strong brand image in the home market
• Wide Product Range - Low ‘P’ to high ‘P’
• Direct contacts with farmers - Mana Gromor Centers
• Extensive field promotions
• Strong field force presence across India
• Specialty Nutrients/ Water Soluble Fertilisers/Micro Nutrients and Organic compost
• Crop Protection –Technicals and Formulations
• Retail • Farm
Mechanization Services
7
Coromandel’s Fertiliser Business
8
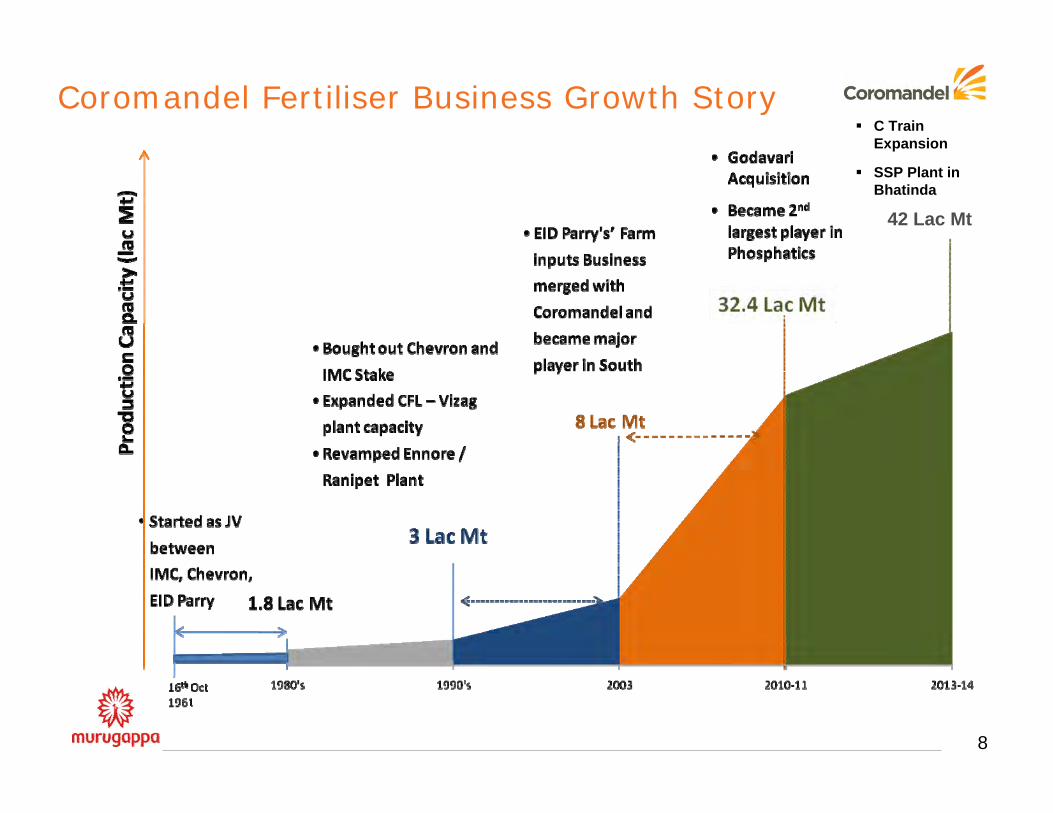
Coromandel Fertiliser Business Growth Story
42 Lac Mt
C Train Expansion
SSP Plant in Bhatinda
9
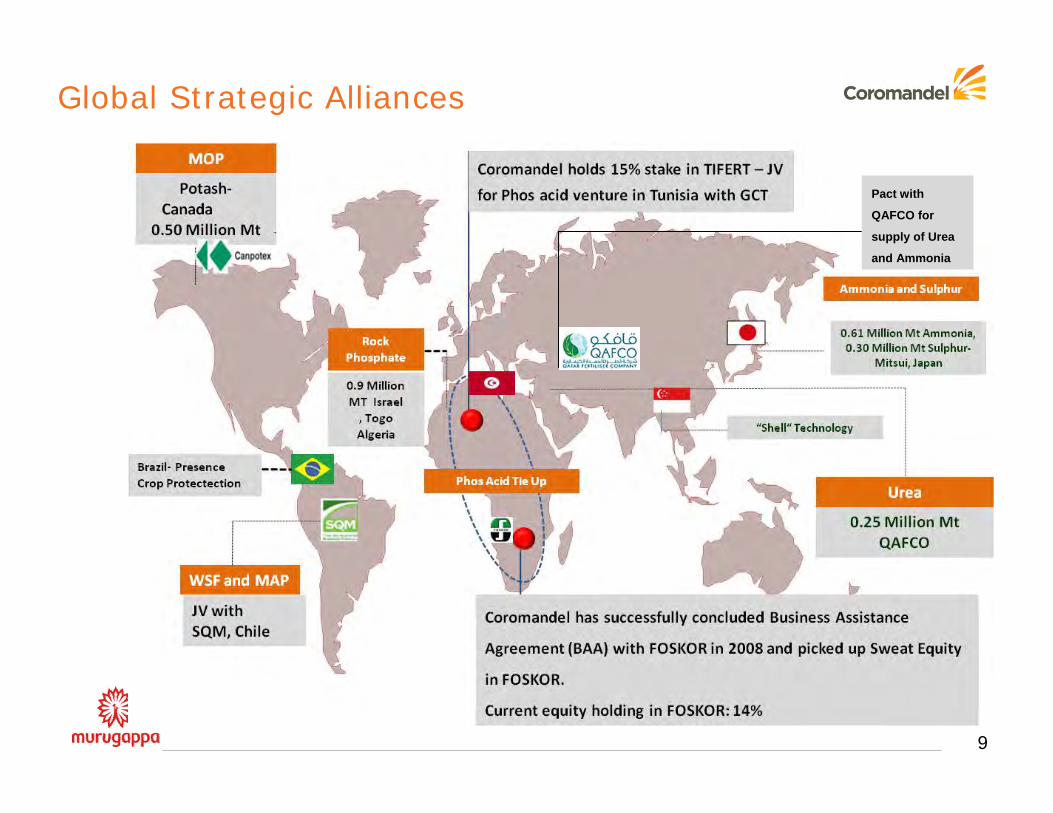
Global Strategic Alliances
Pact with
QAFCO for
supply of Urea
and Ammonia
10
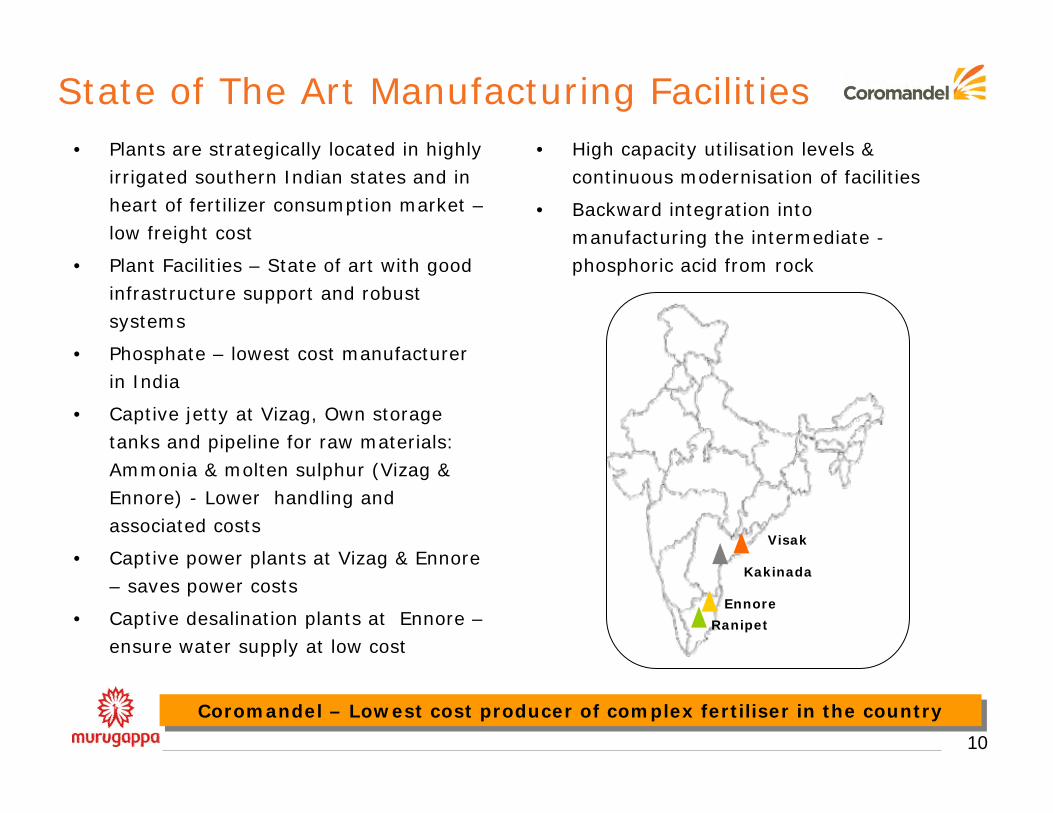
State of The Art Manufacturing Facilities
Coromandel – Lowest cost producer of complex fertiliser in the countryCoromandel – Lowest cost producer of complex fertiliser in the country
• Plants are strategically located in highly irrigated southern Indian states and in heart of fertilizer consumption market –low freight cost
• Plant Facilities – State of art with good infrastructure support and robust systems
• Phosphate – lowest cost manufacturer in India
• Captive jetty at Vizag, Own storage tanks and pipeline for raw materials: Ammonia & molten sulphur (Vizag & Ennore) - Lower handling and associated costs
• Captive power plants at Vizag & Ennore – saves power costs
• Captive desalination plants at Ennore –ensure water supply at low cost
• High capacity utilisation levels & continuous modernisation of facilities
• Backward integration into manufacturing the intermediate -phosphoric acid from rock
Visak
Kakinada
Ennore
Ranipet
11
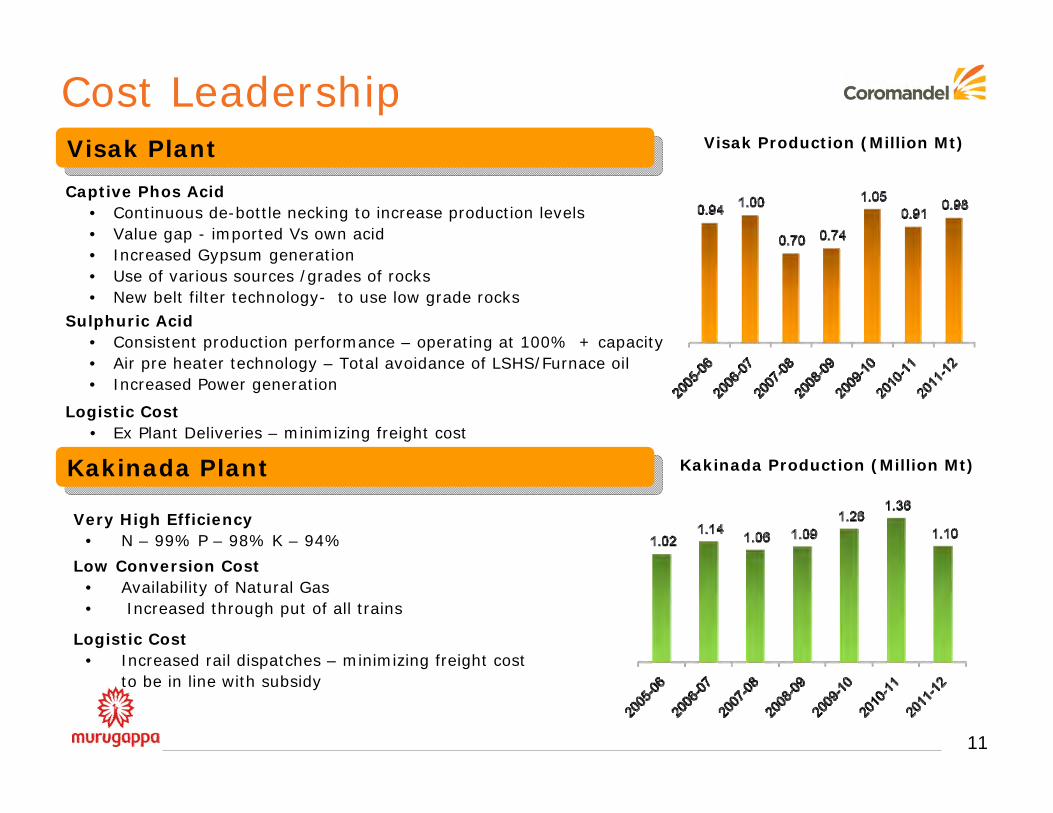
Captive Phos Acid • Continuous de-bottle necking to increase production levels• Value gap - imported Vs own acid• Increased Gypsum generation• Use of various sources /grades of rocks• New belt filter technology- to use low grade rocks
Sulphuric Acid• Consistent production performance – operating at 100% + capacity• Air pre heater technology – Total avoidance of LSHS/Furnace oil• Increased Power generation
Cost Leadership
Very High Efficiency• N – 99% P – 98% K – 94%
Low Conversion Cost• Availability of Natural Gas• Increased through put of all trains
Logistic Cost• Increased rail dispatches – minimizing freight cost
to be in line with subsidy
Logistic Cost• Ex Plant Deliveries – minimizing freight cost
Kakinada Production (Million Mt)
Visak Production (Million Mt)Visak PlantVisak Plant
Kakinada PlantKakinada Plant
12
Visak
Kakinada
Ennore
Ranipet
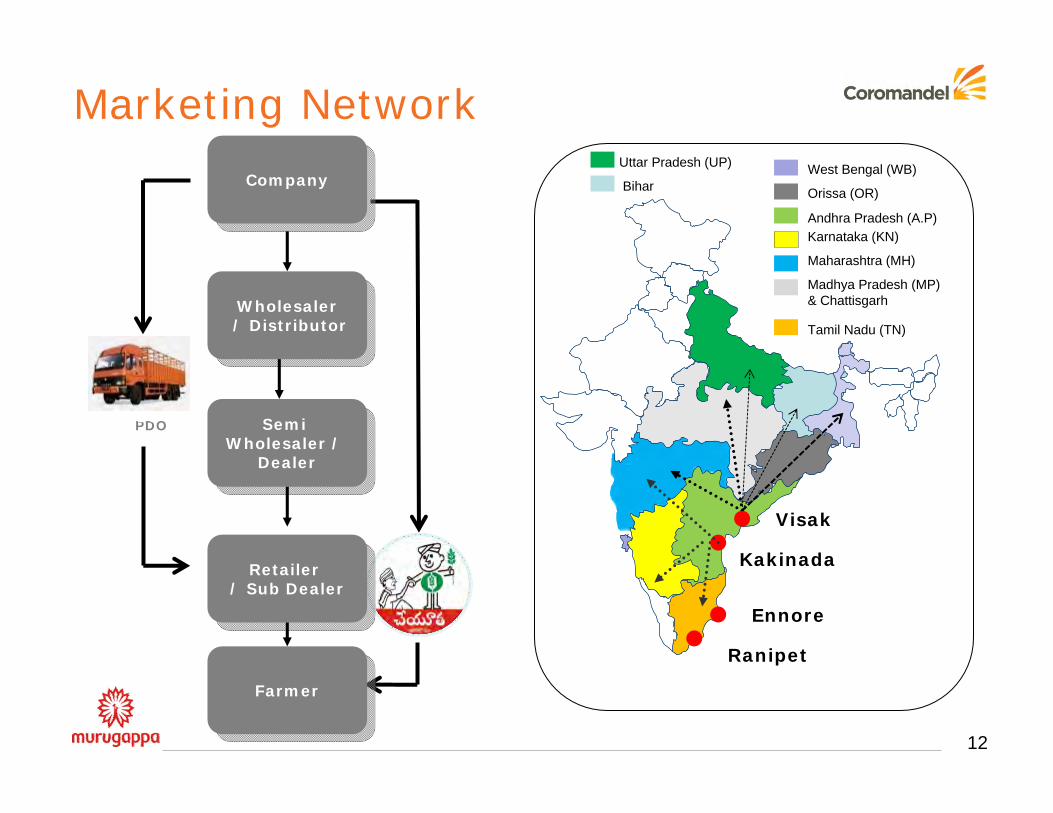
PDOPDO
CompanyCompany
Wholesaler/ Distributor
Wholesaler/ Distributor
Semi Wholesaler /
Dealer
Semi Wholesaler /
Dealer
Retailer / Sub Dealer
Retailer / Sub Dealer
FarmerFarmer
West Bengal (WB)
Orissa (OR)
Andhra Pradesh (A.P)Karnataka (KN)
Maharashtra (MH)
Madhya Pradesh (MP) & Chattisgarh
Tamil Nadu (TN)
Marketing NetworkUttar Pradesh (UP)
Bihar

BUSINESS UPDATE – JUNE’12
13
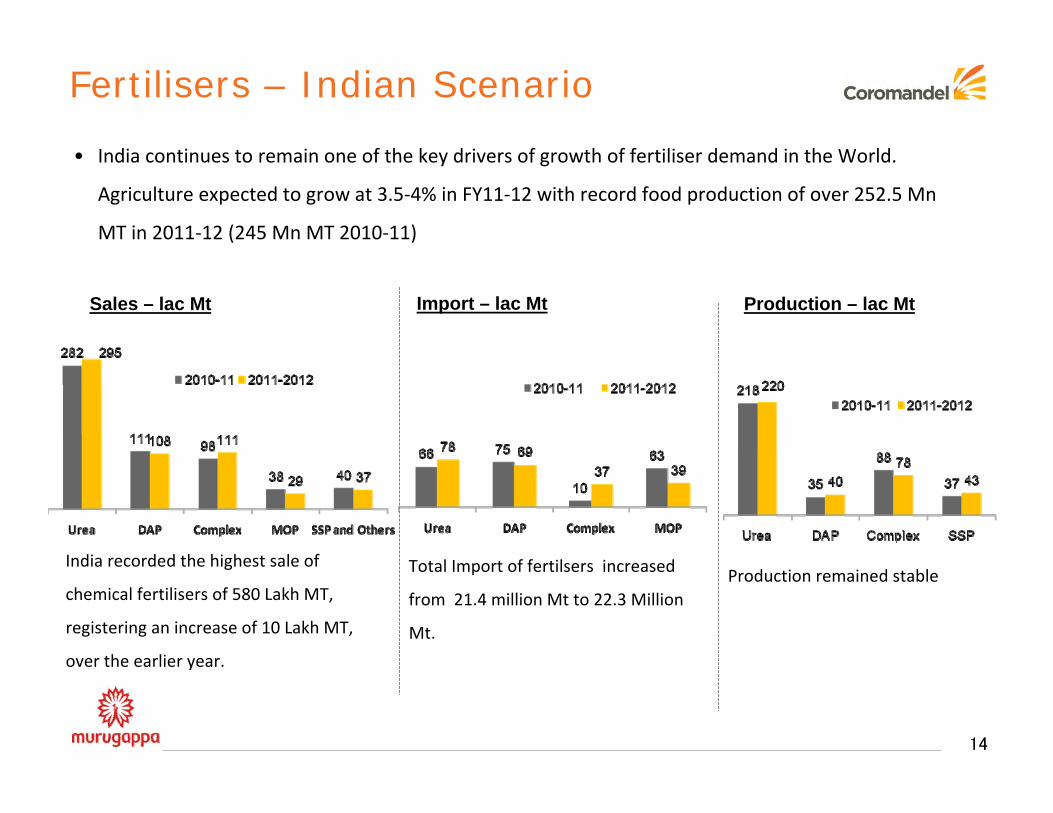
Fertilisers – Indian Scenario
• India continues to remain one of the key drivers of growth of fertiliser demand in the World.
Agriculture expected to grow at 3.5‐4% in FY11‐12 with record food production of over 252.5 Mn
MT in 2011‐12 (245 Mn MT 2010‐11)
14
India recorded the highest sale of
chemical fertilisers of 580 Lakh MT,
registering an increase of 10 Lakh MT,
over the earlier year.
Sales – lac Mt Import – lac Mt
Total Import of fertilsers increased
from 21.4 million Mt to 22.3 Million
Mt.
Production – lac Mt
Production remained stable
15
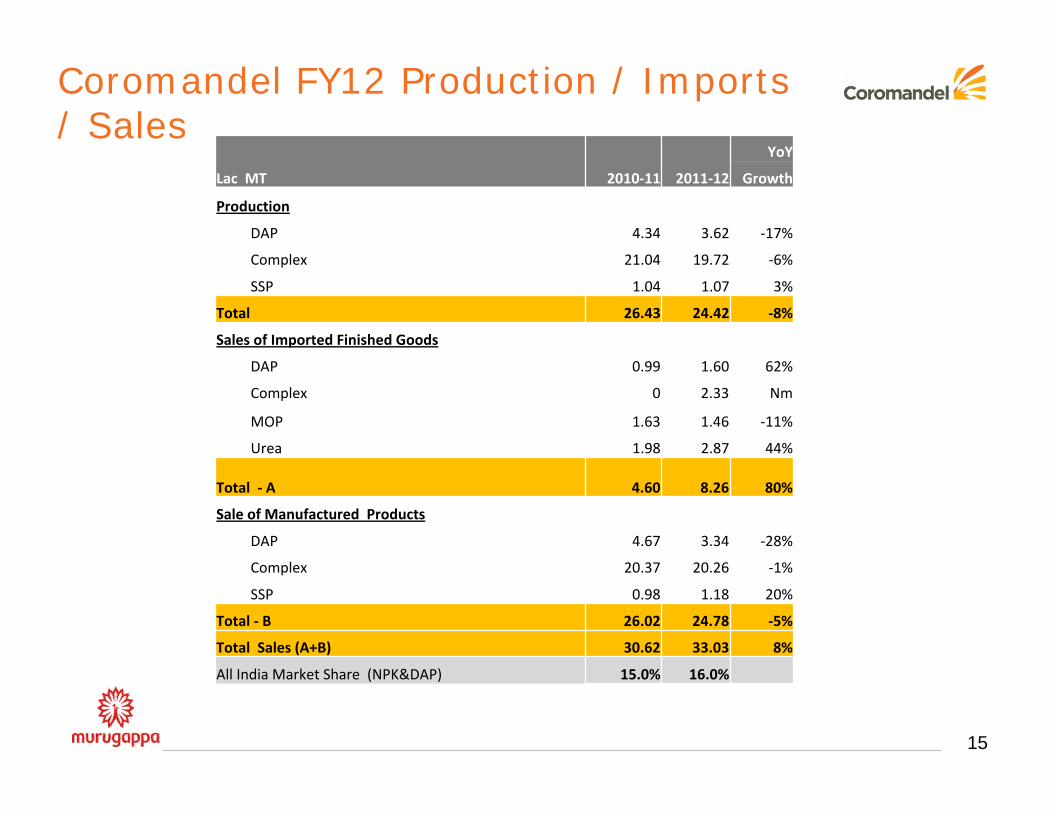
Coromandel FY12 Production / Imports / Sales
Lac MT 2010‐11 2011‐12
YoY
Growth
Production
DAP 4.34 3.62 ‐17%
Complex 21.04 19.72 ‐6%
SSP 1.04 1.07 3%
Total 26.43 24.42 ‐8%
Sales of Imported Finished Goods
DAP 0.99 1.60 62%
Complex 0 2.33 Nm
MOP 1.63 1.46 ‐11%
Urea 1.98 2.87 44%
Total ‐ A 4.60 8.26 80%
Sale of Manufactured Products
DAP 4.67 3.34 ‐28%
Complex 20.37 20.26 ‐1%
SSP 0.98 1.18 20%
Total ‐ B 26.02 24.78 ‐5%
Total Sales (A+B) 30.62 33.03 8%
All India Market Share (NPK&DAP) 15.0% 16.0%
16
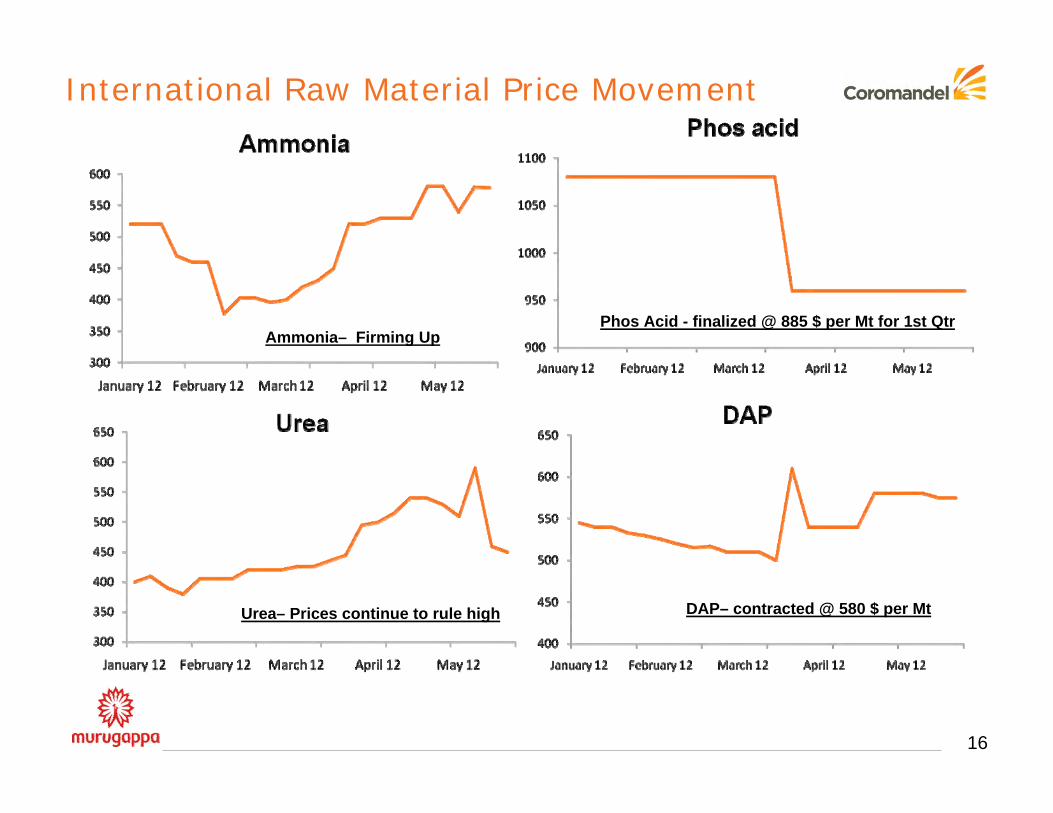
International Raw Material Price Movement
Ammonia– Firming Up
Urea– Prices continue to rule high DAP– contracted @ 580 $ per Mt
Phos Acid - finalized @ 885 $ per Mt for 1st Qtr
17
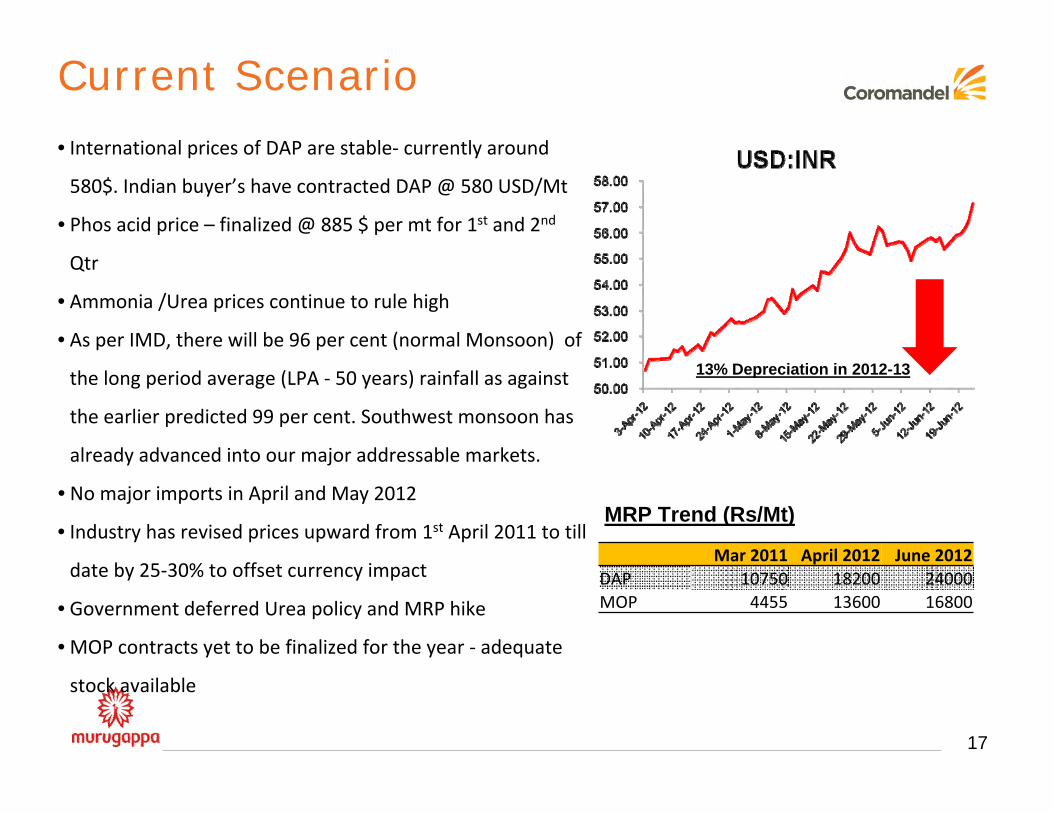
Current Scenario
• International prices of DAP are stable‐ currently around
580$. Indian buyer’s have contracted DAP @ 580 USD/Mt
• Phos acid price – finalized @ 885 $ per mt for 1st and 2nd
Qtr
• Ammonia /Urea prices continue to rule high
• As per IMD, there will be 96 per cent (normal Monsoon) of
the long period average (LPA ‐ 50 years) rainfall as against
the earlier predicted 99 per cent. Southwest monsoon has
already advanced into our major addressable markets.
• No major imports in April and May 2012
• Industry has revised prices upward from 1st April 2011 to till
date by 25‐30% to offset currency impact
• Government deferred Urea policy and MRP hike
• MOP contracts yet to be finalized for the year ‐ adequate
stock available
13% Depreciation in 2012-13
Mar 2011 April 2012 June 2012DAP 10750 18200 24000MOP 4455 13600 16800
MRP Trend (Rs/Mt)
18
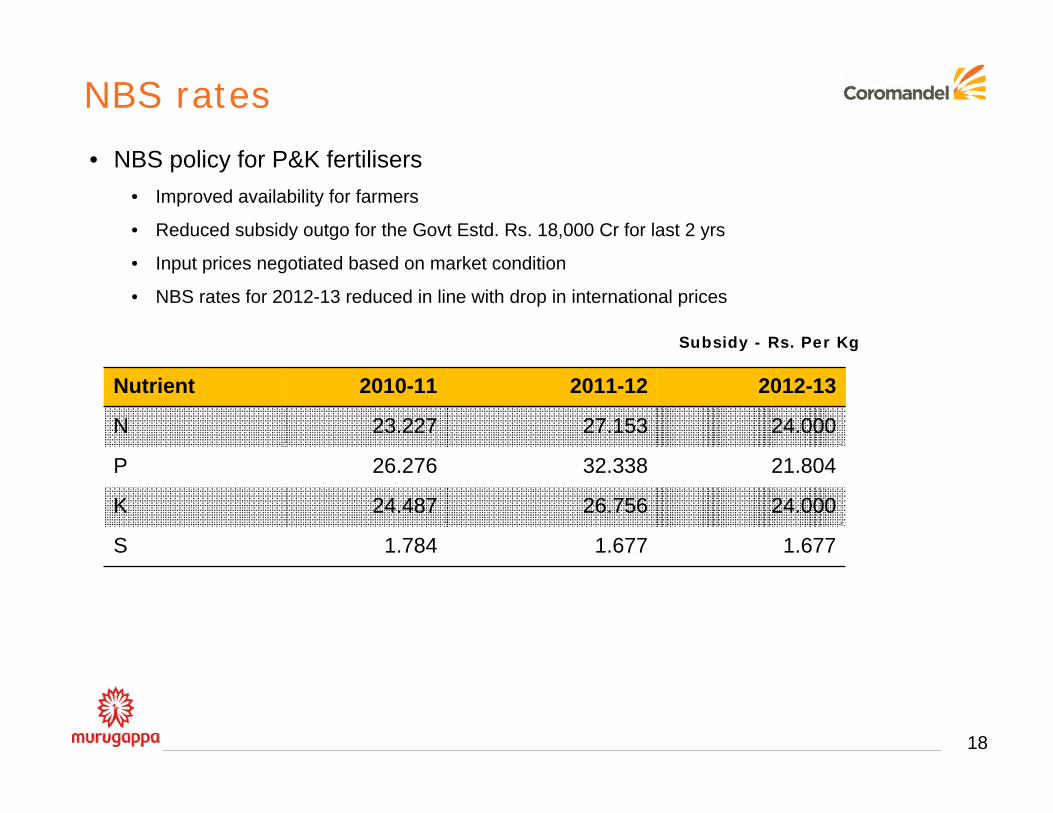
NBS rates
Nutrient 2010-11 2011-12 2012-13
N 23.227 27.153 24.000
P 26.276 32.338 21.804
K 24.487 26.756 24.000
S 1.784 1.677 1.677
Subsidy - Rs. Per Kg
• NBS policy for P&K fertilisers• Improved availability for farmers
• Reduced subsidy outgo for the Govt Estd. Rs. 18,000 Cr for last 2 yrs
• Input prices negotiated based on market condition
• NBS rates for 2012-13 reduced in line with drop in international prices
19
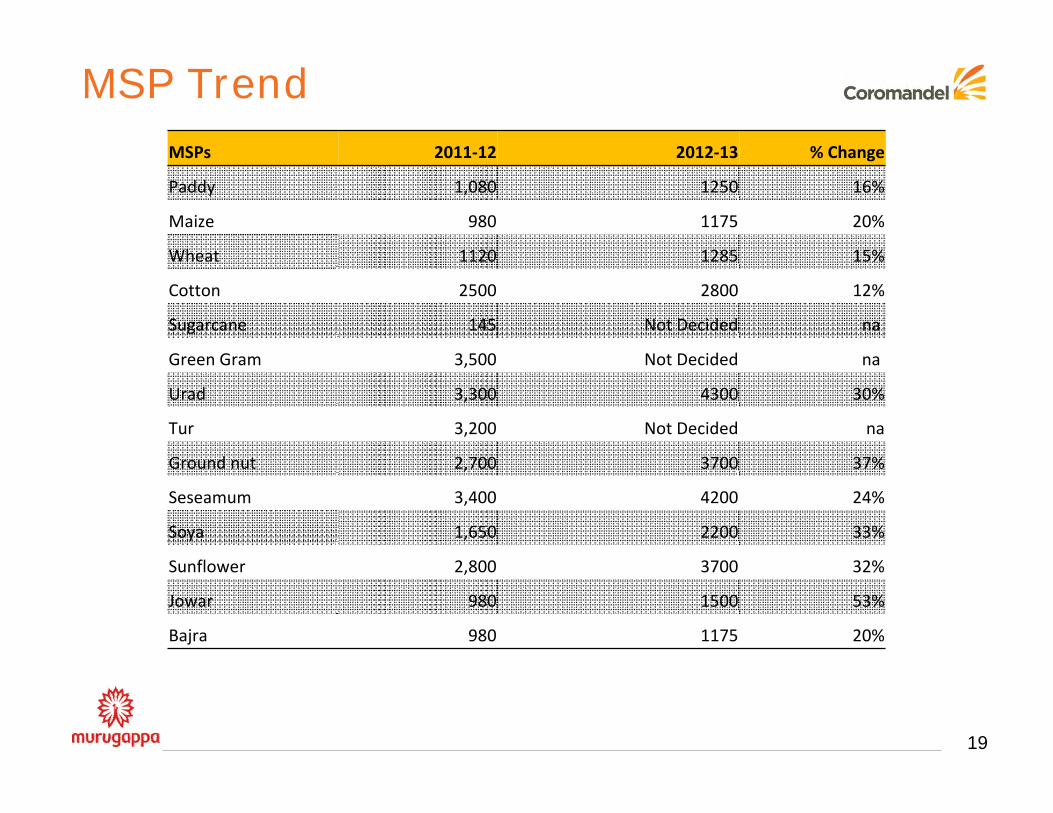
MSP TrendMSPs 2011‐12 2012‐13 % Change
Paddy 1,080 1250 16%
Maize 980 1175 20%
Wheat 1120 1285 15%
Cotton 2500 2800 12%
Sugarcane 145 Not Decided na
Green Gram 3,500 Not Decided na
Urad 3,300 4300 30%
Tur 3,200 Not Decided na
Ground nut 2,700 3700 37%
Seseamum 3,400 4200 24%
Soya 1,650 2200 33%
Sunflower 2,800 3700 32%
Jowar 980 1500 53%
Bajra 980 1175 20%
20
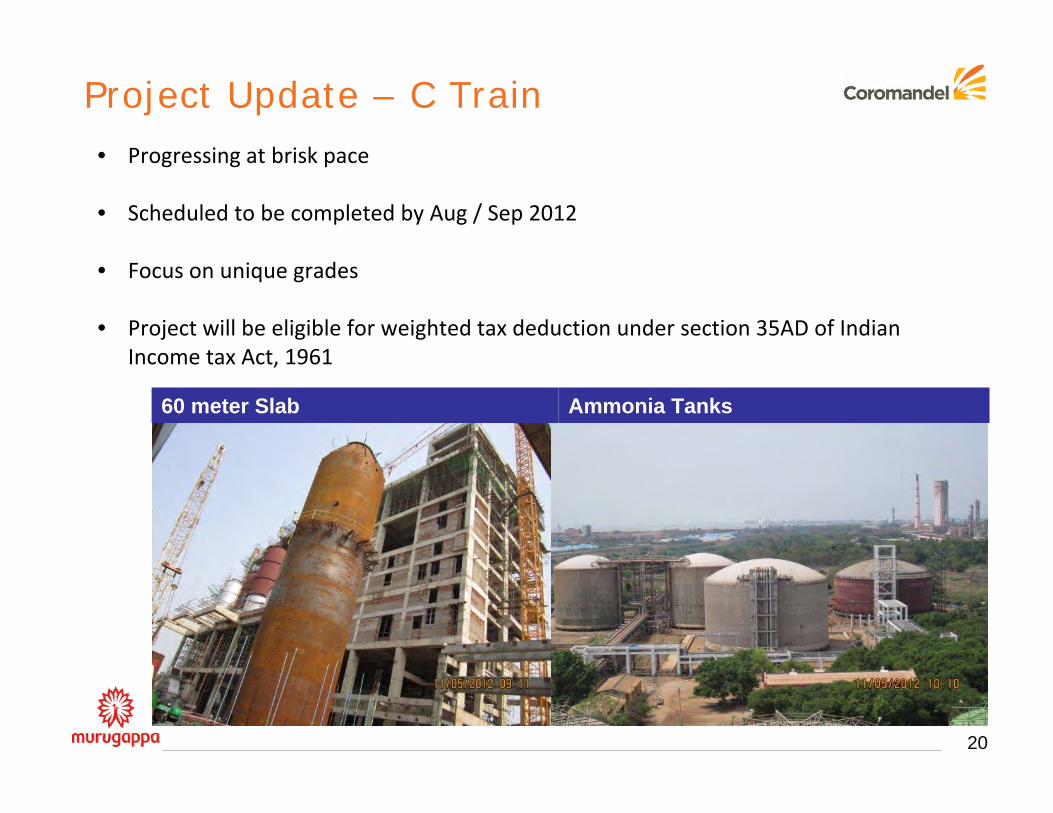
Project Update – C Train• Progressing at brisk pace
• Scheduled to be completed by Aug / Sep 2012
• Focus on unique grades
• Project will be eligible for weighted tax deduction under section 35AD of Indian Income tax Act, 1961
60 meter Slab Ammonia Tanks
21
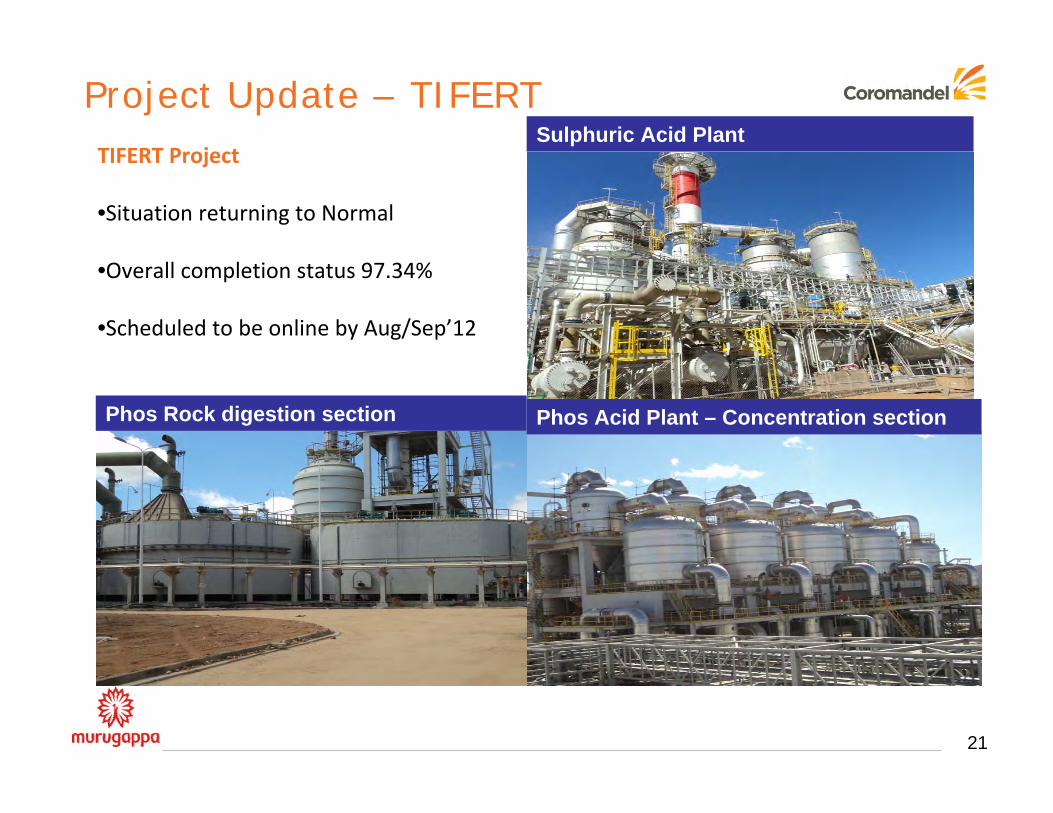
Project Update – TIFERTTIFERT Project
•Situation returning to Normal
•Overall completion status 97.34%
•Scheduled to be online by Aug/Sep’12
Sulphuric Acid Plant
Phos Acid Plant – Concentration sectionPhos Rock digestion section

22
Project Update – SSPSSP Bhatinda
•Sulphur being tie up with HPCL Mittal Energy Limited refinery
•Land is being finalized and activity will commence shortly
•Plant will be commissioned in 2013‐14
23
Weighted deduction of 150% available under Section 35AD for fertilizer projects
Import of manufacturing equipment for fertilisers exempted from custom duty for
3 years ‐ currently at 5%
Withholding tax on ECBs for fertiliser sector reduced from 20% to 5% for 3 years
In FY13 the government is looking to transfer subsidy to wholesalers/retailers thru
a mobile‐based Fertilizer Management System ‐ likely to help fertiliser companies
improve their working capital efficiency
Govt to continue to pay subsidies in cash and not in bonds
Raise the target for agricultural credit in 2012‐13 to Rs.5. 75 lac crore from Rs.4.75
lac crore
Allocation for Accelerated Irrigation Benefit Programme (AIBP) in 2012‐13 stepped
up by 13 per cent to Rs. 14,242 crore.
Positive developments from finance bill 2012
24
Specialty Nutrient Business
25
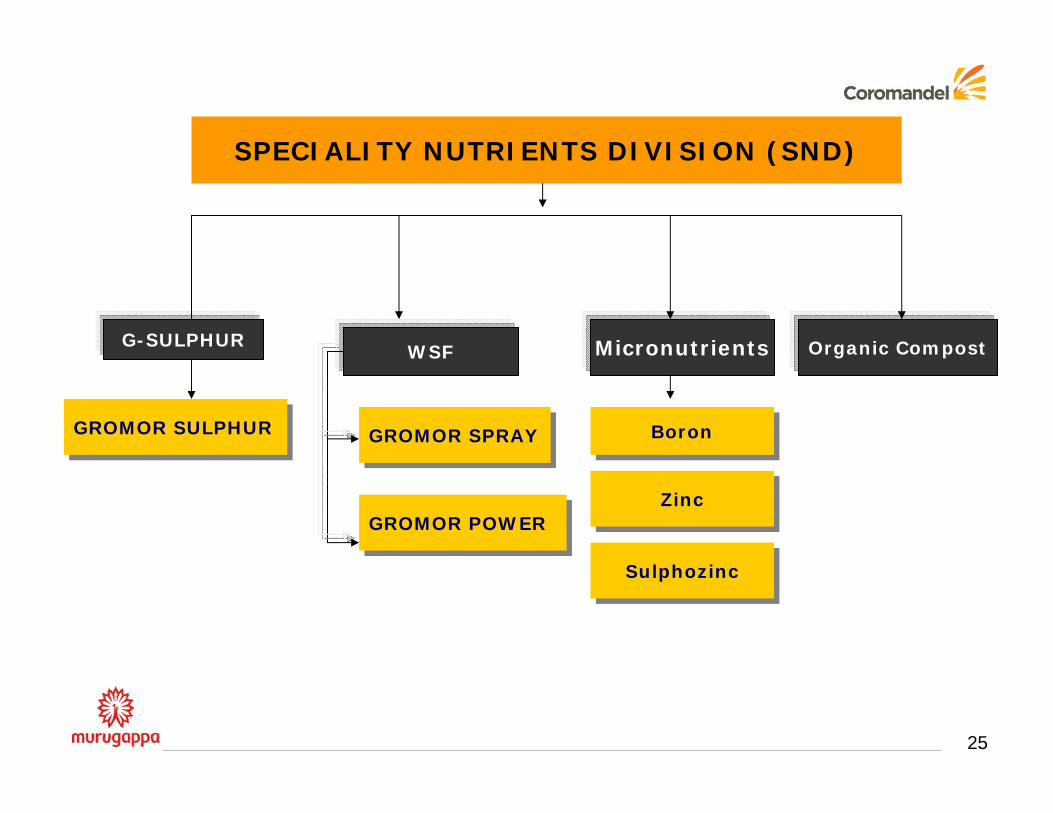
SPECIALITY NUTRIENTS DIVISION (SND)
G-SULPHURWSF Micronutrients
GROMOR SULPHURGROMOR SULPHURGROMOR SPRAYGROMOR SPRAY
GROMOR POWERGROMOR POWERZincZinc
SulphozincSulphozinc
BoronBoron
Organic Compost
26
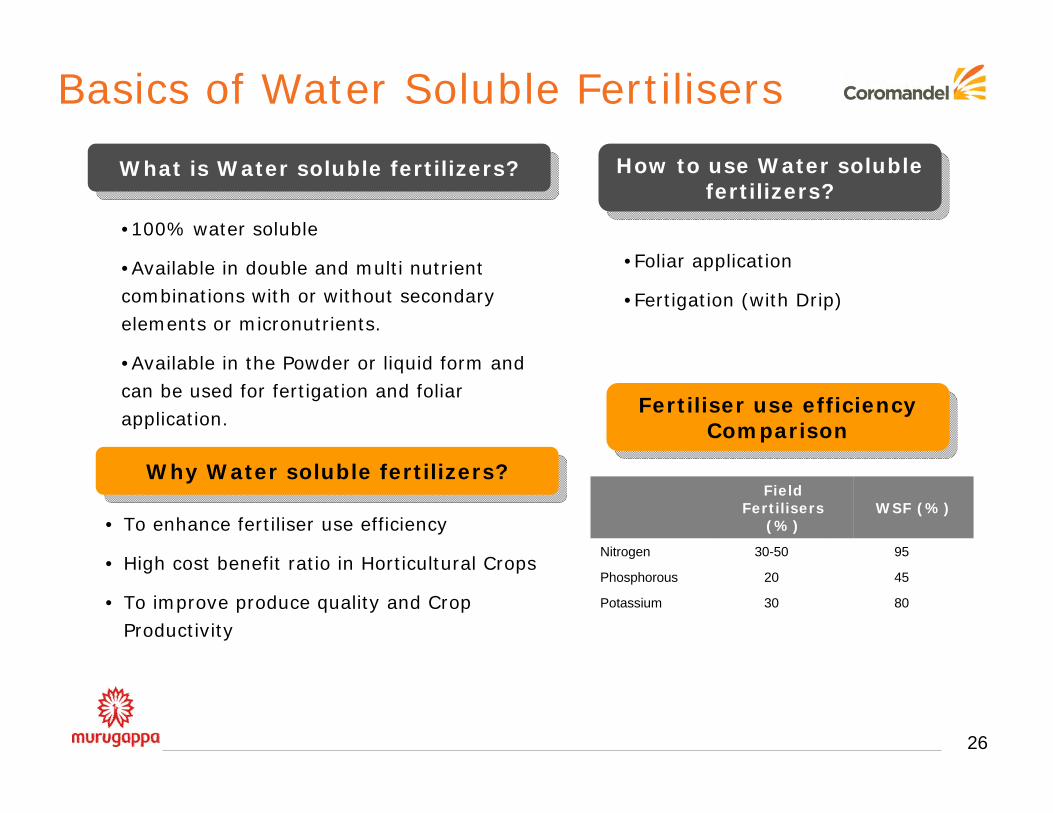
What is Water soluble fertilizers?What is Water soluble fertilizers?
Why Water soluble fertilizers?Why Water soluble fertilizers?
• To enhance fertiliser use efficiency
• High cost benefit ratio in Horticultural Crops
• To improve produce quality and Crop Productivity
How to use Water soluble fertilizers?
How to use Water soluble fertilizers?
•Foliar application
•Fertigation (with Drip)
Field Fertilisers
(%)WSF (%)
Nitrogen 30-50 95
Phosphorous 20 45
Potassium 30 80
•100% water soluble
•Available in double and multi nutrient combinations with or without secondary elements or micronutrients.
•Available in the Powder or liquid form and can be used for fertigation and foliar application.
Basics of Water Soluble Fertilisers
Fertiliser use efficiency Comparison
Fertiliser use efficiency Comparison
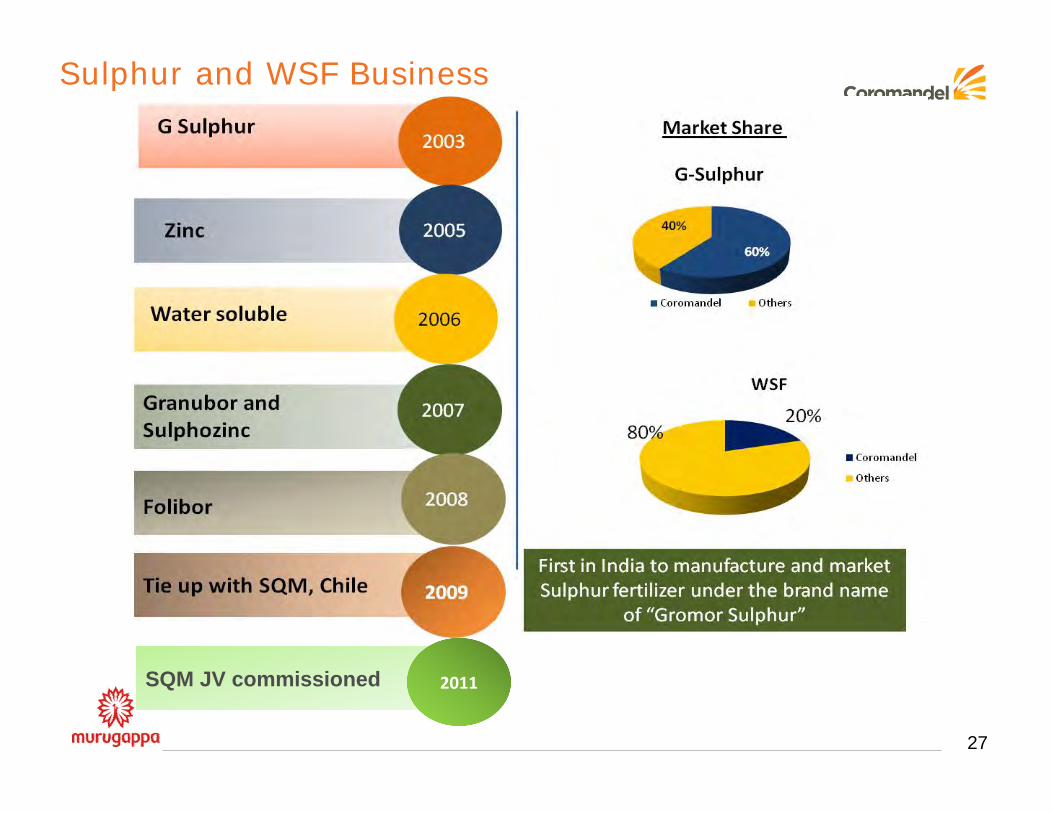
SQM JV commissioned
27
Sulphur and WSF Business
2011
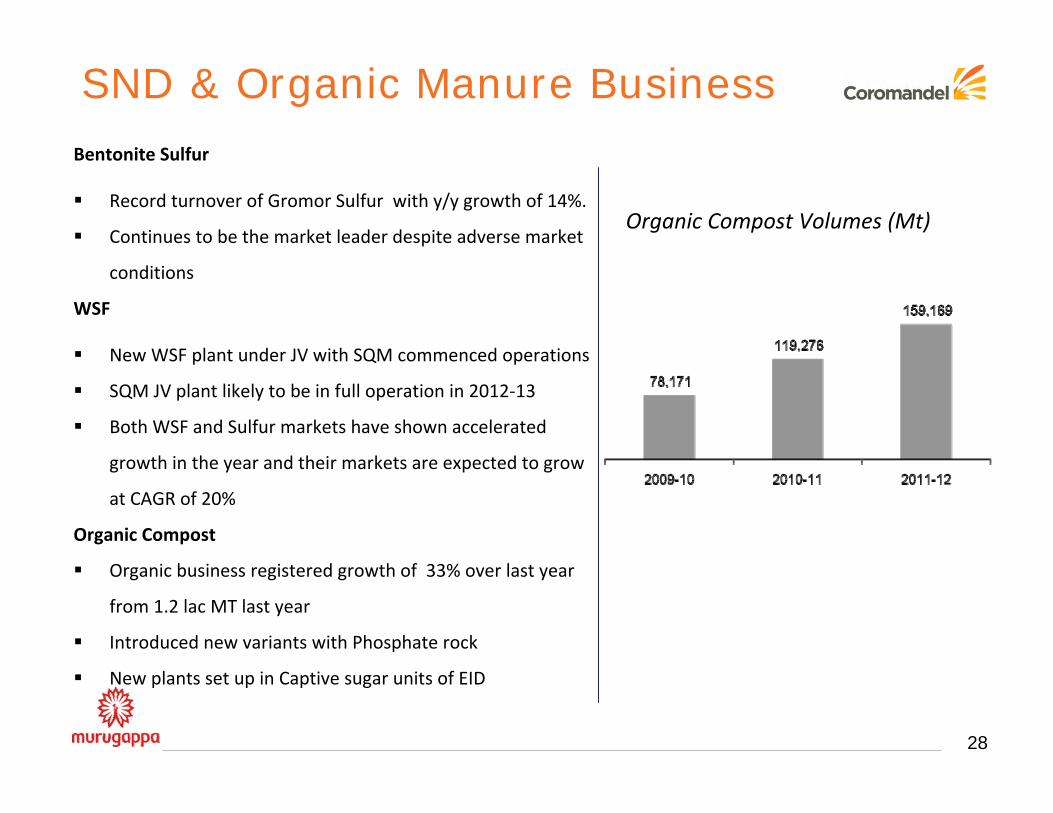
Bentonite Sulfur
Record turnover of Gromor Sulfur with y/y growth of 14%.
Continues to be the market leader despite adverse market
conditions
WSF
New WSF plant under JV with SQM commenced operations
SQM JV plant likely to be in full operation in 2012‐13
Both WSF and Sulfur markets have shown accelerated
growth in the year and their markets are expected to grow
at CAGR of 20%
Organic Compost
Organic business registered growth of 33% over last year
from 1.2 lac MT last year
Introduced new variants with Phosphate rock
New plants set up in Captive sugar units of EID
SND & Organic Manure Business
28
Organic Compost Volumes (Mt)
29
Crop Protection Business
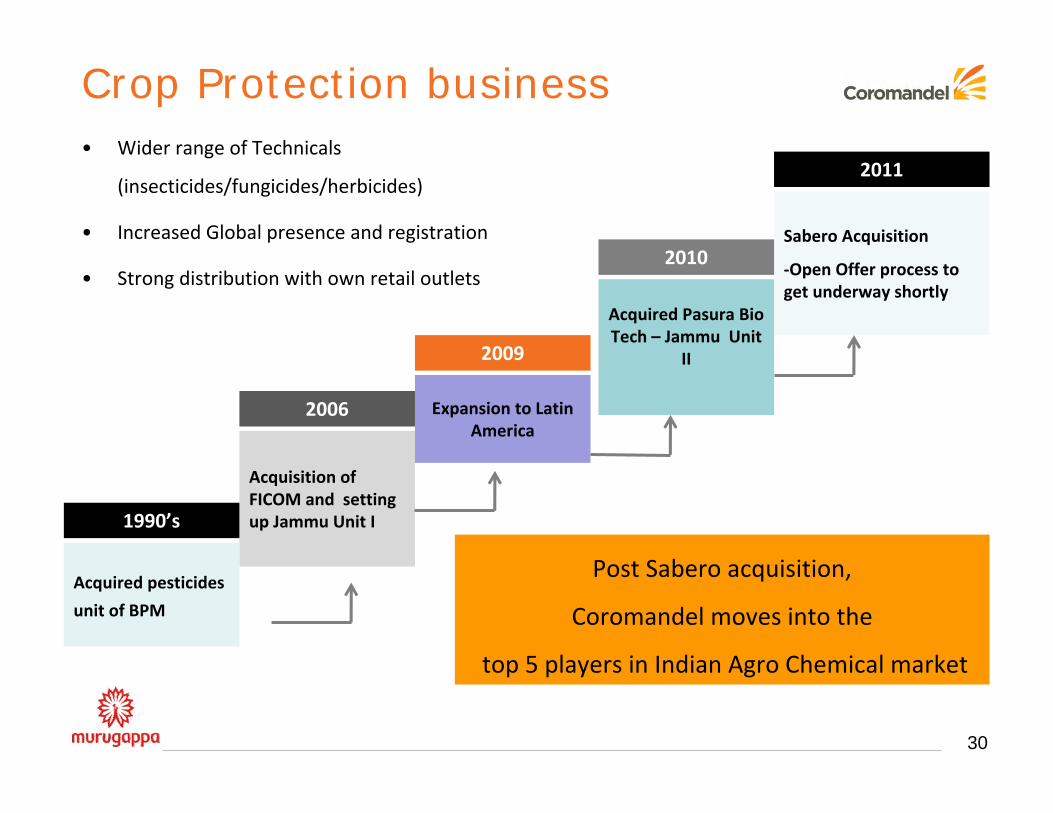
Acquisition of FICOM and setting up Jammu Unit I
Expansion to Latin America
Acquired Pasura Bio Tech – Jammu Unit
II
Sabero Acquisition
‐Open Offer process to get underway shortly
2006
2010
2011
2009
Acquired pesticides
unit of BPM
1990’s
Post Sabero acquisition,
Coromandel moves into the
top 5 players in Indian Agro Chemical market
• Wider range of Technicals
(insecticides/fungicides/herbicides)
• Increased Global presence and registration
• Strong distribution with own retail outlets
Crop Protection business
30
Crop Protection business-Key Strengths
Regular introduction of new technicals to offset Endosulfan phase out
Low cost manufacturer of technicals
Leveraging Retail network (MGCs) to grow branded formulation business
Continued specialty focus for improved profitability
Exclusive import sourcing
Integrated technology development centre to build product pipeline
31
32
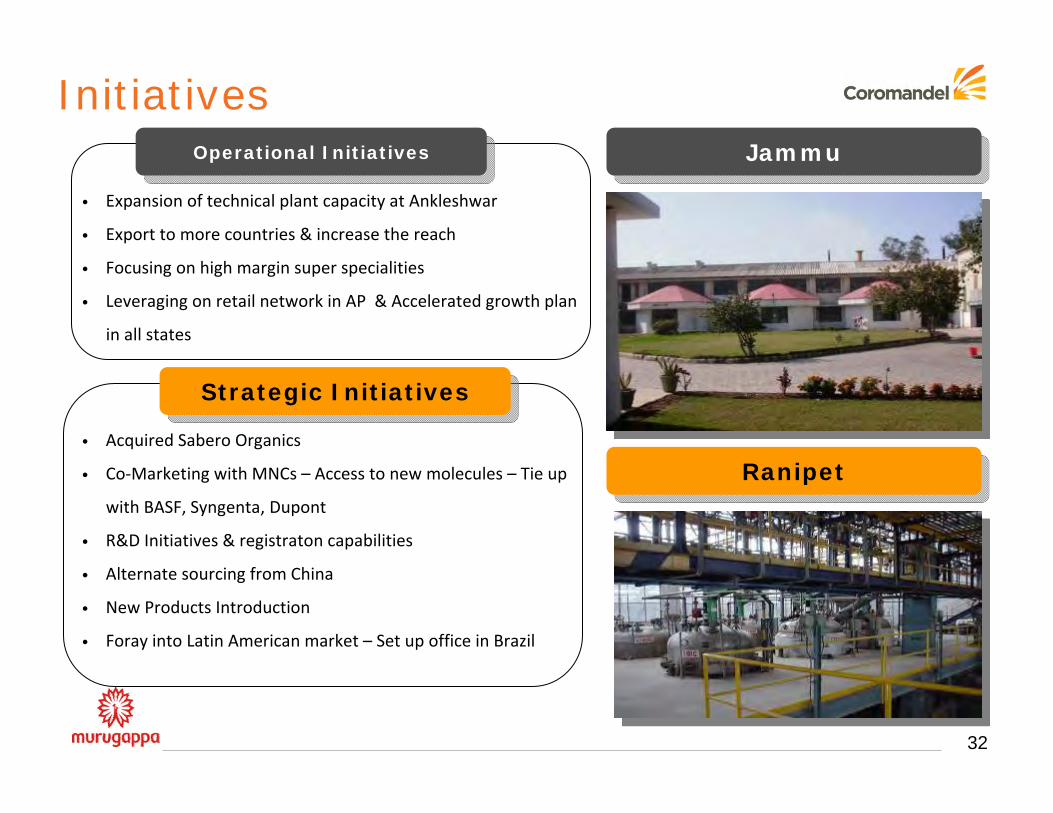
Initiatives
• Expansion of technical plant capacity at Ankleshwar
• Export to more countries & increase the reach
• Focusing on high margin super specialities
• Leveraging on retail network in AP & Accelerated growth plan
in all states
• Acquired Sabero Organics
• Co‐Marketing with MNCs – Access to new molecules – Tie up
with BASF, Syngenta, Dupont
• R&D Initiatives & registraton capabilities
• Alternate sourcing from China
• New Products Introduction
• Foray into Latin American market – Set up office in Brazil
JammuJammu
RanipetRanipet
Operational InitiativesOperational Initiatives
Strategic InitiativesStrategic Initiatives

33
BUSINESS UPDATE – JUNE’12
Crop Protection Business Highlights
• Global industry achieved a growth of 16% in nominal terms and 8% in real
terms over previous year supported by higher commodity prices
• Indian industry witnessed late onset of monsoon and record sowing of
cotton during the year. But due to insufficient rains in South, consumption
suffered in critical states like AP, Maharashtra and Karnataka.
The Company successfully launched Buprofezin ,first producer in India &
commenced production of Cyproconazole
Drop in sales due to Endosulfan partially offset by new molecules
Record volumes achieved for high margin formulation products in several
regions and also through Mana Gromor Retail chain.
34
35
Coromandel along with subsidiary Parry Chemicals currently holds 74.57%
stake in Sabero
Acquisition helped Coromandel to move to top 5 player in Agro chemical
Industry
Access to Global markets; Synergies in Latin America operation
Expanded basket of captive technicals ; alternate molecules to offset Endo
To consolidate formulation business in Coromandel – leveraging on retail
outlets
Update on Sabero Organics Gujarat Limited
36
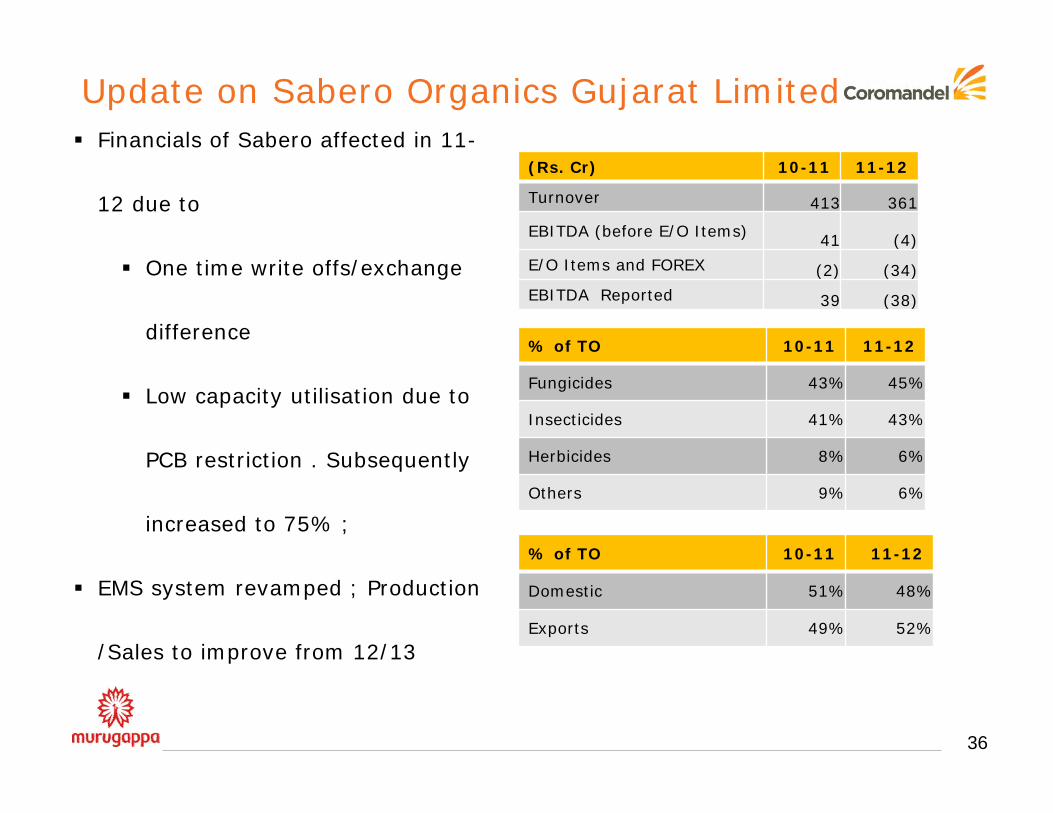
Financials of Sabero affected in 11-
12 due to
One time write offs/exchange
difference
Low capacity utilisation due to
PCB restriction . Subsequently
increased to 75% ;
EMS system revamped ; Production
/Sales to improve from 12/13
Update on Sabero Organics Gujarat Limited
(Rs. Cr) 10-11 11-12
Turnover 413 361
EBITDA (before E/O Items) 41 (4)
E/O Items and FOREX (2) (34)
EBITDA Reported 39 (38)
% of TO 10-11 11-12
Fungicides 43% 45%
Insecticides 41% 43%
Herbicides 8% 6%
Others 9% 6%
% of TO 10-11 11-12
Domestic 51% 48%
Exports 49% 52%
37
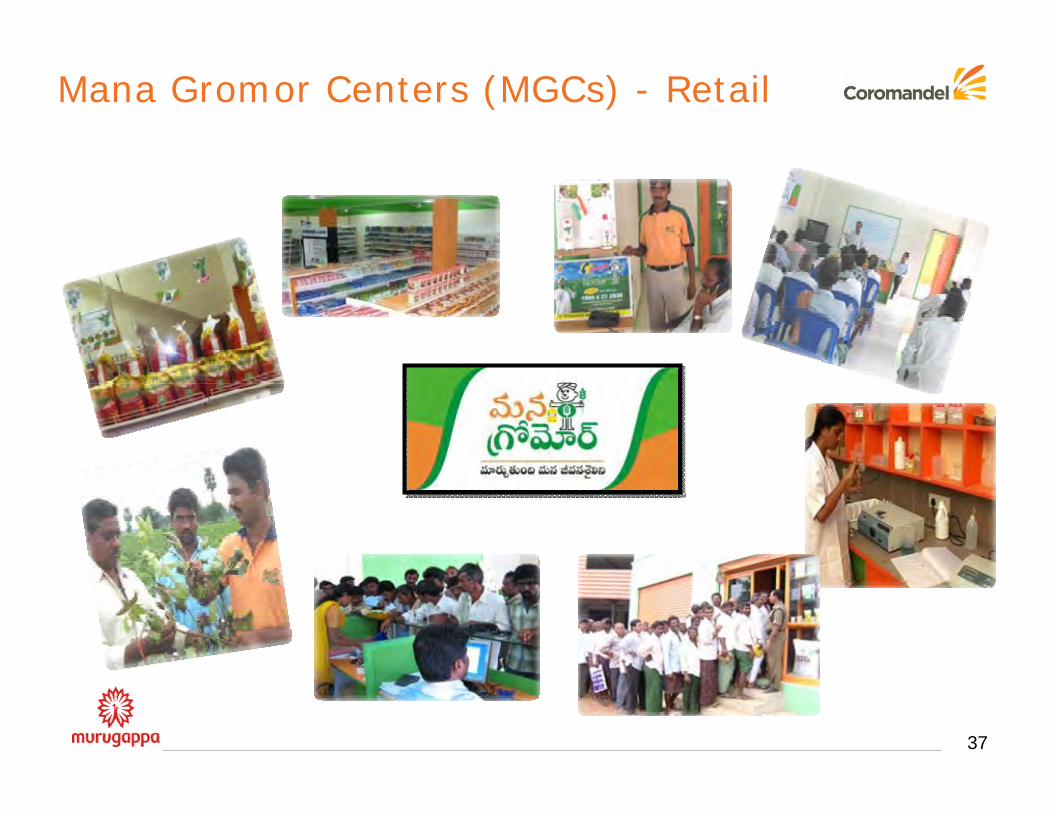
Mana Gromor Centers (MGCs) - Retail
38
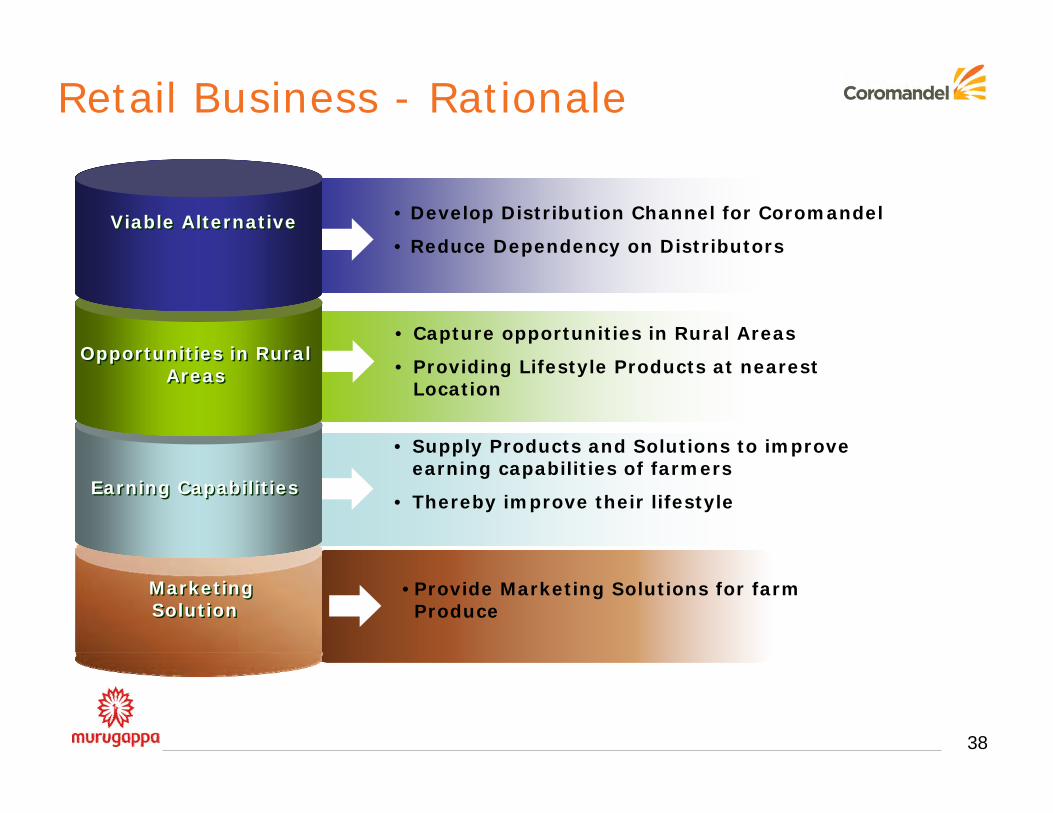
Retail Business - Rationale
• Develop Distribution Channel for Coromandel
• Reduce Dependency on Distributors
• Capture opportunities in Rural Areas
• Providing Lifestyle Products at nearest Location
• Supply Products and Solutions to improve earning capabilities of farmers
• Thereby improve their lifestyle
Viable AlternativeViable Alternative
Opportunities in Rural Areas
Opportunities in Rural Areas
Earning CapabilitiesEarning Capabilities
•Provide Marketing Solutions for farm Produce
Marketing SolutionMarketing Solution
39
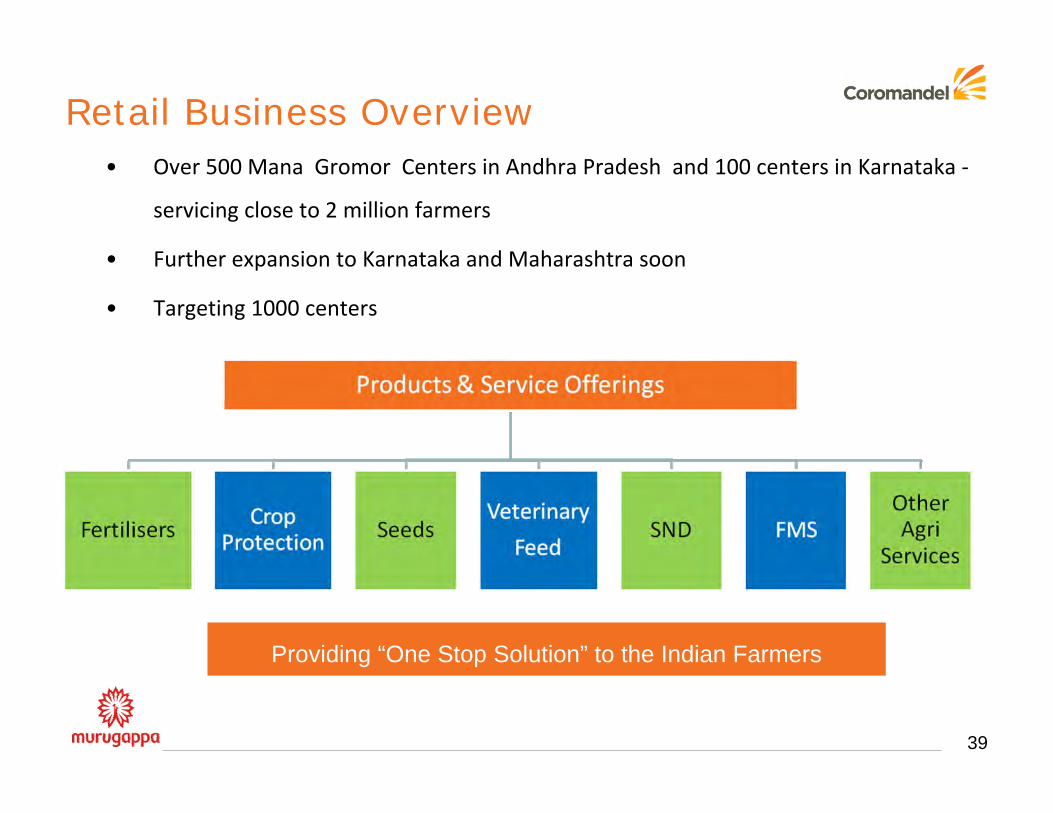
Providing “One Stop Solution” to the Indian Farmers
• Over 500 Mana Gromor Centers in Andhra Pradesh and 100 centers in Karnataka ‐
servicing close to 2 million farmers
• Further expansion to Karnataka and Maharashtra soon
• Targeting 1000 centers
Retail Business Overview
Performance Highlights - Retail
424 old stores in AP have completed 3 full years ‐ out of this 311 stores have
turned profitable (compared to 229 for last year)
Completed the rollout of 200 new stores in AP and Karnataka – Total stores as on
date 640
Entered into supply arrangements for the launch of own brands of paddy and
cotton seeds and expanded the private labels in Agro chemicals
Exited from LSP business ; More focus on Agri inputs business
Organic products and Seeds received good response from the market
The Retail turnover has grown by 11 % during the year
40
41
Financial Performance
Financial highlights – FY12
42
• Turnover for year ended March 2012 at Rs. 9,823 Cr against Rs. 7,639 Cr for last year (
y/y growth 29%)
• EBITDA for the year at ‐ Rs. 1,015 Cr against Rs. 830 Cr for last year (y/y growth 22%)
• PBT for the year before prior year subsidy and extra ordinary items ‐ Rs. 959Cr vs
Rs.762Cr last year ‐ ( y/y growth 26%)
• Reported PBT for the year at ‐ Rs. 970 Cr vs Rs. 988Cr last year ‐ (y/y decrease 2%)
• Reported PAT for the year at Rs. 693 Cr vs.Rs. 695Cr last year ( y/y decrease 0.2%)
43
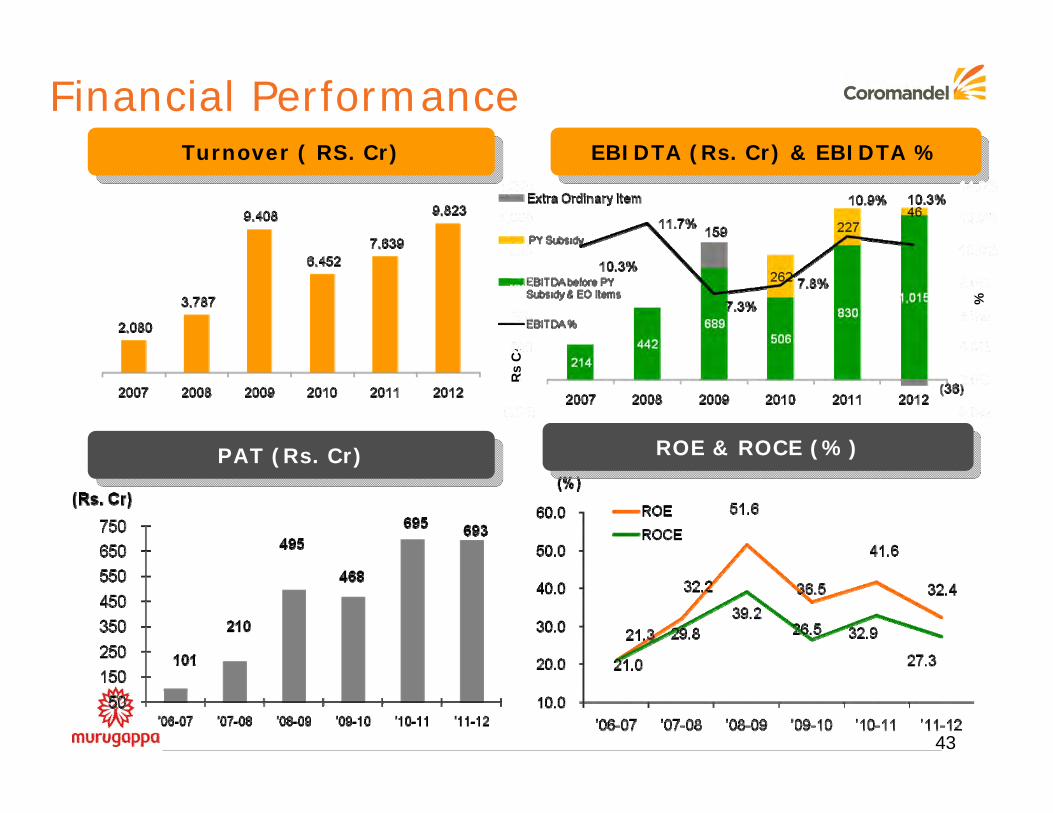
Financial PerformanceTurnover ( RS. Cr)Turnover ( RS. Cr) EBIDTA (Rs. Cr) & EBIDTA %EBIDTA (Rs. Cr) & EBIDTA %
ROE & ROCE (%)ROE & ROCE (%)PAT (Rs. Cr)PAT (Rs. Cr)
Rs
Cr
%
44
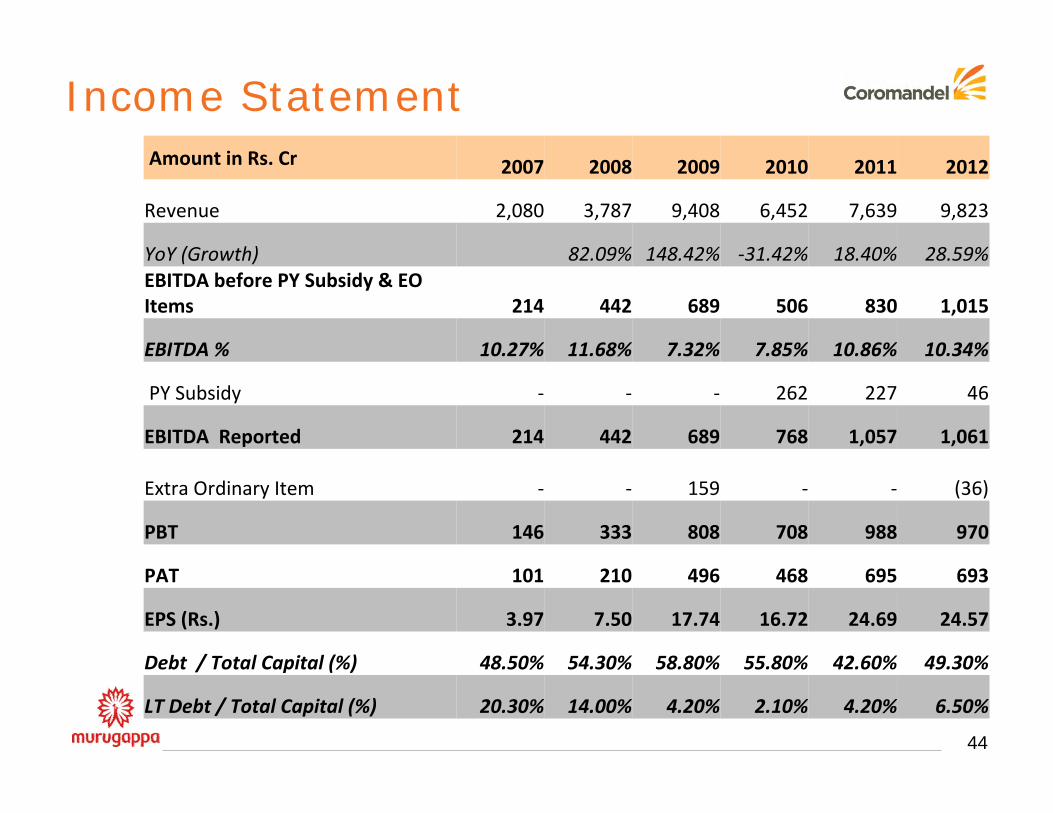
Income StatementAmount in Rs. Cr 2007 2008 2009 2010 2011 2012
Revenue 2,080 3,787 9,408 6,452 7,639 9,823
YoY (Growth) 82.09% 148.42% ‐31.42% 18.40% 28.59%EBITDA before PY Subsidy & EO Items 214 442 689 506 830 1,015
EBITDA % 10.27% 11.68% 7.32% 7.85% 10.86% 10.34%
PY Subsidy ‐ ‐ ‐ 262 227 46
EBITDA Reported 214 442 689 768 1,057 1,061
Extra Ordinary Item ‐ ‐ 159 ‐ ‐ (36)
PBT 146 333 808 708 988 970
PAT 101 210 496 468 695 693
EPS (Rs.) 3.97 7.50 17.74 16.72 24.69 24.57
Debt / Total Capital (%) 48.50% 54.30% 58.80% 55.80% 42.60% 49.30%
LT Debt / Total Capital (%) 20.30% 14.00% 4.20% 2.10% 4.20% 6.50%
45
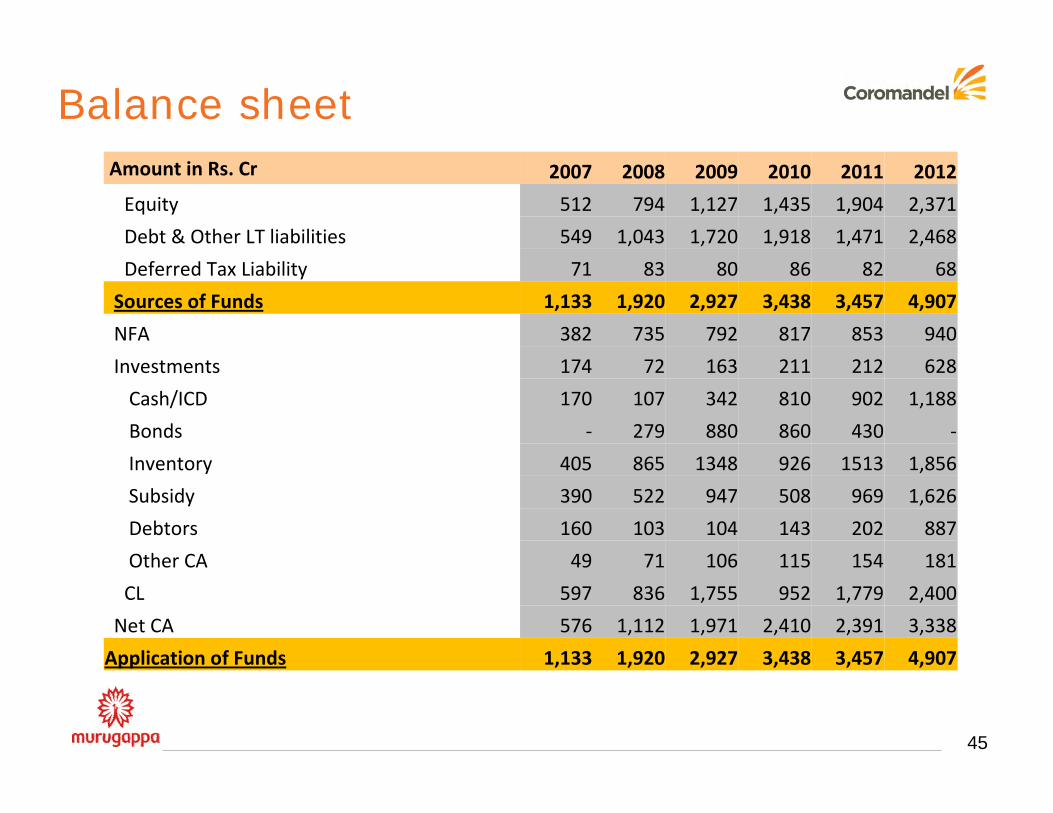
Balance sheetAmount in Rs. Cr 2007 2008 2009 2010 2011 2012
Equity 512 794 1,127 1,435 1,904 2,371
Debt & Other LT liabilities 549 1,043 1,720 1,918 1,471 2,468
Deferred Tax Liability 71 83 80 86 82 68
Sources of Funds 1,133 1,920 2,927 3,438 3,457 4,907
NFA 382 735 792 817 853 940
Investments 174 72 163 211 212 628
Cash/ICD 170 107 342 810 902 1,188
Bonds ‐ 279 880 860 430 ‐
Inventory 405 865 1348 926 1513 1,856
Subsidy 390 522 947 508 969 1,626
Debtors 160 103 104 143 202 887
Other CA 49 71 106 115 154 181
CL 597 836 1,755 952 1,779 2,400
Net CA 576 1,112 1,971 2,410 2,391 3,338
Application of Funds 1,133 1,920 2,927 3,438 3,457 4,907
46
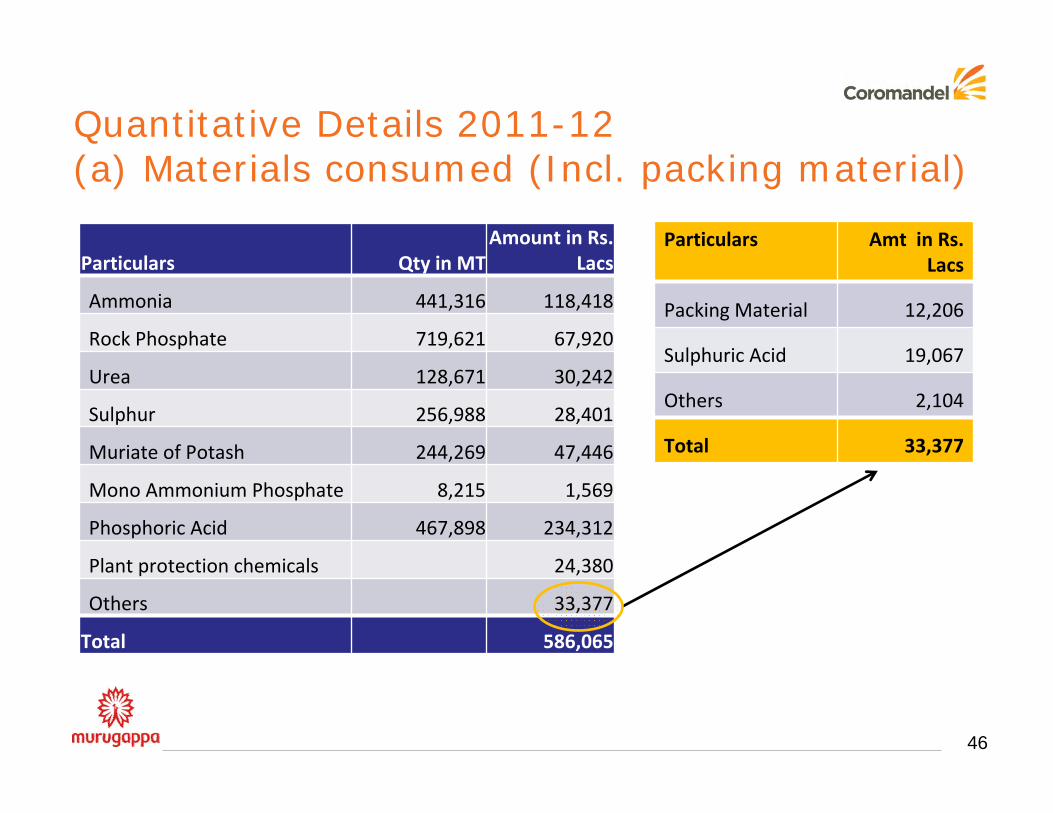
Quantitative Details 2011-12(a) Materials consumed (Incl. packing material)
Particulars Qty in MTAmount in Rs.
Lacs
Ammonia 441,316 118,418
Rock Phosphate 719,621 67,920
Urea 128,671 30,242
Sulphur 256,988 28,401
Muriate of Potash 244,269 47,446
Mono Ammonium Phosphate 8,215 1,569
Phosphoric Acid 467,898 234,312
Plant protection chemicals 24,380
Others 33,377
Total 586,065
Particulars Amt in Rs. Lacs
Packing Material 12,206
Sulphuric Acid 19,067
Others 2,104
Total 33,377

47
Quantitative Details 2011-12(b) purchase of stock-in-trade
Particulars Qty in MT Amount in Rs. Lacs
Di‐ Ammonium Phosphate ( DAP) 166,368 54,269
Ammonium phosphatic fertilisers 278,000 60,388
Muriate of Potash 169,526 42,836
UREA 287,728 15,030
Ammonia 8,743 2,580
Plant Protection Chemicals ‐ 7,430
Others ‐ 10,958
Total 193,491

48
Quantitative Details 2011-12(c )(i)Sales - Manufactured Products *
Particulars Qty in MT Amount in Rs. Lacs
Di‐ Ammonium Phosphate (DAP) 334,331 50,203
Ammonium phosphatic fertilisers 2,025,708 259,430
Single superphosphate 117,995 5,158
Plant protection chemicals ‐ 41,507
Others ‐ 23,961
Total 380,259
* net of ED where applicable
49
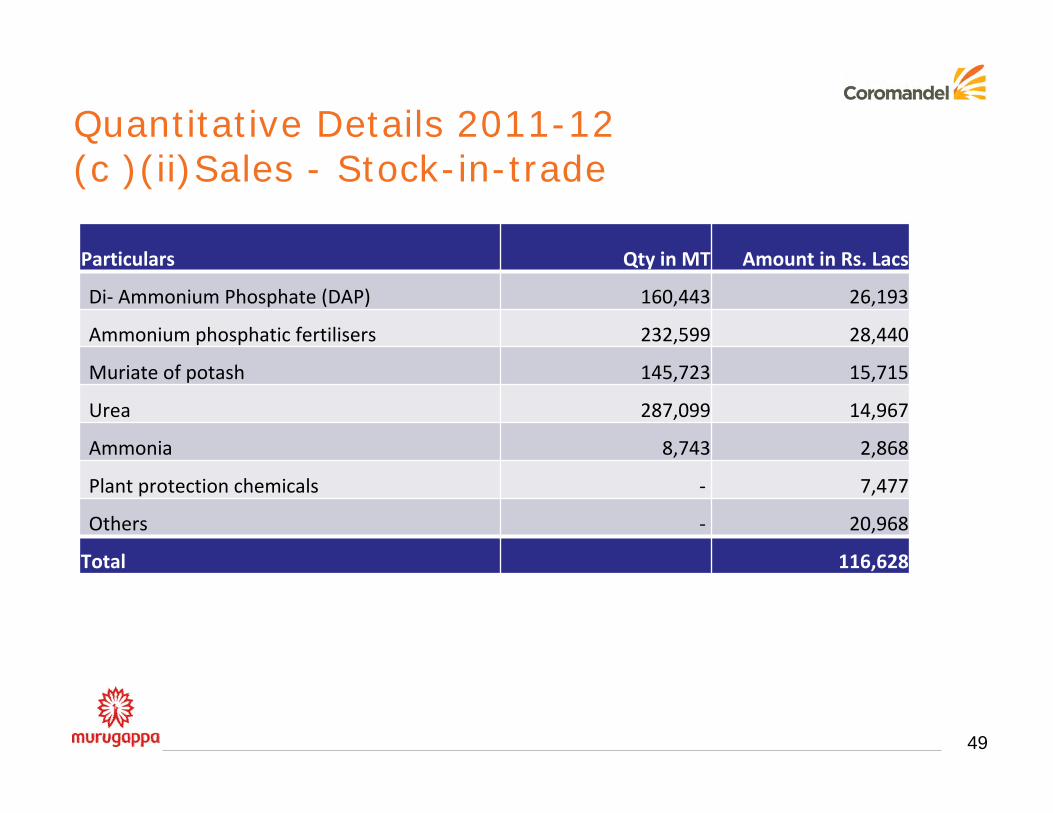
Quantitative Details 2011-12(c )(ii)Sales - Stock-in-trade
Particulars Qty in MT Amount in Rs. Lacs
Di‐ Ammonium Phosphate (DAP) 160,443 26,193
Ammonium phosphatic fertilisers 232,599 28,440
Muriate of potash 145,723 15,715
Urea 287,099 14,967
Ammonia 8,743 2,868
Plant protection chemicals ‐ 7,477
Others ‐ 20,968
Total 116,628
50
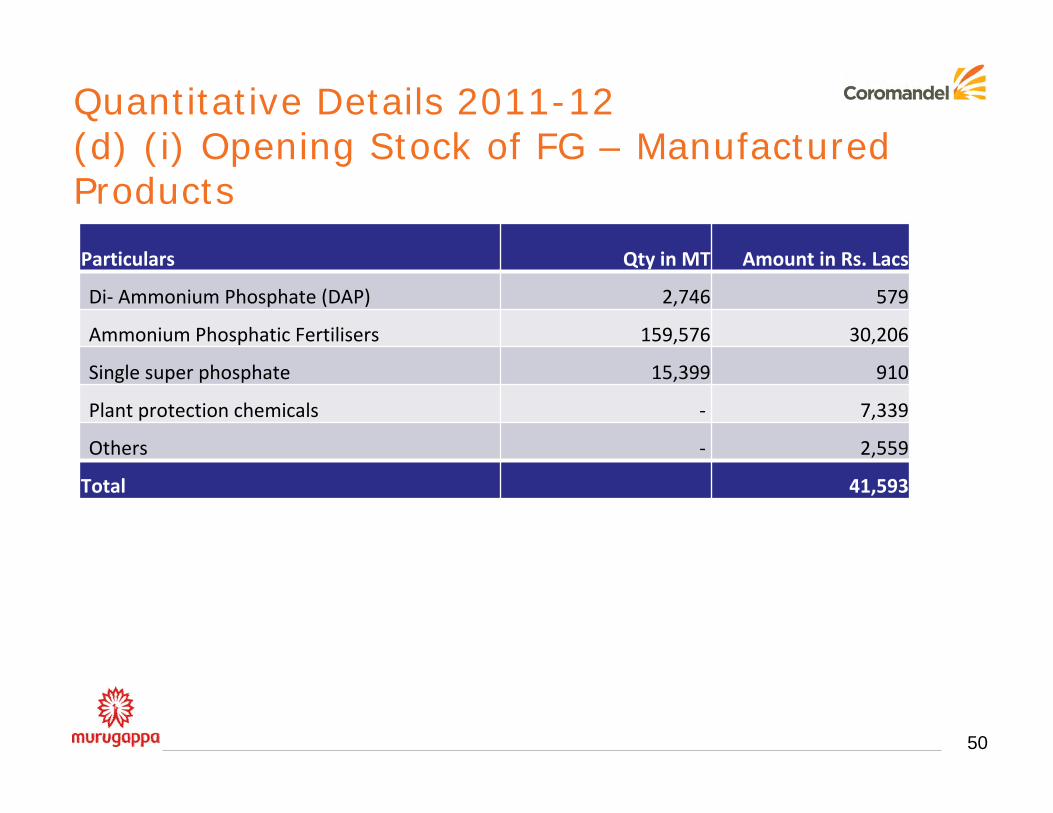
Quantitative Details 2011-12(d) (i) Opening Stock of FG – Manufactured Products
Particulars Qty in MT Amount in Rs. Lacs
Di‐ Ammonium Phosphate (DAP) 2,746 579
Ammonium Phosphatic Fertilisers 159,576 30,206
Single super phosphate 15,399 910
Plant protection chemicals ‐ 7,339
Others ‐ 2,559
Total 41,593
51
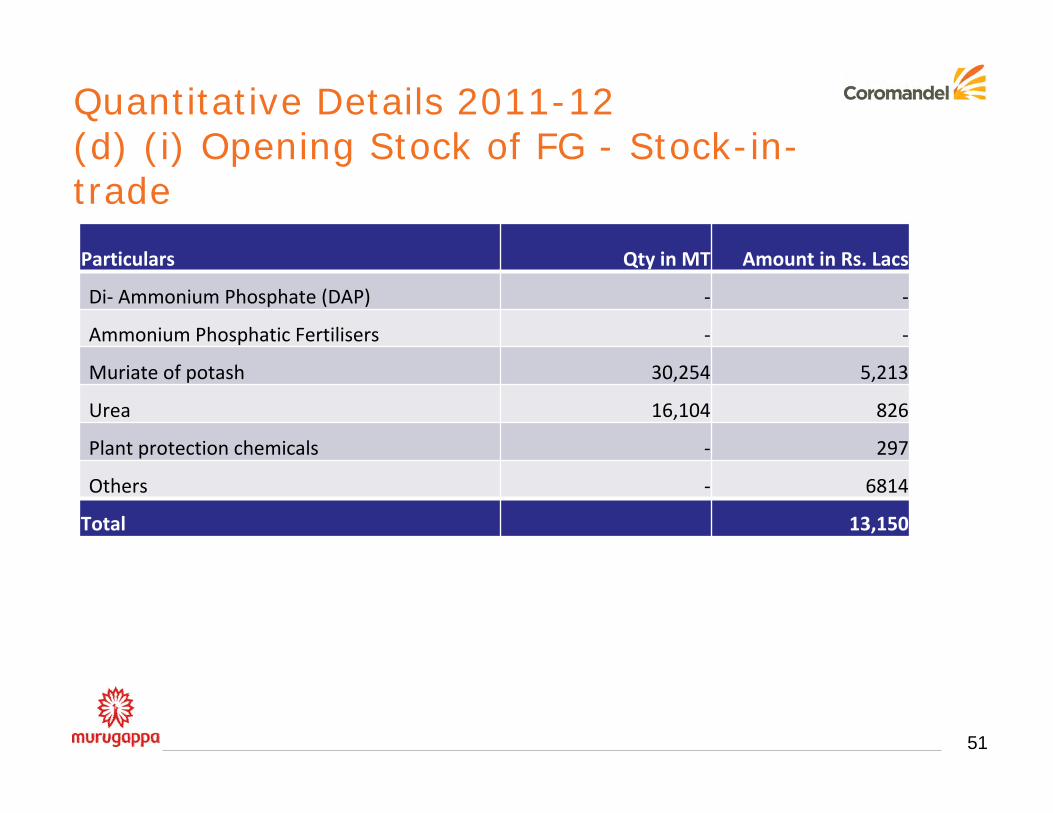
Quantitative Details 2011-12(d) (i) Opening Stock of FG - Stock-in-trade
Particulars Qty in MT Amount in Rs. Lacs
Di‐ Ammonium Phosphate (DAP) ‐ ‐
Ammonium Phosphatic Fertilisers ‐ ‐
Muriate of potash 30,254 5,213
Urea 16,104 826
Plant protection chemicals ‐ 297
Others ‐ 6814
Total 13,150
52
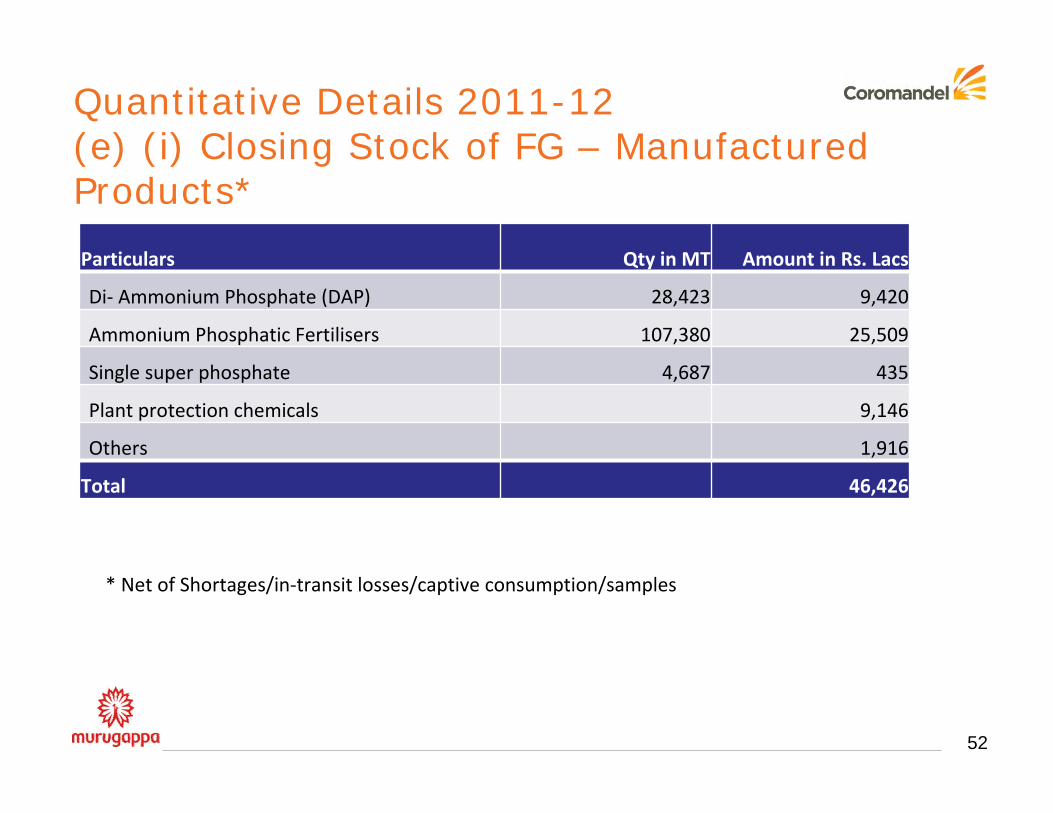
Quantitative Details 2011-12(e) (i) Closing Stock of FG – Manufactured Products*
Particulars Qty in MT Amount in Rs. Lacs
Di‐ Ammonium Phosphate (DAP) 28,423 9,420
Ammonium Phosphatic Fertilisers 107,380 25,509
Single super phosphate 4,687 435
Plant protection chemicals 9,146
Others 1,916
Total 46,426
* Net of Shortages/in‐transit losses/captive consumption/samples
53
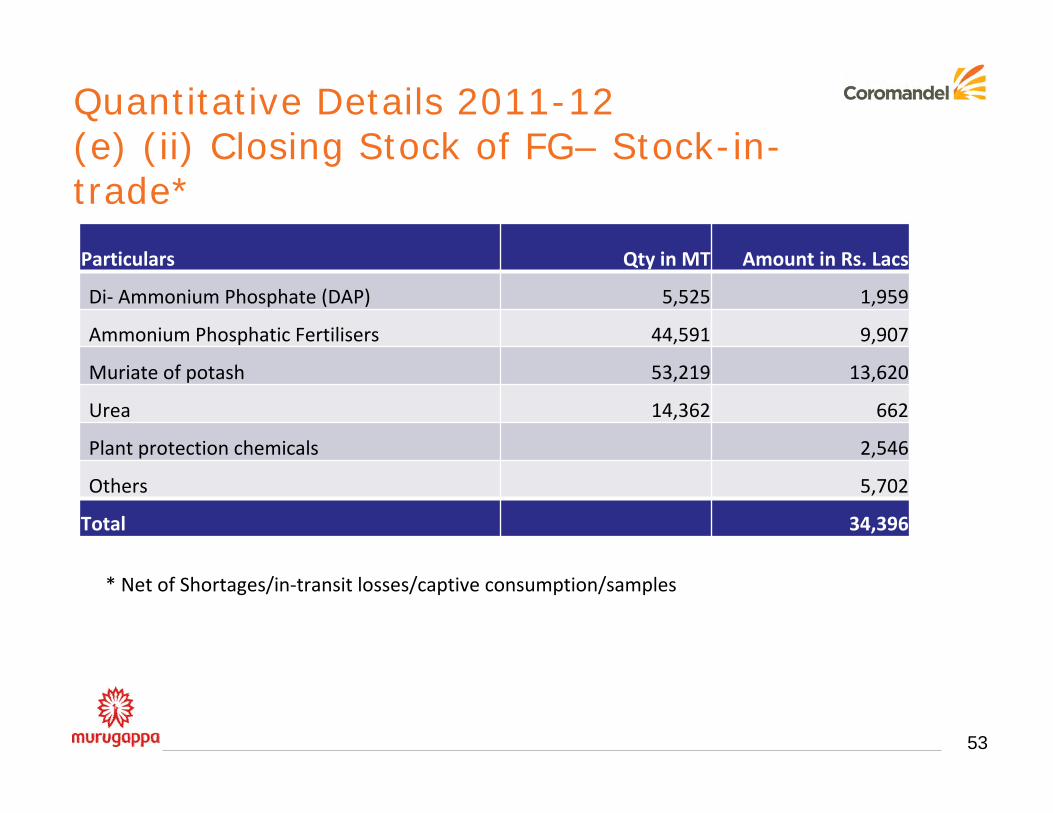
Quantitative Details 2011-12(e) (ii) Closing Stock of FG– Stock-in-trade*
Particulars Qty in MT Amount in Rs. Lacs
Di‐ Ammonium Phosphate (DAP) 5,525 1,959
Ammonium Phosphatic Fertilisers 44,591 9,907
Muriate of potash 53,219 13,620
Urea 14,362 662
Plant protection chemicals 2,546
Others 5,702
Total 34,396
* Net of Shortages/in‐transit losses/captive consumption/samples
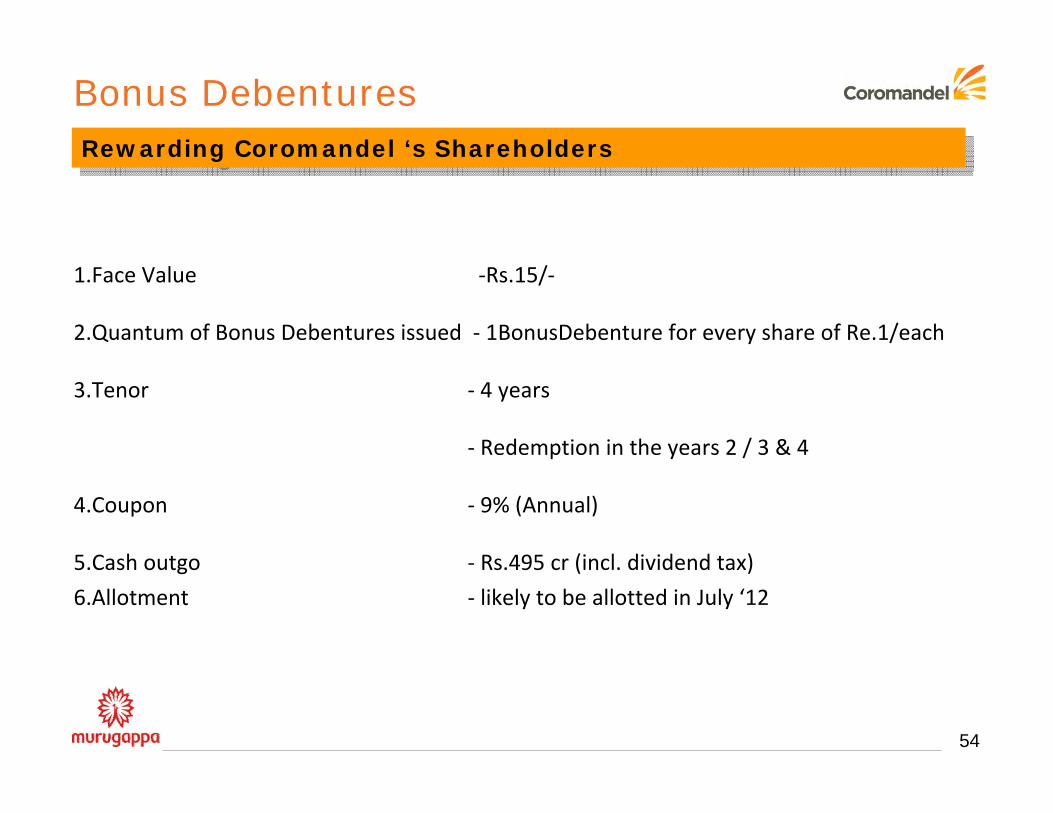
Rewarding Coromandel ‘s ShareholdersRewarding Coromandel ‘s Shareholders
54
1.Face Value ‐Rs.15/‐
2.Quantum of Bonus Debentures issued ‐ 1BonusDebenture for every share of Re.1/each
3.Tenor ‐ 4 years
‐ Redemption in the years 2 / 3 & 4
4.Coupon ‐ 9% (Annual)
5.Cash outgo ‐ Rs.495 cr (incl. dividend tax)
6.Allotment ‐ likely to be allotted in July ‘12
Bonus Debentures

AWARDS & ACCOLADES
55
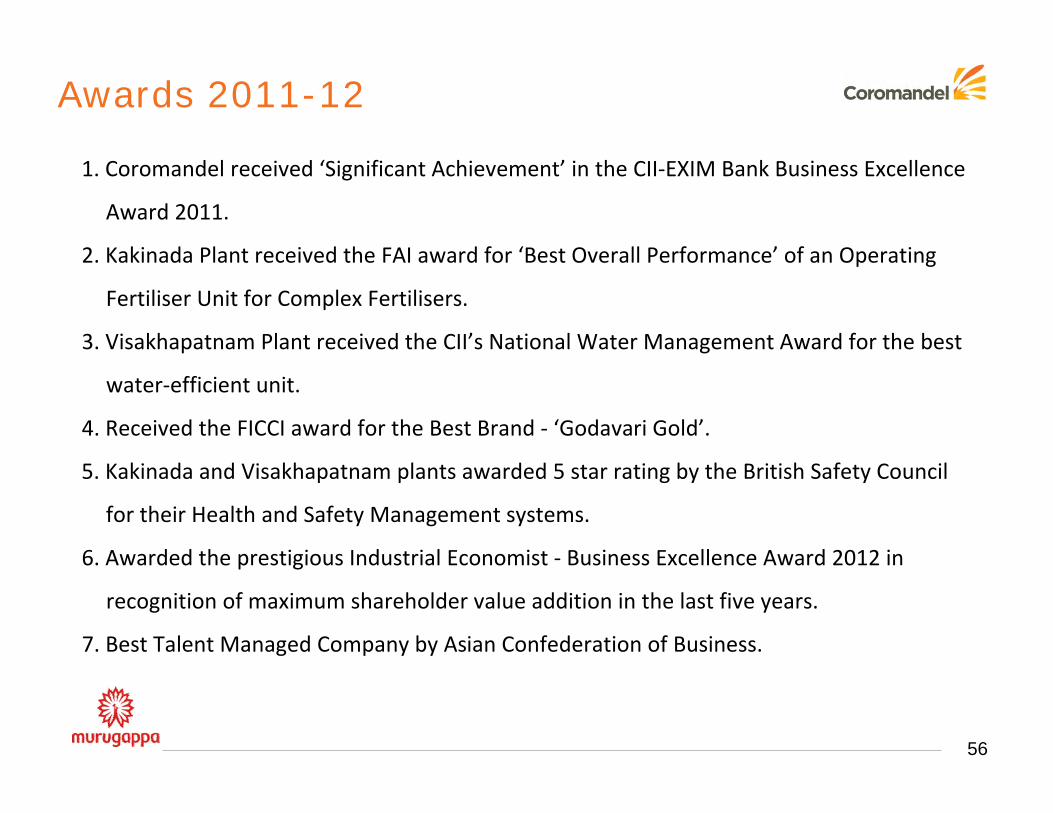
1. Coromandel received ‘Significant Achievement’ in the CII‐EXIM Bank Business Excellence
Award 2011.
2. Kakinada Plant received the FAI award for ‘Best Overall Performance’ of an Operating
Fertiliser Unit for Complex Fertilisers.
3. Visakhapatnam Plant received the CII’s National Water Management Award for the best
water‐efficient unit.
4. Received the FICCI award for the Best Brand ‐ ‘Godavari Gold’.
5. Kakinada and Visakhapatnam plants awarded 5 star rating by the British Safety Council
for their Health and Safety Management systems.
6. Awarded the prestigious Industrial Economist ‐ Business Excellence Award 2012 in
recognition of maximum shareholder value addition in the last five years.
7. Best Talent Managed Company by Asian Confederation of Business.
Awards 2011-12
56
Awards 2011-12 ( Contd..)
8. Best L&D Strategy award by Indian Human Capital Summit‐2011.
9. National Award, 1st Prize, by Public Relations Society of India, New Delhi for Coromandel
in‐house magazine‐‘The VOICE’ (for the sixth time).
10. National Award, 1st Prize, for the Corporate Film by Public Relations Society of India,
New Delhi.
11. Awards for a) Most effective use of interactive rural marketing b) Best brand loyalty
marketing campaign and c) Holistic marketing for rural brand deployment for Mana
Gromor Retail at CMO Asia and World Brand Congress during the Asia Retail Congress in
Mumbai.
57
58
THANK YOU