Embed Size (px)
Citation preview

1
Ionic Liquids in
Separations & Mass Spectrometry
Zachary BreitbachUniversity of Texas at Arlington
AZYP, LLC
May 2011

2
RTIL Structures
Common Cations
Anions
BMIM Bm4IM
•PF6‐
•BF4‐
•Cl‐
•CF3SO3‐ (TFO)
•N(CF3SO3)2‐ (NTf2)

3
RTILs as GC Stationary Phases
RequirementsHigh thermal stability (250°C and above)High viscosityHigh wetability on fused silica capillary columnsProduces symmetrical, efficient peaks
Note that the ILs on the previous slide do not meet all these requirements!

4
IL 19
IL 18 (IL 76)
N
HNHN
NH
O
O
O
C5H10
C5H10
C5H10
N
N
N
N
NN
3NTf2-
N
HNHN
NH
O
O
O
C5H10
C5H10
C5H10
P
P
P
3NTf2-
IL 100
IL 15
IL 4
N N(CH2)12 N N
2NTf2-
N N(CH2)5 N N
2NTf2-
P(CH2)13
NTf2-

5
IL 82
IL 59
MIM‐PEG
N N(CH2)12 N N
2NTf2-
P(CH2)12
P
2NTf2-
N N
2TfO2-
O O O N N
MIM‐PEG
salt treated, 15 m
IL 94
IL 126
N N
2TfO2-
O O O N N
N N
2TfO2-
O O O N N
N
HNHN
NH
O
O
O
C5H10
C5H10
C5H10
P
P
P
3TfO2-
6
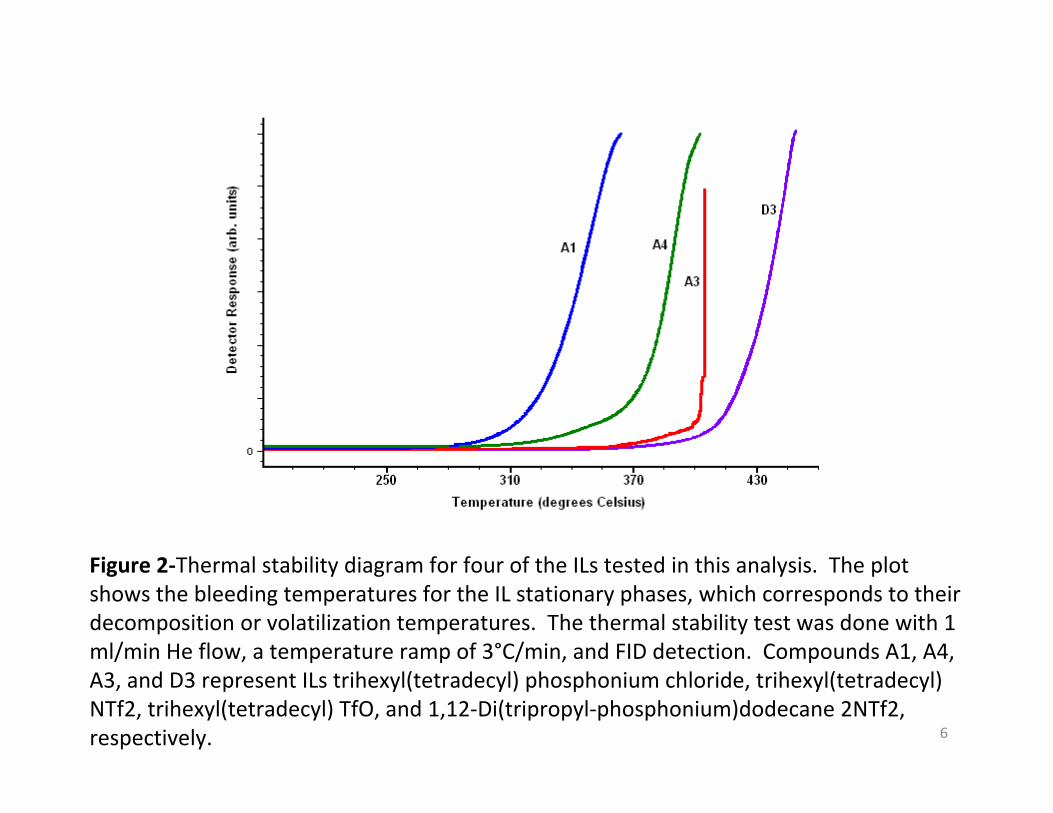
Figure 2‐Thermal stability diagram for four of the ILs tested in this analysis. The plot shows the bleeding temperatures for the IL stationary phases, which corresponds to their decomposition or volatilization temperatures. The thermal stability test was done with 1 ml/min He flow, a temperature ramp of 3°C/min, and FID detection. Compounds A1, A4, A3, and D3 represent ILs trihexyl(tetradecyl) phosphonium chloride, trihexyl(tetradecyl) NTf2, trihexyl(tetradecyl) TfO, and 1,12‐Di(tripropyl‐phosphonium)dodecane 2NTf2, respectively.

77
Incremental Max Temperature Studies,
Supelcowax 10 vs IL‐36k' (Nap) vs Temperature
5.00
7.00
9.00
11.00
13.00
Initial ru
n 200210220230240250260270280290300310320330340350
Temperature (for 4 hours)
k' (N
ap)
k' (IL-36)k' (Wax-10)

88
Air Carrier Gas Experiment (needed for field instruments, but O2 & H2O are problematic)
• SLB‐IL59 column: 30m x 0.25mm x 0.20m, df• Carbowax column: 30m x 0.25mm x 0.25m, df
Oven:• Programmed Test Mix:: 50 oC(2 min) to 200 oC (15 min) at 4
oC/min• Injector Temp: 250 oC• Detector Temp: 250 oC• Column Dimension: • Split: 50:1 • Injection volume: 1l• Air: constant air pressure 16psi

9
9
Air as a Carrier Gas
• Programmed Test Mix (Carbowax Column)
0 10 20 30Time (min)
•1st injection
•After 100 injections
•After 200 injections

10
Air as a Carrier Gas with IL Column
• Programmed Test Mix (SLB‐IL59 Column)
•After 100 injections
•After 200 injections
0 10 20 30Time (min)

11
Air as a Carrier Gas, cont.
• Programmed Test Mix (SLB‐IL59 Column)
•After 200 injections
•After 300 injections
0 10 20 30 40 50Time (min)

1212
GC Polarity Scale
•GC column polarity scale•0 = squalane (considered the least polar GC stationary phase)•100 = TCEP (considered the most polar GC stationary phase)
0 50 100
280°CWax (PEG)
310°C‐20 ‐1701 ‐35 ‐50
360°C‐1 ‐5
275°C 250°C 140°C‐2331 ‐2560 TCEP
Non‐Polar Intermediate Polar Polar Highly Polar
2515
Range of Alternative Polarities possible from Ionic Liquid GC
Where do current ILs fit on this scale?

13
Figure 6. GC x GC separation of diesel fuel on the (a) IL x HP‐5 column combination, (b) the DB‐Wax x HP‐5 column combination, and (c) the HP‐50+ x HP‐5 column combination. Both the IL x HP‐5 and DB‐Wax x HP‐5 configurations generated distinct chromatographic regions for the saturated hydrocarbons, monoaromatics, and diaromatics. The HP‐50+ x HP‐5 configuration had nearly complete separation of the saturated hydrocarbons from the aromatics, but no clear separation of the aromatics into monoaromatic and diaromaticregions.
Anal. Bioanal. Chem. 390 (2008) 323‐332.
IL columns are the most orthogonal known

14
Water Analysis Methods
1. Karl Fischer methods
2. Near IR
3. GC (packed column, molecular sieve)
4. Solvatochromic
5. 19F‐NMR

15
Water detection by GC1. Water cannot degrade the stationary phase
2. Water must produce a reasonably sharp, efficient peak
3. Water must be well separated from all solvents (matricies)
4. Analysis times should be short
5. Results must be highly accurate and reproducible
6. Effective for any concentration from <1ppm to >99%

16
MIM‐PEG
IL 942700
IL 107
Stationary phase Efficiency / mShape of Water peakAt 70 0C
N N
2TfO2-
O O O N N
N N
2TfO2-
O O O N NHOOH
(Dibutylphthalate, 150 C)
1200
N
HNHN
NH
O
O
O
C5H10
C5H10
C5H10
P
P
P
3TfO2-
2300
(Dibutylphthalate, 185 C)
(Dibutylphthalate, 150 C)

17Figure 2: Separation of water from CH2Cl2 in examined columns at 80 0C.
HMIM‐PEG TPT
COMMERCIAL
CH2Cl2
H2O
CH2Cl2
H2O
H2O
CH2Cl2
DMIM‐PEG
H2O
CH2Cl2
2 4 6
Time (min)
2 4
Time (min)
2 4 6
Time (min)
2 4 6
Time (min)

18
Limits of detection (DL) and limits of quantitation (QL) of water in the evaluated columns.
Solvent HMIM-PEG TPT DMIM-PEG
DL/ng QL/ng DL/ng QL/ng DL/ng QL/ng
MeOH/A1 3.6 10.9 4.0 12.0 4.1 12.4
THF/C2 2.1 6.3 5.6 16.9 3.0 9.0
1”A” indicates that acetone was used as the internal standard. 2“C” indicates that acetonitrile was used as the internal standard.
These DLs are 5,000 times lower than the same samples done by Karl FischerTitration.Also the KFT takes as much as 5 ml of sample.

19
SampleHMIM-PEG TPT DiMIM-PEG
Water
(ppm) RSD%
Water
(ppm) RSD%
Water
(ppm) RSD%
Acetic acid 420 1.0 410 5.9 440 5.0
Acetone 2380 3.8 2380 6.1 2520 0.3
Acetonitrile 103 3.0 98 6.9 103 2.7
Anisole 990 2.6 990 3.5
Benzene 18 2.4 17 8.4 21 9.5
1-Butanol 1190 3.6 1150 5.8
2-Butanol3530 2.6 3380 2.3
2-Butanone 730 3.7 760 1.2 710 5.8
t-Butyl alcohol 2130 1.9 2010 6.2 1950 4.0
Carbon tetrachloride36 3.7 38 4.4 36 5.7
Chlorobenzene38 9.6 42 8.9 39 3.1
1-Chlorobutane27 5.5 23 5.0 28 3.7
Chloroform 155 2.3 153 5.1 162 6.3
2-Chloropropane120 4.0 113 5.3 125 4.2
Cyclohexane18 9.7 21 7 20 3.5
Cyclohexanone

20
1,2-Dichloroethane160 6.9 150 13.7 140 2.4
Diethyl ether400 7.6 420 1.6 390 6.4
Di(ethylene glycol) ethyl
ether 950 4.3 970 9.5 930 2.1
Dimethyl- formamide (DMF) 594 4.0 606 4.9 614 6.2
Dimethyl sulfoxide (DMSO) 773 2.9 800 4.4 820 5.0
Dioxane3800 4.0 3700 3.5 3900 2.3
Ethanol890 2.0 880 3.8 880 2.2
Ethyl acetate370 2.8 365 3.9 370 1.4
Heptane18 6.3 17 8.7 16 8.7
Hexane14 5.3 17 9.5 16 9.0
Methanol209 7.1 198 4.6 203 5.0
Methyl t-butyl ether (MTBE)1900 1.1 1800 6.1 1900 6.6
Methylene chloride48 8.2 52 6.3 47 7.3
Nitrobenzene119 2.5 109 8.5 117 3.9

21
Octane13 8.0 17 10.0 14 5.1
1-Octanol190 4.6 210 7.0 190 5.6
Pentane16 3.4 18 9.6 15 4.8
Petroleum ether (ligroine)
16 3.9 19 6.1 17 4.6
1-Propanol308 4.0 285 3.2
2-Propanol180 3.9 171 2.4 162 3.0
Pyridine 910 4.6
Tetrahydrofuran (THF)110 6.0 108 5.8 117 8.1
Toluene31 4.2 29 5.0 32 4.6
Triethyl amine56 0.3 57 0.2 57 6.7
o-Xylene74 7.7 76 4.9
m-Xylene22 7.9 24 0.6
p-Xylene23 9.2 26 0.2

22
Time (min)2.5 5 7.5 10 12.5 15 17.5 20
THF ACNIPA
EtOHPrOH
Acetone
BuOH
Unknown impurityin H2O H2O
BuOHACN
PrOH
EtOHAcetone
IPATHF
Unknown impurityin H2O
A)
B)
Fig. 6
Example of the separation of organic solvents in water using ionic liquid based stationary phase. Chromatogram A: DMIM‐PEG; 40°C; 0.2ml injection; thermal conductivity detector (all solvents: 100mg/kg)Chromatogram B: DMIM‐PEG; 40°C; 0.2ml injection; flame ionization detector (all solvents: 5mg/kg)

23
GENERAL PROPERTIES of MALDI MATRICES
a) They must dissolve (liquid matrix) or co‐crystallize (solid matrix) with the sample.
b) They must strongly absorb the laser light (e.g., 337 nm).
c) They must remain in the condensed phase under high vacuum conditions.
d) They must stifle both chemical and thermal degradation of the sample.
e) They must promote the ionization of the sample via any number of mechanisms.
IONIC LIQUIDS FOR MALDI‐MS

24

25
MALDI mass spectra of the three oligonucleotides (d(pT)10, d(pC)11, and d(pC)12) in different matrixes: (a) 3‐HPA + 10% ammonium citrate, (b) ionic solid 21, and (c) ionic solid 26. Spectra obtained cumulating 100 UV 237 nm laser shots. For the three experiments, the oligonucleotide‐to‐matrix molar ratio was 1:500000 and the laser fluence was the same (attenuation 10). The signal strength is expressed in arbitrary units corresponding to the accumulation of 100 shots on a good spot. The 3‐HPA scale (top spectrum) differs 8 times from that for the two salts (bottom spectra).

26
Detection of Catalase (Monomer=60,000 Da)
0 0
0.5
1.0
1.5
2.0
4x10
Inte
ns. [
a.u.
]
0 0
0.5
1.0
1.5
2.0
4x10
Inte
ns. [
a.u.
]
0 0
0.5
1.0
1.5
2.0
4x10
Inte
ns. [
a.u.
]
50000 100000 150000 200000 250000 300000
[M + H]+
[M + H]+
[M + H]+[2M + H ]+
[3M + H]+[4M + H]+
[5M + 2H]2+
NOH
O-
O
IMTBA CHCA
H N+
NOH
OH
O
α‐cyano‐4‐hydroxycinnamic acid: CHCA
Sinapinic acid
O
OH
O
OH
O

2727

28
Corona discharge more prevalent in negative mode Leads to less stable Taylor cone and unstable signal Higher background noise Increased chance for arcing Electron scavenging gases and/or halogenated solvents
used to inhibit corona discharge
28

29
Using cationic additives as ion-pairing agents for MS First application was performed to detect trace amounts of
perchlorate. Expand to additional ions.
1+2++ ClO4
-
m/z +145
(MW 290)
m/z +389
m/z - 99
ClO4-
NNN
N 9
NNN
N 9
29

30
Can select cation to place complex in a higher mass region, where there is less noise.
Can bring smaller ions out of low mass cutoff (LMCO=50 for LXQ)
May help distinguish between ions of same M/Z (35ClO4
- vs. H34SO4-)
30

31
Three different ways to detect ions1) Full Scan2) Selective-Ion Monitoring3) Use MS/MS
- Trap m/z of complex- Excite this m/z to break complex- Monitor m/z of fragment of dication
1+N
NNN 9
1+
ClO4-
NNN
N 9
31

32
ESI‐MS Analysis
Sample Sol’n
[Dication]2+
[Anion]-
[Dicat+Anion]+
MS
LC PumpH20/MeOH
LC Pump40 uM Additive in H20
LC ColumnFinnigan LXQ

33Soukup-Hein et al. Anal. Chem. 2007, 79, 7346-7352.33

34
RT: 0.00 - 18.00 SM: 15G
0 1 2 3 4 5 6 7 8 9 10 11 12 13 14 15 16 17Time (min)
0
5
10
15
20
25
30
35
40
45
50
55
60
65
70
75
80
85
90
95
100
Rel
ativ
e Ab
unda
nce
NL:0m/z= 57.50-58.50 MS AnionmixtureMS_040207dNL:2.46E3m/z= 148.50-149.50 MS Genesis AnionmixtureMS_040307eNL:1.11E4m/z= 156.50-157.50 MS Genesis AnionmixtureMS_040307eNL:1.51E4m/z= 279.50-280.50 MS Genesis AnionmixtureMS_040307eNL:2.01E3m/z= 412.50-413.50 MS Genesis AnionmixtureMS_040307e
RT: 0.00 - 17.99 SM: 15G
0 1 2 3 4 5 6 7 8 9 10 11 12 13 14 15 16 17Time (min)
0
5
10
15
20
25
30
35
40
45
50
55
60
65
70
75
80
85
90
95
100
Rel
ativ
e A
bund
ance
NL:4.62E3m/z= 347.50-348.50 MS Genesis AnionmixtureMS_040307cNL:4.60E3m/z= 438.50-439.50 MS Genesis AnionmixtureMS_040307cNL:1.15E4m/z= 446.50-447.50 MS Genesis AnionmixtureMS_040307cNL:9.83E3m/z= 569.50-570.50 MS Genesis AnionmixtureMS_040307cNL:7.46E3m/z= 702.50-703.50 MS Genesis AnionmixtureMS_040307c
0 3 6 9 12 15Time (min)
100
80
60
40
20
00 3 6 9 12 15Time (min)
100
80
60
40
20
0R
elat
ive
Abu
ndan
ce
Rel
ativ
e A
bund
ance
SCNArea: 7.3 E5S/N: 138
TFOArea: 8.9E5S/N: 88
BZSNArea: 2.9E6S/N: 204
NTF2Area: 1.4E5S/N: 30
PFOAArea: 1.0E5S/N: 162
TFOArea: 4.9E5S/N: 67
BZSNArea: 3.6E5S/N: 31
NTF2Area: 2.5E5S/N: 32
PFOAArea: 4.0E4S/N: 26
SCN
(B)(A)
Figure 2: A comparison of the chromatographic separation and sensitivity of 5 anions on a Cyclobond I column detected in the (A) positive and (B) negative SIM modes. The mass injected in (B) is 10x that of (A) for SCN, TFO, and BZSN, 5x for PFOA, and the same for NTF2. The mass injected in (A) is :1.43 ng SCN, 9.92 ng TFO, 1.16ng BZSN, 0.68 ng NTF2, and 1.30 ng PFOA. The column was equilibrated for 15 minutes with 100% Water with a linear gradient to 100 % MeOH beginning at 3 minutes and complete at 9 minutes. Flow rate was 300 μL/min. In (A) the dicationic salt solution (40 μM in MeOH) was added post-column at 100 μL/min where as in (B) it is methanol only. SCN: thiocyanate; TFO: triflate; BZSN: benzenesulfonate; PFOA: perfluorooctanoic acid; NTF2: trifluoromethanesulfonimide.
Positive ion mode Negative ion mode
Soukup-Hein, et.al. Anal. Chem. 2007, 79, 7346-52
10x the mass
injected in
positive mode
34

35
Terminal Charge Group Linkage Chain Length Linkage Chain Type Different Structures
35

36
N+
N+
OH
N+
N+
N+
N+
O
O
OH
OH
CH3CH3
CH3 H
OMe
MeO
N+
NOH N
+N OHO O O
N+
N CH2CH2(C F2)4CH 2CH2 N+N
N
+N N
+N
P+
P+
P+
P+
O O O
N+
N(CH2)5N+
P+
(CH2)5N+
N+
N(CH) 9N+N
(CH2)3 P+
P+
(CH2)5 P+
P+
(CH2)9 P+
P+
N+
N(CH2)3N+N
N+
N(CH2)5N
+N N
+(CH2)5N+
N+(CH 2)5N
+
(CH2)5 N+
N+
(CH2)12 N+
N+
N+
N( CH2)5N+
N
N
+N
(CH2)5N+
N
N+
N(CH2)5 OHN+
NOH
36
J Am Soc Mass Spectrom 2008, 19, 261–269

37
RR
R
RR
R
NRR
R
A B
CR=
NN
+2)
R=
NN+1)
R=
NN+
OH3)
R= P+6)
R= N+5)
C1C2C3C4C5C6C7
A1A2A5A6
B1B2B4B6
Trications Core Charged Groups
N
NNR R
OO
N
R
O
5
5
5
D
D2D6
R=4) N N
NH+
NR=7)
37Anal. Chem. 2008, 80, 2612-2616

38
RT: 0 .00 - 5 .01 SM : 7G
0.0 0.5 1.0 1 .5 2.0 2.5 3.0 3.5 4 .0 4.5 5.0
Tim e (m in)
0
5
10
15
20
25
30
35
40
45
50
55
60
65
70
75
80
85
90
95
100
Rel
ativ
e Ab
und
anc
e
AA: 387S N: 6
N L:1 .02E 2TIC MS G enes is
N egH exC lP d_102607b
Time (min)
100
80
60
40
20
0
Relative Abundance
0 1 2 3 4 5
5 ngS/N: 6
RT: 0.00 - 5. 02 SM: 7G
0.0 0.5 1.0 1. 5 2.0 2.5 3.0 3.5 4.0 4 .5 5.0Tim e (m in)
0
5
10
15
20
25
30
35
40
45
50
55
60
65
70
75
80
85
90
95
100
Rel
ativ
e Ab
unda
nce
AA: 7969S N: 35
NL:1.45E3TIC MS Gen esi s TricatL_HCP_102607
0 1 2 3 4 5Time (min)
100
80
60
40
20
0
Relative Abundance
500 pgS/N: 35
RT: 0.00 - 5.01 SM: 7G
0.0 0.5 1.0 1.5 2.0 2.5 3.0 3.5 4.0 4 .5 5.0Tim e (m in)
0
5
10
15
20
25
30
35
40
45
50
55
60
65
70
75
80
85
90
95
100
Rel
ativ
e Ab
unda
nce
AA: 13 2SN: 3
NL:2.71E1TIC MS Gen esi s Neg OBDSA_102 607c
0 1 2 3 4 5Time (min)
100
80
60
40
20
0
Relative Abundance
5 ngS/N: 3
RT: 0 .00 - 5 .02 SM : 7G
0.0 0.5 1.0 1 .5 2.0 2.5 3.0 3 .5 4 .0 4 .5 5 .0Tim e (m in)
0
5
10
15
20
25
30
35
40
45
50
55
60
65
70
75
80
85
90
95
100
Rela
tive
Abu
nda
nce
AA: 20004S N: 56
N L:2 .74E3TIC M S G enes is TriC atB _12907
0 1 2 3 4 5Time (min)
100
80
60
40
20
0
Relative Abundance
500 pgS/N: 56
Hexachloroplatinate
(Trication A6)
o-Benzenedisulfonate
(Trication B1)
Positive Negative
2-
S
SO
OO-
O-
OO
38Anal. Chem. 2008, 80, 2612-2616

39
nn
N+
CH2NN N
+ CH2 NN
+CH3CH3
nn
N+
CH2NN N
+ CH2 NN
+CH3 CH3
nn
N+
CH2NN N
+ CH2 NN
+
nCH2P
+
CH3
CH3
CH3
N N+ CH2 P
+
CH3
CH3
CH3
n
Linear Tricationic Reagents
39Anal. Chem. 2008, 80, 8828–8834

40
Figure 2. Comparison of the detection of sulfate in the positive mode using tricationic ion-paring reagents D3 (I) and E2 (II). Note, Sulfate has a M/Z of -48 and is completely undetectable in the negative ion mode.
I
II
500 pgS/N: 21
500 pgS/N: 3
nCH2P
+
CH3
CH3
CH3
N N+ CH2 P
+
CH3
CH3
CH3
n
n=10
R
R
R
R= tripropylphosphonium
40

41
N+N
N+
N+
N
N
LTC 1
LTC 2
TTC 1 TTC 2
41

42
S/N=5
500pg
N+
N
N+
NN
+
N
N+
N

43