Embed Size (px)
Citation preview
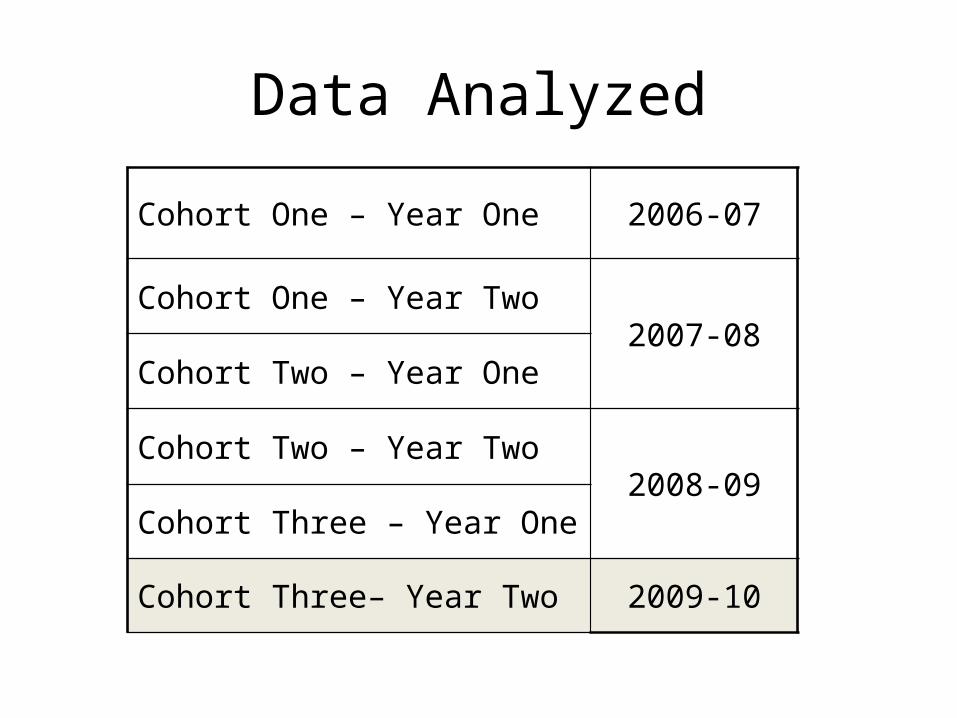
Data Analyzed
Cohort One – Year One 2006-07
Cohort One – Year Two2007-08
Cohort Two – Year One
Cohort Two – Year Two2008-09
Cohort Three – Year One
Cohort Three– Year Two 2009-10
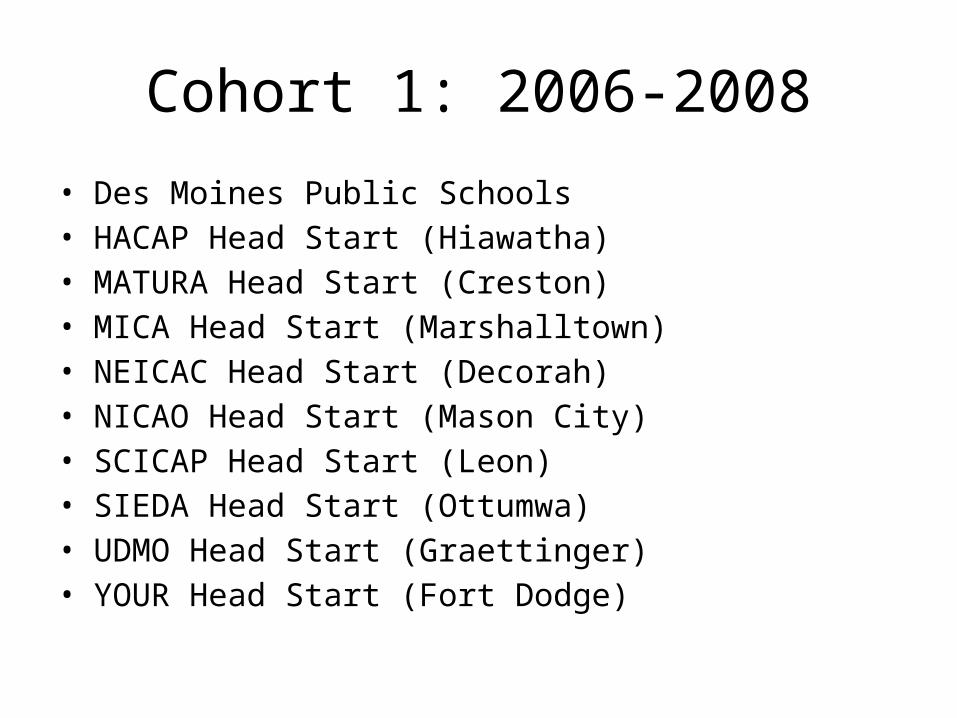
Cohort 1: 2006-2008
• Des Moines Public Schools• HACAP Head Start (Hiawatha)• MATURA Head Start (Creston)• MICA Head Start (Marshalltown)• NEICAC Head Start (Decorah)• NICAO Head Start (Mason City)• SCICAP Head Start (Leon)• SIEDA Head Start (Ottumwa)• UDMO Head Start (Graettinger)• YOUR Head Start (Fort Dodge)
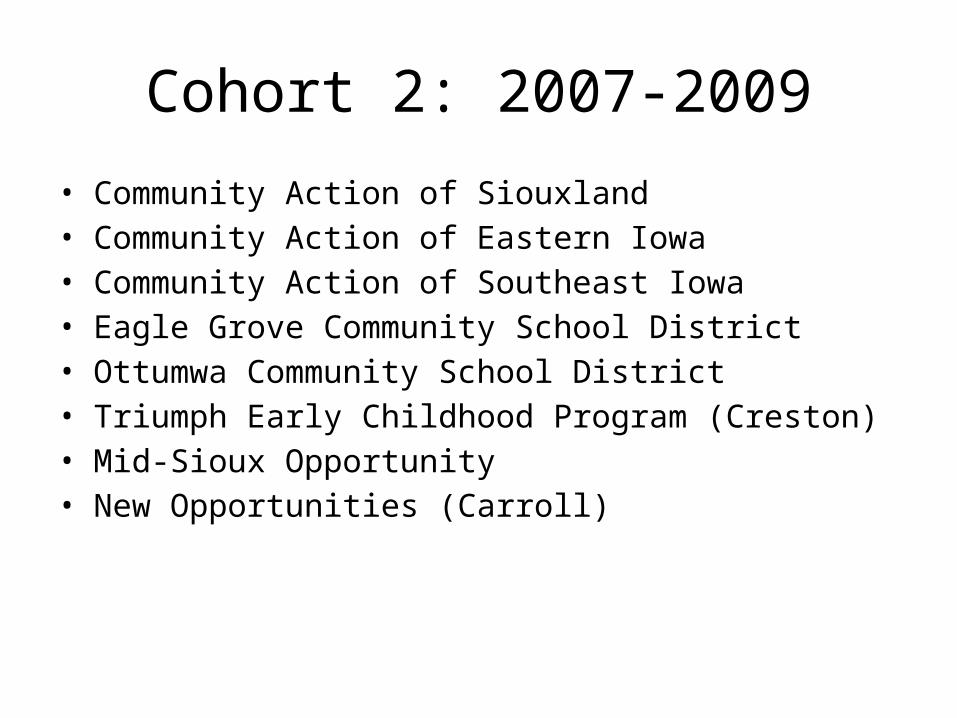
Cohort 2: 2007-2009
• Community Action of Siouxland• Community Action of Eastern Iowa• Community Action of Southeast Iowa• Eagle Grove Community School District• Ottumwa Community School District• Triumph Early Childhood Program (Creston)• Mid-Sioux Opportunity• New Opportunities (Carroll)
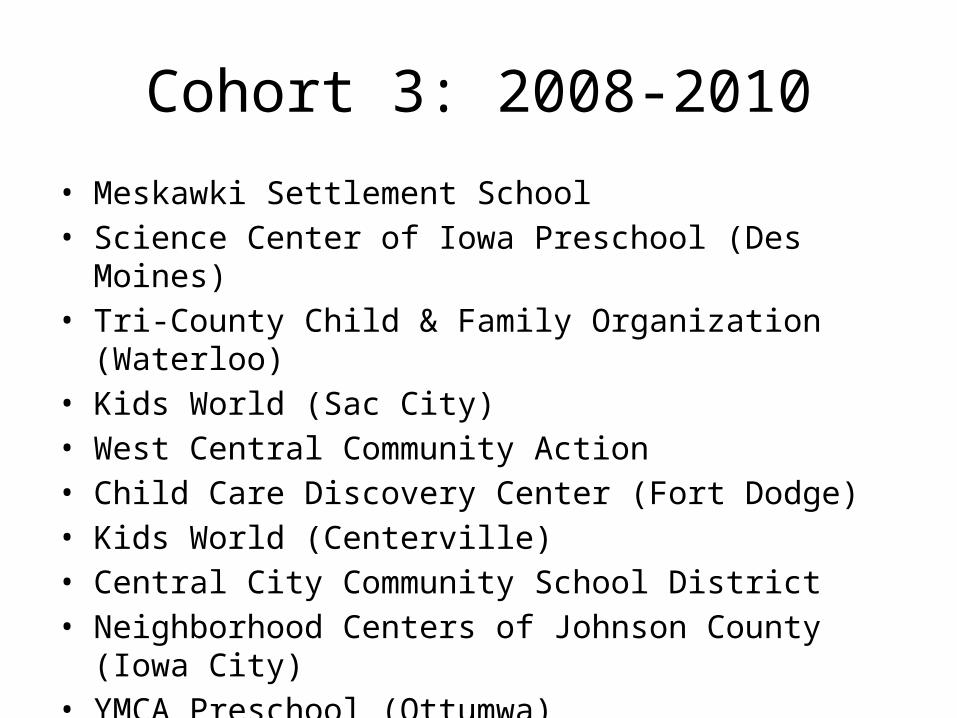
Cohort 3: 2008-2010
• Meskawki Settlement School• Science Center of Iowa Preschool (Des Moines)• Tri-County Child & Family Organization (Waterloo)• Kids World (Sac City)• West Central Community Action• Child Care Discovery Center (Fort Dodge)• Kids World (Centerville)• Central City Community School District• Neighborhood Centers of Johnson County (Iowa City)• YMCA Preschool (Ottumwa)
Data Measures
• Benchmarks of Quality• T-POT (Teaching Pyramid Observation Tool)
• Program Incident Reports• Behavior Incident Reports• SSRS (Social Skills Rating Scale)
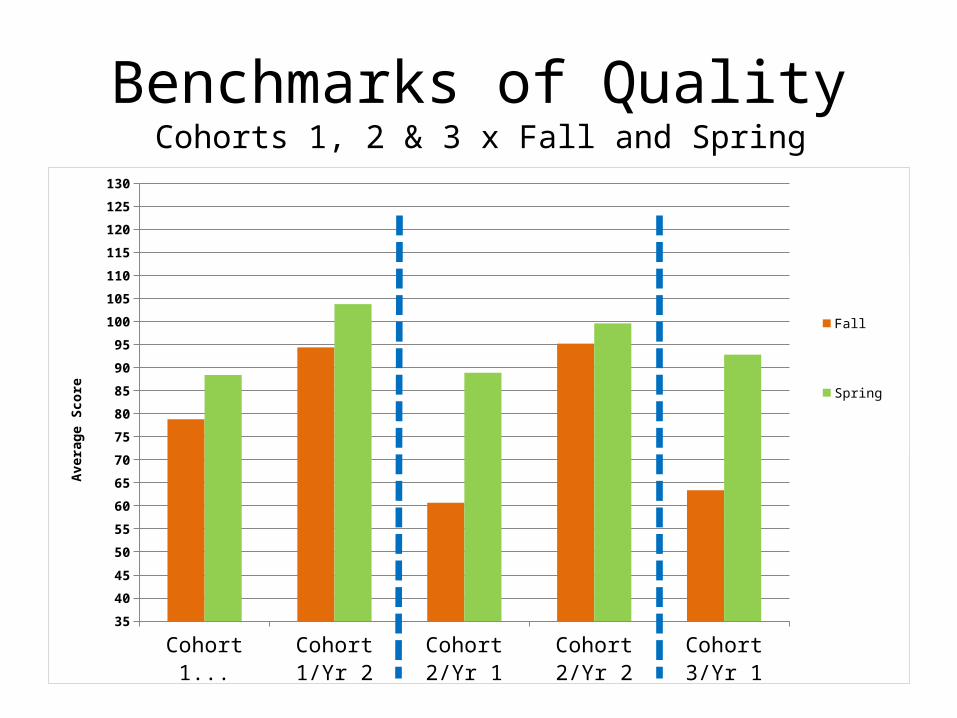
Cohort 1/Yr1 Cohort 1/Yr 2
Cohort 2/Yr 1
Cohort 2/Yr 2
Cohort 3/Yr 1
35
40
45
50
55
60
65
70
75
80
85
90
95
100
105
110
115
120
125
130
Fall Spring
Ave
rag
e S
core
Benchmarks of QualityCohorts 1, 2 & 3 x Fall and Spring
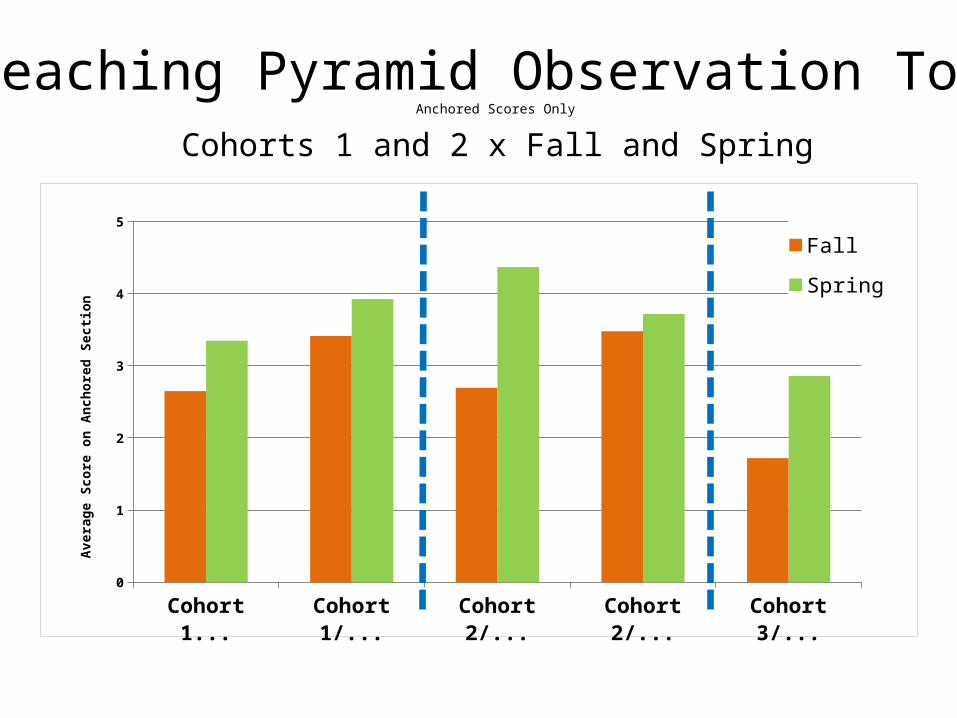
Teaching Pyramid Observation ToolAnchored Scores Only
Cohorts 1 and 2 x Fall and Spring
Cohort 1/Yr1 Cohort 1/Yr 2 Cohort 2/Yr 1 Cohort 2/Yr 2 Cohort 3/Yr 10
1
2
3
4
5
Fall
Spring
Ave
rag
e S
core
on
An
cho
red
Sec
tio
n
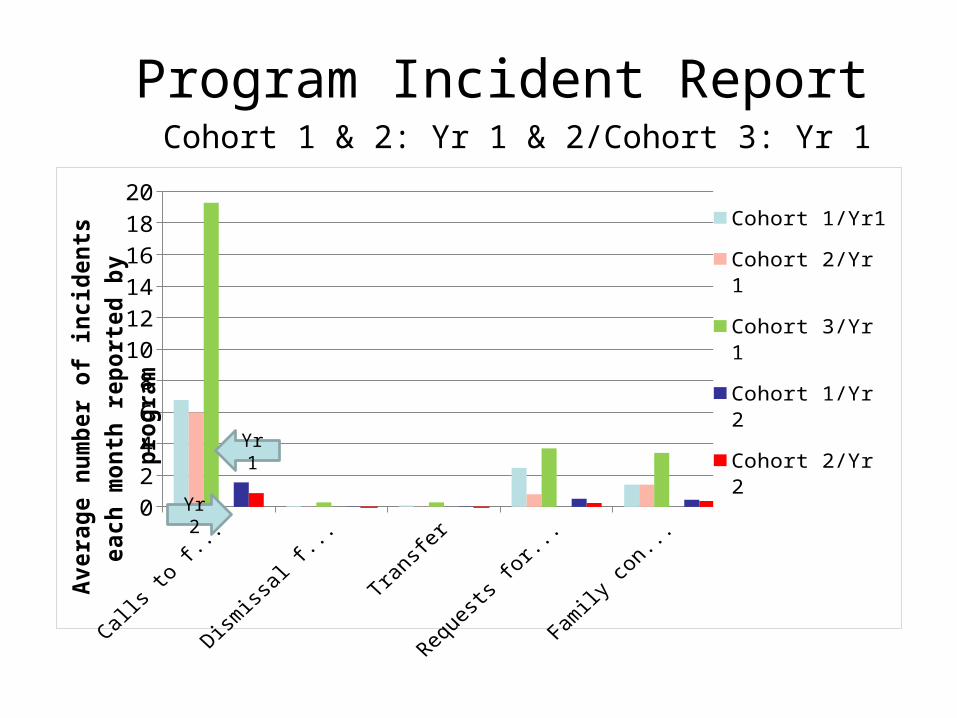
Program Incident ReportCohort 1 & 2: Yr 1 & 2/Cohort 3: Yr 1
0
2
4
6
8
10
12
14
16
18
20
Cohort 1/Yr1
Cohort 2/Yr 1
Cohort 3/Yr 1
Cohort 1/Yr 2
Cohort 2/Yr 2
Avera
ge n
um
ber
of
incid
en
ts
each
mo
nth
rep
ort
ed
by p
rog
ram
Yr 1
Yr 2
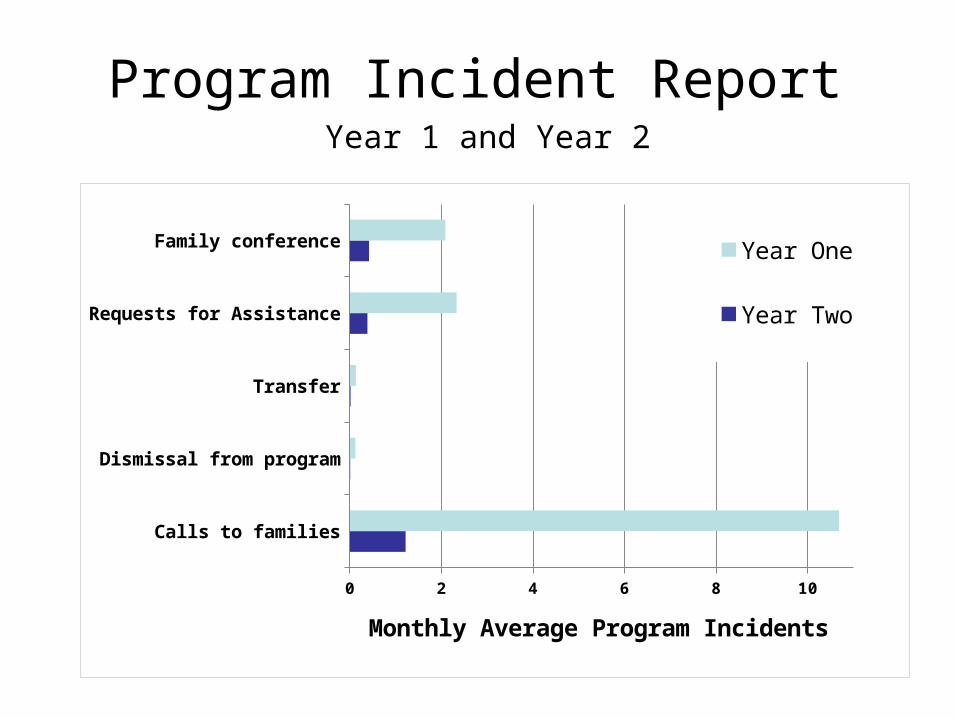
Program Incident ReportYear 1 and Year 2
Calls to families
Dismissal from program
Transfer
Requests for Assistance
Family conference
0 2 4 6 8 10
Year One
Year Two
Monthly Average Program Incidents
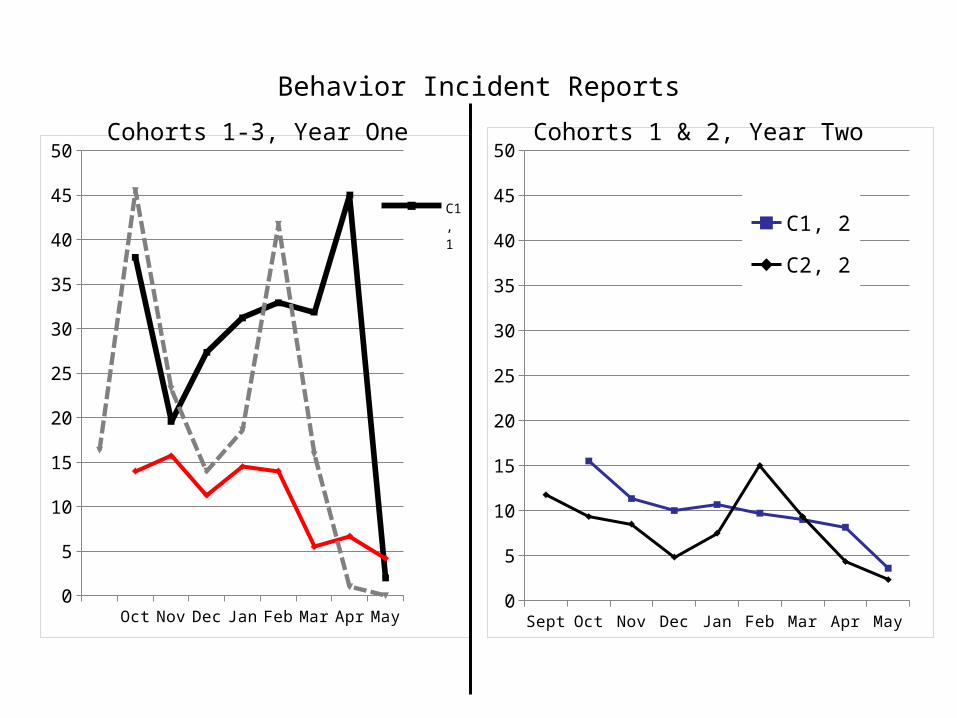
Behavior Incident Reports
Sept Oct Nov Dec Jan Feb Mar Apr May0
5
10
15
20
25
30
35
40
45
50
C1, 1C2, 1
Sept Oct Nov Dec Jan Feb Mar Apr May0
5
10
15
20
25
30
35
40
45
50
C1, 2
C2, 2
Cohorts 1-3, Year One Cohorts 1 & 2, Year Two
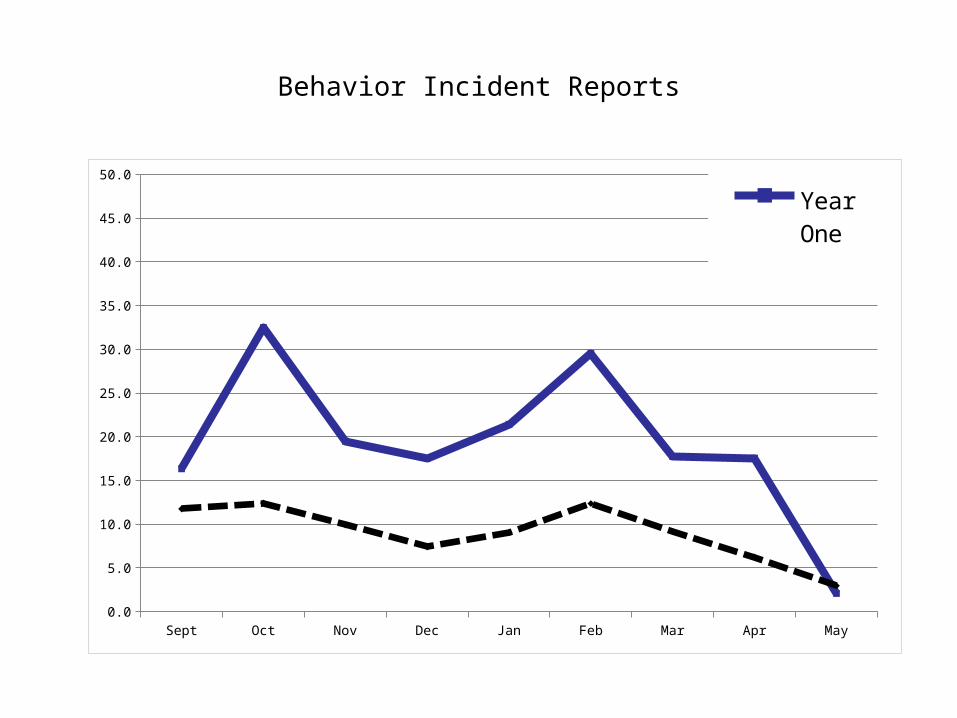
Behavior Incident Reports
Sept Oct Nov Dec Jan Feb Mar Apr May0.0
5.0
10.0
15.0
20.0
25.0
30.0
35.0
40.0
45.0
50.0
Year One
Year Two
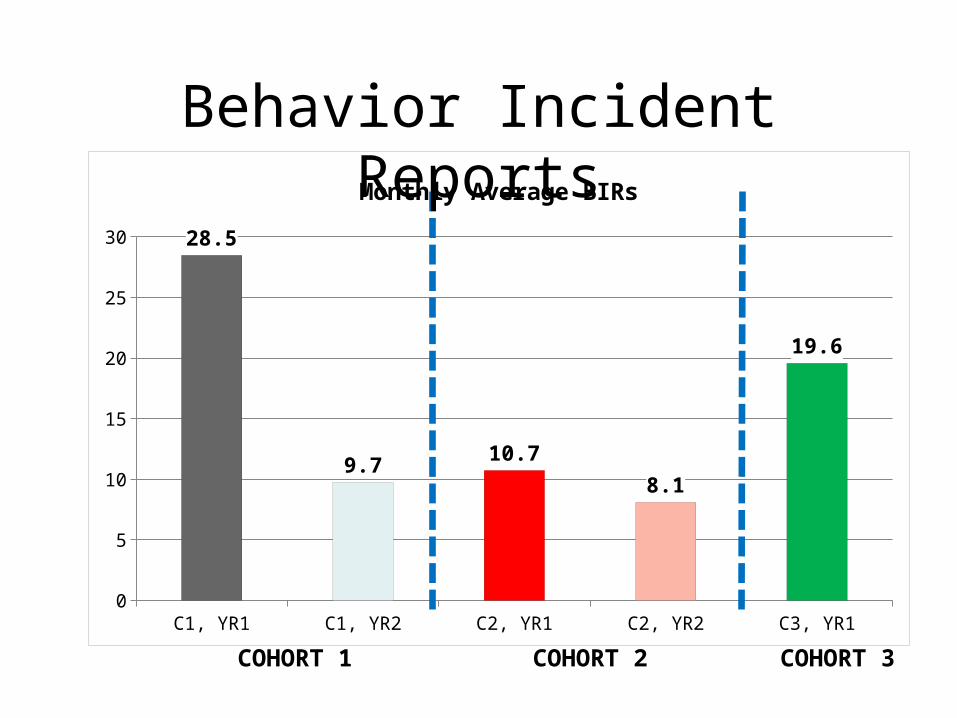
C1, YR1 C1, YR2 C2, YR1 C2, YR2 C3, YR10
5
10
15
20
25
30 28.5
9.7 10.7
8.1
19.6
Monthly Average BIRs
Behavior Incident Reports
COHORT 1 COHORT 2 COHORT 3
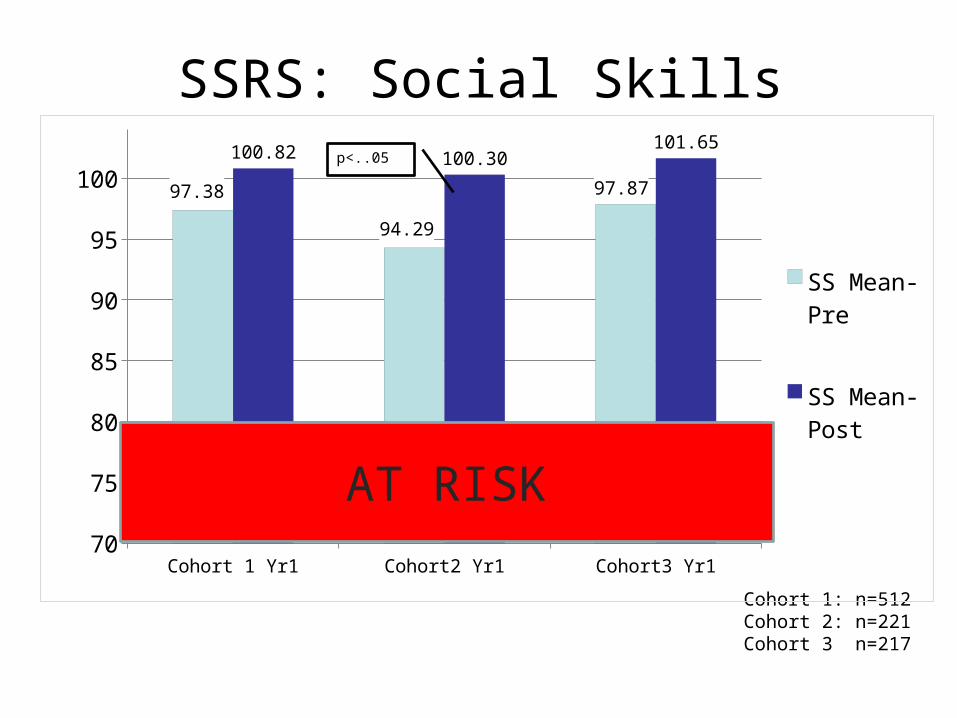
Cohort 1: n=512Cohort 2: n=221Cohort 3 n=217
SSRS: Social Skills
Cohort 1 Yr1 Cohort2 Yr1 Cohort3 Yr170
75
80
85
90
95
10097.38
94.29
97.87
100.82 100.30101.65
SS Mean-Pre
SS Mean-Post
AT RISK
p<..05
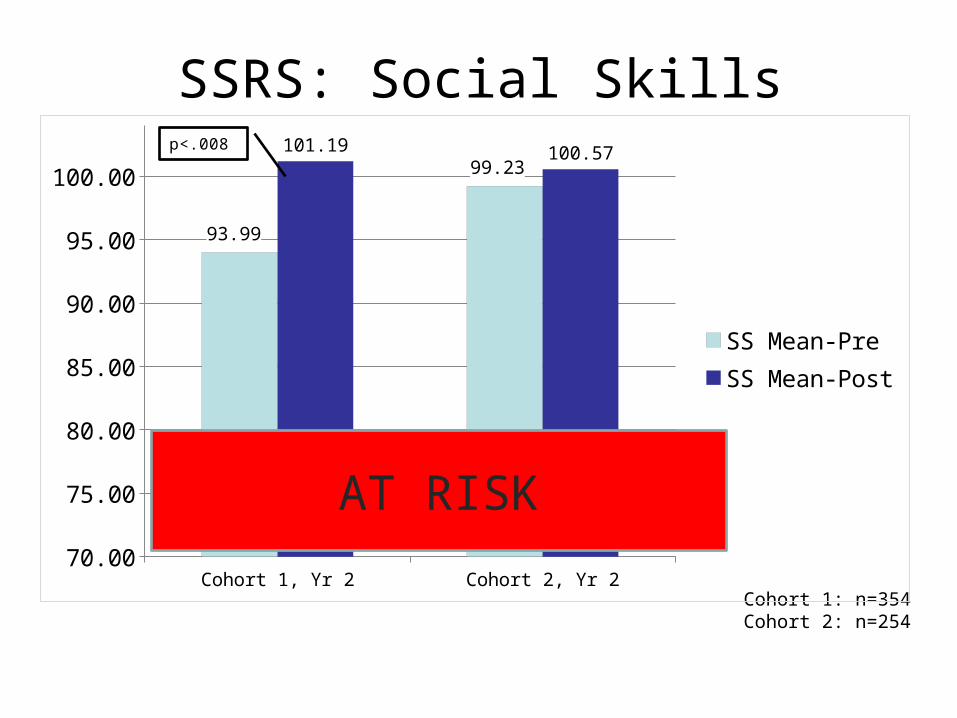
Cohort 1: n=354Cohort 2: n=254
SSRS: Social Skills
Cohort 1, Yr 2 Cohort 2, Yr 270.00
75.00
80.00
85.00
90.00
95.00
100.00
93.99
99.23101.19 100.57
SS Mean-PreSS Mean-Post
p<.008
AT RISK
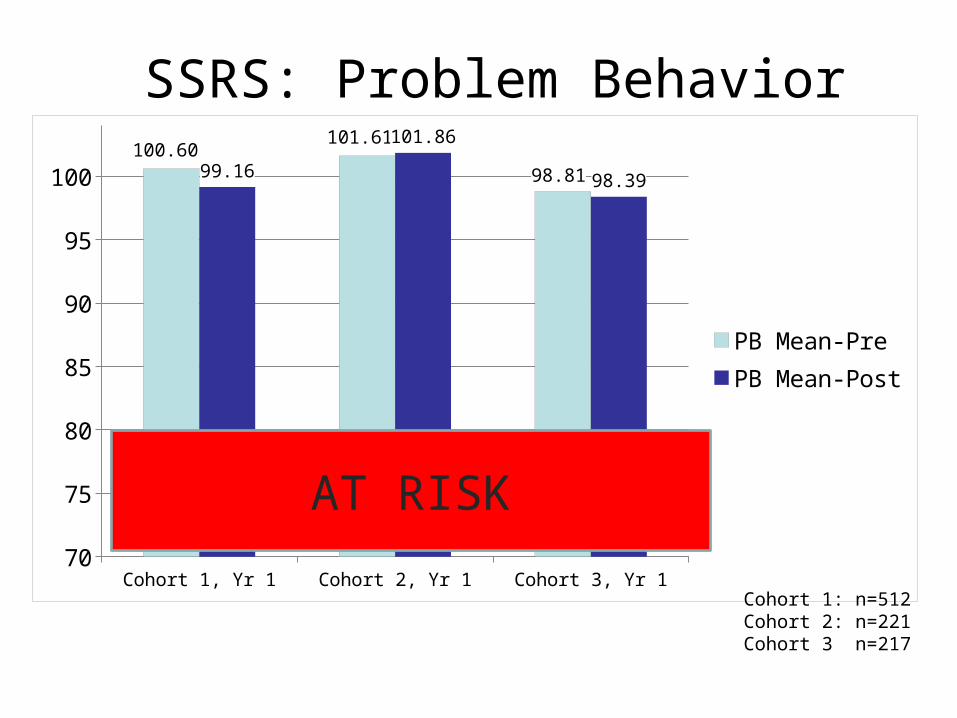
Cohort 1, Yr 1 Cohort 2, Yr 1 Cohort 3, Yr 170
75
80
85
90
95
100100.60
101.61
98.8199.16
101.86
98.39
PB Mean-PrePB Mean-Post
SSRS: Problem Behavior
Cohort 1: n=512Cohort 2: n=221Cohort 3 n=217
AT RISK
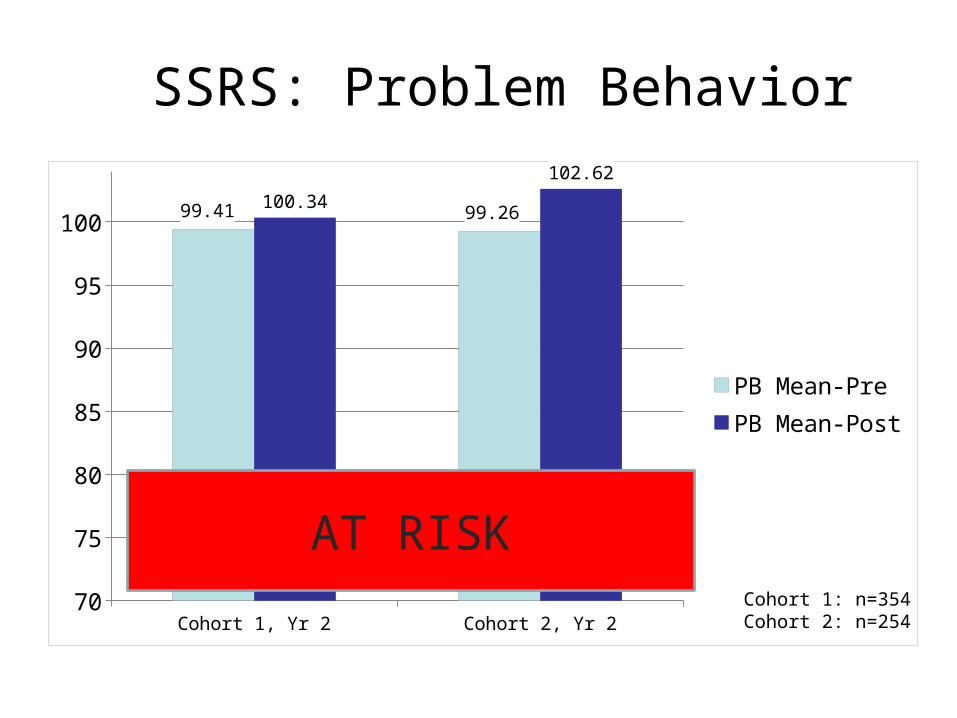
Cohort 1: n=354Cohort 2: n=254
SSRS: Problem Behavior
Cohort 1, Yr 2 Cohort 2, Yr 270
75
80
85
90
95
100 99.41 99.26100.34
102.62
PB Mean-PrePB Mean-Post
AT RISK
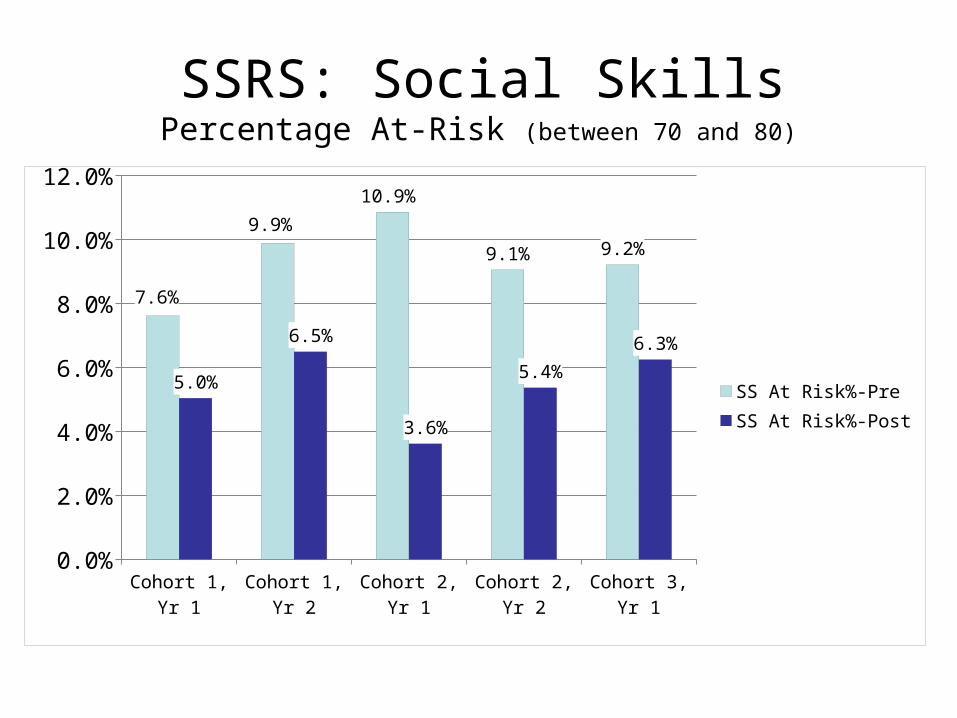
SSRS: Social SkillsPercentage At-Risk (between 70 and 80)
Cohort 1, Yr 1
Cohort 1, Yr 2
Cohort 2, Yr 1
Cohort 2, Yr 2
Cohort 3, Yr 1
0.0%
2.0%
4.0%
6.0%
8.0%
10.0%
12.0%
7.6%
9.9%
10.9%
9.1% 9.2%
5.0%
6.5%
3.6%
5.4%
6.3%
SS At Risk%-PreSS At Risk%-Post
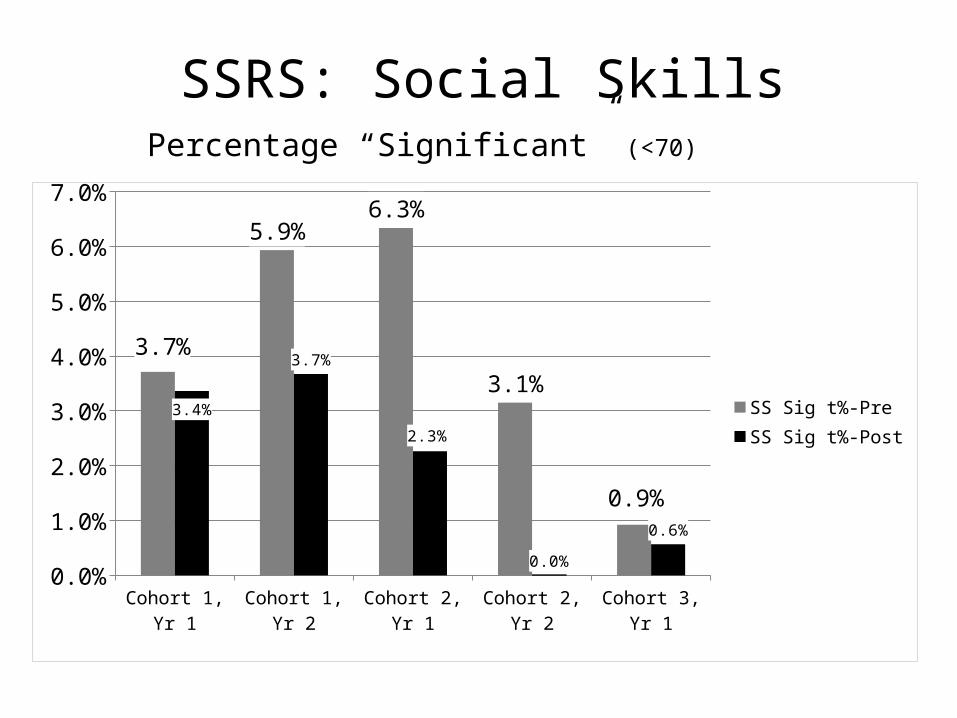
SSRS: Social SkillsPercentage “Significant” (<70)
Cohort 1, Yr 1
Cohort 1, Yr 2
Cohort 2, Yr 1
Cohort 2, Yr 2
Cohort 3, Yr 1
0.0%
1.0%
2.0%
3.0%
4.0%
5.0%
6.0%
7.0%
3.7%
5.9%6.3%
3.1%
0.9%
3.4%
3.7%
2.3%
0.0%
0.6%
SS Sig t%-PreSS Sig t%-Post
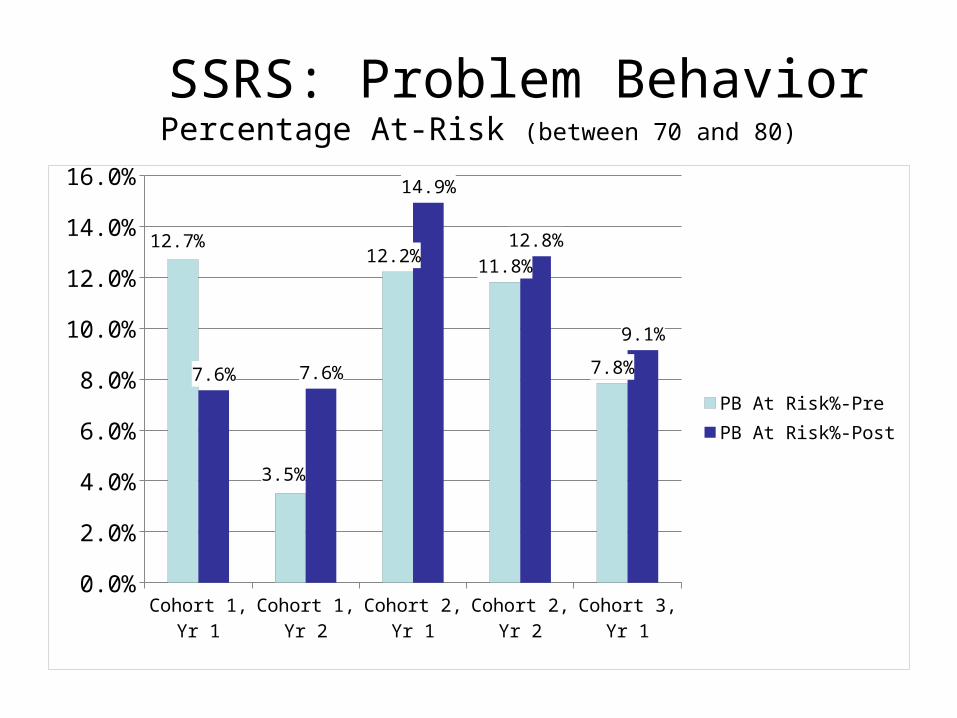
SSRS: Problem Behavior
Cohort 1, Yr 1
Cohort 1, Yr 2
Cohort 2, Yr 1
Cohort 2, Yr 2
Cohort 3, Yr 1
0.0%
2.0%
4.0%
6.0%
8.0%
10.0%
12.0%
14.0%
16.0%
12.7%
3.5%
12.2%11.8%
7.8%7.6% 7.6%
14.9%
12.8%
9.1%
PB At Risk%-PrePB At Risk%-Post
Percentage At-Risk (between 70 and 80)
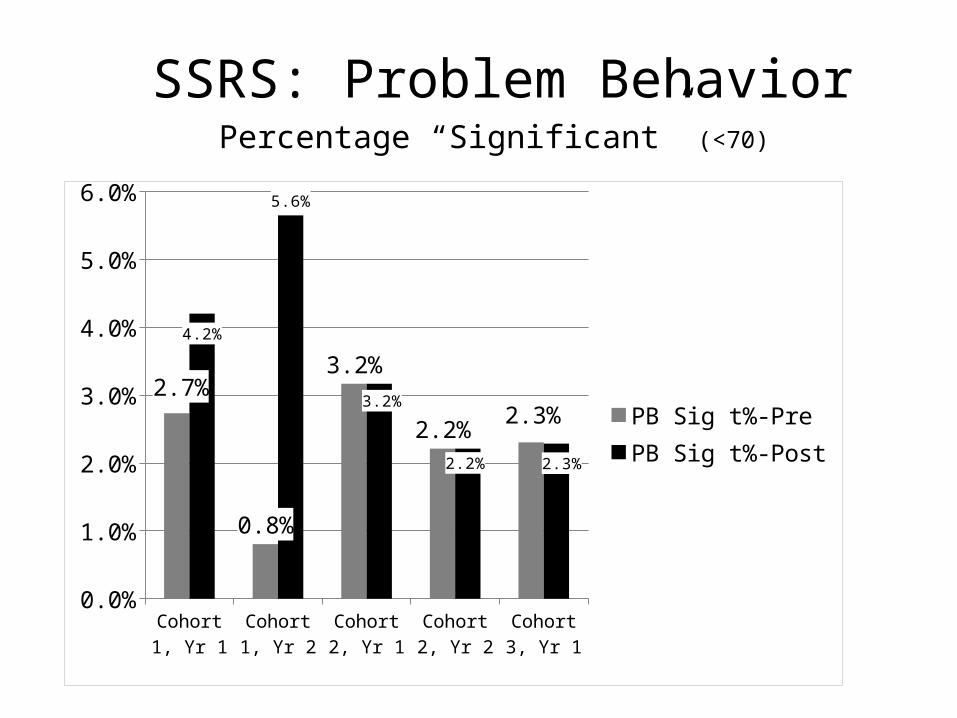
SSRS: Problem Behavior
Cohort 1, Yr 1
Cohort 1, Yr 2
Cohort 2, Yr 1
Cohort 2, Yr 2
Cohort 3, Yr 1
0.0%
1.0%
2.0%
3.0%
4.0%
5.0%
6.0%
2.7%
0.8%
3.2%
2.2%2.3%
4.2%
5.6%
3.2%
2.2% 2.3%
PB Sig t%-PrePB Sig t%-Post
Percentage “Significant” (<70)