Embed Size (px)
Citation preview
IPG PHOTONICSMatt Briggs, Yosha Huang, Lukas Vlahos
Outline
Company Overview
Industry Overview
Technological Advantage
Growth Opportunities
Variant Perception
Valuation
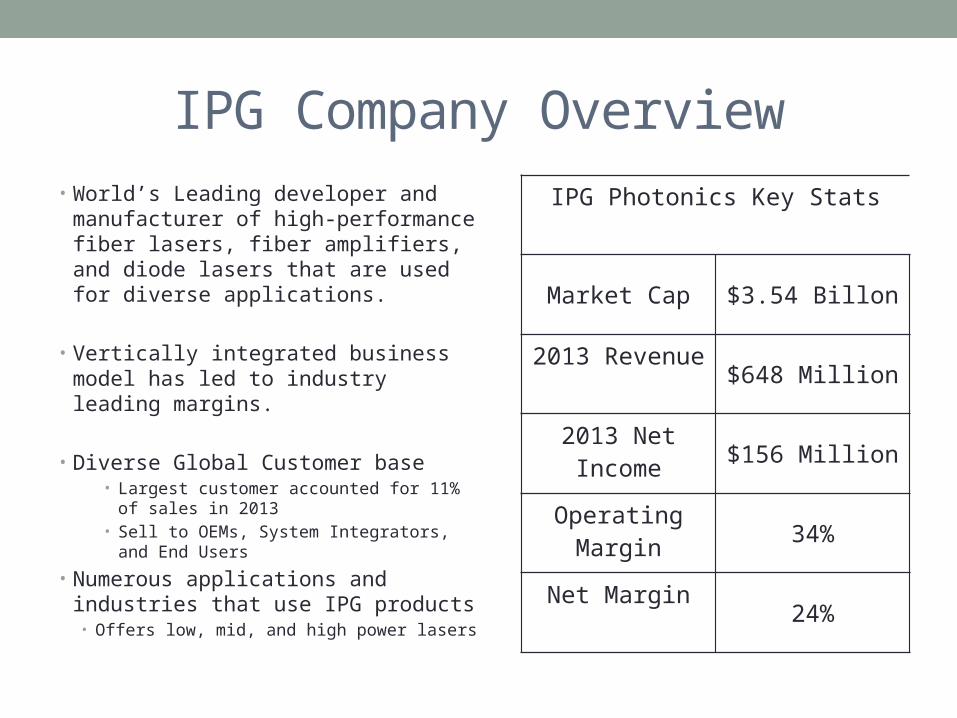
IPG Company Overview• World’s Leading developer and
manufacturer of high-performance fiber lasers, fiber amplifiers, and diode lasers that are used for diverse applications.
• Vertically integrated business model has led to industry leading margins.
• Diverse Global Customer base • Largest customer accounted for 11% of
sales in 2013 • Sell to OEMs, System Integrators, and
End Users
• Numerous applications and industries that use IPG products
• Offers low, mid, and high power lasers
IPG Photonics Key Stats
Market Cap $3.54 Billon
2013 Revenue$648 Million
2013 Net Income $156 Million
Operating Margin 34%
Net Margin24%
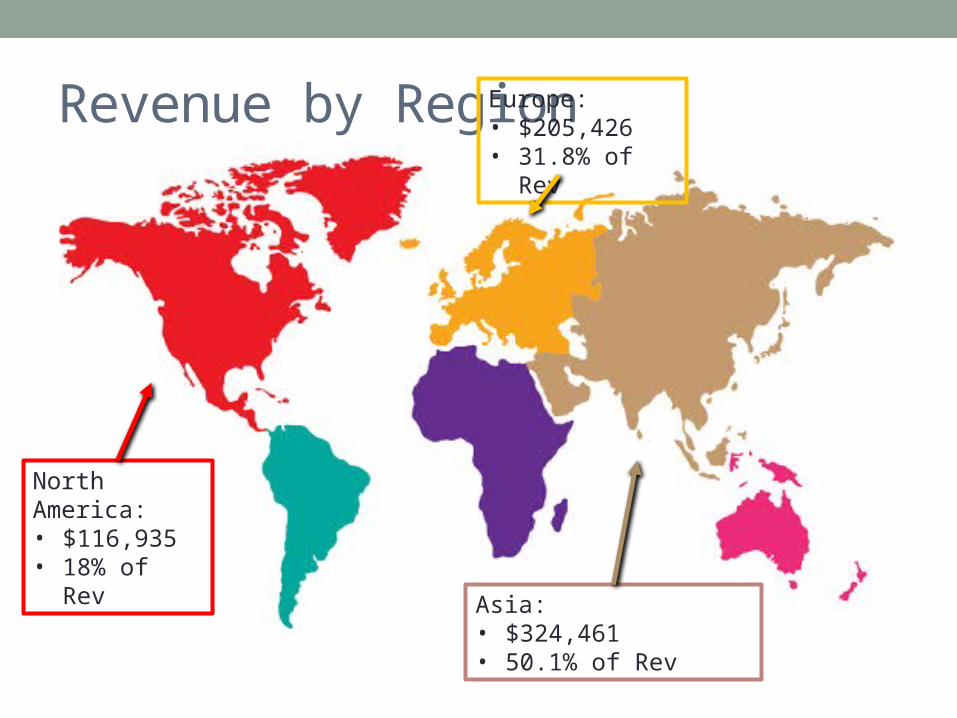
Revenue by Region
North America: • $116,935• 18% of Rev
Europe:• $205,426• 31.8% of
Rev
Asia: • $324,461• 50.1% of Rev
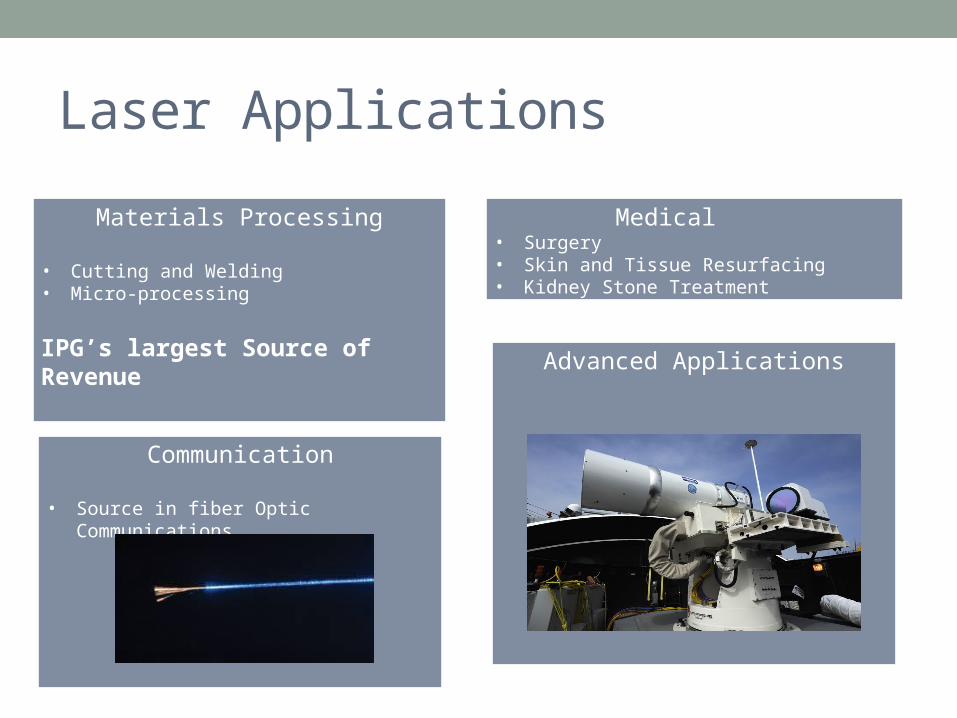
Laser Applications
Materials Processing
• Cutting and Welding• Micro-processing
IPG’s largest Source of Revenue
Medical • Surgery• Skin and Tissue Resurfacing• Kidney Stone Treatment
Advanced Applications
Communication
• Source in fiber Optic Communications
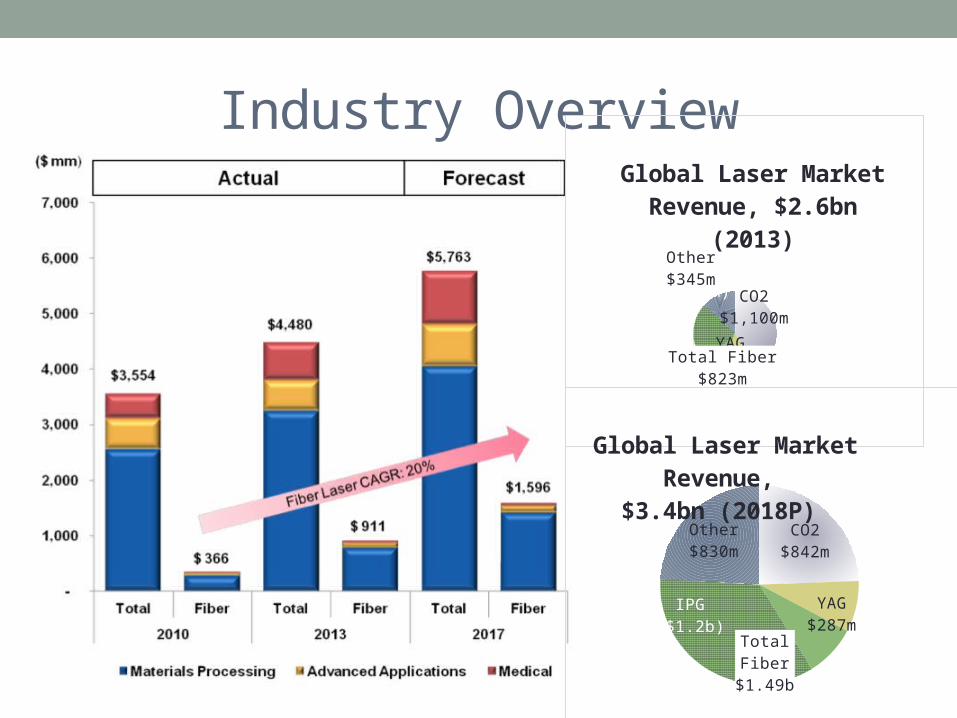
Industry Overview
CO2$1,100m
YAG$330m
IPG($648m)
Total Fiber$823m
Other$345m
Global Laser Market Revenue, $2.6bn
(2013)
CO2$842m
YAG$287mTotal
Fiber$1.49b
IPG($1.2b)
Other$830m
Global Laser Market Revenue,
$3.4bn (2018P)
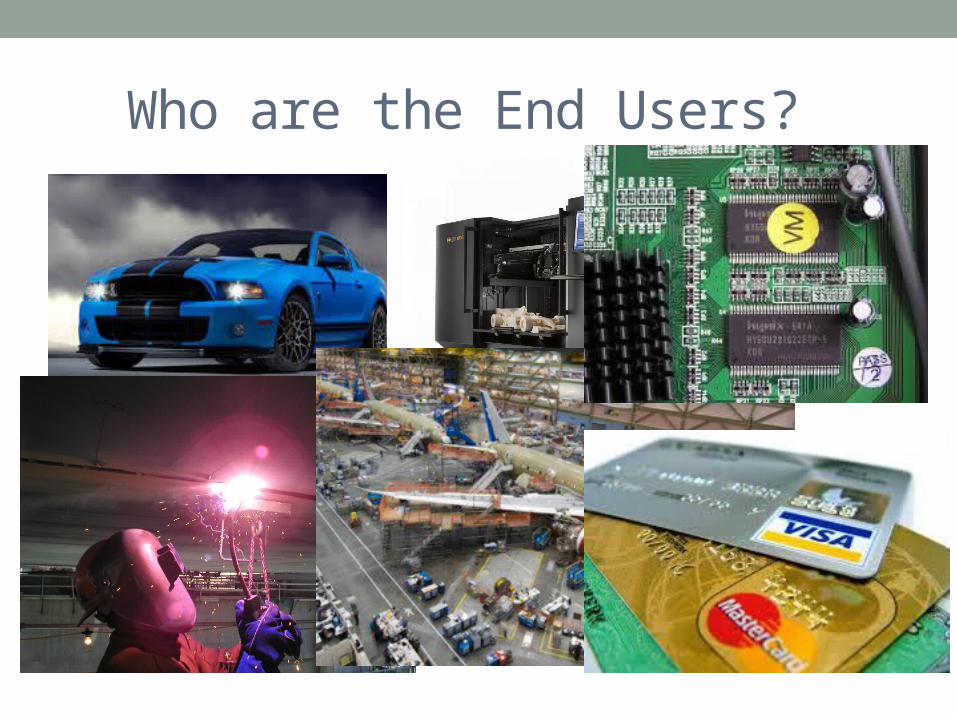
Who are the End Users?
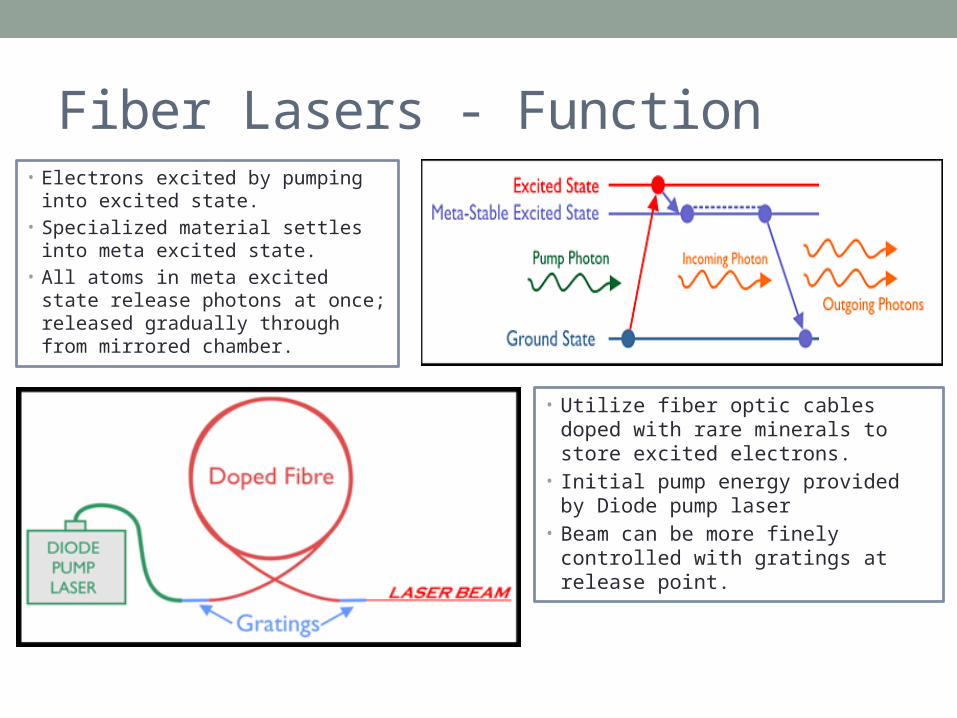
Fiber Lasers - Function• Electrons excited by pumping
into excited state. • Specialized material settles into
meta excited state. • All atoms in meta excited state
release photons at once; released gradually through from mirrored chamber.
• Utilize fiber optic cables doped with rare minerals to store excited electrons.
• Initial pump energy provided by Diode pump laser
• Beam can be more finely controlled with gratings at release point.
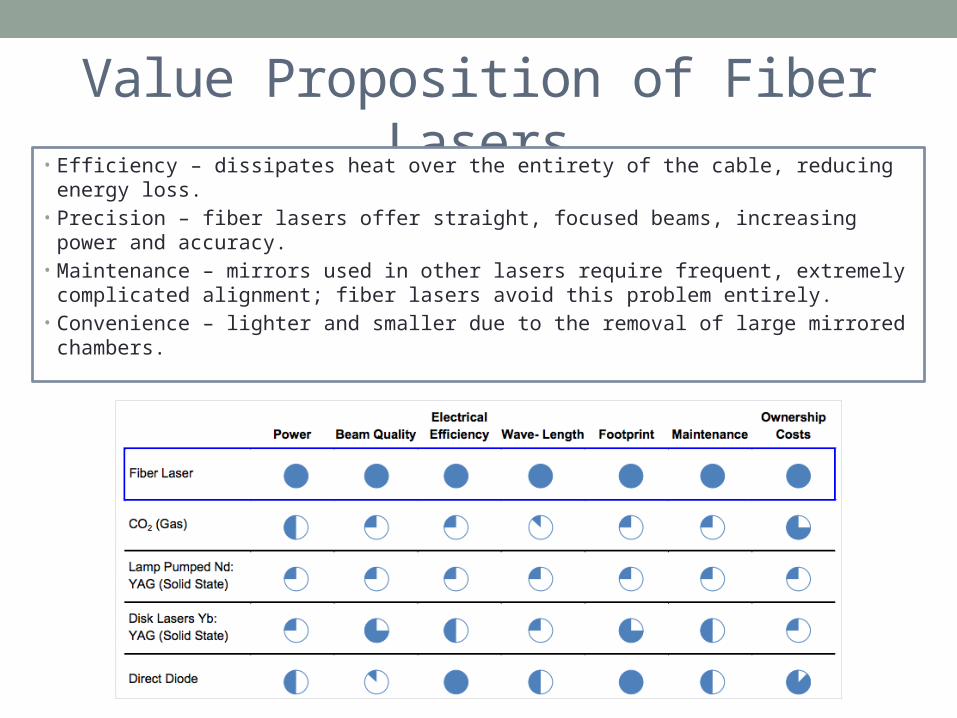
Value Proposition of Fiber Lasers
• Efficiency – dissipates heat over the entirety of the cable, reducing energy loss.
• Precision – fiber lasers offer straight, focused beams, increasing power and accuracy.
• Maintenance – mirrors used in other lasers require frequent, extremely complicated alignment; fiber lasers avoid this problem entirely.
• Convenience – lighter and smaller due to the removal of large mirrored chambers.
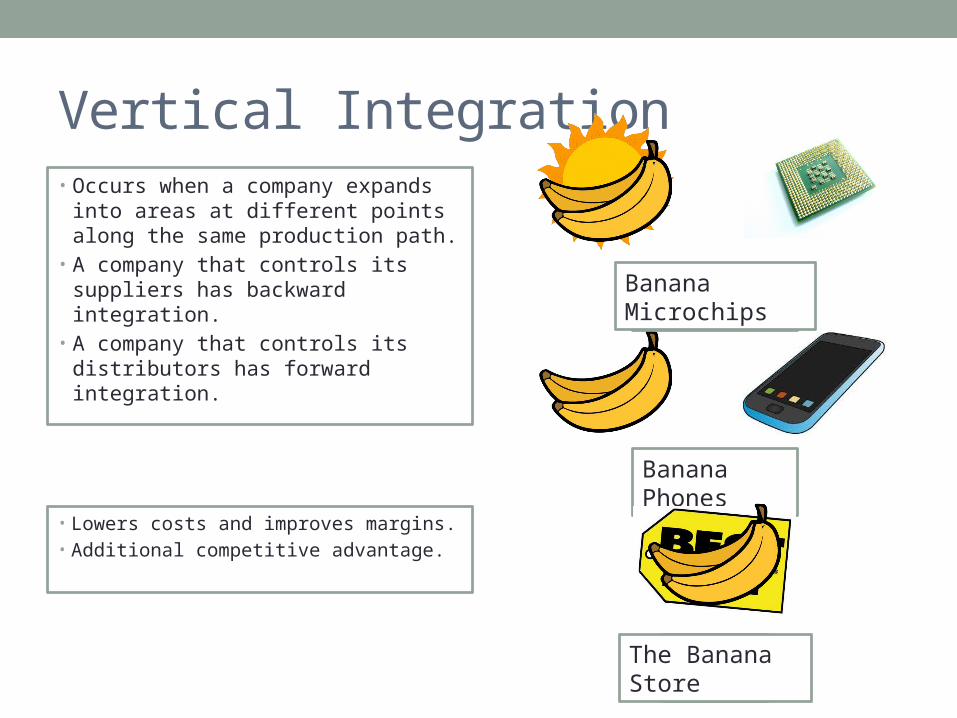
Vertical Integration• Occurs when a company expands
into areas at different points along the same production path.
• A company that controls its suppliers has backward integration.
• A company that controls its distributors has forward integration.
Banana Phones
Sun Microchips
Bestbuy
Banana Microchips
The Banana Store
• Lowers costs and improves margins.• Additional competitive advantage.
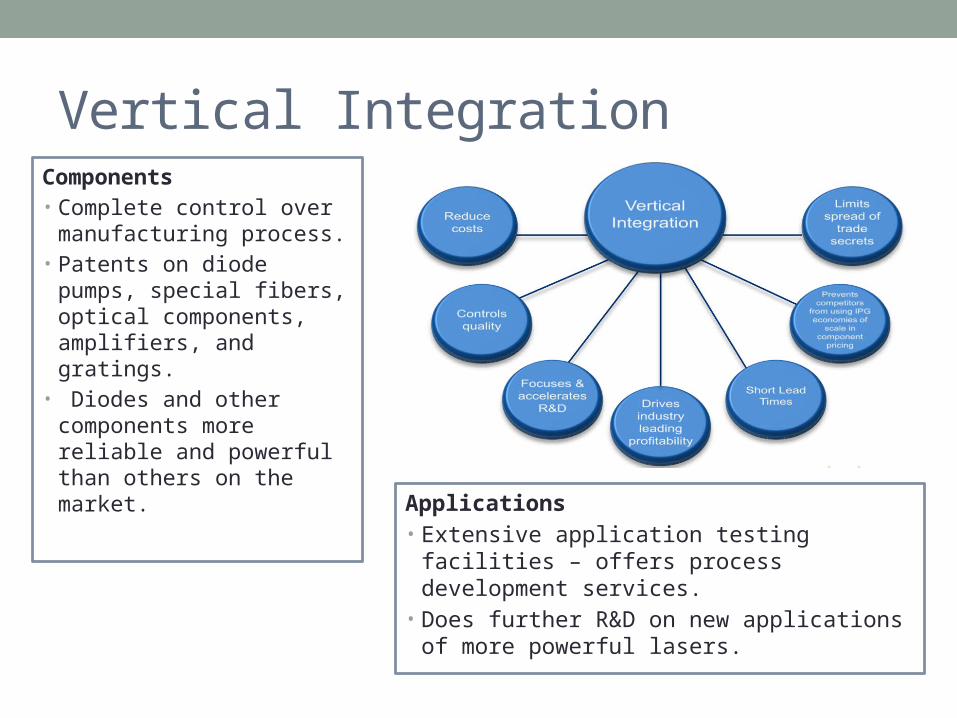
Vertical IntegrationComponents• Complete control over
manufacturing process.• Patents on diode
pumps, special fibers, optical components, amplifiers, and gratings.
• Diodes and other components more reliable and powerful than others on the market.
Applications• Extensive application testing facilities
– offers process development services. • Does further R&D on new applications
of more powerful lasers.
Investment Thesis
• Recent insider sales have lead to an overreaction from the market, driving the prices down.
• The Street is concerned about adoption rates of the disruptive technology.
• The Street is overly concerned about increased competition from low-cost producers due to temporary slowdowns in bookings from key market sectors, like China.
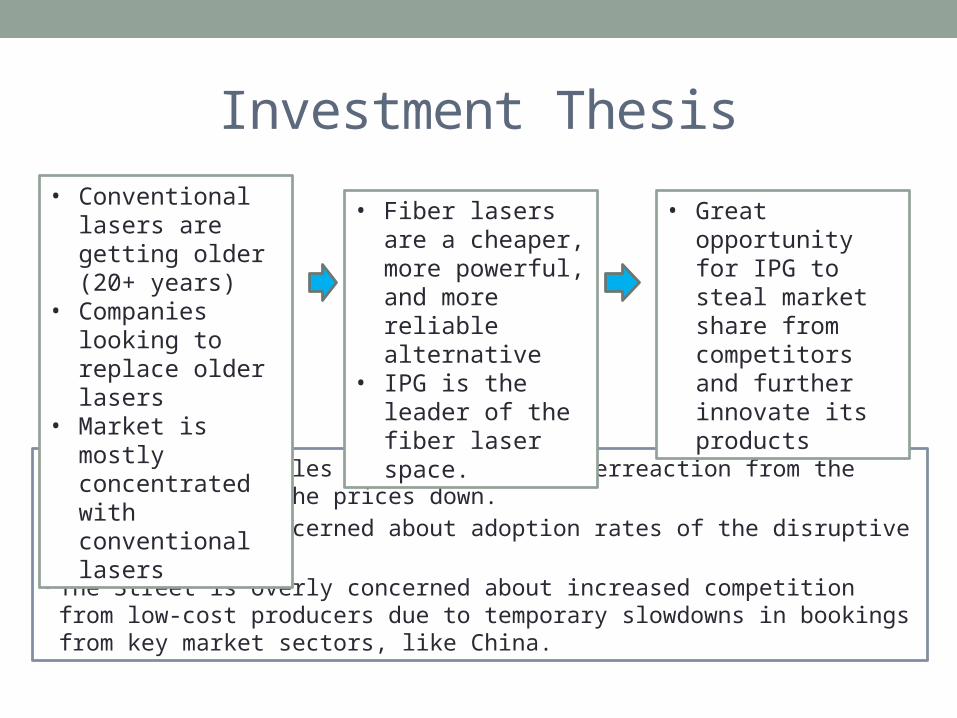
• Conventional lasers are getting older (20+ years)
• Companies looking to replace older lasers
• Market is mostly concentrated with conventional lasers
• Fiber lasers are a cheaper, more powerful, and more reliable alternative
• IPG is the leader of the fiber laser space.
• Great opportunity for IPG to steal market share from competitors and further innovate its products
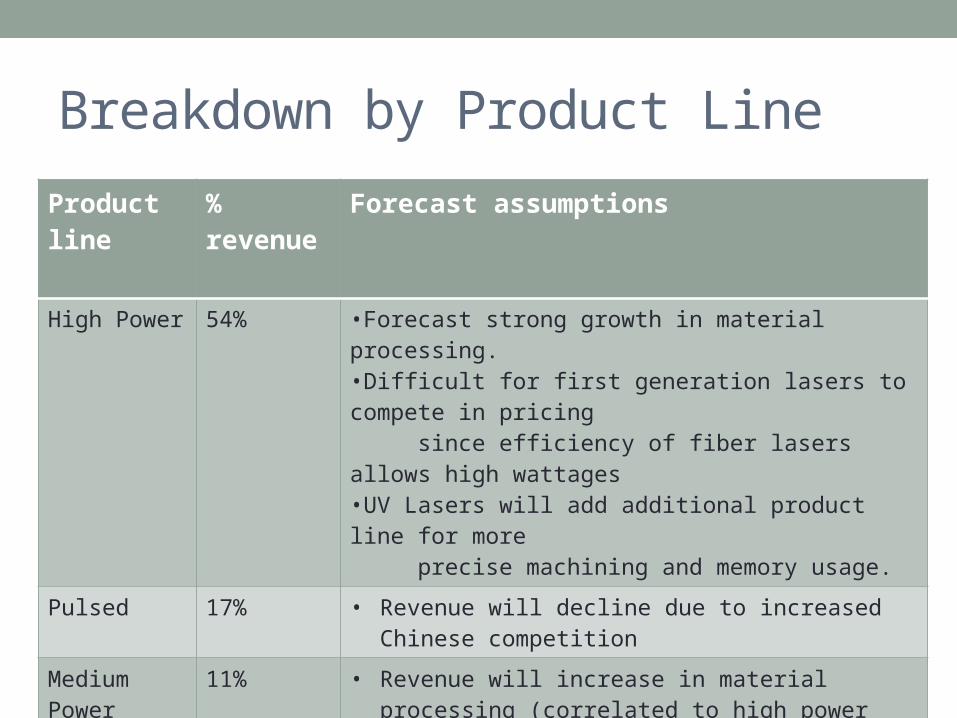
Breakdown by Product Line
Product line
% revenue
Forecast assumptions
High Power 54% •Forecast strong growth in material processing.•Difficult for first generation lasers to compete in pricing since efficiency of fiber lasers allows high wattages•UV Lasers will add additional product line for more precise machining and memory usage.
Pulsed 17% • Revenue will decline due to increased Chinese competition
Medium Power
11% • Revenue will increase in material processing (correlated to high power growth)
QCW 4% • Revenue will increase in fine welding applications as they replace Nd:YAG
Low Power 2% • Decrease in revenue due to stronger competition in Asia and from established gas laser producers which can manufacture low power lasers at a lower price point
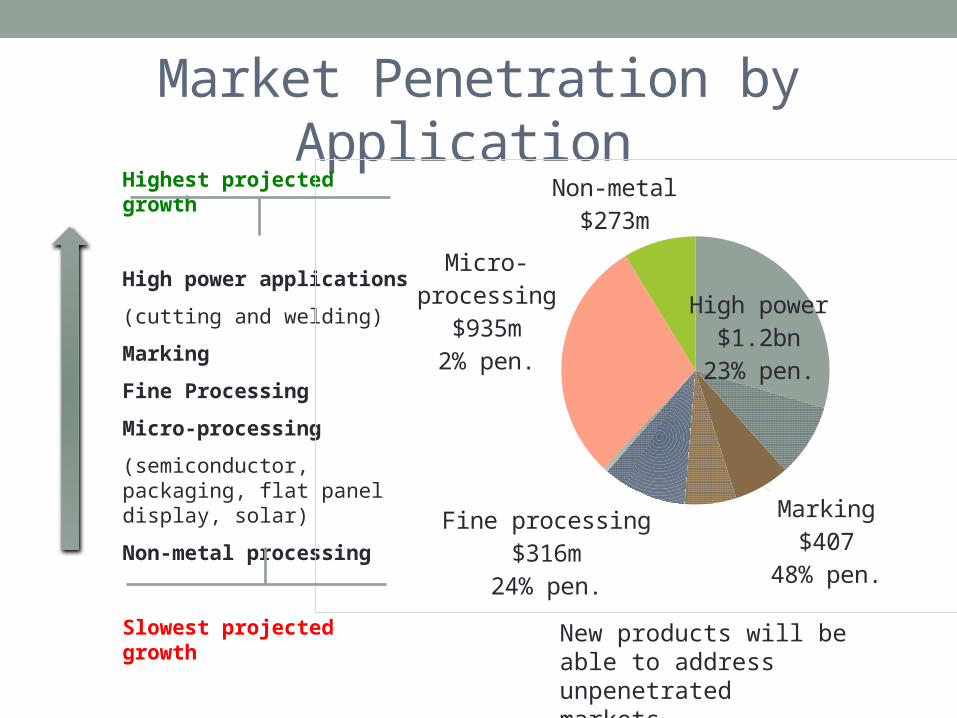
Market Penetration by Application
Highest projected growth
High power applications
(cutting and welding)
Marking
Fine Processing
Micro-processing
(semiconductor, packaging, flat panel display, solar)
Non-metal processing
Slowest projected growth
High power$1.2bn
23% pen.
Marking$407
48% pen.
Fine processing$316m
24% pen.
Micro-process-ing
$935m2% pen.
Non-metal$273m
New products will be able to address unpenetrated markets.
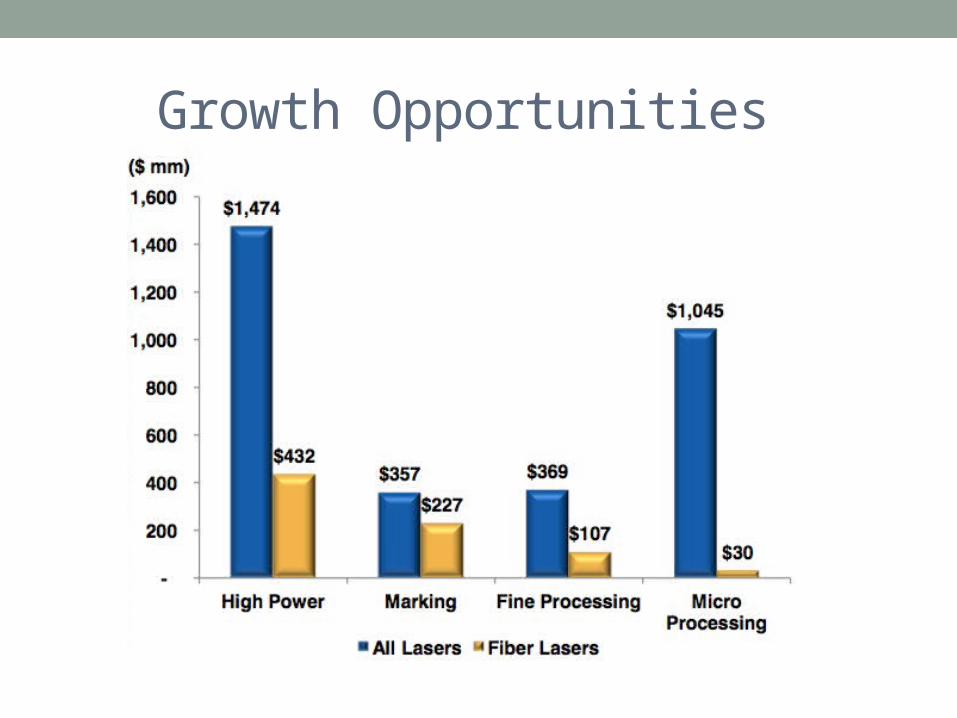
Growth Opportunities
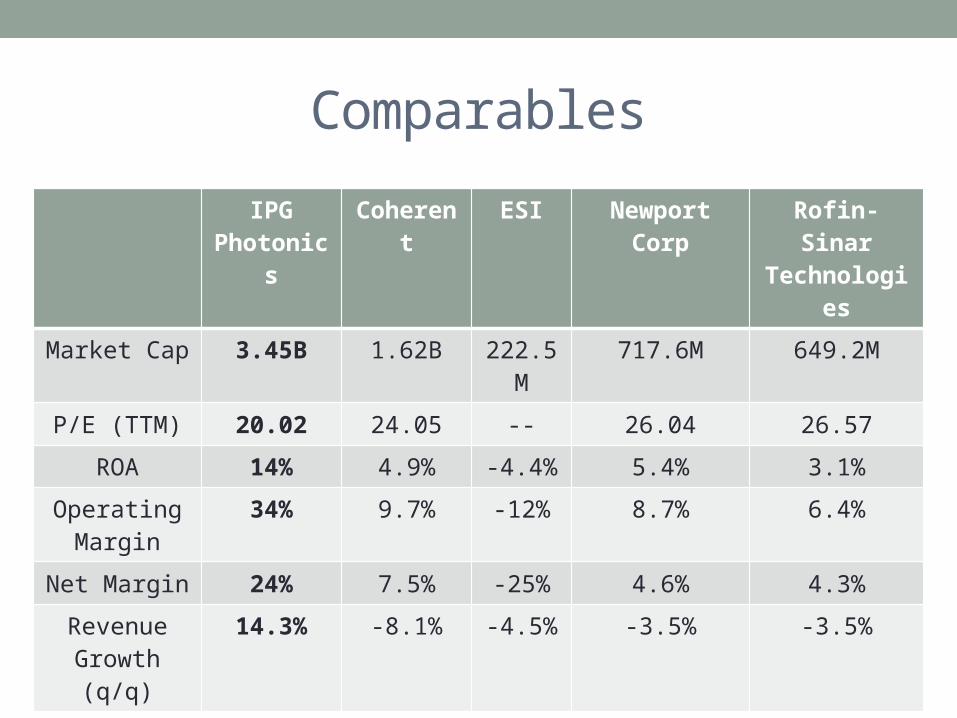
Comparables
IPG Photonic
s
Coherent
ESI Newport Corp
Rofin-Sinar Technologi
es
Market Cap 3.45B 1.62B 222.5M
717.6M 649.2M
P/E (TTM) 20.02 24.05 -- 26.04 26.57
ROA 14% 4.9% -4.4% 5.4% 3.1%
Operating Margin
34% 9.7% -12% 8.7% 6.4%
Net Margin 24% 7.5% -25% 4.6% 4.3%
Revenue Growth
(q/q)
14.3% -8.1% -4.5% -3.5% -3.5%
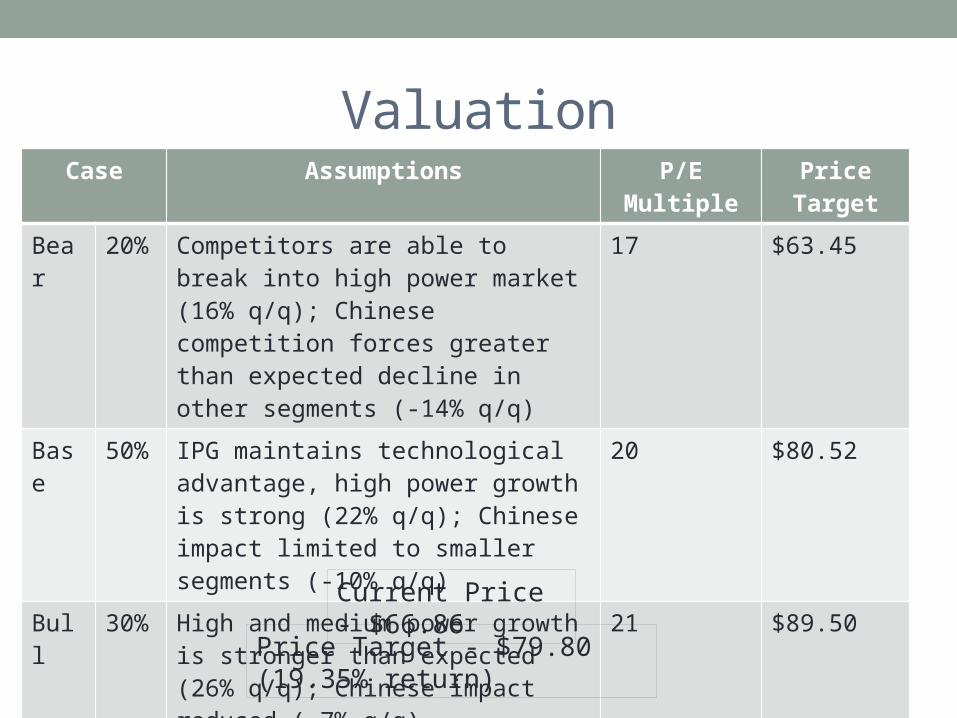
ValuationCase Assumptions P/E
MultiplePrice
Target
Bear
20%
Competitors are able to break into high power market (16% q/q); Chinese competition forces greater than expected decline in other segments (-14% q/q)
17 $63.45
Base
50%
IPG maintains technological advantage, high power growth is strong (22% q/q); Chinese impact limited to smaller segments (-10% q/q)
20 $80.52
Bull 30%
High and medium power growth is stronger than expected (26% q/q); Chinese impact reduced (-7% q/q)
21 $89.50
Current Price - $66.86
Price Target - $79.80 (19.35% return)
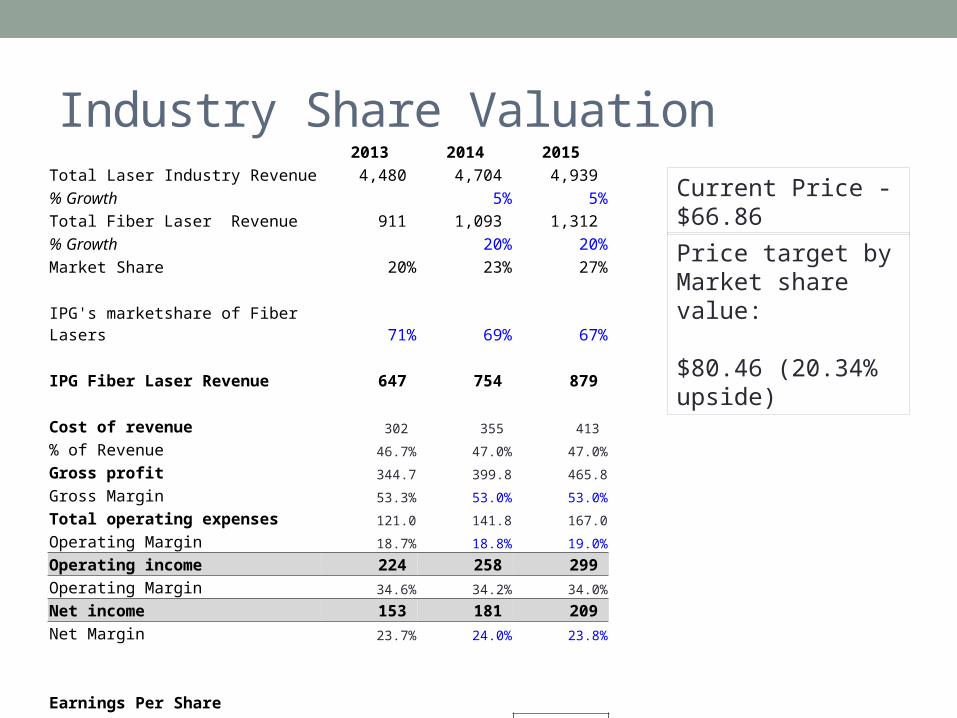
Industry Share Valuation 2013 2014 2015Total Laser Industry Revenue 4,480 4,704 4,939 % Growth 5% 5%Total Fiber Laser Revenue 911 1,093 1,312 % Growth 20% 20%Market Share 20% 23% 27% IPG's marketshare of Fiber Lasers 71% 69% 67% IPG Fiber Laser Revenue 647 754 879 Cost of revenue 302 355 413
% of Revenue 46.7% 47.0% 47.0%
Gross profit 344.7 399.8 465.8
Gross Margin 53.3% 53.0% 53.0%
Total operating expenses 121.0 141.8 167.0
Operating Margin 18.7% 18.8% 19.0%
Operating income 224 258 299 Operating Margin 34.6% 34.2% 34.0%
Net income 153 181 209 Net Margin 23.7% 24.0% 23.8%
Earnings Per ShareBasic 3.07 3.48 $4.02
Diluted 2.95 3.48 4.02
Current Price - $66.86
Price target by Market share value:
$80.46 (20.34% upside)

Q&A

Appendix
31-D
ec
7-Ja
n
14-Ja
n
21-Ja
n
28-Ja
n
4-Fe
b
11-F
eb
18-F
eb
25-F
eb
4-M
ar
11-M
ar
18-M
ar
25-M
ar
1-Apr
8-Apr
15-A
pr
22-A
pr
29-A
pr
6-M
ay
13-M
ay
20-M
ay
27-M
ay
3-Ju
n
10-Ju
n
17-Ju
n
24-Ju
n1-
Jul
8-Ju
l
15-Ju
l
22-Ju
l
29-Ju
l
5-Aug
12-A
ug
19-A
ug
26-A
ug10.00%
12.00%
14.00%
16.00%
18.00%
20.00%
22.00%
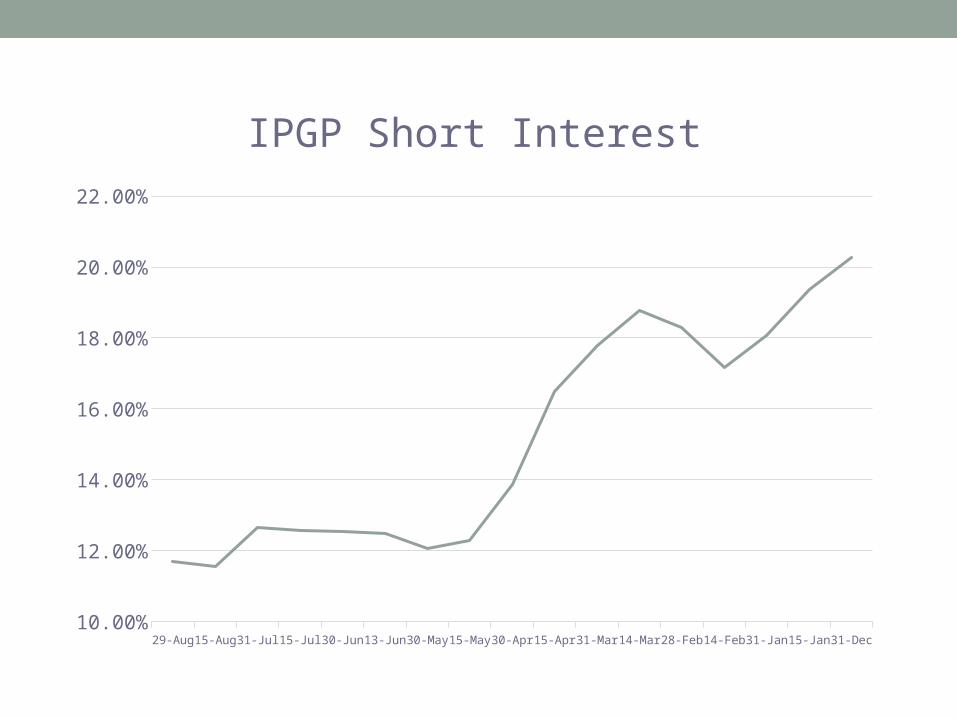
IPGP Short Interest
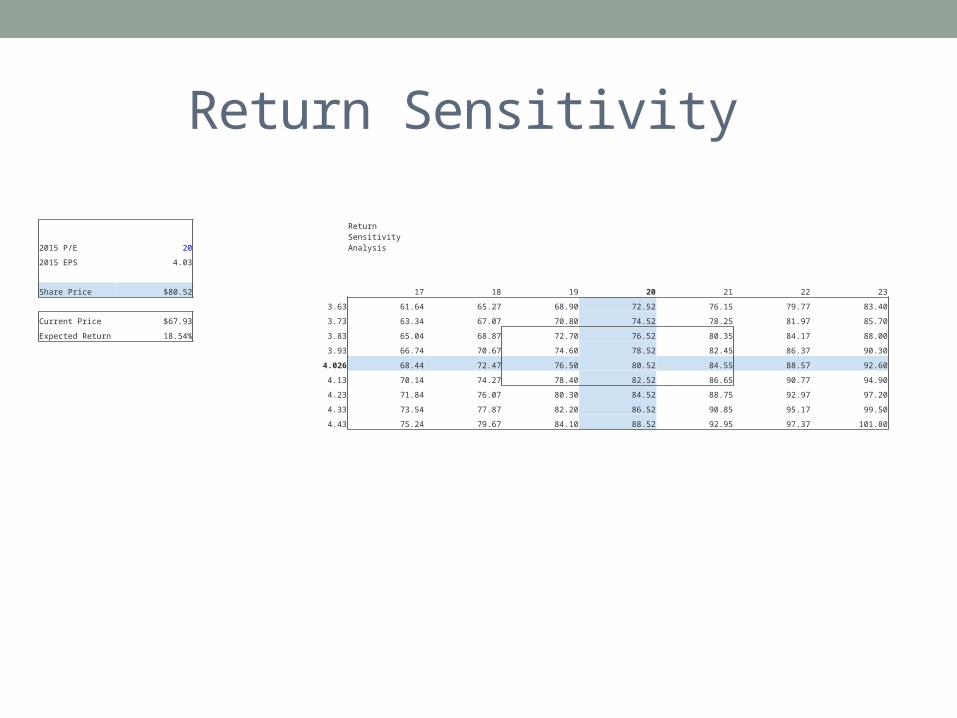
2015 P/E 20Return Sensitivity Analysis
2015 EPS 4.03
Share Price $80.52 17 18 19 20 21 22 23
3.63 61.64 65.27 68.90 72.52 76.15 79.77 83.40
Current Price $67.93 3.73 63.34 67.07 70.80 74.52 78.25 81.97 85.70
Expected Return 18.54% 3.83 65.04 68.87 72.70 76.52 80.35 84.17 88.00
3.93 66.74 70.67 74.60 78.52 82.45 86.37 90.30
4.026 68.44 72.47 76.50 80.52 84.55 88.57 92.60
4.13 70.14 74.27 78.40 82.52 86.65 90.77 94.90
4.23 71.84 76.07 80.30 84.52 88.75 92.97 97.20
4.33 73.54 77.87 82.20 86.52 90.85 95.17 99.50
4.43 75.24 79.67 84.10 88.52 92.95 97.37 101.80
Return Sensitivity
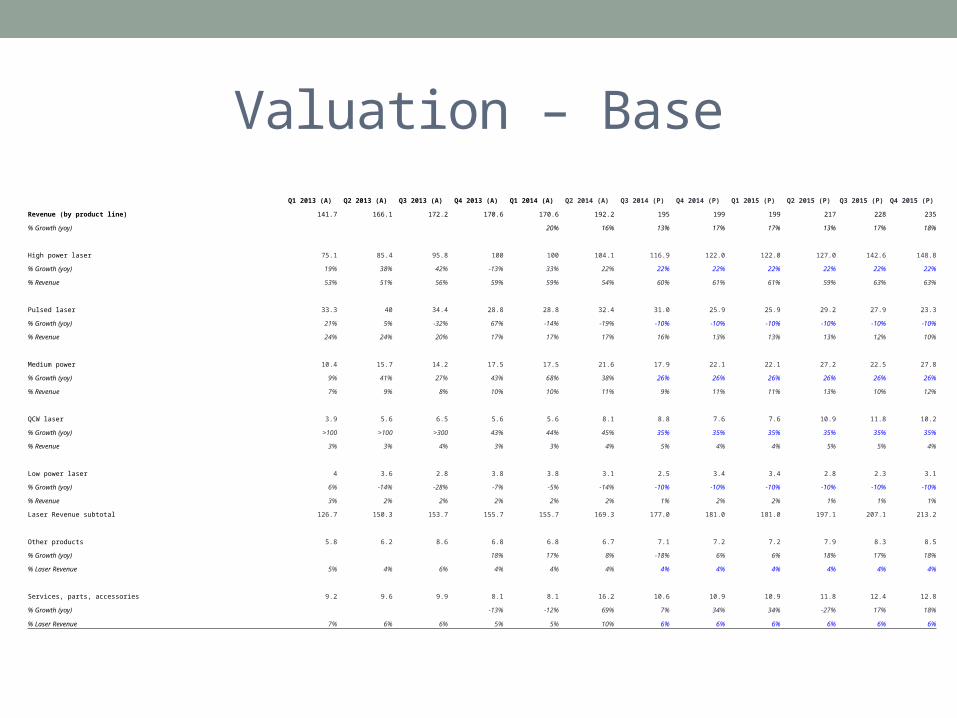
Valuation – Base Q1 2013 (A) Q2 2013 (A) Q3 2013 (A) Q4 2013 (A) Q1 2014 (A) Q2 2014 (A) Q3 2014 (P) Q4 2014 (P) Q1 2015 (P) Q2 2015 (P) Q3 2015 (P) Q4 2015 (P)
Revenue (by product line) 141.7 166.1 172.2 170.6 170.6 192.2 195 199 199 217 228 235
% Growth (yoy) 20% 16% 13% 17% 17% 13% 17% 18%
High power laser 75.1 85.4 95.8 100 100 104.1 116.9 122.0 122.0 127.0 142.6 148.8
% Growth (yoy) 19% 38% 42% -13% 33% 22% 22% 22% 22% 22% 22% 22%
% Revenue 53% 51% 56% 59% 59% 54% 60% 61% 61% 59% 63% 63%
Pulsed laser 33.3 40 34.4 28.8 28.8 32.4 31.0 25.9 25.9 29.2 27.9 23.3
% Growth (yoy) 21% 5% -32% 67% -14% -19% -10% -10% -10% -10% -10% -10%
% Revenue 24% 24% 20% 17% 17% 17% 16% 13% 13% 13% 12% 10%
Medium power 10.4 15.7 14.2 17.5 17.5 21.6 17.9 22.1 22.1 27.2 22.5 27.8
% Growth (yoy) 9% 41% 27% 43% 68% 38% 26% 26% 26% 26% 26% 26%
% Revenue 7% 9% 8% 10% 10% 11% 9% 11% 11% 13% 10% 12%
QCW laser 3.9 5.6 6.5 5.6 5.6 8.1 8.8 7.6 7.6 10.9 11.8 10.2
% Growth (yoy) >100 >100 >300 43% 44% 45% 35% 35% 35% 35% 35% 35%
% Revenue 3% 3% 4% 3% 3% 4% 5% 4% 4% 5% 5% 4%
Low power laser 4 3.6 2.8 3.8 3.8 3.1 2.5 3.4 3.4 2.8 2.3 3.1
% Growth (yoy) 6% -14% -28% -7% -5% -14% -10% -10% -10% -10% -10% -10%
% Revenue 3% 2% 2% 2% 2% 2% 1% 2% 2% 1% 1% 1%
Laser Revenue subtotal 126.7 150.3 153.7 155.7 155.7 169.3 177.0 181.0 181.0 197.1 207.1 213.2
Other products 5.8 6.2 8.6 6.8 6.8 6.7 7.1 7.2 7.2 7.9 8.3 8.5
% Growth (yoy) 18% 17% 8% -18% 6% 6% 18% 17% 18%
% Laser Revenue 5% 4% 6% 4% 4% 4% 4% 4% 4% 4% 4% 4%
Services, parts, accessories 9.2 9.6 9.9 8.1 8.1 16.2 10.6 10.9 10.9 11.8 12.4 12.8
% Growth (yoy) -13% -12% 69% 7% 34% 34% -27% 17% 18%
% Laser Revenue 7% 6% 6% 5% 5% 10% 6% 6% 6% 6% 6% 6%
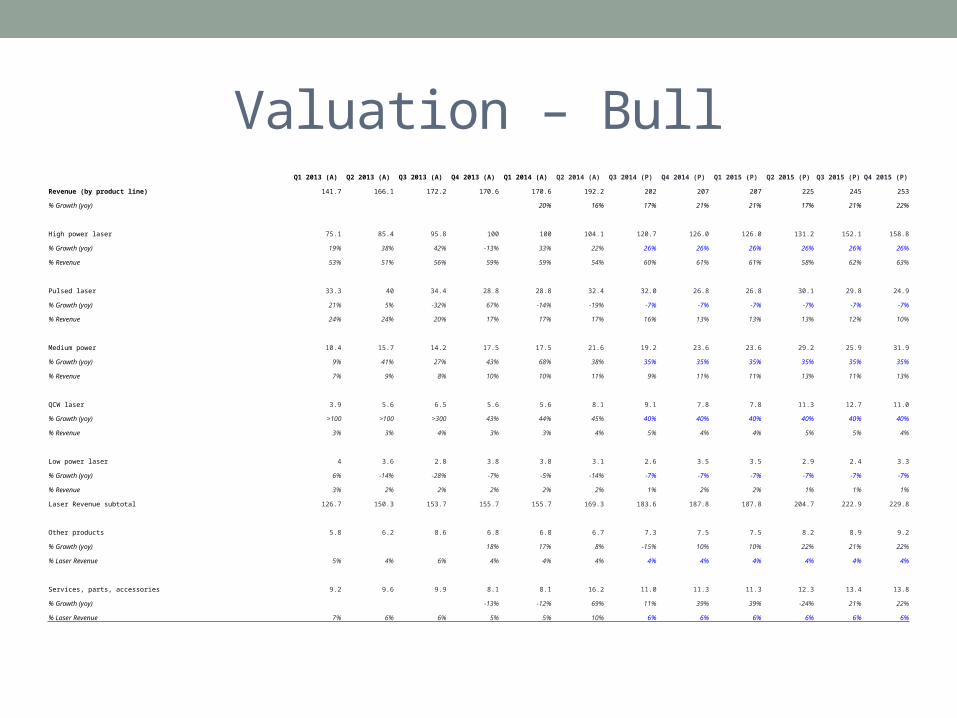
Valuation – Bull Q1 2013 (A) Q2 2013 (A) Q3 2013 (A) Q4 2013 (A) Q1 2014 (A) Q2 2014 (A) Q3 2014 (P) Q4 2014 (P) Q1 2015 (P) Q2 2015 (P) Q3 2015 (P) Q4 2015 (P)
Revenue (by product line) 141.7 166.1 172.2 170.6 170.6 192.2 202 207 207 225 245 253
% Growth (yoy) 20% 16% 17% 21% 21% 17% 21% 22%
High power laser 75.1 85.4 95.8 100 100 104.1 120.7 126.0 126.0 131.2 152.1 158.8
% Growth (yoy) 19% 38% 42% -13% 33% 22% 26% 26% 26% 26% 26% 26%
% Revenue 53% 51% 56% 59% 59% 54% 60% 61% 61% 58% 62% 63%
Pulsed laser 33.3 40 34.4 28.8 28.8 32.4 32.0 26.8 26.8 30.1 29.8 24.9
% Growth (yoy) 21% 5% -32% 67% -14% -19% -7% -7% -7% -7% -7% -7%
% Revenue 24% 24% 20% 17% 17% 17% 16% 13% 13% 13% 12% 10%
Medium power 10.4 15.7 14.2 17.5 17.5 21.6 19.2 23.6 23.6 29.2 25.9 31.9
% Growth (yoy) 9% 41% 27% 43% 68% 38% 35% 35% 35% 35% 35% 35%
% Revenue 7% 9% 8% 10% 10% 11% 9% 11% 11% 13% 11% 13%
QCW laser 3.9 5.6 6.5 5.6 5.6 8.1 9.1 7.8 7.8 11.3 12.7 11.0
% Growth (yoy) >100 >100 >300 43% 44% 45% 40% 40% 40% 40% 40% 40%
% Revenue 3% 3% 4% 3% 3% 4% 5% 4% 4% 5% 5% 4%
Low power laser 4 3.6 2.8 3.8 3.8 3.1 2.6 3.5 3.5 2.9 2.4 3.3
% Growth (yoy) 6% -14% -28% -7% -5% -14% -7% -7% -7% -7% -7% -7%
% Revenue 3% 2% 2% 2% 2% 2% 1% 2% 2% 1% 1% 1%
Laser Revenue subtotal 126.7 150.3 153.7 155.7 155.7 169.3 183.6 187.8 187.8 204.7 222.9 229.8
Other products 5.8 6.2 8.6 6.8 6.8 6.7 7.3 7.5 7.5 8.2 8.9 9.2
% Growth (yoy) 18% 17% 8% -15% 10% 10% 22% 21% 22%
% Laser Revenue 5% 4% 6% 4% 4% 4% 4% 4% 4% 4% 4% 4%
Services, parts, accessories 9.2 9.6 9.9 8.1 8.1 16.2 11.0 11.3 11.3 12.3 13.4 13.8
% Growth (yoy) -13% -12% 69% 11% 39% 39% -24% 21% 22%
% Laser Revenue 7% 6% 6% 5% 5% 10% 6% 6% 6% 6% 6% 6%
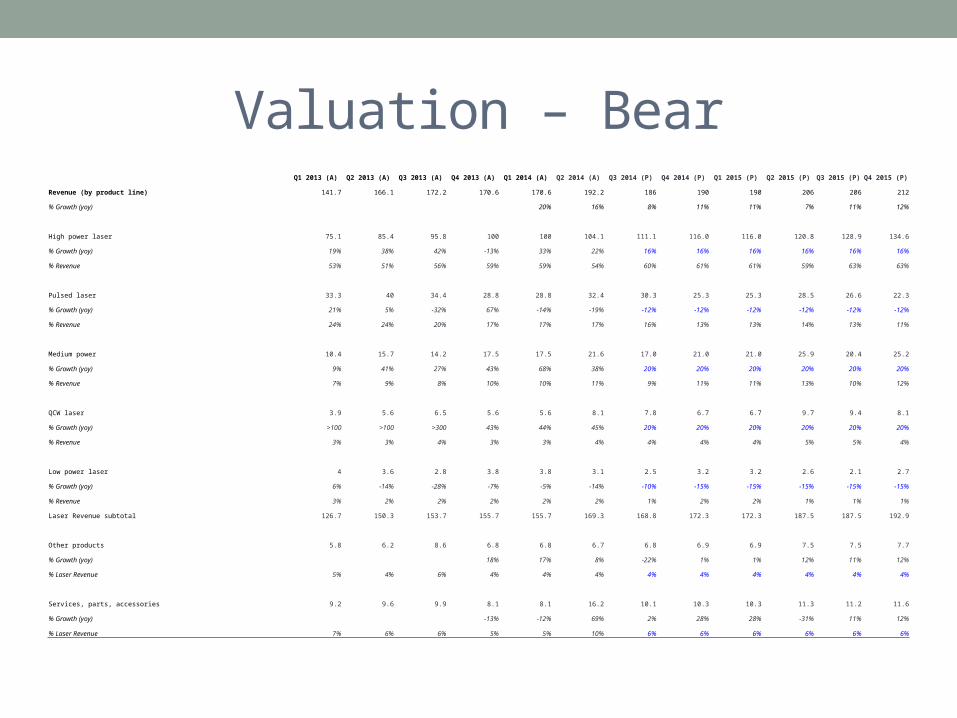
Valuation – Bear Q1 2013 (A) Q2 2013 (A) Q3 2013 (A) Q4 2013 (A) Q1 2014 (A) Q2 2014 (A) Q3 2014 (P) Q4 2014 (P) Q1 2015 (P) Q2 2015 (P) Q3 2015 (P) Q4 2015 (P)
Revenue (by product line) 141.7 166.1 172.2 170.6 170.6 192.2 186 190 190 206 206 212
% Growth (yoy) 20% 16% 8% 11% 11% 7% 11% 12%
High power laser 75.1 85.4 95.8 100 100 104.1 111.1 116.0 116.0 120.8 128.9 134.6
% Growth (yoy) 19% 38% 42% -13% 33% 22% 16% 16% 16% 16% 16% 16%
% Revenue 53% 51% 56% 59% 59% 54% 60% 61% 61% 59% 63% 63%
Pulsed laser 33.3 40 34.4 28.8 28.8 32.4 30.3 25.3 25.3 28.5 26.6 22.3
% Growth (yoy) 21% 5% -32% 67% -14% -19% -12% -12% -12% -12% -12% -12%
% Revenue 24% 24% 20% 17% 17% 17% 16% 13% 13% 14% 13% 11%
Medium power 10.4 15.7 14.2 17.5 17.5 21.6 17.0 21.0 21.0 25.9 20.4 25.2
% Growth (yoy) 9% 41% 27% 43% 68% 38% 20% 20% 20% 20% 20% 20%
% Revenue 7% 9% 8% 10% 10% 11% 9% 11% 11% 13% 10% 12%
QCW laser 3.9 5.6 6.5 5.6 5.6 8.1 7.8 6.7 6.7 9.7 9.4 8.1
% Growth (yoy) >100 >100 >300 43% 44% 45% 20% 20% 20% 20% 20% 20%
% Revenue 3% 3% 4% 3% 3% 4% 4% 4% 4% 5% 5% 4%
Low power laser 4 3.6 2.8 3.8 3.8 3.1 2.5 3.2 3.2 2.6 2.1 2.7
% Growth (yoy) 6% -14% -28% -7% -5% -14% -10% -15% -15% -15% -15% -15%
% Revenue 3% 2% 2% 2% 2% 2% 1% 2% 2% 1% 1% 1%
Laser Revenue subtotal 126.7 150.3 153.7 155.7 155.7 169.3 168.8 172.3 172.3 187.5 187.5 192.9
Other products 5.8 6.2 8.6 6.8 6.8 6.7 6.8 6.9 6.9 7.5 7.5 7.7
% Growth (yoy) 18% 17% 8% -22% 1% 1% 12% 11% 12%
% Laser Revenue 5% 4% 6% 4% 4% 4% 4% 4% 4% 4% 4% 4%
Services, parts, accessories 9.2 9.6 9.9 8.1 8.1 16.2 10.1 10.3 10.3 11.3 11.2 11.6
% Growth (yoy) -13% -12% 69% 2% 28% 28% -31% 11% 12%
% Laser Revenue 7% 6% 6% 5% 5% 10% 6% 6% 6% 6% 6% 6%
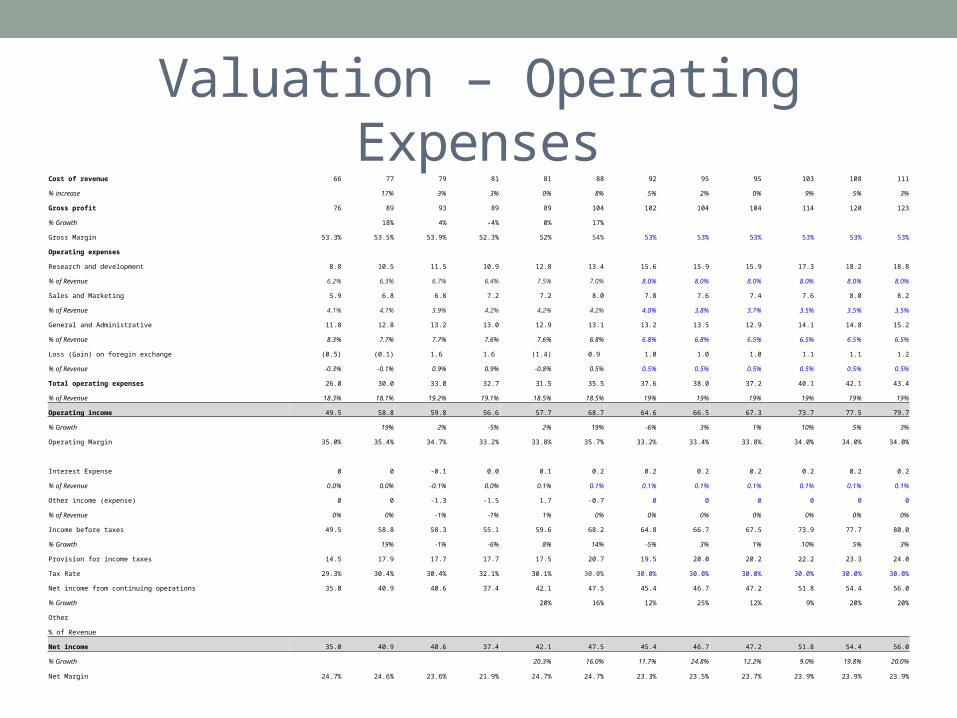
Valuation – Operating ExpensesCost of revenue 66 77 79 81 81 88 92 95 95 103 108 111
% increase 17% 3% 3% 0% 8% 5% 2% 0% 9% 5% 3%
Gross profit 76 89 93 89 89 104 102 104 104 114 120 123
% Growth 18% 4% -4% 0% 17%
Gross Margin 53.3% 53.5% 53.9% 52.3% 52% 54% 53% 53% 53% 53% 53% 53%
Operating expenses
Research and development 8.8 10.5 11.5 10.9 12.8 13.4 15.6 15.9 15.9 17.3 18.2 18.8
% of Revenue 6.2% 6.3% 6.7% 6.4% 7.5% 7.0% 8.0% 8.0% 8.0% 8.0% 8.0% 8.0%
Sales and Marketing 5.9 6.8 6.8 7.2 7.2 8.0 7.8 7.6 7.4 7.6 8.0 8.2
% of Revenue 4.1% 4.1% 3.9% 4.2% 4.2% 4.2% 4.0% 3.8% 3.7% 3.5% 3.5% 3.5%
General and Administrative 11.8 12.8 13.2 13.0 12.9 13.1 13.2 13.5 12.9 14.1 14.8 15.2
% of Revenue 8.3% 7.7% 7.7% 7.6% 7.6% 6.8% 6.8% 6.8% 6.5% 6.5% 6.5% 6.5%
Loss (Gain) on foregin exchange (0.5) (0.1) 1.6 1.6 (1.4) 0.9 1.0 1.0 1.0 1.1 1.1 1.2
% of Revenue -0.3% -0.1% 0.9% 0.9% -0.8% 0.5% 0.5% 0.5% 0.5% 0.5% 0.5% 0.5%
Total operating expenses 26.0 30.0 33.0 32.7 31.5 35.5 37.6 38.0 37.2 40.1 42.1 43.4
% of Revenue 18.3% 18.1% 19.2% 19.1% 18.5% 18.5% 19% 19% 19% 19% 19% 19%
Operating income 49.5 58.8 59.8 56.6 57.7 68.7 64.6 66.5 67.3 73.7 77.5 79.7
% Growth 19% 2% -5% 2% 19% -6% 3% 1% 10% 5% 3%
Operating Margin 35.0% 35.4% 34.7% 33.2% 33.8% 35.7% 33.2% 33.4% 33.8% 34.0% 34.0% 34.0%
Interest Expense 0 0 -0.1 0.0 0.1 0.2 0.2 0.2 0.2 0.2 0.2 0.2
% of Revenue 0.0% 0.0% -0.1% 0.0% 0.1% 0.1% 0.1% 0.1% 0.1% 0.1% 0.1% 0.1%
Other income (expense) 0 0 -1.3 -1.5 1.7 -0.7 0 0 0 0 0 0
% of Revenue 0% 0% -1% -1% 1% 0% 0% 0% 0% 0% 0% 0%
Income before taxes 49.5 58.8 58.3 55.1 59.6 68.2 64.8 66.7 67.5 73.9 77.7 80.0
% Growth 19% -1% -6% 8% 14% -5% 3% 1% 10% 5% 3%
Provision for income taxes 14.5 17.9 17.7 17.7 17.5 20.7 19.5 20.0 20.2 22.2 23.3 24.0
Tax Rate 29.3% 30.4% 30.4% 32.1% 30.1% 30.0% 30.0% 30.0% 30.0% 30.0% 30.0% 30.0%
Net income from continuing operations 35.0 40.9 40.6 37.4 42.1 47.5 45.4 46.7 47.2 51.8 54.4 56.0
% Growth 20% 16% 12% 25% 12% 9% 20% 20%
Other
% of Revenue
Net income 35.0 40.9 40.6 37.4 42.1 47.5 45.4 46.7 47.2 51.8 54.4 56.0
% Growth 20.3% 16.0% 11.7% 24.8% 12.2% 9.0% 19.8% 20.0%
Net Margin 24.7% 24.6% 23.6% 21.9% 24.7% 24.7% 23.3% 23.5% 23.7% 23.9% 23.9% 23.9%
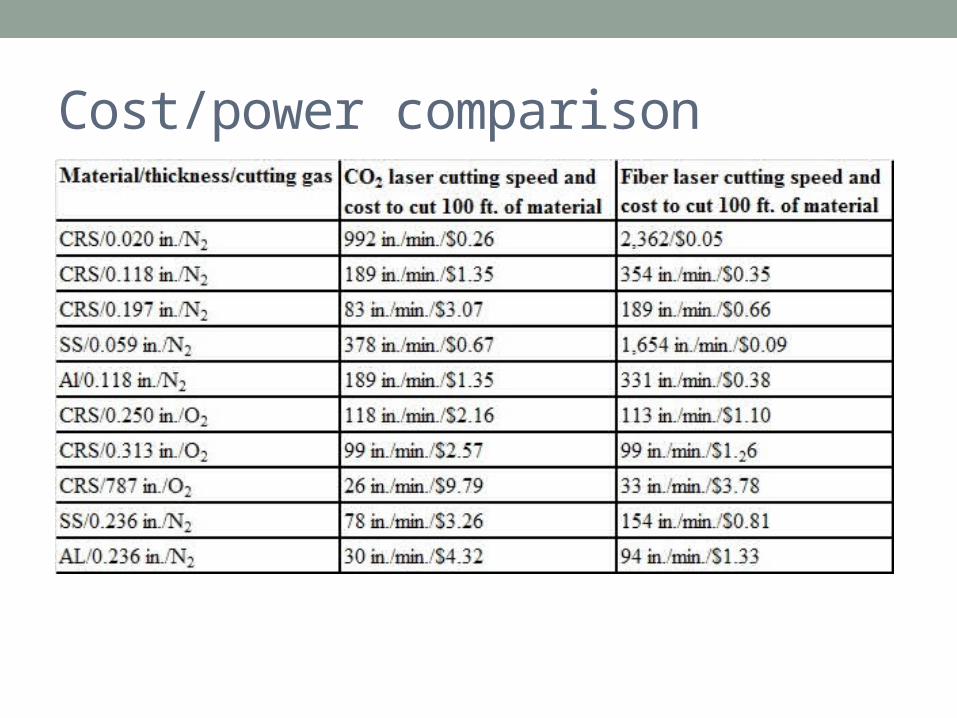
Cost/power comparison


![Yosha - Abordagem Natural&Direta Em Cidades [PUABASE]](https://img.pdfslide.net/doc/110x75/56d6c01d1a28ab3016990165/yosha-abordagem-naturaldireta-em-cidades-puabase.jpg)


