Embed Size (px)
Citation preview
Page 1 of 23
iPhone Gyro Function Generates Detailed Data Of Road Conditions For Accident Analysis
Posting Date: 25-Feb 2014
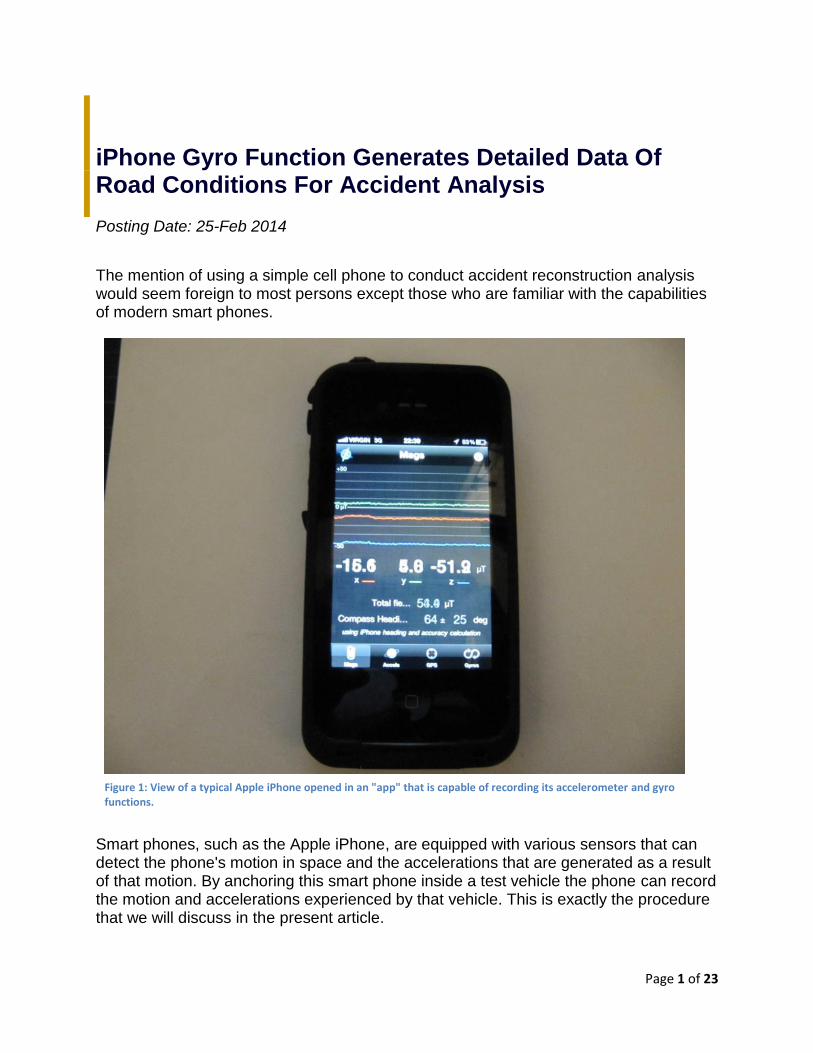
The mention of using a simple cell phone to conduct accident reconstruction analysis would seem foreign to most persons except those who are familiar with the capabilities of modern smart phones.
Smart phones, such as the Apple iPhone, are equipped with various sensors that can detect the phone's motion in space and the accelerations that are generated as a result of that motion. By anchoring this smart phone inside a test vehicle the phone can record the motion and accelerations experienced by that vehicle. This is exactly the procedure that we will discuss in the present article.
Figure 1: View of a typical Apple iPhone opened in an "app" that is capable of recording its accelerometer and gyro functions.
Page 2 of 23
Introduction
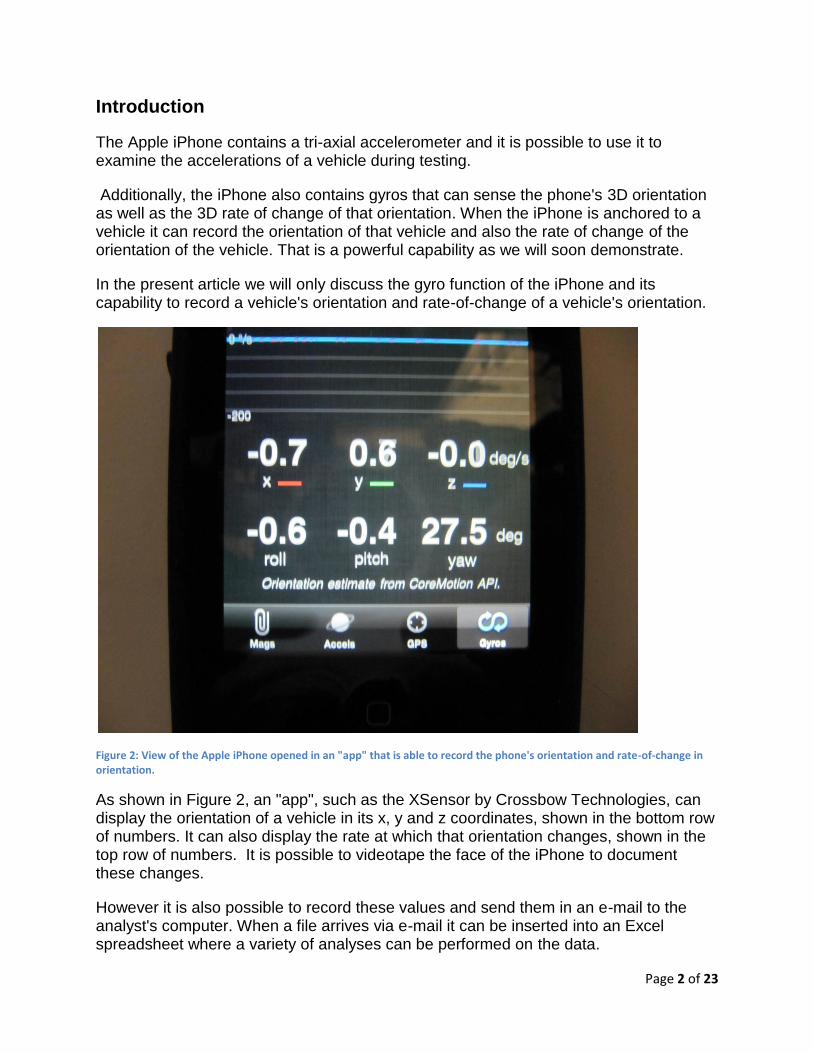
The Apple iPhone contains a tri-axial accelerometer and it is possible to use it to examine the accelerations of a vehicle during testing.
Additionally, the iPhone also contains gyros that can sense the phone's 3D orientation as well as the 3D rate of change of that orientation. When the iPhone is anchored to a vehicle it can record the orientation of that vehicle and also the rate of change of the orientation of the vehicle. That is a powerful capability as we will soon demonstrate.
In the present article we will only discuss the gyro function of the iPhone and its capability to record a vehicle's orientation and rate-of-change of a vehicle's orientation.
Figure 2: View of the Apple iPhone opened in an "app" that is able to record the phone's orientation and rate-of-change in orientation.
As shown in Figure 2, an "app", such as the XSensor by Crossbow Technologies, can display the orientation of a vehicle in its x, y and z coordinates, shown in the bottom row of numbers. It can also display the rate at which that orientation changes, shown in the top row of numbers. It is possible to videotape the face of the iPhone to document these changes.
However it is also possible to record these values and send them in an e-mail to the analyst's computer. When a file arrives via e-mail it can be inserted into an Excel spreadsheet where a variety of analyses can be performed on the data.
Page 3 of 23
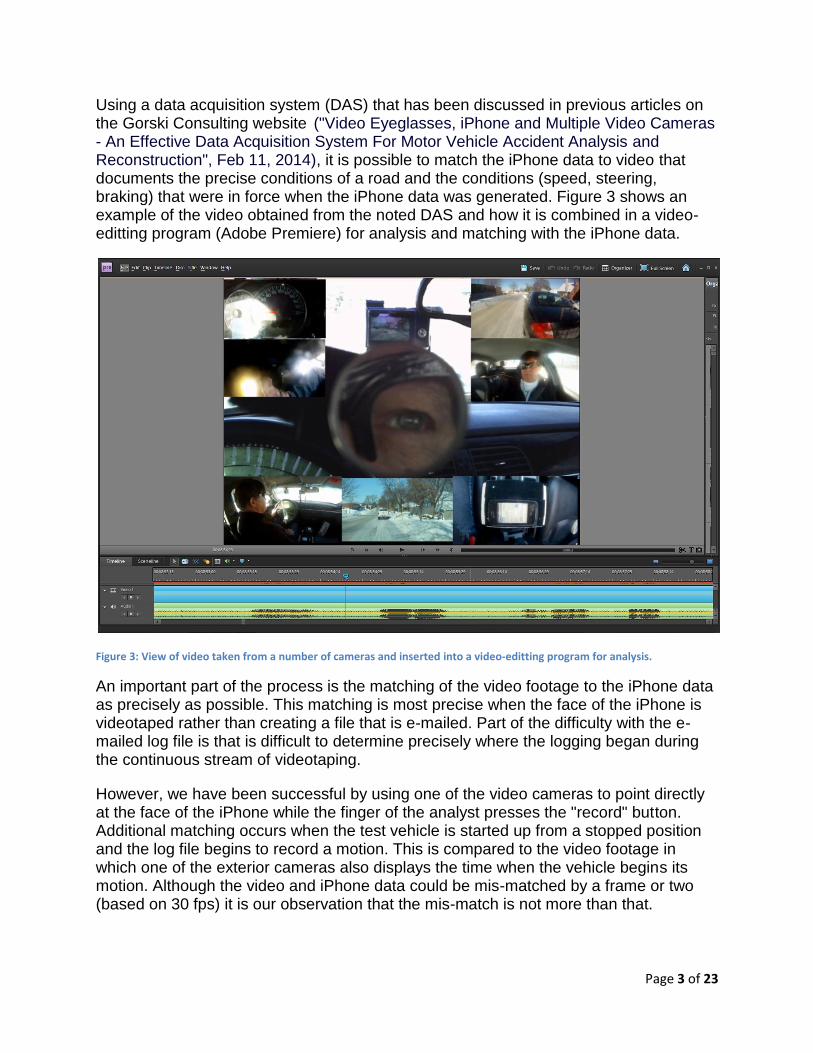
Using a data acquisition system (DAS) that has been discussed in previous articles on the Gorski Consulting website ("Video Eyeglasses, iPhone and Multiple Video Cameras - An Effective Data Acquisition System For Motor Vehicle Accident Analysis and Reconstruction", Feb 11, 2014), it is possible to match the iPhone data to video that documents the precise conditions of a road and the conditions (speed, steering, braking) that were in force when the iPhone data was generated. Figure 3 shows an example of the video obtained from the noted DAS and how it is combined in a video-editting program (Adobe Premiere) for analysis and matching with the iPhone data.
Figure 3: View of video taken from a number of cameras and inserted into a video-editting program for analysis.
An important part of the process is the matching of the video footage to the iPhone data as precisely as possible. This matching is most precise when the face of the iPhone is videotaped rather than creating a file that is e-mailed. Part of the difficulty with the e-mailed log file is that is difficult to determine precisely where the logging began during the continuous stream of videotaping.
However, we have been successful by using one of the video cameras to point directly at the face of the iPhone while the finger of the analyst presses the "record" button. Additional matching occurs when the test vehicle is started up from a stopped position and the log file begins to record a motion. This is compared to the video footage in which one of the exterior cameras also displays the time when the vehicle begins its motion. Although the video and iPhone data could be mis-matched by a frame or two (based on 30 fps) it is our observation that the mis-match is not more than that.

Page 4 of 23
Testing Procedure
Combining the multiple video cameras of the DAS and iPhone data logging, we performed a variety of test drives on various roads within the City of London, Ontario, Canada as well as highways outside of the City within about a 1 hour radius. Although the iPhone records the values of six parameters, for simplicity we have chosen to focus on only two, the rate of change in the lateral and longitudinal orientation of the vehicle.
We have selected a particular section of road in our study because of its severe conditions to demonstrate how the iPhone can differentiate between "good" and "bad" roads. The "bad" road that was chosen was Sunningdale Road which is an east/west road on the north edge of the City of London (See Figure 4).
Figure 4: View of testing location on Sunningdale Road between Highbury Avenue and Clarke Road in London, Ontario. The specific location where the iPhone data was collected is identified by the orange circle.
We became aware of the poor surface conditions of Sunningdale Road in 2010 when, driving upon it, we observed our vehicle being bounced up and down in a vigorous fashion even though we were not travelling at the maximum posted speed of 80 km/h. Our explorations revealed that in wintertime the surface experienced a severe flexing, collapse and expansion likely due to the high water table and freezing that took place beneath the surface. In warmer conditions the surface would relax back to a relatively even condition. The conditions were so dire that school buses that used the road on a daily basis in winter months were forced to travel at speeds of 40 or 50 km/h while their stiff suspensions still caused the rear of the buses to be propelled dangerously upward. Figures 5 to 7 show the conditions of the road in February, 2011 when observations of these school buses were made.

Page 5 of 23
Figure 5: Example of severe ruptures in road surface of Sunningdale Road from February, 2011.
Figure 6: Close-up view of ruptured road surface on Sunningdale Road in 2011.
Page 6 of 23
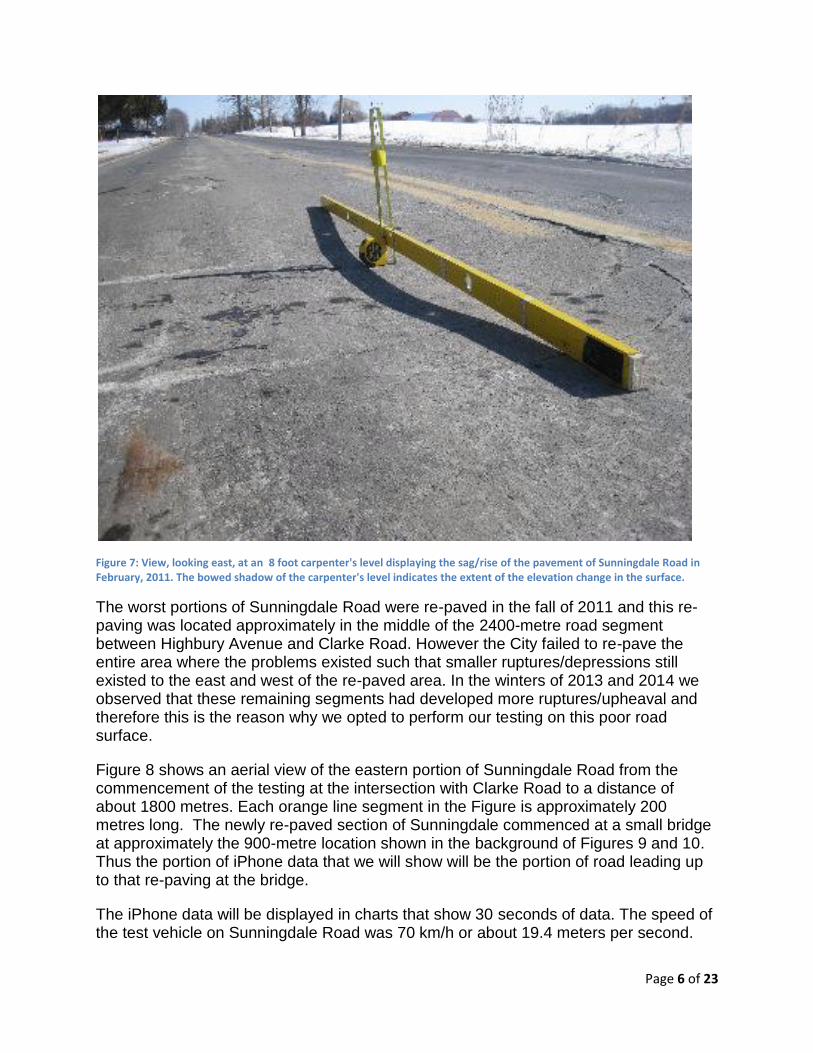
Figure 7: View, looking east, at an 8 foot carpenter's level displaying the sag/rise of the pavement of Sunningdale Road in February, 2011. The bowed shadow of the carpenter's level indicates the extent of the elevation change in the surface.
The worst portions of Sunningdale Road were re-paved in the fall of 2011 and this re-paving was located approximately in the middle of the 2400-metre road segment between Highbury Avenue and Clarke Road. However the City failed to re-pave the entire area where the problems existed such that smaller ruptures/depressions still existed to the east and west of the re-paved area. In the winters of 2013 and 2014 we observed that these remaining segments had developed more ruptures/upheaval and therefore this is the reason why we opted to perform our testing on this poor road surface.
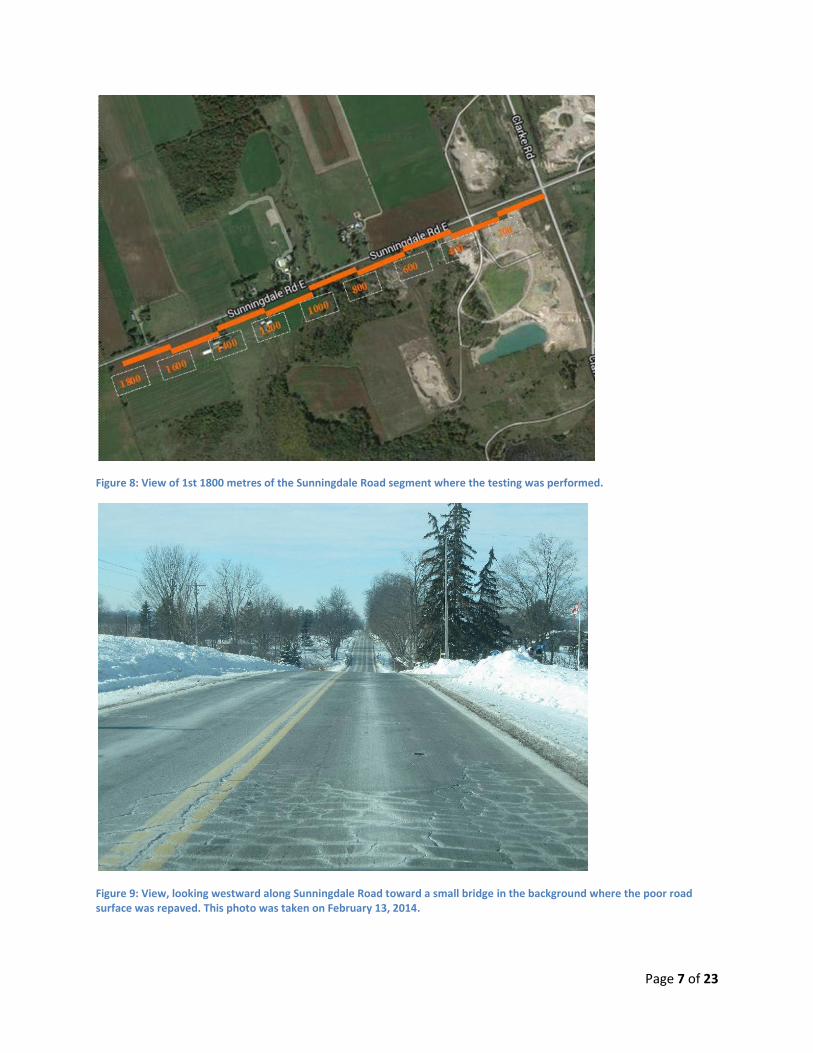
Figure 8 shows an aerial view of the eastern portion of Sunningdale Road from the commencement of the testing at the intersection with Clarke Road to a distance of about 1800 metres. Each orange line segment in the Figure is approximately 200 metres long. The newly re-paved section of Sunningdale commenced at a small bridge at approximately the 900-metre location shown in the background of Figures 9 and 10. Thus the portion of iPhone data that we will show will be the portion of road leading up to that re-paving at the bridge.
The iPhone data will be displayed in charts that show 30 seconds of data. The speed of the test vehicle on Sunningdale Road was 70 km/h or about 19.4 meters per second.
Page 7 of 23
Figure 8: View of 1st 1800 metres of the Sunningdale Road segment where the testing was performed.
Figure 9: View, looking westward along Sunningdale Road toward a small bridge in the background where the poor road surface was repaved. This photo was taken on February 13, 2014.
Page 8 of 23
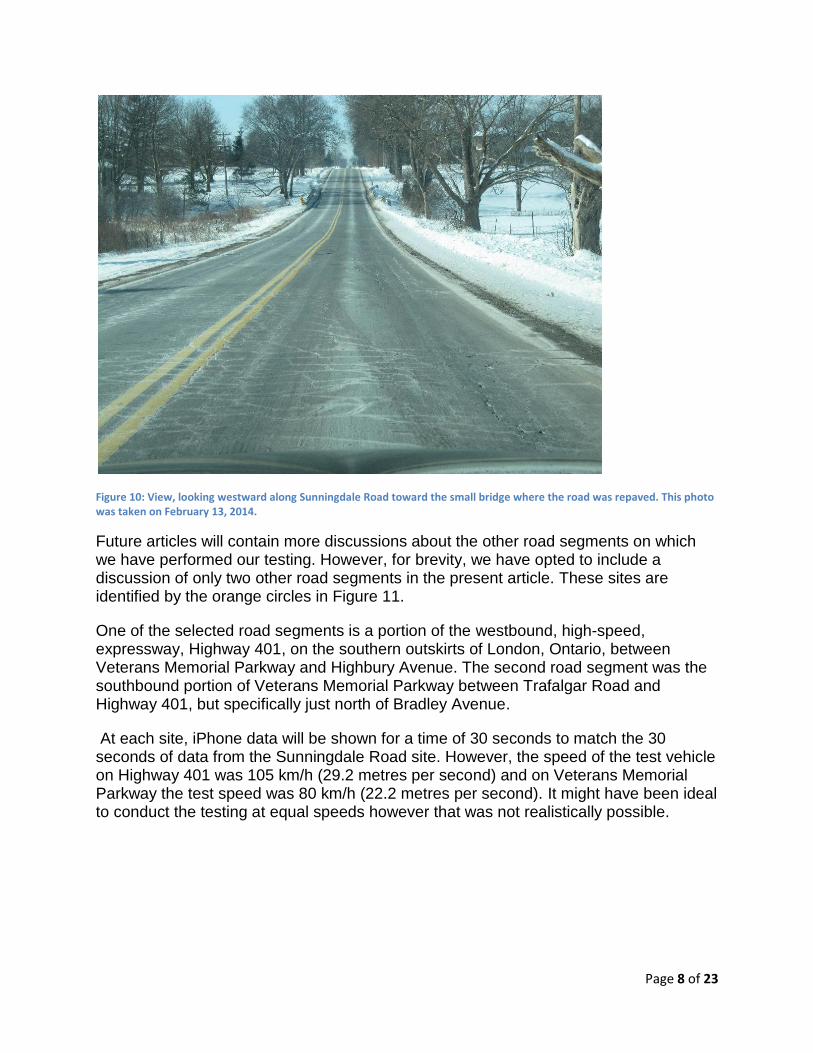
Figure 10: View, looking westward along Sunningdale Road toward the small bridge where the road was repaved. This photo was taken on February 13, 2014.
Future articles will contain more discussions about the other road segments on which we have performed our testing. However, for brevity, we have opted to include a discussion of only two other road segments in the present article. These sites are identified by the orange circles in Figure 11.
One of the selected road segments is a portion of the westbound, high-speed, expressway, Highway 401, on the southern outskirts of London, Ontario, between Veterans Memorial Parkway and Highbury Avenue. The second road segment was the southbound portion of Veterans Memorial Parkway between Trafalgar Road and Highway 401, but specifically just north of Bradley Avenue.
At each site, iPhone data will be shown for a time of 30 seconds to match the 30 seconds of data from the Sunningdale Road site. However, the speed of the test vehicle on Highway 401 was 105 km/h (29.2 metres per second) and on Veterans Memorial Parkway the test speed was 80 km/h (22.2 metres per second). It might have been ideal to conduct the testing at equal speeds however that was not realistically possible.
Page 9 of 23
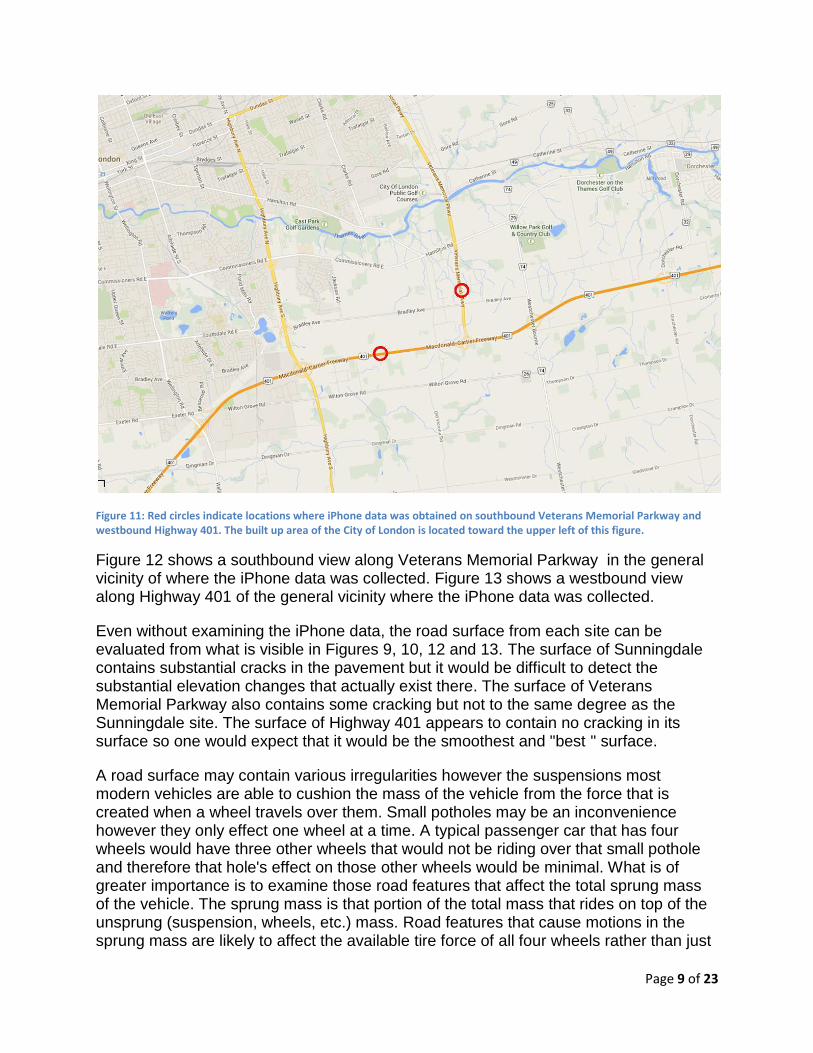
Figure 11: Red circles indicate locations where iPhone data was obtained on southbound Veterans Memorial Parkway and westbound Highway 401. The built up area of the City of London is located toward the upper left of this figure.
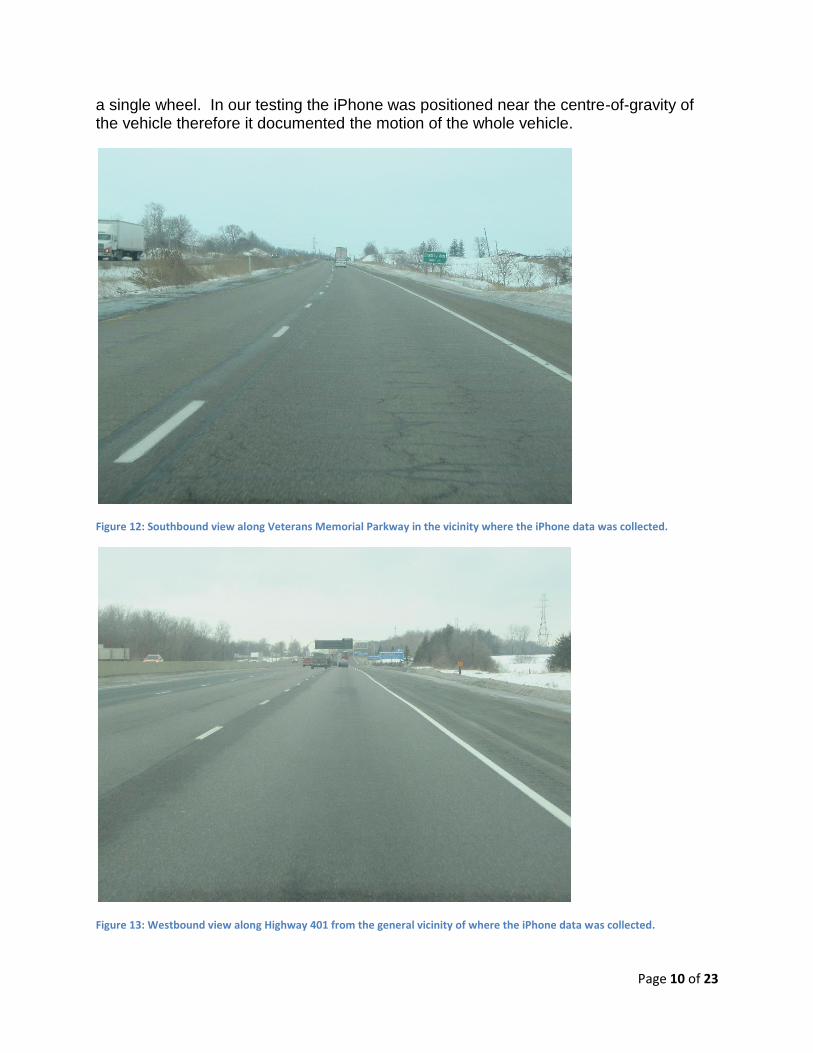
Figure 12 shows a southbound view along Veterans Memorial Parkway in the general vicinity of where the iPhone data was collected. Figure 13 shows a westbound view along Highway 401 of the general vicinity where the iPhone data was collected.
Even without examining the iPhone data, the road surface from each site can be evaluated from what is visible in Figures 9, 10, 12 and 13. The surface of Sunningdale contains substantial cracks in the pavement but it would be difficult to detect the substantial elevation changes that actually exist there. The surface of Veterans Memorial Parkway also contains some cracking but not to the same degree as the Sunningdale site. The surface of Highway 401 appears to contain no cracking in its surface so one would expect that it would be the smoothest and "best " surface.
A road surface may contain various irregularities however the suspensions most modern vehicles are able to cushion the mass of the vehicle from the force that is created when a wheel travels over them. Small potholes may be an inconvenience however they only effect one wheel at a time. A typical passenger car that has four wheels would have three other wheels that would not be riding over that small pothole and therefore that hole's effect on those other wheels would be minimal. What is of greater importance is to examine those road features that affect the total sprung mass of the vehicle. The sprung mass is that portion of the total mass that rides on top of the unsprung (suspension, wheels, etc.) mass. Road features that cause motions in the sprung mass are likely to affect the available tire force of all four wheels rather than just
Page 10 of 23
a single wheel. In our testing the iPhone was positioned near the centre-of-gravity of the vehicle therefore it documented the motion of the whole vehicle.
Figure 12: Southbound view along Veterans Memorial Parkway in the vicinity where the iPhone data was collected.
Figure 13: Westbound view along Highway 401 from the general vicinity of where the iPhone data was collected.

Page 11 of 23
Results of Testing
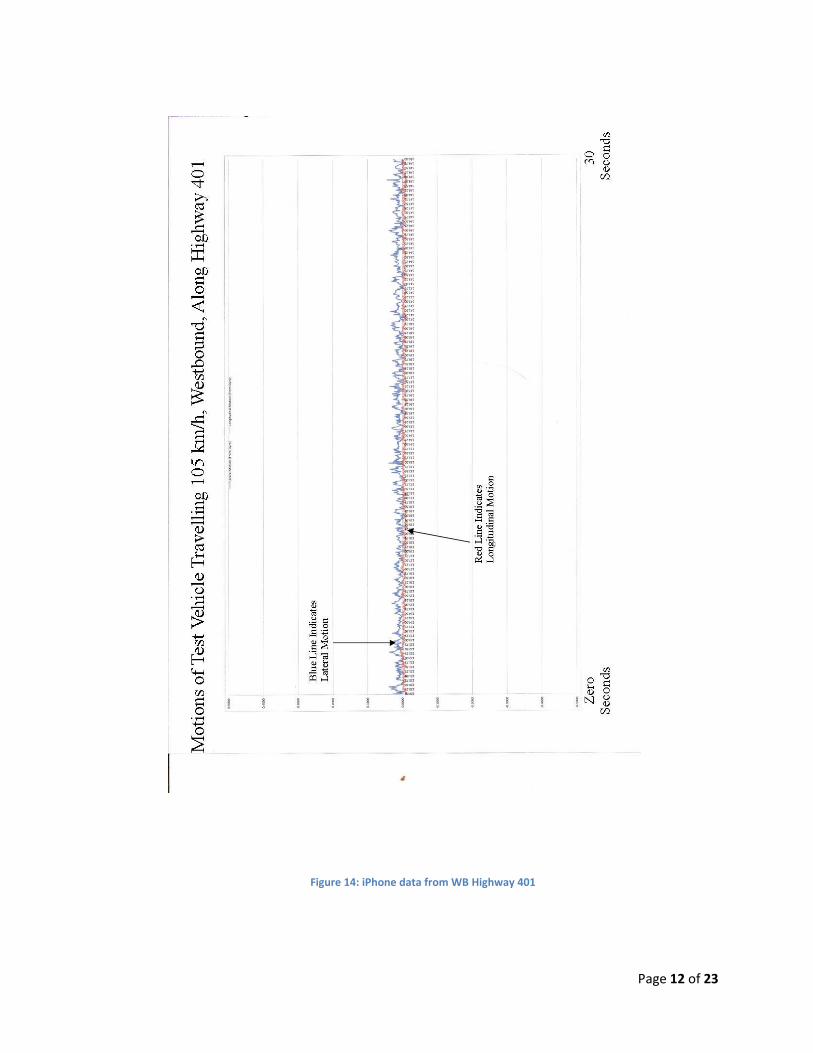
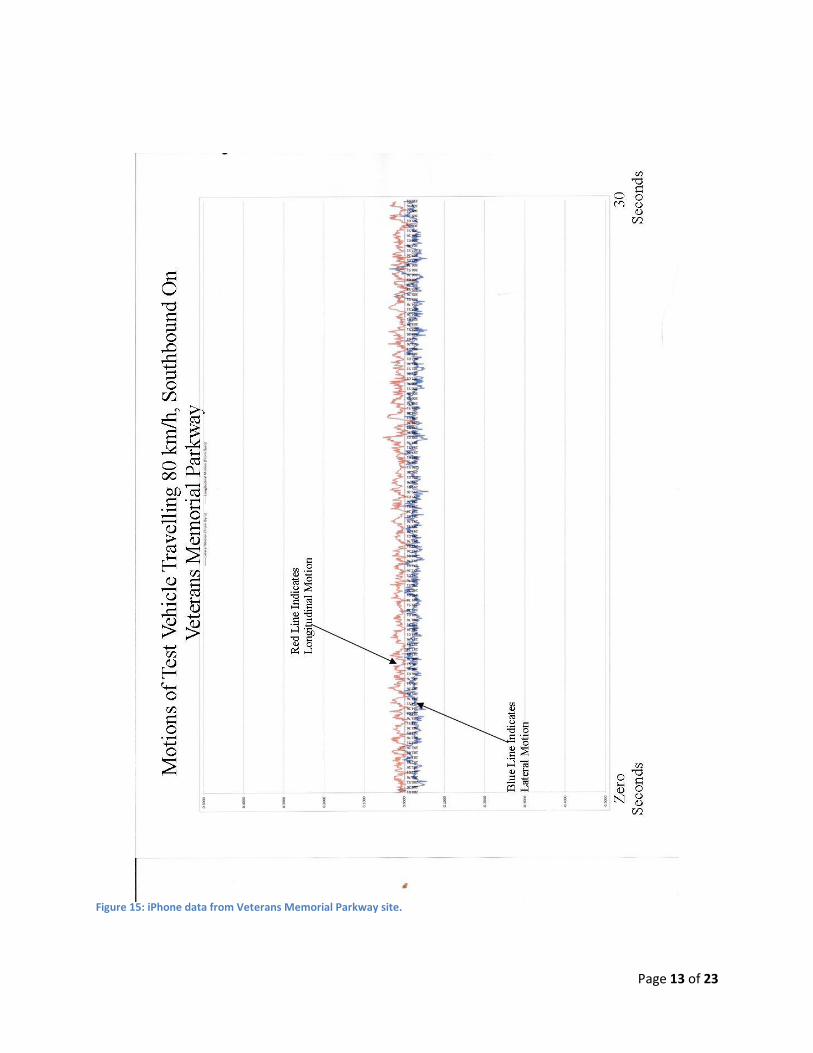
Figures 14, 15 and 16 contain the charts that were generated from the iPhone data. Each chart contains the data from the rate-of-change in the lateral and longitudinal angle of the vehicle.
In other words, the rate-of-change in the "lateral motion" (blue line) of the vehicle tells us how quickly the vehicle is being jostled from side-to-side so that, at one point, the left side of the vehicle might fall closer to the pavement while the right side might be lifted so that the vehicle is on a non-horizontal, side-ways, angle. The rate at which this lateral angle of the vehicle changes is what is reported in the charts.
Similarly the "longitudinal motion" (red line) indicates how quickly the front/rear angle of the vehicle is changing. In other words, the front end may be lifted up while the rear end might be dropped toward the pavement creating a non horizontal angle of the vehicle.
The data is expressed in radians per second. One radian is equal to 57.3 degrees. So, if the indicated value is 0.01 radians per second then this translates to about 0.57 degrees per second, and if the value is 0.05 radians per second then this translates to about 2.87 degrees per second.
The vertical scale in the charts is difficult to see however its range is from 0.5 radians to -0.5 radians, and the horizontal lines are at 0.1 radian increments.
In Figure 14 we see the data from the site on Highway 401, over a time of 30 seconds. The chart indicates that the blue and red lines consistently stay close to zero so the rates of lateral and longitudinal motion are relatively small.
Figure 15 shows the data from the Veterans Memorial Parkway site. This shows that both the rates of lateral and longitudinal motion have increased in comparison to the Highway 401 site but they are still relatively small.
Figure 16 shows the data from the Sunningdale Road site and clearly we see a substantial difference from the other two sites. Both the blue and red lines are showing large deviations from zero meaning that the rate at which the angle of the test vehicle is changing from side to side and forward/back is high throughout the 30 seconds of testing but also at variable occasions the rate-of-change spikes to very high values.
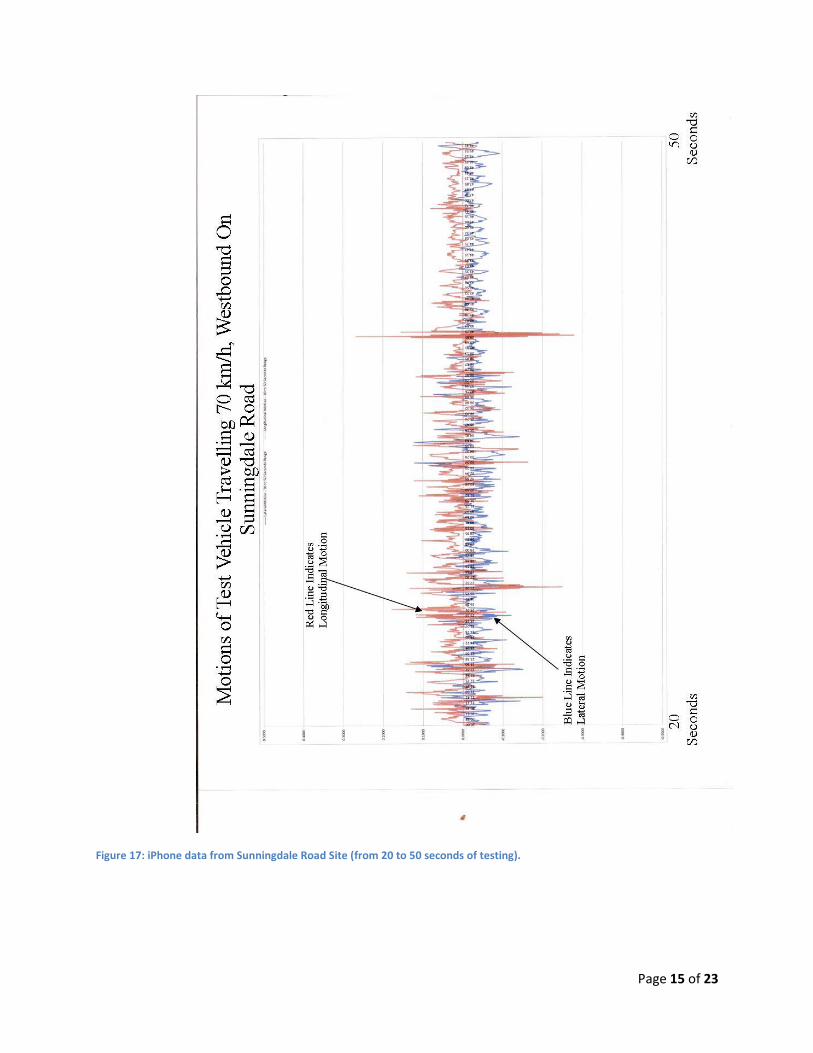
As a further comparison, we decided to include a fourth chart in Figure 17 which shows the Sunningdale data from a time of 20 to 50 seconds. So there is an overlap of 10 seconds of data in Figures 16 and 17.This has been done because, at a time of about 40.5 seconds the westbound test vehicle crosses over from the old, uneven road surface to the newly repaved surface. This takes place at about 2/3rds along the chart of Figure 17. The difference in the data is obvious as the magnitude of the rate-of- change is smaller when the vehicle enters the newly paved surface. However the rate-of-change is still obviously higher on the newly paved surface of Sunningdale Road than either of the two other sites of Highway 401 and Veterans Memorial Parkway.
Page 12 of 23
Figure 14: iPhone data from WB Highway 401
Page 13 of 23
Figure 15: iPhone data from Veterans Memorial Parkway site.

Page 14 of 23
Figure 16: iPhone data from Sunningdale Road Site (1st 30 seconds of testing)
Page 15 of 23
Figure 17: iPhone data from Sunningdale Road Site (from 20 to 50 seconds of testing).
Page 16 of 23
Discussion
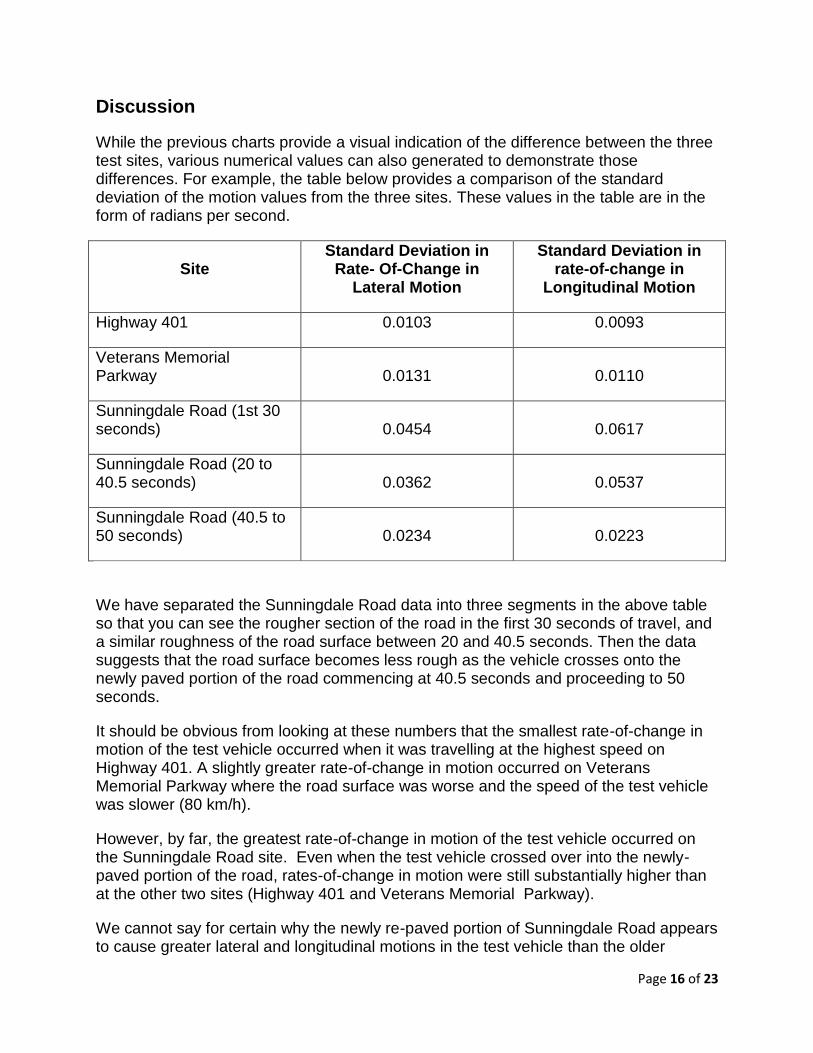
While the previous charts provide a visual indication of the difference between the three test sites, various numerical values can also generated to demonstrate those differences. For example, the table below provides a comparison of the standard deviation of the motion values from the three sites. These values in the table are in the form of radians per second.
Site Standard Deviation in
Rate- Of-Change in Lateral Motion
Standard Deviation in rate-of-change in
Longitudinal Motion
Highway 401 0.0103 0.0093
Veterans Memorial Parkway 0.0131 0.0110
Sunningdale Road (1st 30 seconds) 0.0454 0.0617
Sunningdale Road (20 to 40.5 seconds) 0.0362 0.0537
Sunningdale Road (40.5 to 50 seconds) 0.0234 0.0223
We have separated the Sunningdale Road data into three segments in the above table so that you can see the rougher section of the road in the first 30 seconds of travel, and a similar roughness of the road surface between 20 and 40.5 seconds. Then the data suggests that the road surface becomes less rough as the vehicle crosses onto the newly paved portion of the road commencing at 40.5 seconds and proceeding to 50 seconds.
It should be obvious from looking at these numbers that the smallest rate-of-change in motion of the test vehicle occurred when it was travelling at the highest speed on Highway 401. A slightly greater rate-of-change in motion occurred on Veterans Memorial Parkway where the road surface was worse and the speed of the test vehicle was slower (80 km/h).
However, by far, the greatest rate-of-change in motion of the test vehicle occurred on the Sunningdale Road site. Even when the test vehicle crossed over into the newly-paved portion of the road, rates-of-change in motion were still substantially higher than at the other two sites (Highway 401 and Veterans Memorial Parkway).
We cannot say for certain why the newly re-paved portion of Sunningdale Road appears to cause greater lateral and longitudinal motions in the test vehicle than the older

Page 17 of 23
surfaces on Highway 401 or Veterans Memorial Parkway. One might wonder if perhaps there is something wrong with the data. Alternatively, the amount of data that is shown ( 40.5 to 50 seconds) on the newly-paved surface is limited. At the travel speed of 70 km/h (19.4 metres per second) the test vehicle only travelled about 185 metres on this surface. We have conducted a number of other tests on the newly-paved surface however this data has not been analyzed yet.
There is a possibility that the suggested poor quality of the newly-paved surface of Sunningdale Road is genuine. We state this because of what we observed recently while travelling through that surface.
We observed some unusual conditions on the newly paved portion of Sunningdale Road so on February 20th, 2014 we stopped on the north roadside, as shown in Figure 18, and took a closer look.
Figure 18: View of our vehicle stopped on the north roadside of Sunningdale Road, along the newly paved section of the road.
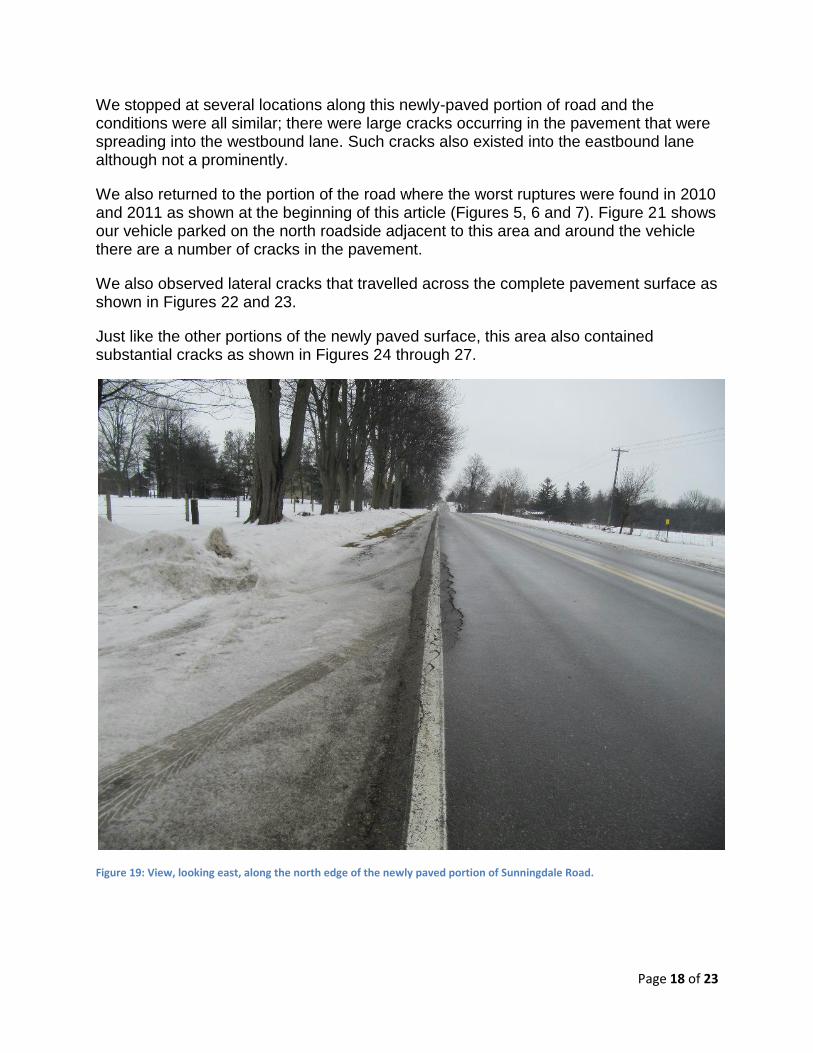
Looking back from the position of our parked vehicle you can see some unusual cracks near the edge of the pavement. Figures 19 and 20 provide closer views of those cracks. The cracks being shown are not just minor, they are deep and travel through the complete thickness of the newly applied asphalt.
Page 18 of 23
We stopped at several locations along this newly-paved portion of road and the conditions were all similar; there were large cracks occurring in the pavement that were spreading into the westbound lane. Such cracks also existed into the eastbound lane although not a prominently.
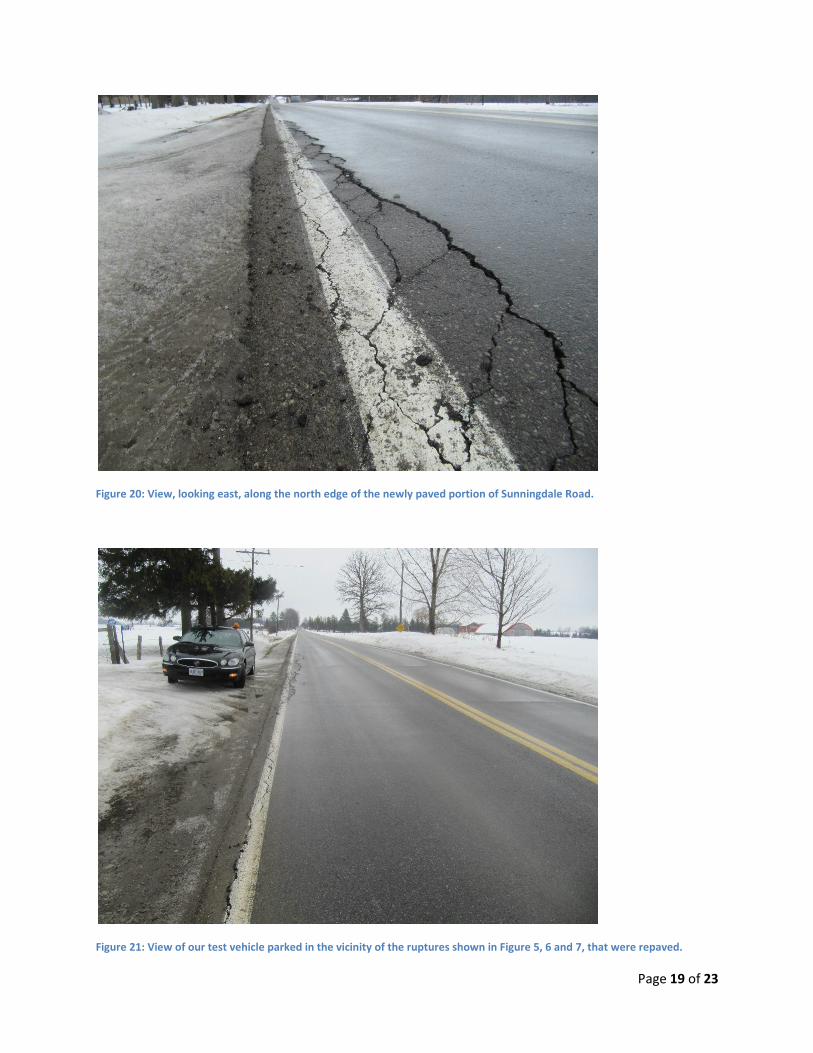
We also returned to the portion of the road where the worst ruptures were found in 2010 and 2011 as shown at the beginning of this article (Figures 5, 6 and 7). Figure 21 shows our vehicle parked on the north roadside adjacent to this area and around the vehicle there are a number of cracks in the pavement.
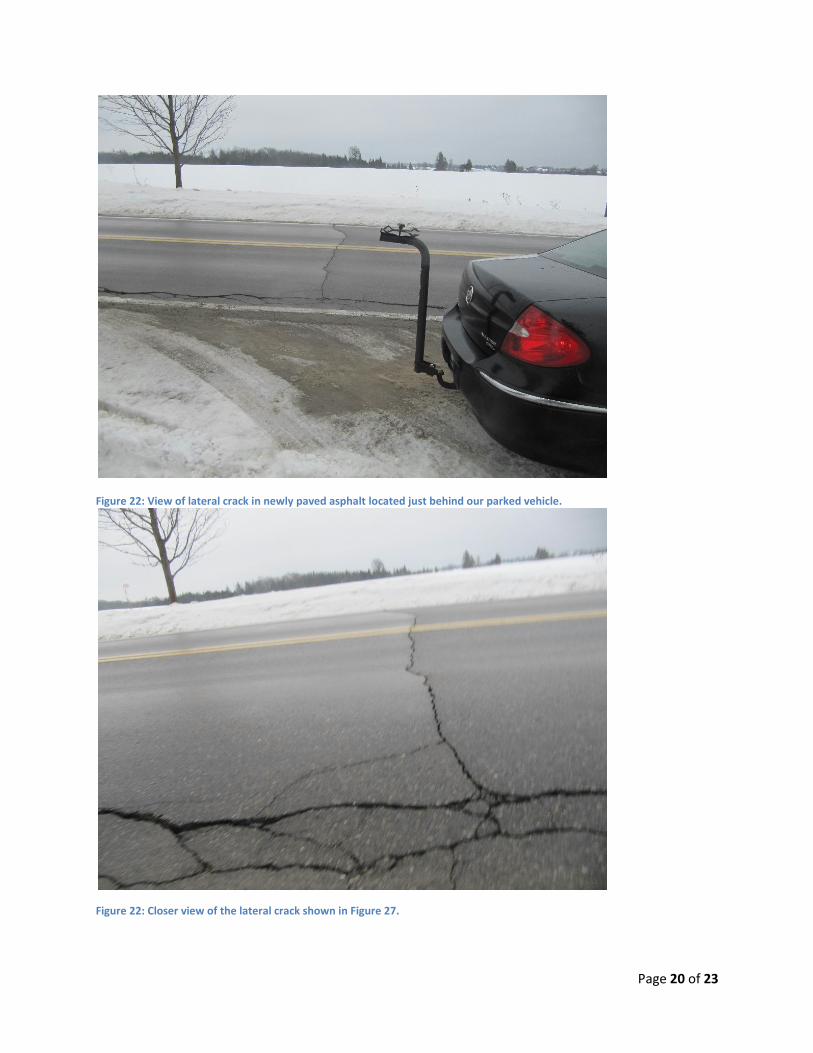
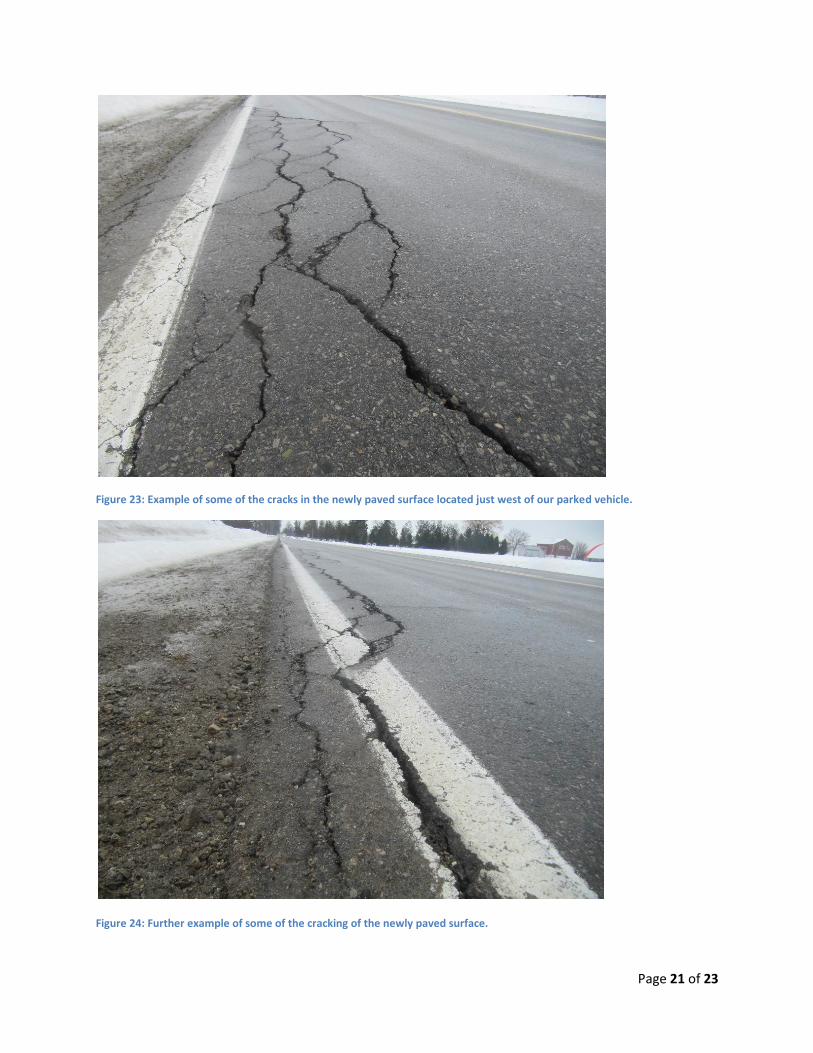
We also observed lateral cracks that travelled across the complete pavement surface as shown in Figures 22 and 23.
Just like the other portions of the newly paved surface, this area also contained substantial cracks as shown in Figures 24 through 27.
Figure 19: View, looking east, along the north edge of the newly paved portion of Sunningdale Road.
Page 19 of 23
Figure 20: View, looking east, along the north edge of the newly paved portion of Sunningdale Road.
Figure 21: View of our test vehicle parked in the vicinity of the ruptures shown in Figure 5, 6 and 7, that were repaved.
Page 20 of 23
Figure 22: View of lateral crack in newly paved asphalt located just behind our parked vehicle.
Figure 22: Closer view of the lateral crack shown in Figure 27.
Page 21 of 23
Figure 23: Example of some of the cracks in the newly paved surface located just west of our parked vehicle.
Figure 24: Further example of some of the cracking of the newly paved surface.

Page 22 of 23
Figure 26: Further example of the some of the cracks in the newly paved surface.
Figure 27: Further example of some of the deep cracks in the newly paved road surface.

Page 23 of 23
This deterioration of a road surface that had been paved just over two years before these photos were taken suggests that the iPhone data indicating substantial lateral and longitudinal motions of the test vehicle is reliably reporting a genuine problem. It has been observed that the area is prone to flooding so there is considerable standing water in the vicinity. When the water freezes it makes sense that this might cause problems to the structure of the road. So there is a reason to believe that the iPhone data could be reporting accurate data, however the analysis is incomplete.
We have additional data for our testing on other roadways that we hope to show in upcoming articles. It is our belief that when this future data is compared to the Sunningdale site it will demonstrate that the conditions on Sunningdale Road are exceptional. It will also demonstrate that the iPhone data can differentiate between the qualities of all these roads by storing objective and comparable data that can be easily reviewed.
We understand that there is various hardware and software that can generate pavement quality indices for various municipalities to use in prioritizing future repairs. As can be seen the iPhone can generate similar values at a minimal cost. However the purpose of our work is not to determine the roughness of a road surface but to evaluate what features of a road might have affected the motion of a vehicle that has been involved in a motor vehicle collision. Thus our procedures can also evaluate road conditions such as slopes or the character of a curve. Our procedures also document a driver's actions and reactions as they encounter these roadway features.
In summary, for situations where an analyst is interested in evaluating a roadway for a possible contribution to a motor vehicle accident, our data acquisition system, which incorporates a variety of displays such as driver eye motions, steering and braking inputs and iPhone data about the road surface conditions and geometry, can be of substantial help in providing the objective data on which an opinion could be based.
Gorski Consulting London, Ontario, Canada
Copyright © Gorski Consulting, All rights reserved