Embed Size (px)
Citation preview
IPL’s2007 Summer Capacity
Presentation to IURC
May 30, 2007
Steve Corwell, Sr. VP – Corporate AffairsJim Sadtler, Sr. VP – Technology and Performance
Presentation Overview
• Customer demand assessment• Supply resources • Reserve margins• Customer Demand Response options• Residential energy efficiency programs• IPL generation• Power Purchases• MISO Market
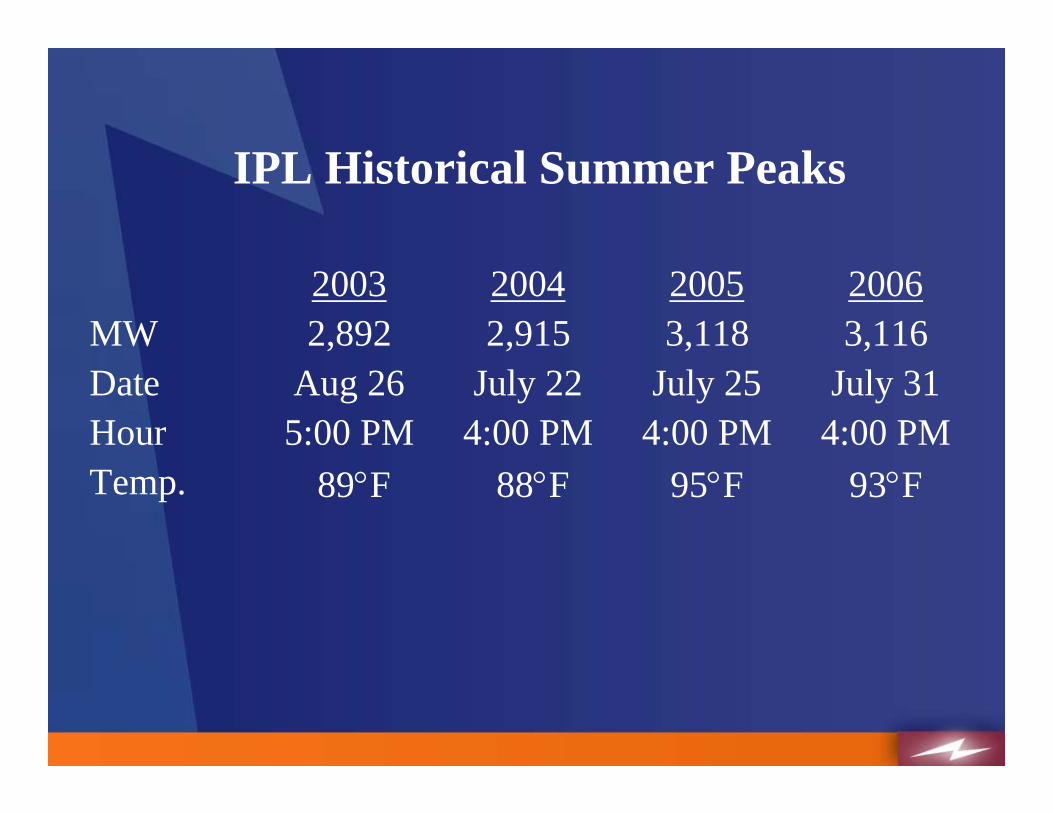
IPL Historical Summer Peaks
2003 2004 2005 2006 MW 2,892 2,915 3,118 3,116 Date Aug 26 July 22 July 25 July 31 Hour 5:00 PM 4:00 PM 4:00 PM 4:00 PMTemp. 89°F 88°F 95°F 93°F
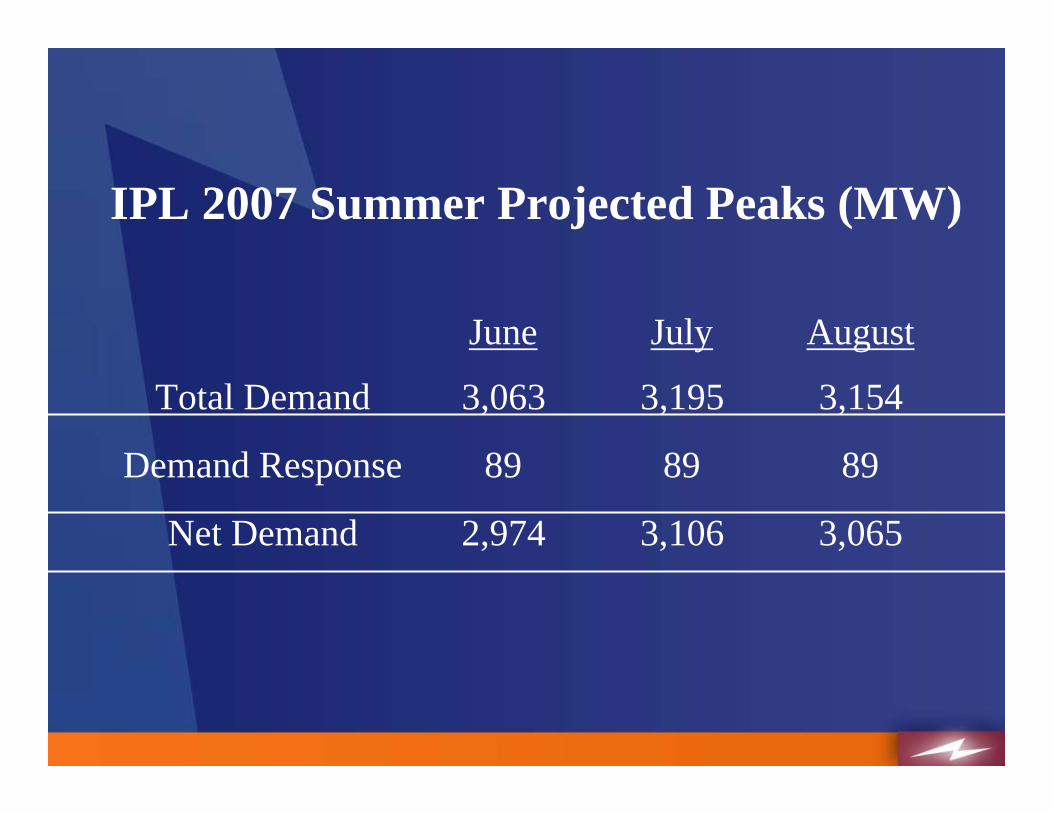
IPL 2007 Summer Projected Peaks (MW)
June July August
Total Demand 3,063 3,195 3,154
Demand Response 89 89 89
Net Demand 2,974 3,106 3,065
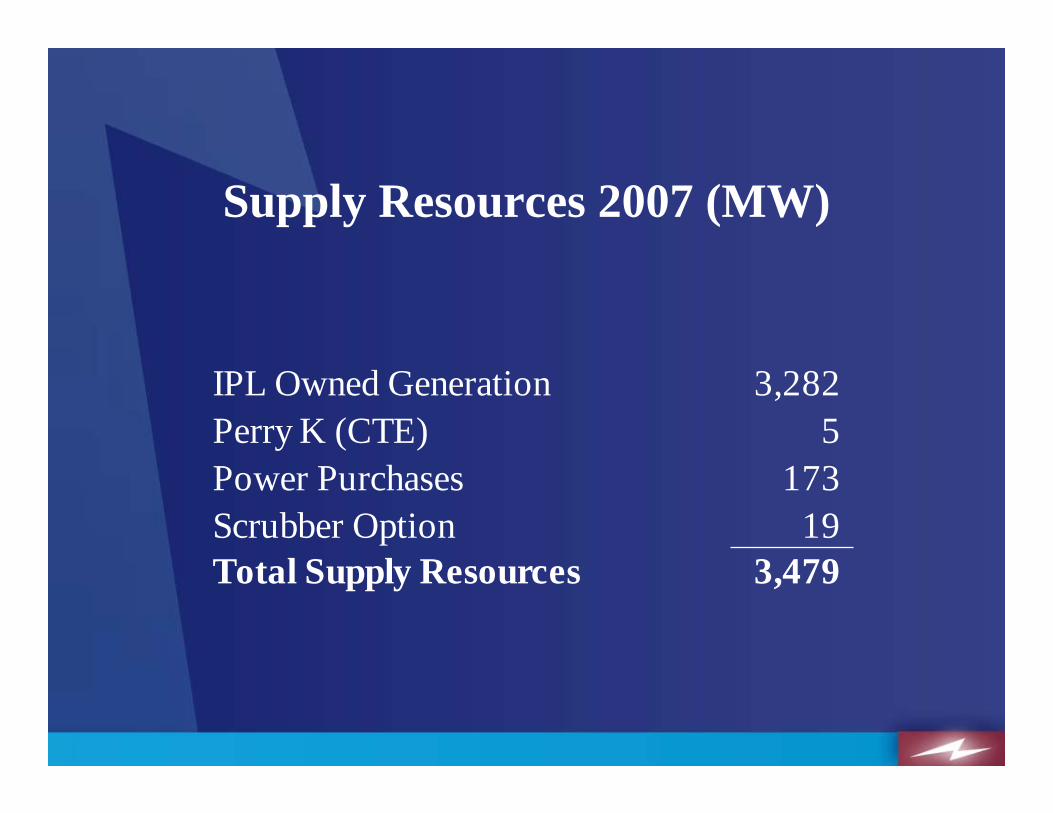
Supply Resources 2007 (MW)
IPL Owned Generation 3,282Perry K (CTE) 5Power Purchases 173Scrubber Option 19Total Supply Resources 3,479
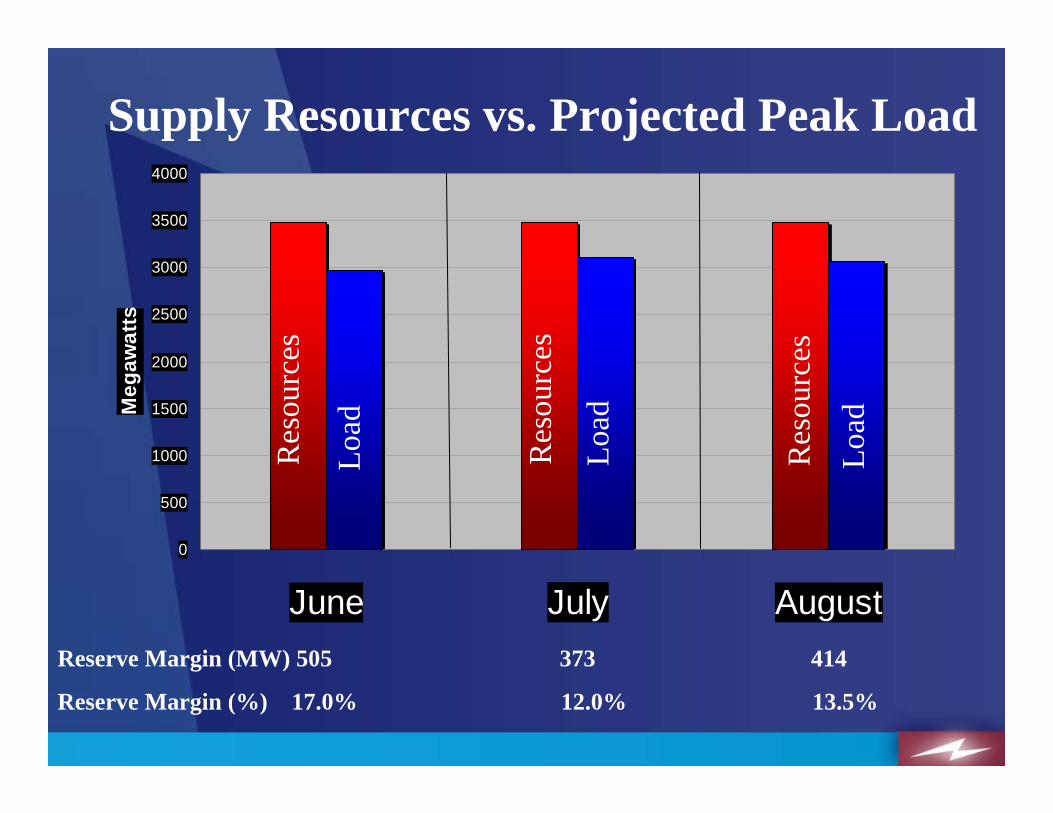
Supply Resources vs. Projected Peak Load
0
500
1000
1500
2000
2500
3000
3500
4000
June July August
Meg
awat
ts
Res
ourc
es
Res
ourc
es
Res
ourc
es
Load
Load
Load
Reserve Margin (MW) 505 373 414
Reserve Margin (%) 17.0% 12.0% 13.5%
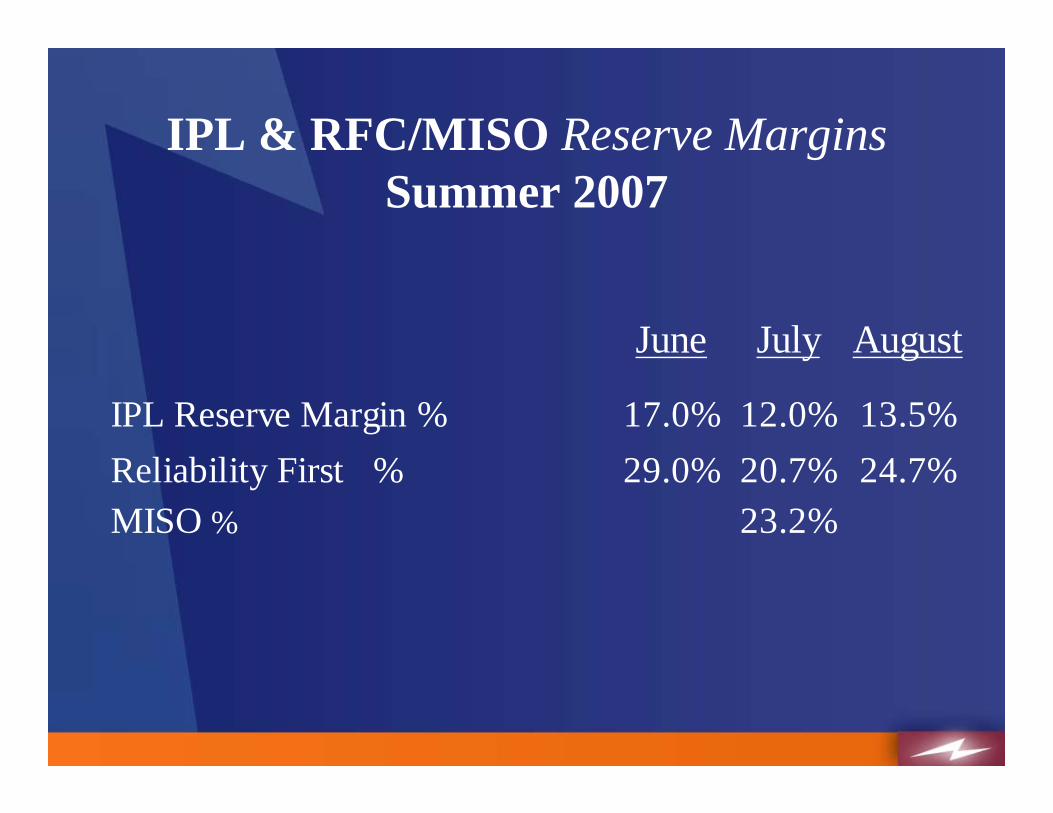
IPL & RFC/MISO Reserve MarginsSummer 2007
June July August
IPL Reserve Margin % 17.0% 12.0% 13.5%Reliability First % 29.0% 20.7% 24.7%MISO % 23.2%
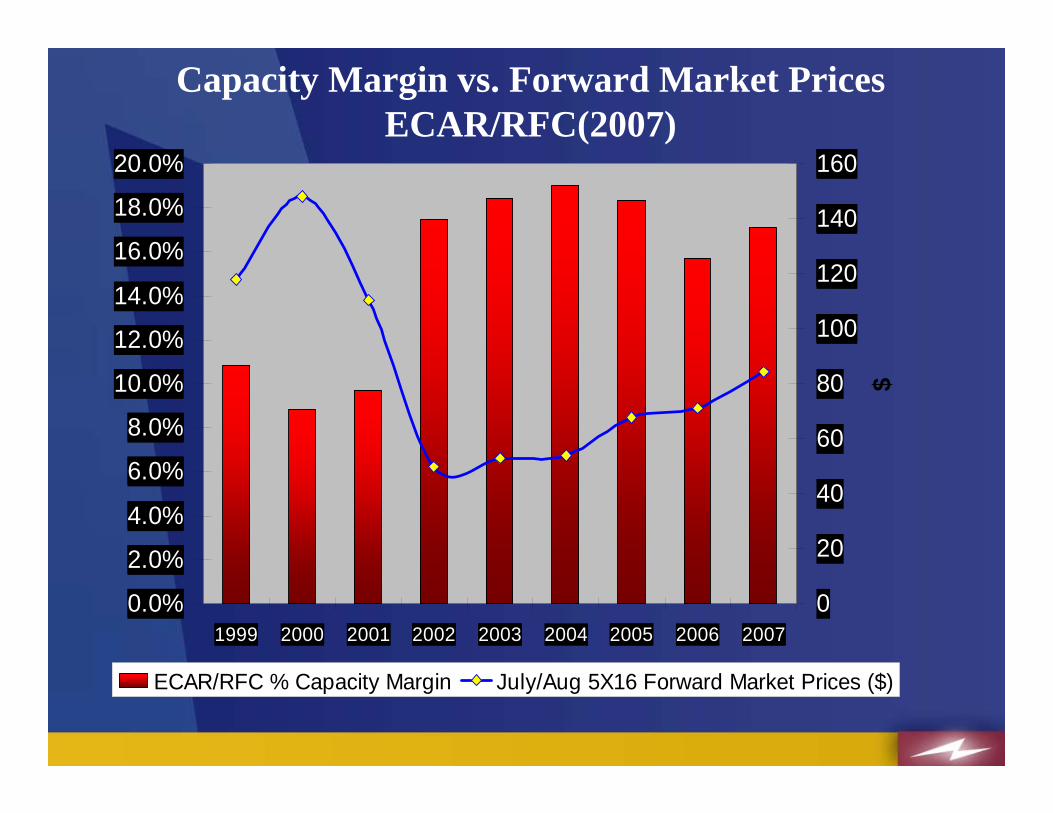
Capacity Margin vs. Forward Market PricesECAR/RFC(2007)
0.0%
2.0%
4.0%
6.0%
8.0%
10.0%
12.0%
14.0%
16.0%
18.0%
20.0%
1999 2000 2001 2002 2003 2004 2005 2006 20070
20
40
60
80
100
120
140
160
$
ECAR/RFC % Capacity Margin July/Aug 5X16 Forward Market Prices ($)
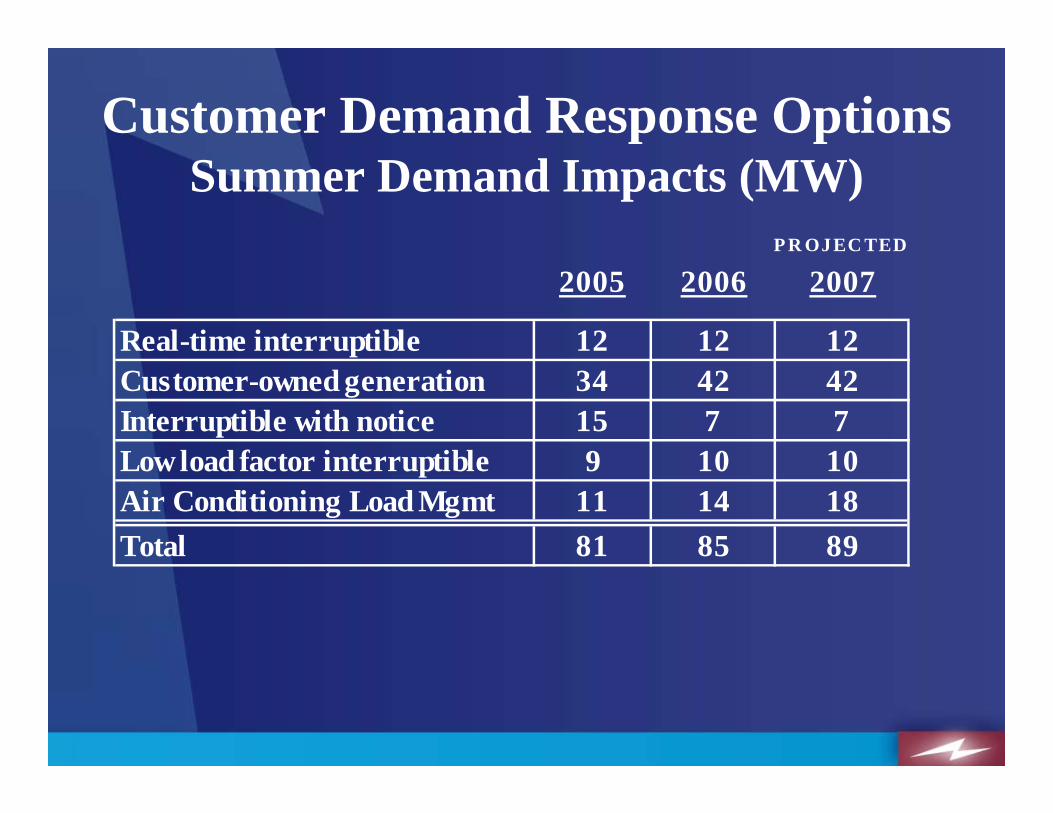
Customer Demand Response OptionsSummer Demand Impacts (MW)
P R OJEC TED
2005 2006 2007
Real-time interruptible 12 12 12Customer-owned generation 34 42 42Interruptible with notice 15 7 7Low load factor interruptible 9 10 10Air Conditioning Load Mgmt 11 14 18Total 81 85 89
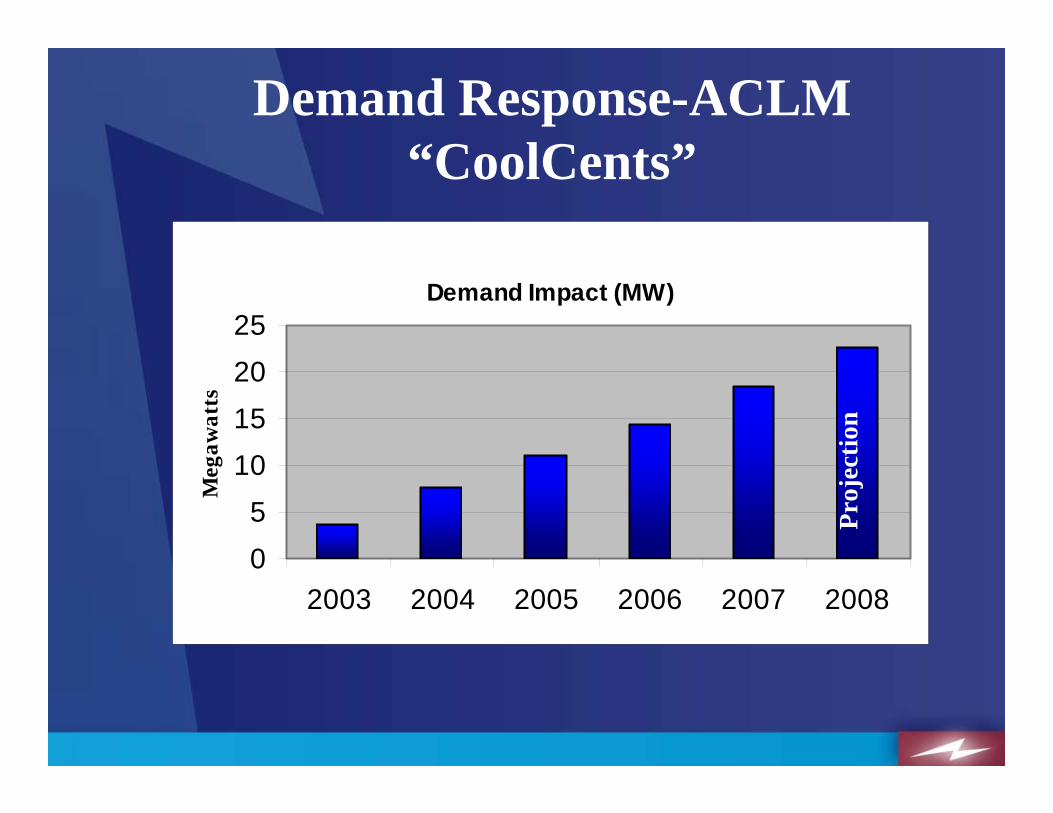
Demand Response-ACLM “CoolCents”
Demand Impact (MW)
05
10152025
2003 2004 2005 2006 2007 2008
Meg
awat
ts
Proj
ectio
n
Residential Energy Efficiency Programs
• Income qualified weatherization• High efficiency heat pump and air conditioner
incentives• Energy efficiency education• Renewable energy education

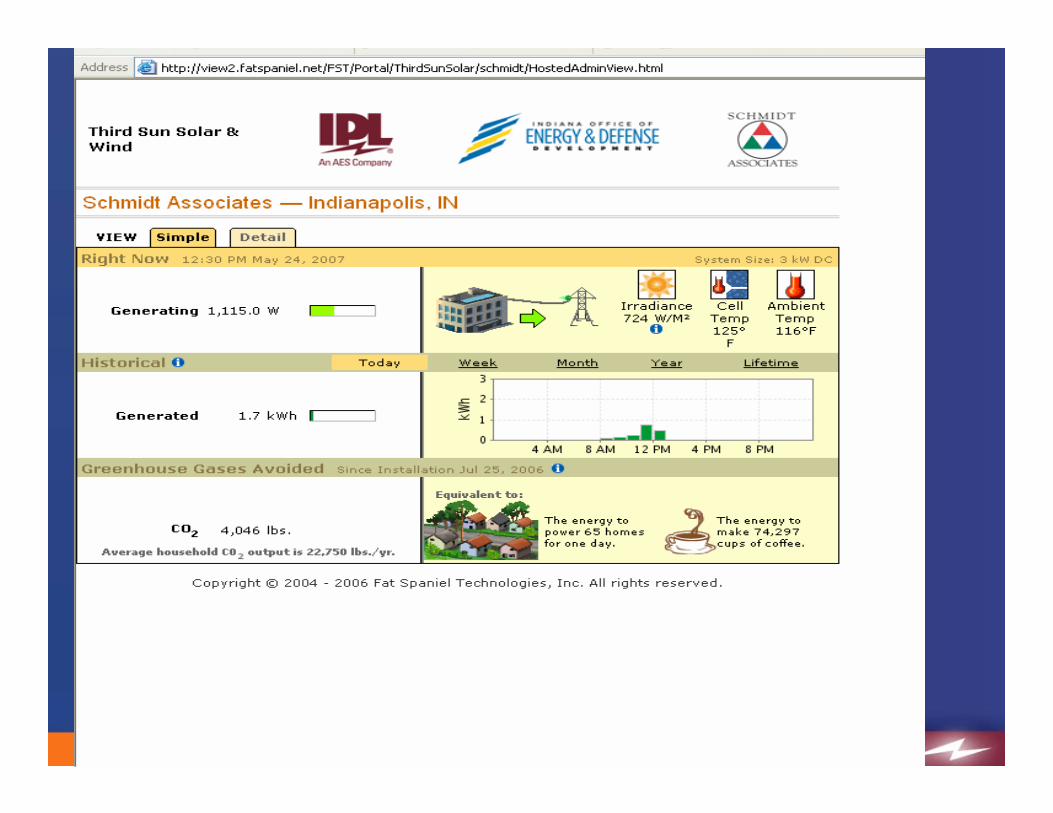
Schmidt & Associates PV system
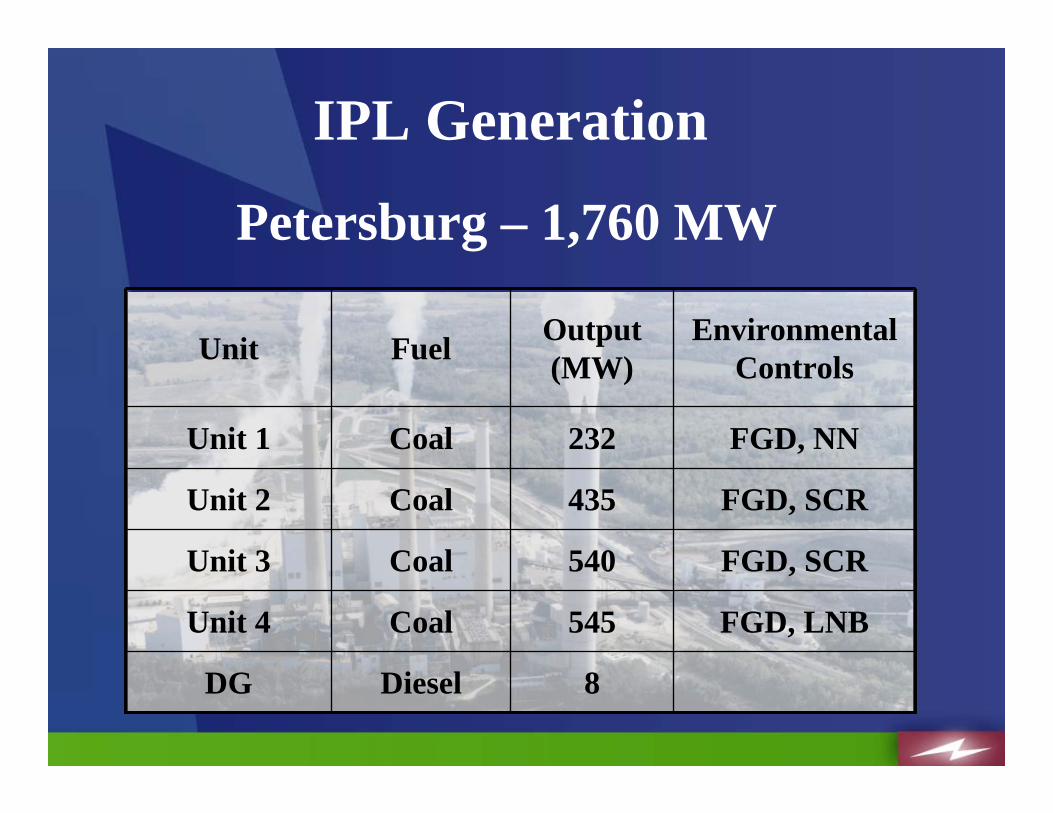
Petersburg – 1,760 MW
FGD, LNB545CoalUnit 4
FGD, SCR540CoalUnit 3
8DieselDG
FGD, SCR435CoalUnit 2
FGD, NN232 CoalUnit 1
Environmental Controls
Output (MW)FuelUnit
IPL Generation
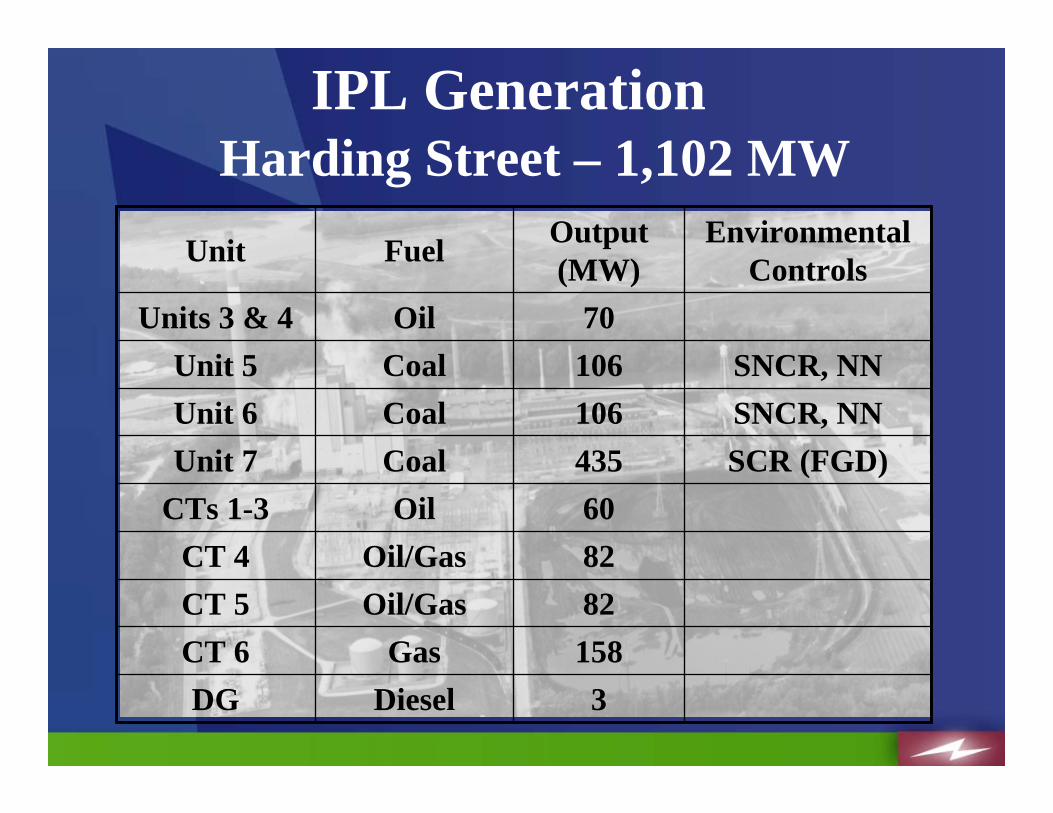
Harding Street – 1,102 MW
158GasCT 682Oil/GasCT 5
SNCR, NN106CoalUnit 6
3DieselDG
82Oil/GasCT 460OilCTs 1-3
SCR (FGD)435CoalUnit 7
SNCR, NN106CoalUnit 570 OilUnits 3 & 4
Environmental Controls
Output (MW)FuelUnit
IPL Generation
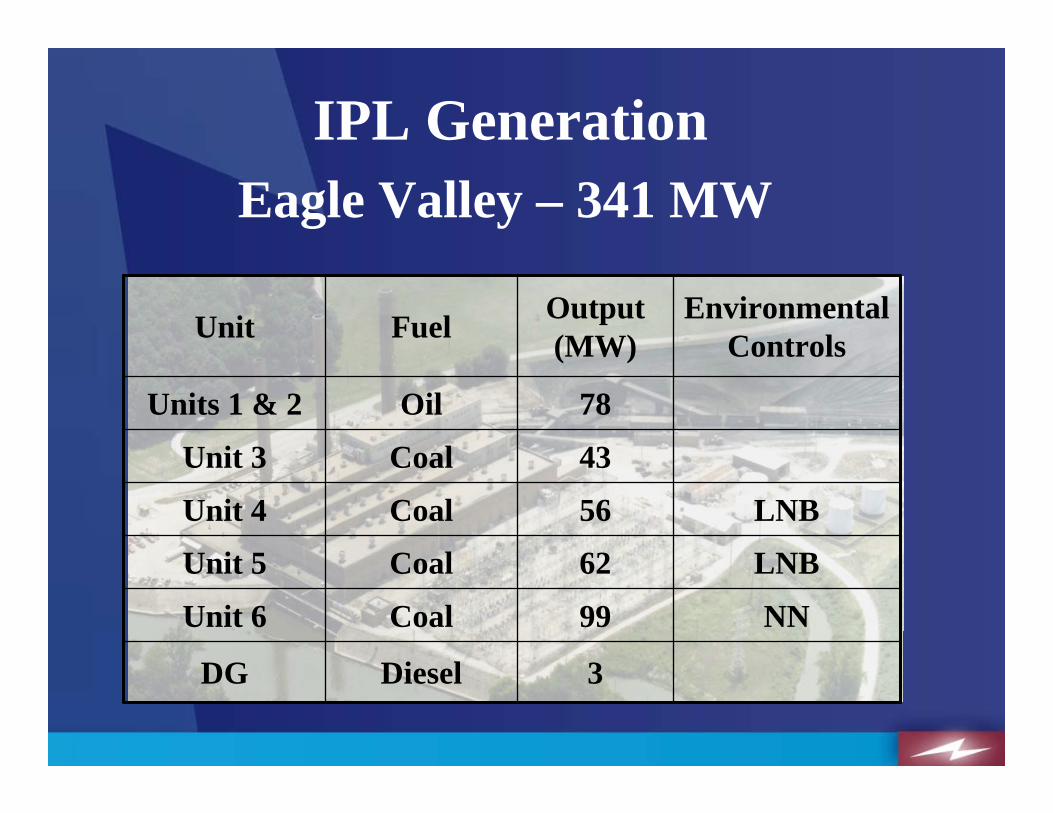
Eagle Valley – 341 MW
NN99CoalUnit 6
LNB62CoalUnit 5
3DieselDG
LNB56CoalUnit 4
43CoalUnit 3
78 OilUnits 1 & 2
Environmental Controls
Output (MW)FuelUnit
IPL Generation
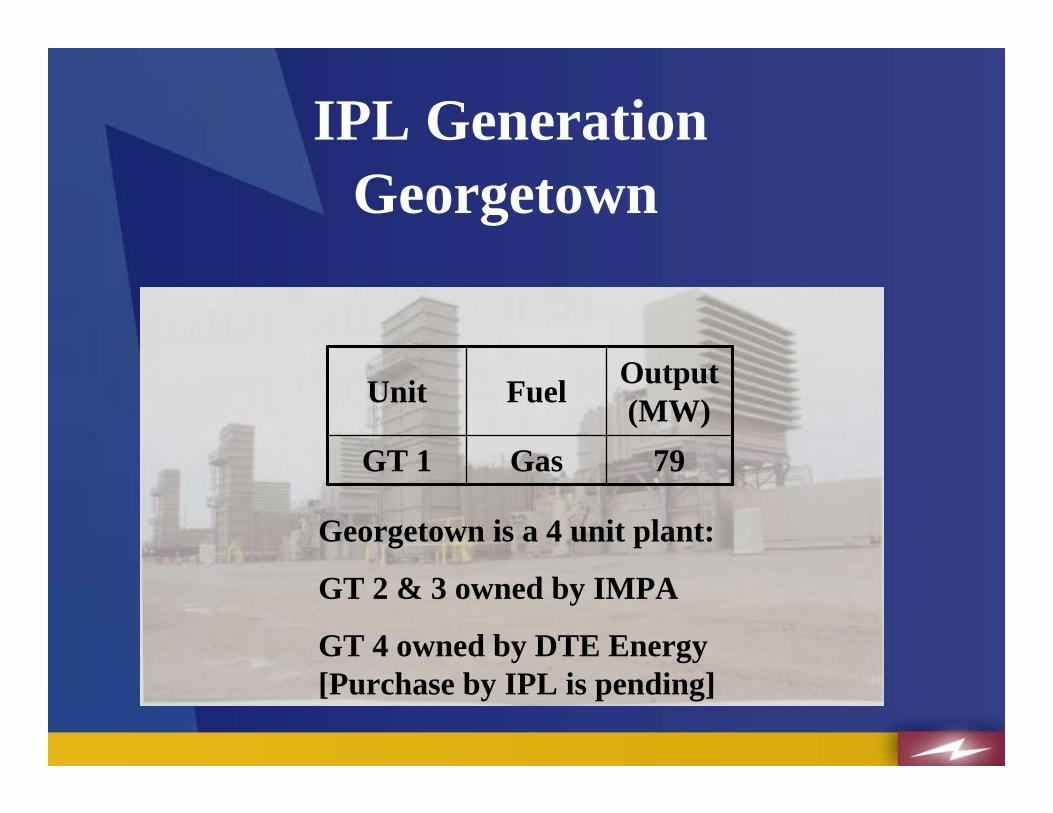
Georgetown
79 GasGT 1
Output (MW)FuelUnit
Georgetown is a 4 unit plant:
GT 2 & 3 owned by IMPA
GT 4 owned by DTE Energy [Purchase by IPL is pending]
IPL Generation
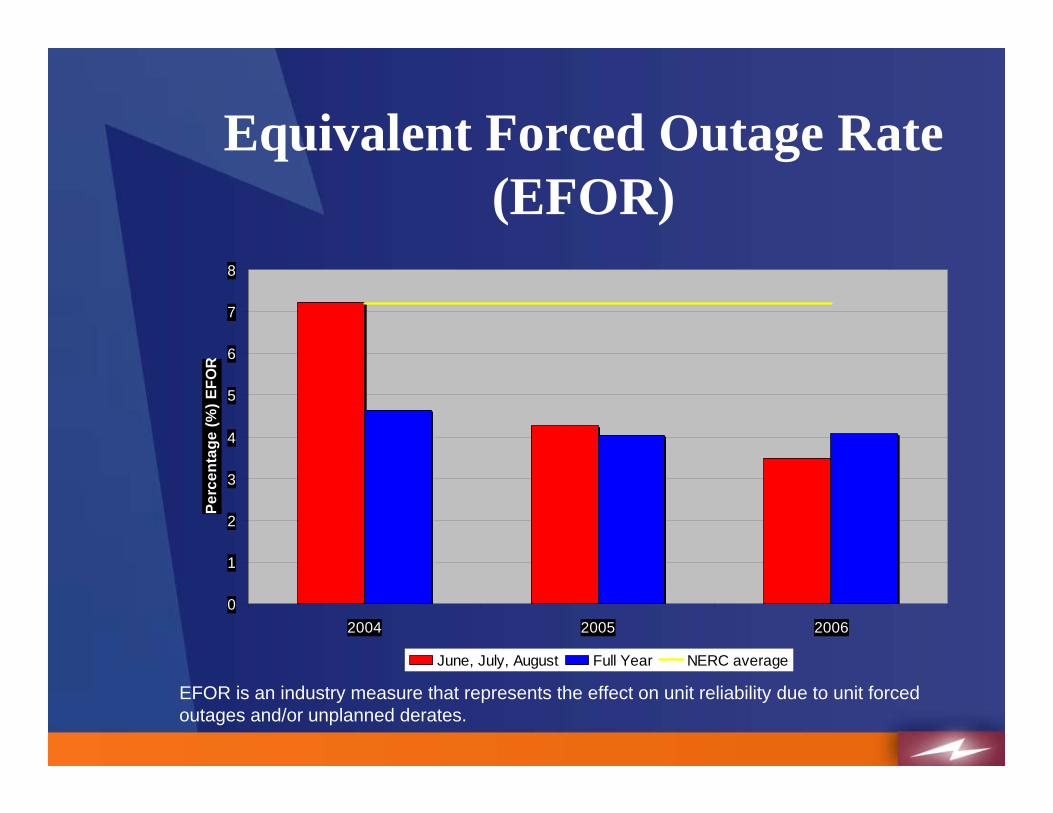
Equivalent Forced Outage Rate (EFOR)
0
1
2
3
4
5
6
7
8
2004 2005 2006
Perc
enta
ge (%
) EFO
R
June, July, August Full Year NERC average
EFOR is an industry measure that represents the effect on unit reliability due to unit forced outages and/or unplanned derates.
Power Purchases
• 73 MW Unit Power Purchase– May—September 2007– With DTE Energy for Georgetown Unit 4
• 100 MW Power Purchase– May—September 2007– Backed by peaking capacity in MISO
MISO Market• Successful transition from prior bi-lateral
market despite record setting summer peak demands in 2005
• Provides near real-time economic dispatch of IPL generation with generation supply of entire MISO footprint
• Actively involved at MISO
MISO Energy Emergency Alert 2• EEA2 issued: August 1 and 2, 2006• Requested member companies to make
emergency units available• Public appeal• IPL responded as requested
– Actually called on customers to interrupt, curtail, or exercise other forms of DR on 7/31, 8/1, and 8/2
– IPL experienced no operating difficulties
Summary• IPL’s Resource Portfolio of Owned
Generation, Demand Response Options, and Power Purchases will support projected summer 2007 customer load requirements.