Embed Size (px)
Citation preview
1
2
3
4
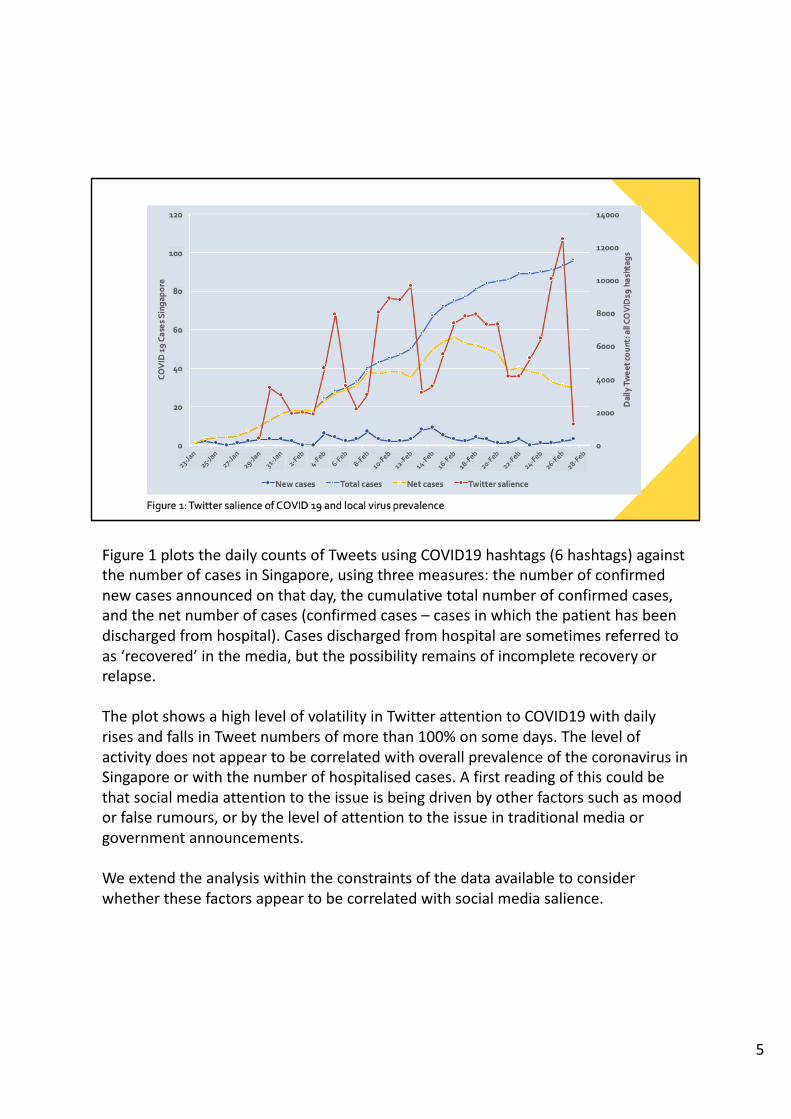
Figure 1plotsthedailycountsofTweetsusingCOVID19hashtags(6hashtags)againstthenumberofcasesinSingapore,usingthreemeasures:thenumberofconfirmednewcasesannouncedonthatday,thecumulativetotalnumberofconfirmedcases,andthenetnumberofcases(confirmedcases– casesinwhichthepatienthasbeendischargedfromhospital).Casesdischargedfromhospitalaresometimesreferredtoas‘recovered’inthemedia,butthepossibilityremainsofincompleterecoveryorrelapse.
TheplotshowsahighlevelofvolatilityinTwitterattentiontoCOVID19withdailyrisesandfallsinTweetnumbersofmorethan100%onsomedays.ThelevelofactivitydoesnotappeartobecorrelatedwithoverallprevalenceofthecoronavirusinSingaporeorwiththenumberofhospitalised cases.Afirstreadingofthiscouldbethatsocialmediaattentiontotheissueisbeingdrivenbyotherfactorssuchasmoodorfalserumours,orbythelevelofattentiontotheissueintraditionalmediaorgovernmentannouncements.
Weextendtheanalysiswithintheconstraintsofthedataavailabletoconsiderwhetherthesefactorsappeartobecorrelatedwithsocialmediasalience.
5
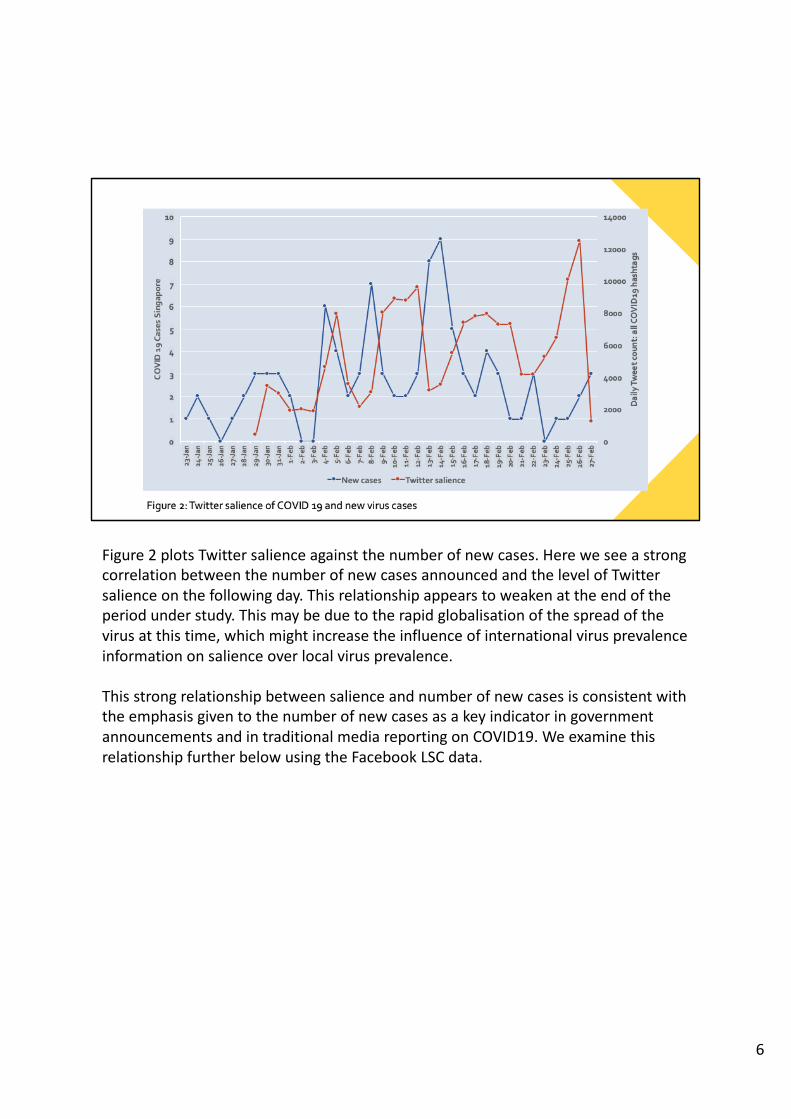
Figure 2plotsTwittersalienceagainstthenumberofnewcases.HereweseeastrongcorrelationbetweenthenumberofnewcasesannouncedandthelevelofTwittersalienceonthefollowingday.Thisrelationshipappearstoweakenattheendoftheperiodunderstudy.Thismaybeduetotherapidglobalisation ofthespreadofthevirusatthistime,whichmightincreasetheinfluenceofinternationalvirusprevalenceinformationonsalienceoverlocalvirusprevalence.
ThisstrongrelationshipbetweensalienceandnumberofnewcasesisconsistentwiththeemphasisgiventothenumberofnewcasesasakeyindicatoringovernmentannouncementsandintraditionalmediareportingonCOVID19.WeexaminethisrelationshipfurtherbelowusingtheFacebookLSCdata.
6
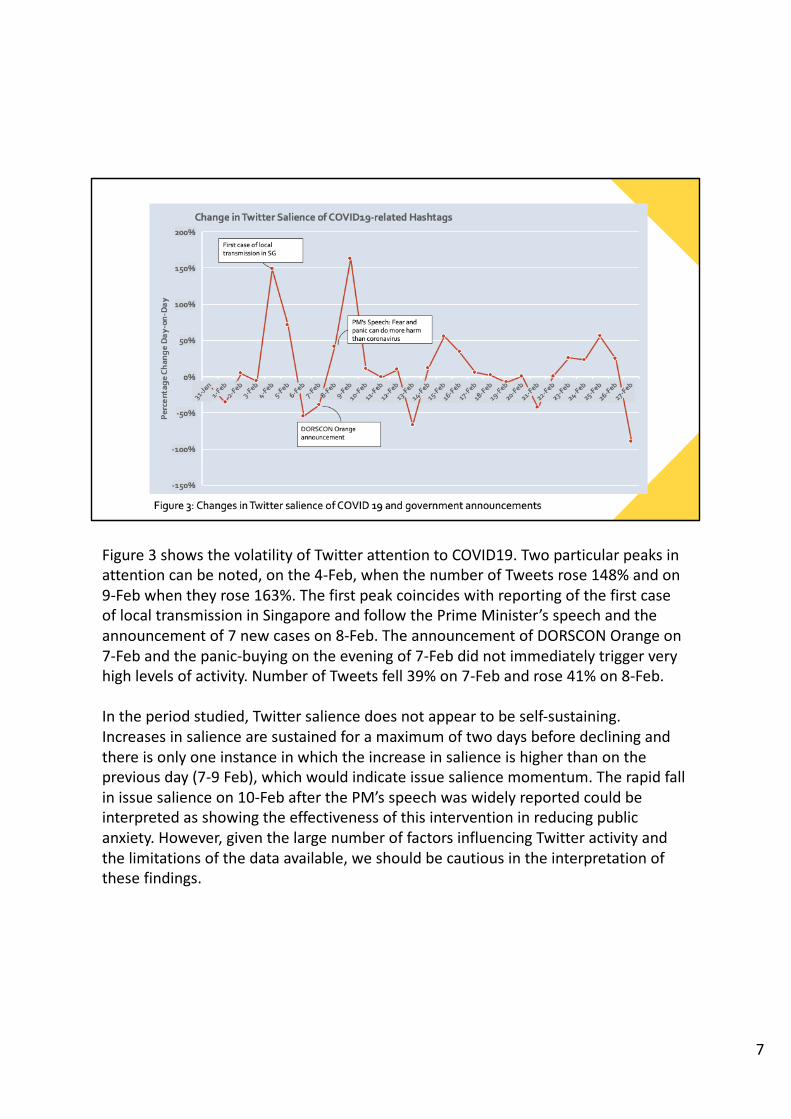
Figure 3showsthevolatilityofTwitterattentiontoCOVID19.Twoparticularpeaksinattentioncanbenoted,onthe4-Feb,whenthenumberofTweetsrose148%andon9-Febwhentheyrose163%.ThefirstpeakcoincideswithreportingofthefirstcaseoflocaltransmissioninSingaporeandfollowthePrimeMinister’sspeechandtheannouncementof7newcaseson8-Feb.TheannouncementofDORSCONOrangeon7-Febandthepanic-buyingontheeveningof7-Febdidnotimmediatelytriggerveryhighlevelsofactivity.NumberofTweetsfell39%on7-Febandrose41%on8-Feb.
Intheperiodstudied,Twittersaliencedoesnotappeartobeself-sustaining.Increasesinsaliencearesustainedforamaximumoftwodaysbeforedecliningandthereisonlyoneinstanceinwhichtheincreaseinsalienceishigherthanonthepreviousday(7-9Feb),whichwouldindicateissuesaliencemomentum.Therapidfallinissuesalienceon10-FebafterthePM’sspeechwaswidelyreportedcouldbeinterpretedasshowingtheeffectivenessofthisinterventioninreducingpublicanxiety.However,giventhelargenumberoffactorsinfluencingTwitteractivityandthelimitationsofthedataavailable,weshouldbecautiousintheinterpretationofthesefindings.
7
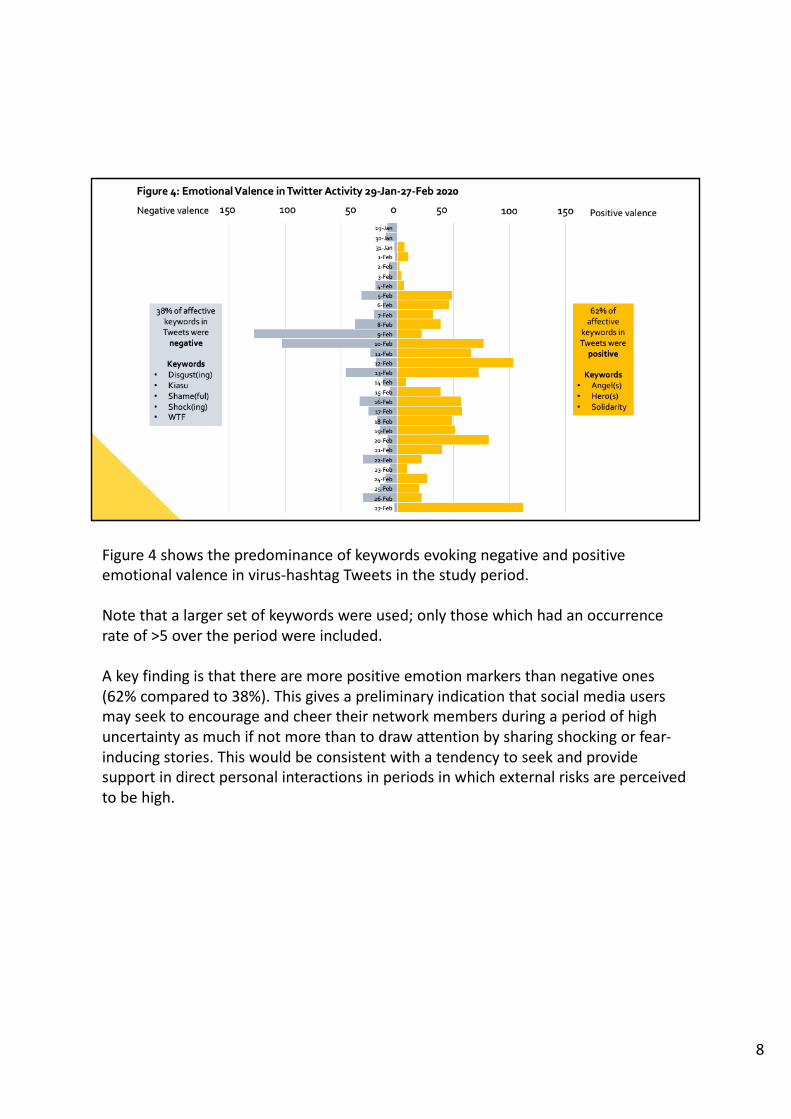
Figure4 showsthepredominanceofkeywordsevokingnegativeandpositiveemotionalvalenceinvirus-hashtagTweetsinthestudyperiod.
Notethatalargersetofkeywordswereused;onlythosewhichhadanoccurrencerateof>5overtheperiodwereincluded.
Akeyfindingisthattherearemorepositiveemotionmarkersthannegativeones(62%comparedto38%).Thisgivesapreliminaryindicationthatsocialmediausersmayseektoencourageandcheertheirnetworkmembersduringaperiodofhighuncertaintyasmuchifnotmorethantodrawattentionbysharingshockingorfear-inducingstories.Thiswouldbeconsistentwithatendencytoseekandprovidesupportindirectpersonalinteractionsinperiodsinwhichexternalrisksareperceivedtobehigh.
8
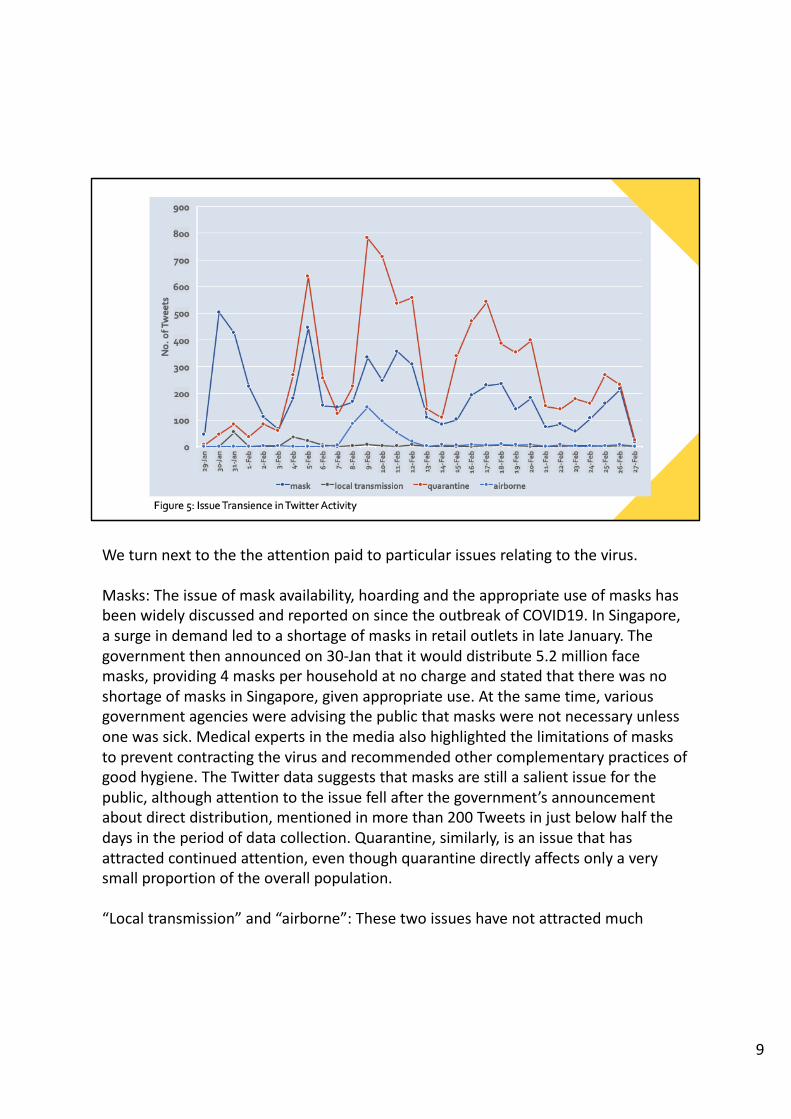
Weturnnexttothetheattentionpaidtoparticularissuesrelatingtothevirus.
Masks:Theissueofmaskavailability,hoardingandtheappropriateuseofmaskshasbeenwidelydiscussedandreportedonsincetheoutbreakofCOVID19.InSingapore,asurgeindemandledtoashortageofmasksinretailoutletsinlateJanuary.Thegovernmentthenannouncedon30-Janthatitwoulddistribute5.2millionfacemasks,providing4masksperhouseholdatnochargeandstatedthattherewasnoshortageofmasksinSingapore,givenappropriateuse.Atthesametime,variousgovernmentagencieswereadvisingthepublicthatmaskswerenotnecessaryunlessonewassick.Medicalexpertsinthemediaalsohighlightedthelimitationsofmaskstopreventcontractingthevirusandrecommendedothercomplementarypracticesofgoodhygiene.TheTwitterdatasuggeststhatmasksarestillasalientissueforthepublic,althoughattentiontotheissuefellafterthegovernment’sannouncementaboutdirectdistribution,mentionedinmorethan200Tweetsinjustbelowhalfthedaysintheperiodofdatacollection.Quarantine,similarly,isanissuethathasattractedcontinuedattention,eventhoughquarantinedirectlyaffectsonlyaverysmallproportionoftheoverallpopulation.
“Localtransmission”and“airborne”:Thesetwoissueshavenotattractedmuch
9
attentiononTwitter.Theybothshowasingle,lowpeak,andminimalornoattentioninthesecondhalfoftheperiodstudied.Weincludedthesekeywordsastheywerethesubjectofmisleading/falsesocialmediarumoursthatwerecounteredbygovernment,eitherthroughPOFMAorongov.sg.Whiletheseinterventionsmayhavehelpedtoreversethemomentumoftheserumours,theoverallreachoftherumoursonTwitterappearstohavebeenlowinanycase.
9
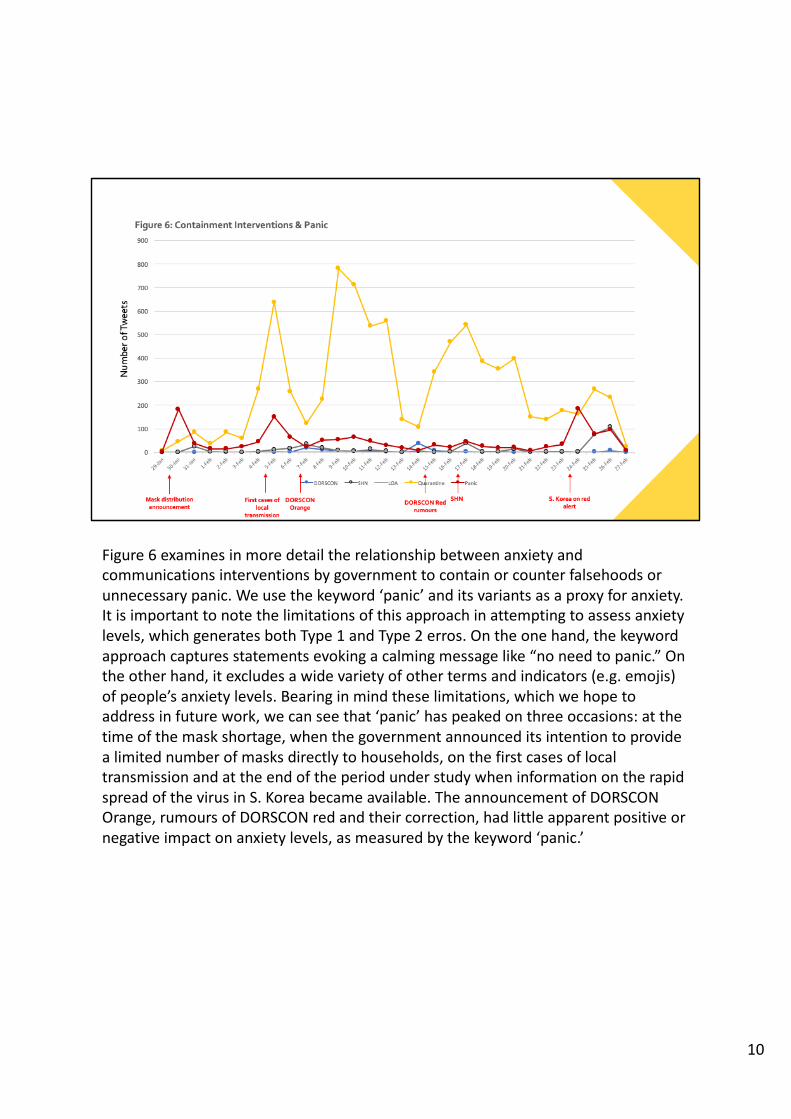
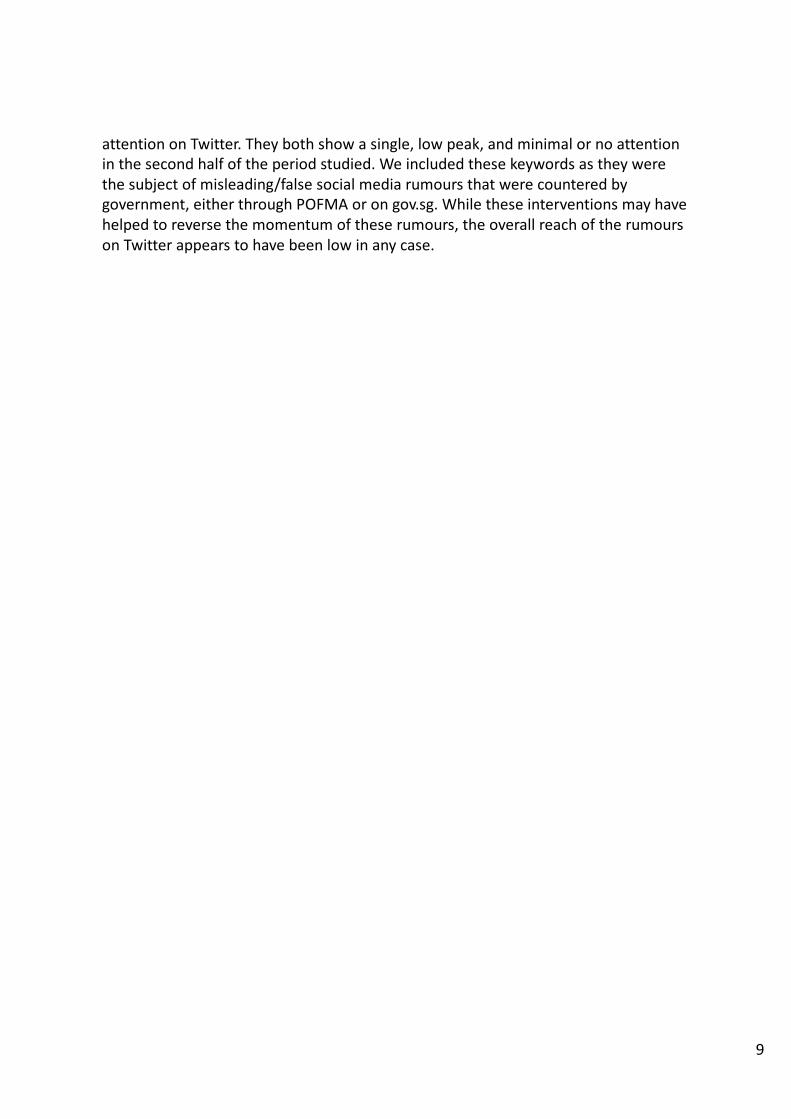
Figure6examines inmoredetailtherelationshipbetweenanxietyandcommunicationsinterventionsbygovernmenttocontainorcounterfalsehoodsorunnecessarypanic.Weusethekeyword‘panic’anditsvariantsasaproxyforanxiety.Itisimportanttonotethelimitationsofthisapproachinattemptingtoassessanxietylevels,whichgeneratesbothType1andType2erros.Ontheonehand,thekeywordapproachcapturesstatementsevokingacalmingmessagelike“noneedtopanic.”Ontheotherhand,itexcludesawidevarietyofothertermsandindicators(e.g.emojis)ofpeople’sanxietylevels.Bearinginmindtheselimitations,whichwehopetoaddressinfuturework,wecanseethat‘panic’haspeakedonthreeoccasions:atthetimeofthemaskshortage,whenthegovernmentannounceditsintentiontoprovidealimitednumberofmasksdirectlytohouseholds,onthefirstcasesoflocaltransmissionandattheendoftheperiodunderstudywheninformationontherapidspreadofthevirusinS.Koreabecameavailable.TheannouncementofDORSCONOrange,rumours ofDORSCONredandtheircorrection,hadlittleapparentpositiveornegativeimpactonanxietylevels,asmeasuredbythekeyword‘panic.’
10
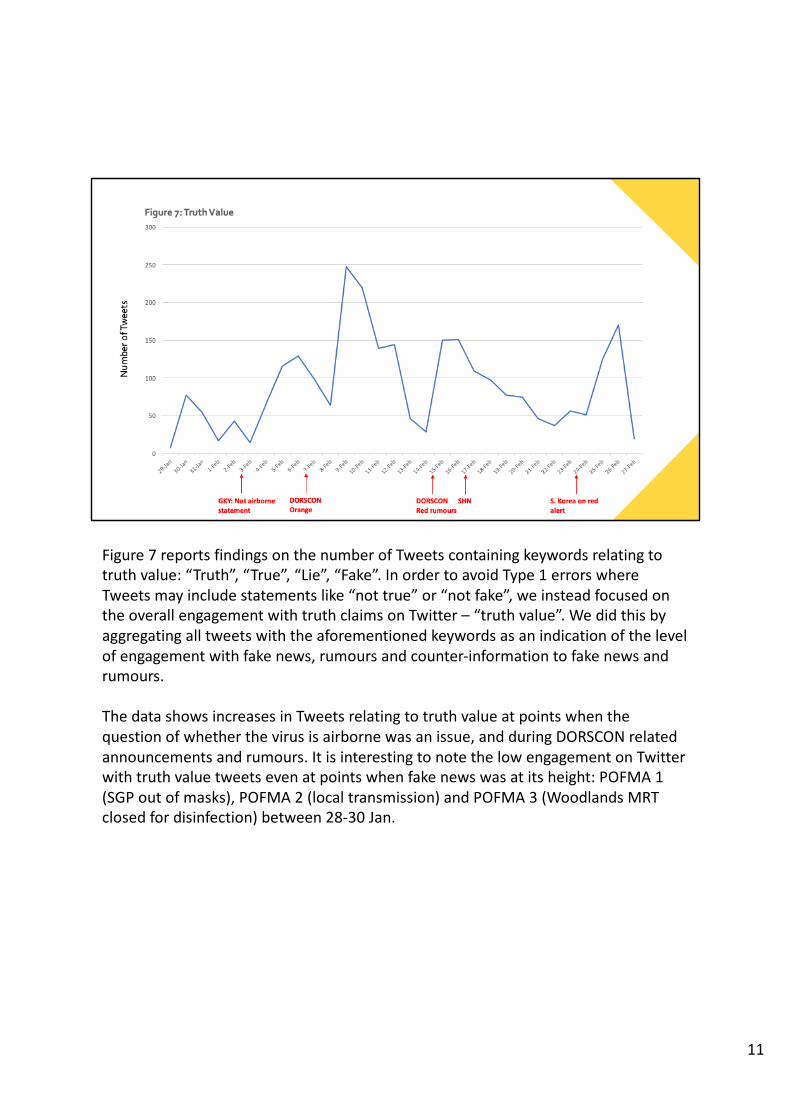
Figure7reports findingsonthenumberofTweetscontainingkeywordsrelatingtotruthvalue:“Truth”,“True”,“Lie”,“Fake”.InordertoavoidType1errorswhereTweetsmayincludestatementslike“nottrue”or“notfake”,weinsteadfocusedontheoverallengagementwithtruthclaimsonTwitter– “truthvalue”.Wedidthisbyaggregatingalltweetswiththeaforementionedkeywordsasanindicationofthelevelofengagementwithfakenews,rumours andcounter-informationtofakenewsandrumours.
Thedata showsincreasesinTweetsrelatingtotruthvalueatpointswhenthequestionofwhetherthevirusisairbornewasanissue,andduringDORSCONrelatedannouncementsandrumours. Itisinterestingtonote thelowengagementonTwitterwithtruthvaluetweetsevenatpointswhenfakenewswasatitsheight:POFMA1(SGPoutofmasks),POFMA2(localtransmission)andPOFMA3(WoodlandsMRTclosedfordisinfection)between28-30Jan.
11
Figure8plotsTwitter activitywitheconomy-relatedkeywords. Itshowsanincreasingtrendtowardstheendoftheperiodunderstudy,withmoreactivityafter reportsofsignificantnumbersofcasesinS.Korea, followedbythespreadtoItalyandtheUS.Thetrendin“Stockmarket”Tweetsincreases veryrapidlyafterCOVID-19caseswerereported inEurope. Governmentannouncementsaboutfinancialaidtolocalbusinesseswerenotwidelypickedup inTwitteractivity. Overall,wenotethatthetotalnumberofTweetsusingthesekeywordsislowthroughouttheperiod.
12
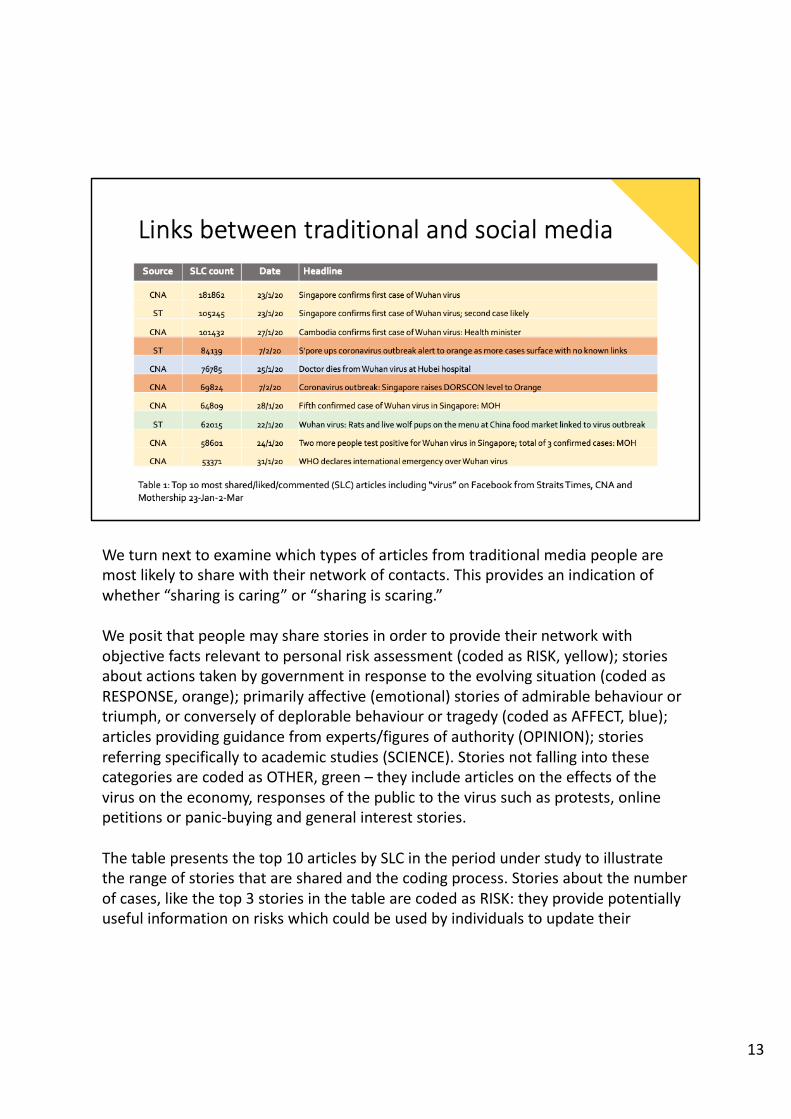
Weturnnexttoexaminewhichtypesofarticlesfromtraditionalmediapeoplearemostlikelytosharewiththeirnetworkofcontacts.Thisprovidesanindicationofwhether“sharingiscaring”or“sharingisscaring.”
Wepositthatpeoplemaysharestoriesinordertoprovidetheirnetworkwithobjectivefactsrelevanttopersonalriskassessment(codedasRISK,yellow);storiesaboutactionstakenbygovernmentinresponsetotheevolvingsituation(codedasRESPONSE,orange);primarilyaffective(emotional)storiesofadmirablebehaviour ortriumph,orconverselyofdeplorablebehaviour ortragedy(codedasAFFECT,blue);articlesprovidingguidancefromexperts/figuresofauthority(OPINION);storiesreferringspecificallytoacademicstudies(SCIENCE).StoriesnotfallingintothesecategoriesarecodedasOTHER,green– theyincludearticlesontheeffectsofthevirusontheeconomy,responsesofthepublictothevirussuchasprotests,onlinepetitionsorpanic-buyingandgeneralintereststories.
Thetablepresentsthetop10articlesbySLCintheperiodunderstudytoillustratetherangeofstoriesthataresharedandthecodingprocess.Storiesaboutthenumberofcases,likethetop3storiesinthetablearecodedasRISK:theyprovidepotentiallyusefulinformationonriskswhichcouldbeusedbyindividualstoupdatetheir
13
assessmentoftheirindividualriskfromCOVID19.
Stories4&6areconcernedwiththegovernmentresponsetothecrisis(RESPONSE).Fromthedataavailable,wearenotabletodistinguishbetweenstoriesthatareLikedandthosethataresharedbutnotcommendedbytheuserandsoonceagainwemustbecautiousintheinterpretation.
Story5isconcernedwiththedeathofadoctor“atthefrontline”oftheoutbreakinChina.Asitisconcernedwithanindividual,wecodeitasAFFECT.
Story8isrelatedtothevirusandprovidessomeinsightintothepotentialoriginofthevirus,butisnotdirectlyusefulforriskassessment.ItiscodedasOTHER.
TheresultsareshowninTable2andFigure9.
13
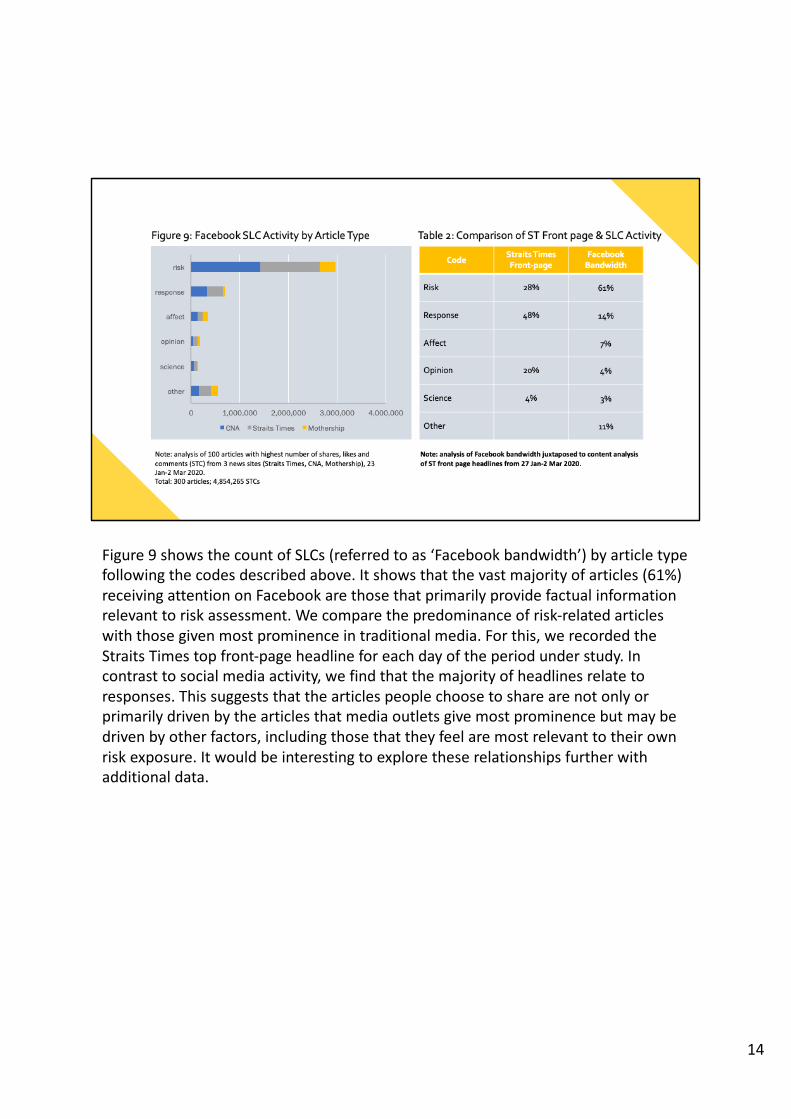
Figure9shows thecountofSLCs(referredtoas‘Facebookbandwidth’)byarticletypefollowingthecodesdescribedabove.Itshowsthatthevastmajorityofarticles(61%)receivingattentiononFacebookarethosethatprimarilyprovidefactualinformationrelevanttoriskassessment.Wecomparethepredominanceofrisk-relatedarticleswiththosegivenmostprominenceintraditionalmedia.Forthis,werecordedtheStraitsTimestopfront-pageheadlineforeachdayoftheperiodunderstudy.Incontrasttosocialmediaactivity,wefindthatthemajorityofheadlinesrelatetoresponses.Thissuggeststhatthearticlespeoplechoosetosharearenotonlyorprimarilydrivenbythearticlesthatmediaoutletsgivemostprominencebutmaybedrivenbyotherfactors,includingthosethattheyfeelaremostrelevanttotheirownriskexposure.Itwouldbeinterestingtoexploretheserelationshipsfurtherwithadditionaldata.
14
15
16