Embed Size (px)
Citation preview

IR Presentation Apr. 2018
2
The financial information included in this document are earnings results based on K-IFRS.
This document is provided for the convenience of investors,
and the external audit on our financial results are yet to be completed;
therefore, certain part(s) of this document is subject to change upon the auditor’s review.
The company does not make any representation or accept liability,
as to the accuracy or completeness of the financial and operational results stated,
and nothing contained herein is, or shall be relied upon as a promise or representation, whether as to the past or the future.
This document shall not be utilized for any legal purposes in regards to investors’ investment results,
and the company hereby expressly disclaims any and all liability resulting from investors’ reliance on the information contained herein.
This document only speaks of the information as of the date they are made,
and the company is not responsible for providing updates contained in this document in light of new information or future events.
Disclaimer
3
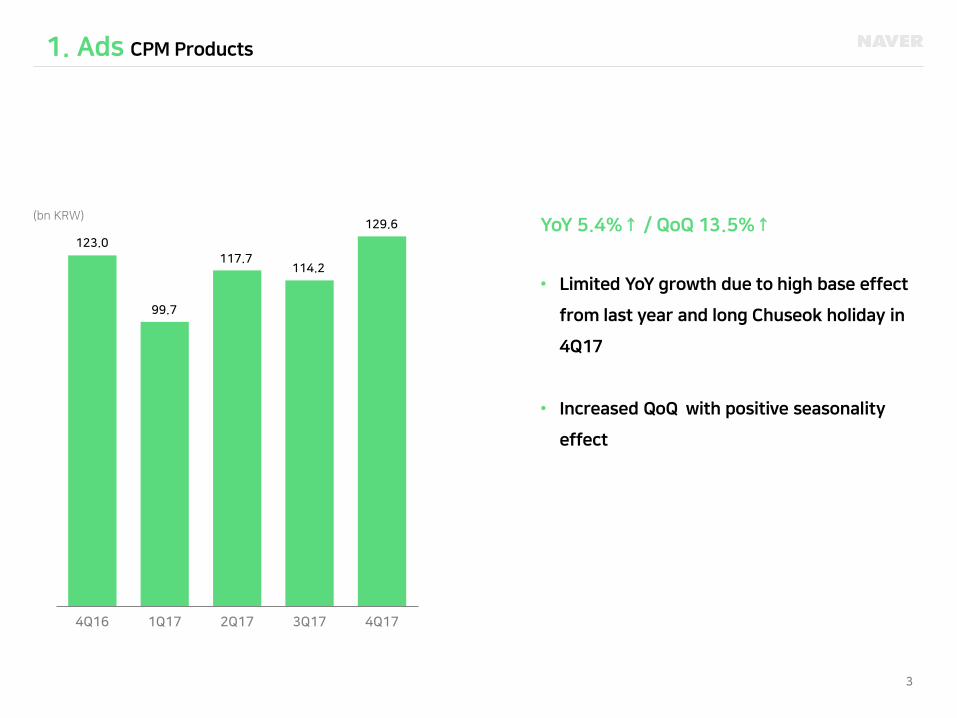
1. Ads CPM Products
(bn KRW) YoY 5.4%↑ / QoQ 13.5%↑
• Limited YoY growth due to high base effect
from last year and long Chuseok holiday in
4Q17
• Increased QoQ with positive seasonality
effect
4Q16 1Q17 2Q17 3Q17 4Q17
123.0
99.7
117.7 114.2
129.6
4
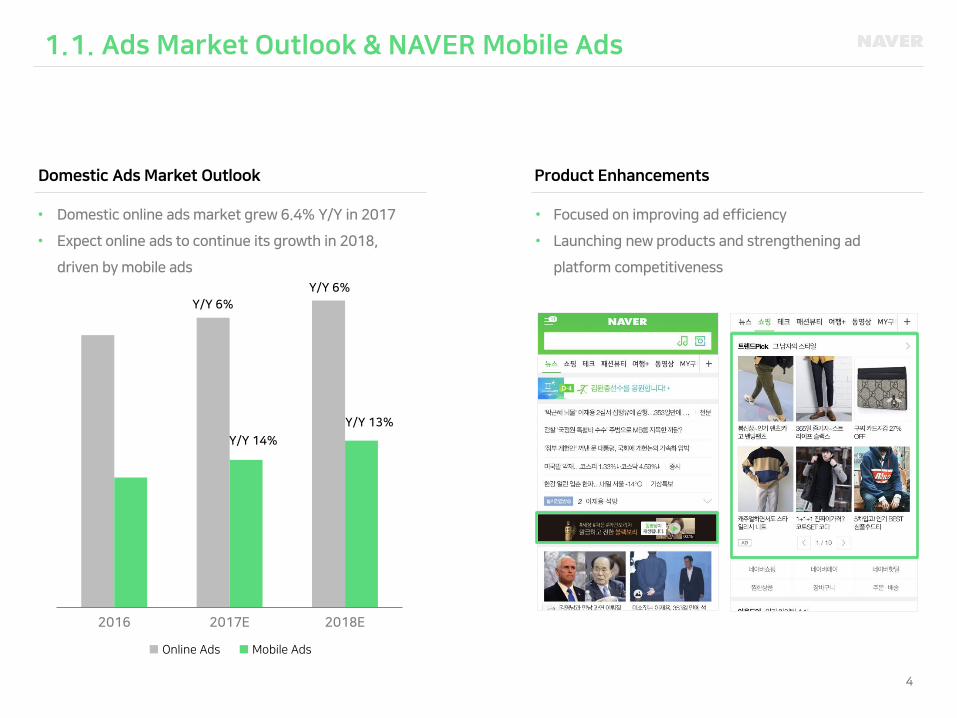
2016 2017E 2018E
Y/Y 13%
Y/Y 6%
Y/Y 14%
Y/Y 6%
1.1. Ads Market Outlook & NAVER Mobile Ads
Domestic Ads Market Outlook Product Enhancements
• Domestic online ads market grew 6.4% Y/Y in 2017
• Expect online ads to continue its growth in 2018,
driven by mobile ads
• Focused on improving ad efficiency
• Launching new products and strengthening ad
platform competitiveness
■ Online Ads ■ Mobile Ads
5
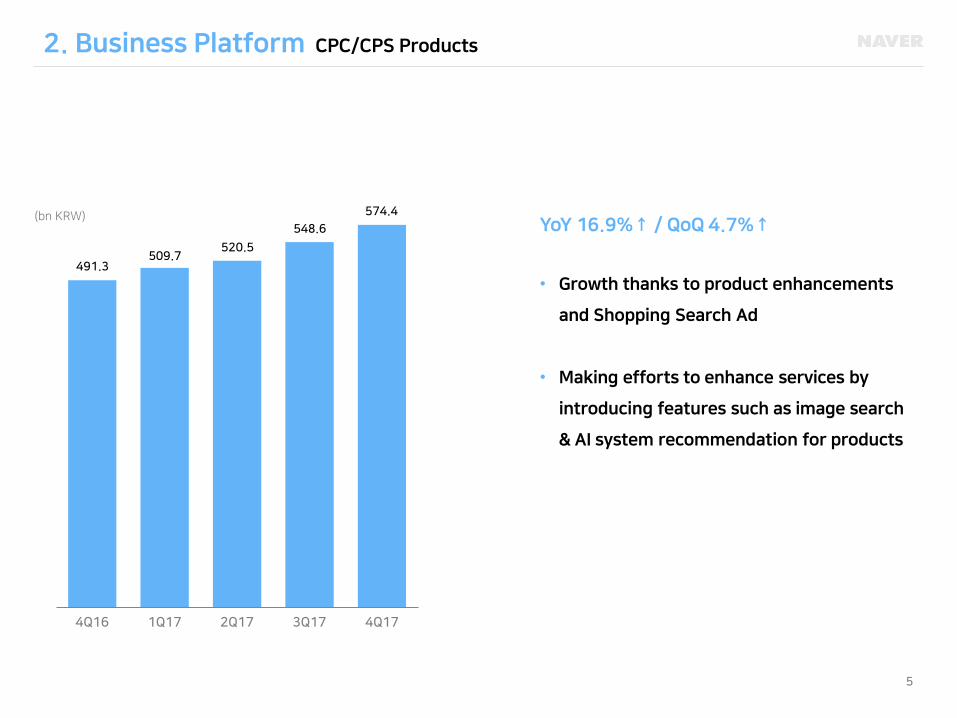
2. Business Platform CPC/CPS Products
(bn KRW) YoY 16.9%↑ / QoQ 4.7%↑
• Growth thanks to product enhancements
and Shopping Search Ad
• Making efforts to enhance services by
introducing features such as image search
& AI system recommendation for products
4Q16 1Q17 2Q17 3Q17 4Q17
491.3 509.7
520.5
548.6
574.4
6
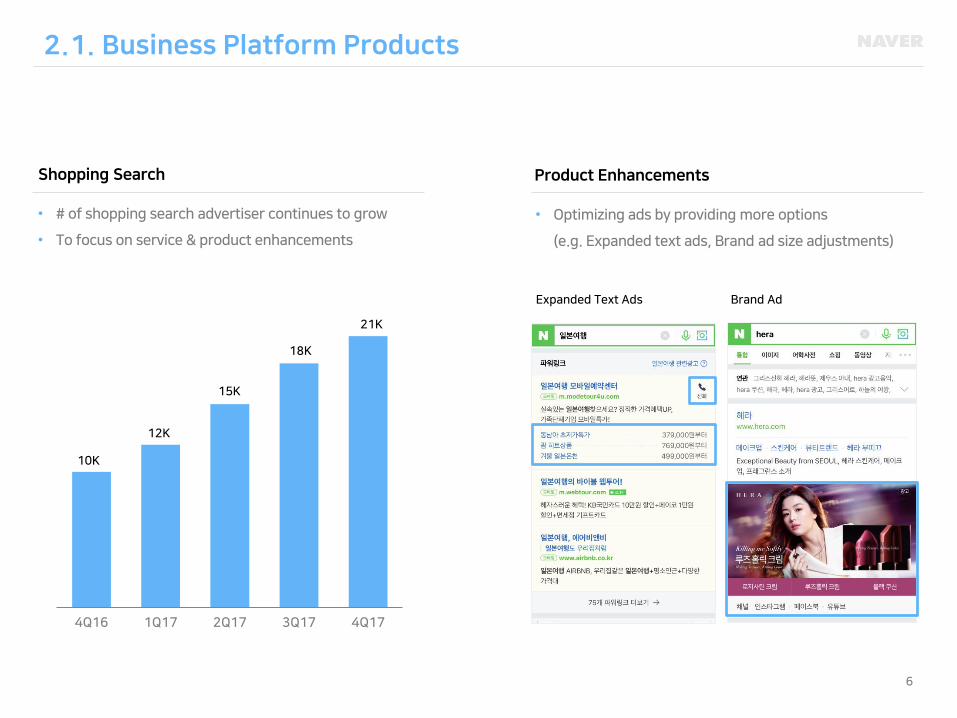
2.1. Business Platform Products
• # of shopping search advertiser continues to grow
• To focus on service & product enhancements
• Optimizing ads by providing more options
(e.g. Expanded text ads, Brand ad size adjustments)
Shopping Search Product Enhancements
10K
12K
15K
18K
21K
Expanded Text Ads Brand Ad
4Q16 1Q17 2Q17 3Q17 4Q17
7
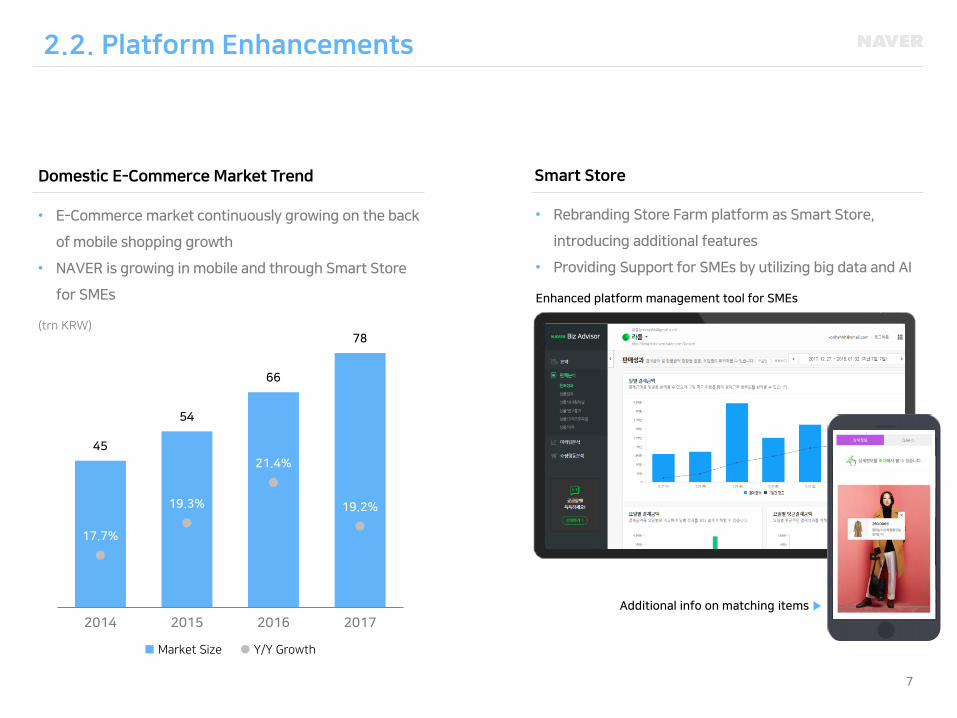
45
54
66
78
17.7%
19.3%
21.4%
19.2%
0
10
20
30
40
50
60
70
80
90
2014 2015 2016 2017
2.2. Platform Enhancements
• E-Commerce market continuously growing on the back
of mobile shopping growth
• NAVER is growing in mobile and through Smart Store
for SMEs
• Rebranding Store Farm platform as Smart Store,
introducing additional features
• Providing Support for SMEs by utilizing big data and AI
Domestic E-Commerce Market Trend Smart Store
(trn KRW)
Enhanced platform management tool for SMEs
Additional info on matching items ▶
■ Market Size ● Y/Y Growth
8
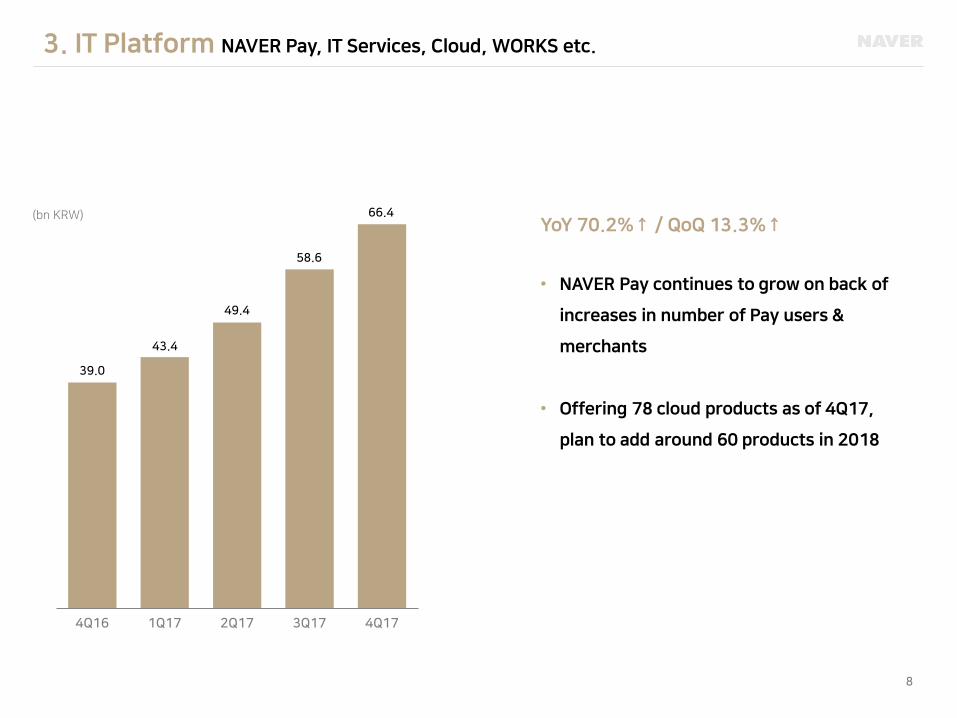
3. IT Platform NAVER Pay, IT Services, Cloud, WORKS etc.
(bn KRW) YoY 70.2%↑ / QoQ 13.3%↑
• NAVER Pay continues to grow on back of
increases in number of Pay users &
merchants
• Offering 78 cloud products as of 4Q17,
plan to add around 60 products in 2018
4Q16 1Q17 2Q17 3Q17 4Q17
39.0
43.4
49.4
58.6
66.4

9
30
37
47 51
56
63
71 74
78
Apr-17 Jun-17 Aug-17 Oct-17 Dec-17
• Enhancing offline payment via NAVER reservations
• Expanding usage through merchant acquisition
# of NAVER Pay Merchants (‘000)
3.1. IT Platform Products
• Offering 78 cloud products under 13 categories
• To expand product coverage & enhance service quality
NAVER Pay NAVER Cloud Platform
# of NAVER Cloud Products
122
137
160
180 185
4Q16 1Q17 2Q17 3Q17 4Q17
10
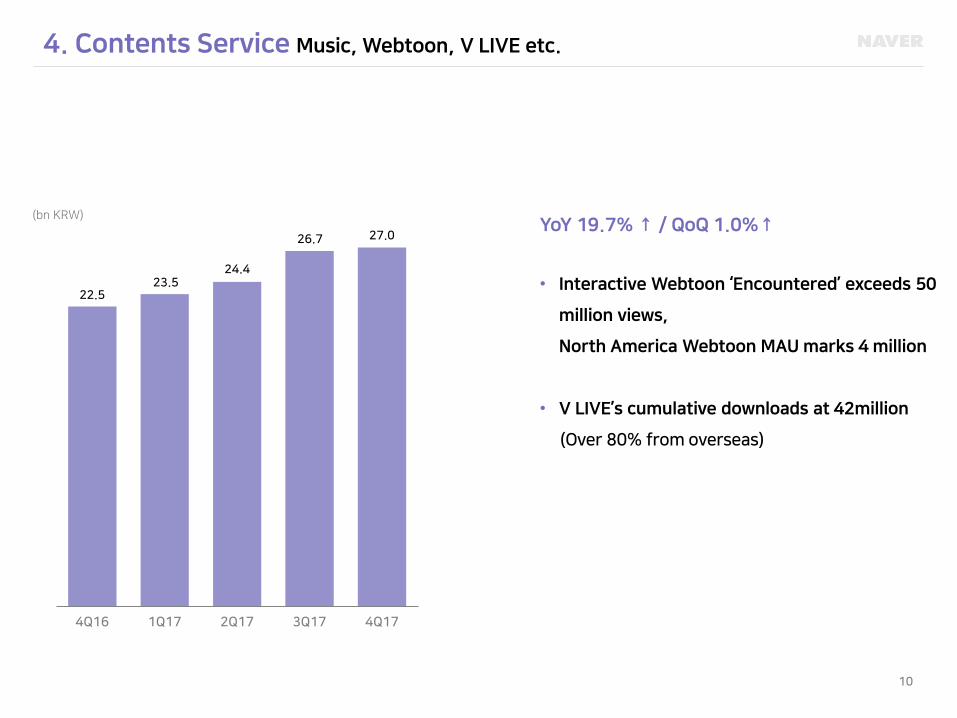
4. Contents Service Music, Webtoon, V LIVE etc.
(bn KRW) YoY 19.7% ↑ / QoQ 1.0%↑
• Interactive Webtoon ‘Encountered’ exceeds 50
million views,
North America Webtoon MAU marks 4 million
• V LIVE’s cumulative downloads at 42million
(Over 80% from overseas)
4Q16 1Q17 2Q17 3Q17 4Q17
22.5 23.5
24.4
26.7 27.0
11
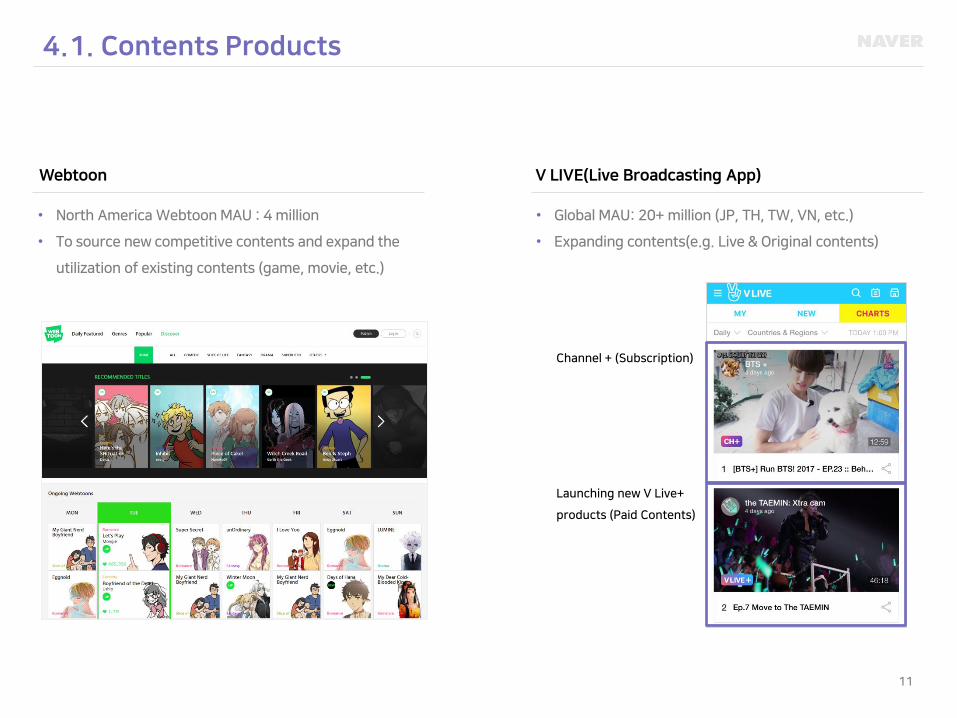
4.1. Contents Products
• North America Webtoon MAU : 4 million
• To source new competitive contents and expand the
utilization of existing contents (game, movie, etc.)
• Global MAU: 20+ million (JP, TH, TW, VN, etc.)
• Expanding contents(e.g. Live & Original contents)
Webtoon V LIVE(Live Broadcasting App)
Channel + (Subscription)
Launching new V Live+
products (Paid Contents)
12
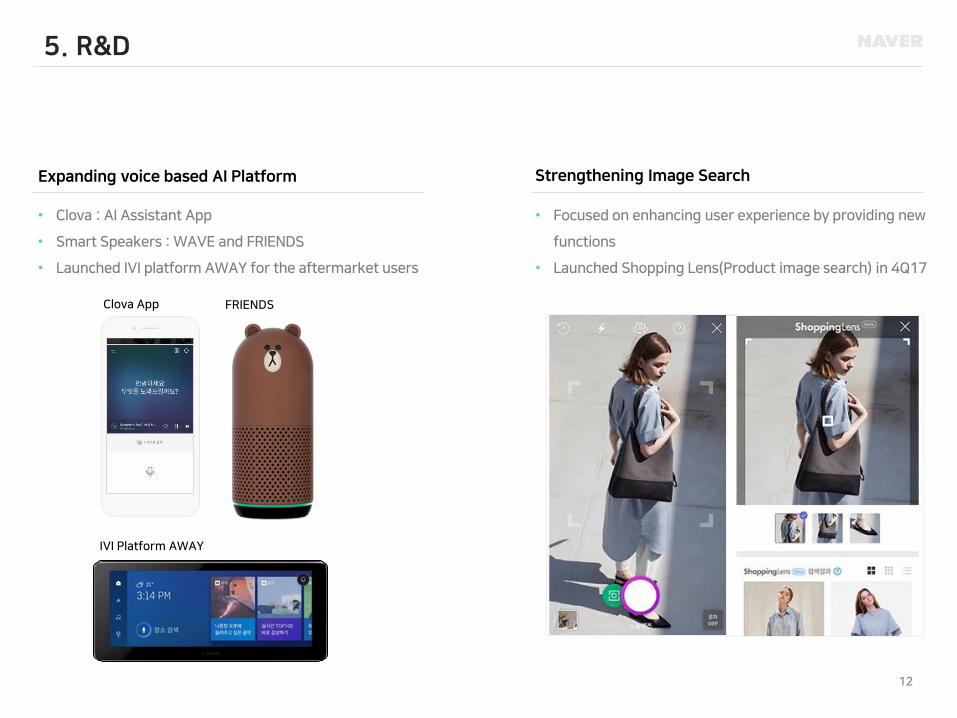
• Clova : AI Assistant App
• Smart Speakers : WAVE and FRIENDS
• Launched IVI platform AWAY for the aftermarket users
• Focused on enhancing user experience by providing new
functions
• Launched Shopping Lens(Product image search) in 4Q17
5. R&D
Expanding voice based AI Platform
Clova App FRIENDS
Strengthening Image Search
IVI Platform AWAY
13
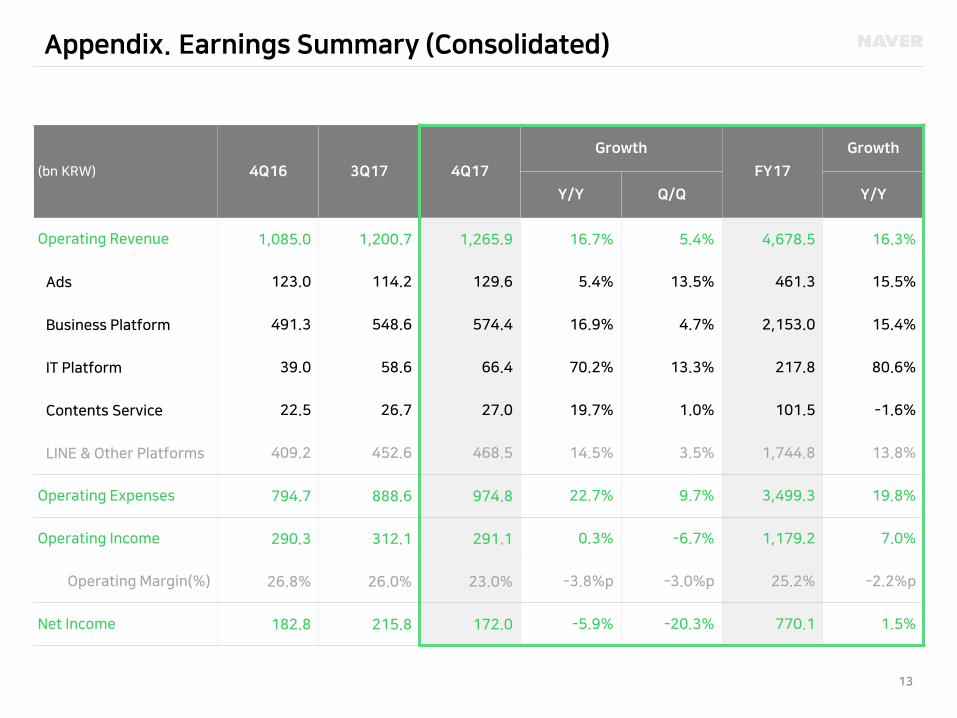
Appendix. Earnings Summary (Consolidated)
(bn KRW) 4Q16 3Q17 4Q17
Growth
FY17
Growth
Y/Y Q/Q Y/Y
Operating Revenue 1,085.0 1,200.7 1,265.9 16.7% 5.4% 4,678.5 16.3%
Ads 123.0 114.2 129.6 5.4% 13.5% 461.3 15.5%
Business Platform 491.3 548.6 574.4 16.9% 4.7% 2,153.0 15.4%
IT Platform 39.0 58.6 66.4 70.2% 13.3% 217.8 80.6%
Contents Service 22.5 26.7 27.0 19.7% 1.0% 101.5 -1.6%
LINE & Other Platforms 409.2 452.6 468.5 14.5% 3.5% 1,744.8 13.8%
Operating Expenses 794.7 888.6 974.8 22.7% 9.7% 3,499.3 19.8%
Operating Income 290.3 312.1 291.1 0.3% -6.7% 1,179.2 7.0%
Operating Margin(%) 26.8% 26.0% 23.0% -3.8%p -3.0%p 25.2% -2.2%p
Net Income 182.8 215.8 172.0 -5.9% -20.3% 770.1 1.5%
14
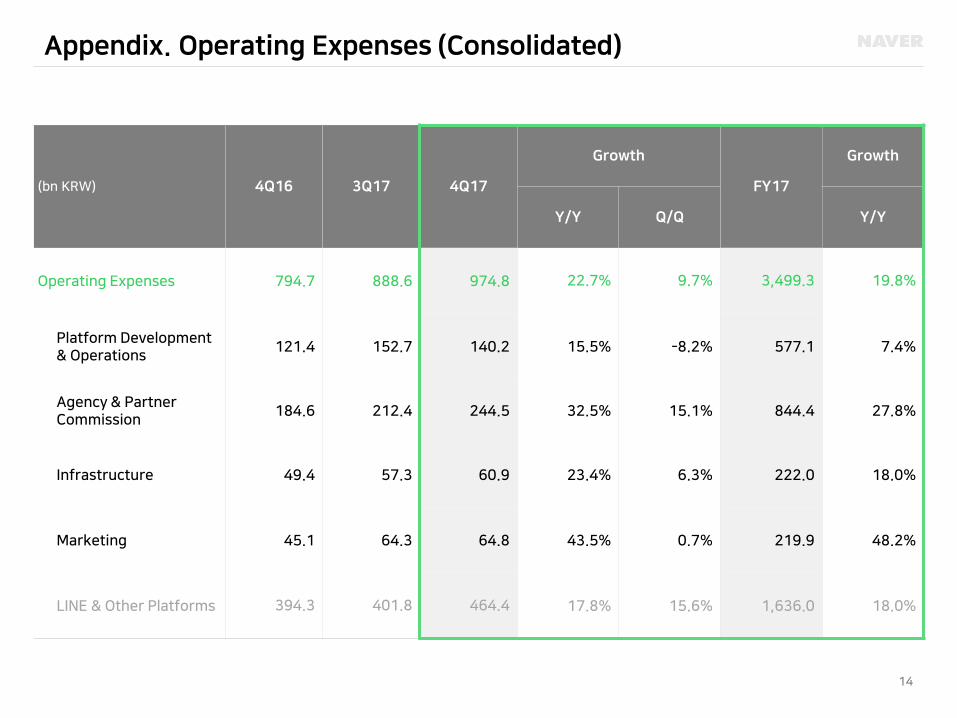
Appendix. Operating Expenses (Consolidated)
(bn KRW) 4Q16 3Q17 4Q17
Growth
FY17
Growth
Y/Y Q/Q Y/Y
Operating Expenses 794.7 888.6 974.8 22.7% 9.7% 3,499.3 19.8%
Platform Development & Operations
121.4 152.7 140.2 15.5% -8.2% 577.1 7.4%
Agency & Partner Commission
184.6 212.4 244.5 32.5% 15.1% 844.4 27.8%
Infrastructure 49.4 57.3 60.9 23.4% 6.3% 222.0 18.0%
Marketing 45.1 64.3 64.8 43.5% 0.7% 219.9 48.2%
LINE & Other Platforms 394.3 401.8 464.4 17.8% 15.6% 1,636.0 18.0%