Embed Size (px)
Citation preview
Irrational Exuberance in the U.S. Housing Market: Were Evangelicals Left Behind?
Christopher Crowe
WP/09/57

© 2009 International Monetary Fund WP/09/57 IMF Working Paper Research Department
Irrational Exuberance in the U.S. Housing Market: Were Evangelicals Left Behind?
Prepared by Christopher Crowe
Authorized for distribution by Atish Ghosh1
March 2009
Abstract
This Working Paper should not be reported as representing the views of the IMF. The views expressed in this Working Paper are those of the author(s) and do not necessarily represent those of the IMF or IMF policy. Working Papers describe research in progress by the author(s) and are published to elicit comments and to further debate.
The recent housing bust has reignited interest in psychological theories of speculative excess (Shiller, 2007). I investigate this issue by identifying a segment of the U.S. population—evangelical protestants—that may be less prone to speculative motives, and uncover a significant negative relationship between their population share and house price volatility. Evangelicals’ focus on Biblical prophecy could account for this difference, since it may enable them to interpret otherwise negative events as containing positive news, dampening the response of house prices to shocks. I provide evidence for this channel using a popular internet measure of “prophetic activity” and a 9/11 event study. I also analyze survey data covering religious beliefs and asset holding, and find that ‘end times’ beliefs are associated with a one-third decline in net worth, consistent with these beliefs providing a form of psychic insurance (Scheve and Stasavage, 2006a and 2006b) that reduces asset demand. JEL Classification Numbers: E21, R21, Z12 Keywords:
house prices, economics of Religion, asset price cycles
Author’s E-Mail Address: [email protected]
1The author would like to thank Marcos Chamon, Julian Di Giovanni, Andre Faria, Rodney Ramcharan and Romain Ranciere for helpful discussions; Giovanni Dell’Ariccia, Deniz Igan, Luc Laeven, Joseph Gyourko, Albert Saiz, Carl Gwin and Charles North for sharing or helping to access data; and Paul S. Boyer, Larry Iannaccone, Lisa Keister, Charles North, David Stasavage and seminar participants at the IMF, CESR and the annual meetings of the CEA for comments on an earlier draft of the paper. All remaining errors are my own.
2
Contents Page
I. Introduction . ...............................................................................................................3 II. Evangelicals and House Price Volatility.....................................................................9 A. Empirical Specification and Results ...................................................................9 B. Discussion .........................................................................................................12 III. 9/11 Event Study.......................................................................................................14 IV. Panel Study ...............................................................................................................15 A. Model and Predictions ......................................................................................15 B. Data and Empirical Strategy .............................................................................18 C. Results and Discussion......................................................................................19 V. End Times Beliefs and Asset Holdings.....................................................................22 VI. Conclusions................................................................................................................25 References..........................................................................................................................27 Tables: 1. Descriptive Statistics.................................................................................................11 2. Regression Results ....................................................................................................12 3. Descriptive Statistics.................................................................................................20 4. Regression Results ....................................................................................................21 5. Counterfactual Exercise ............................................................................................22 6. Regression Results ....................................................................................................24 Figures: 1. House Price Volatility and Evangelical Population....................................................4 2. Average House Price Growth .....................................................................................4 3. Quarterly House Price Growth and Share of Evangelicals.......................................15 4. The Rapture Index and Subcategories ......................................................................17 5. The Rapture Index.....................................................................................................18 Appendix I. Data Descriptions and Sources ......................................................................30
3
I. INTRODUCTION
The recent U.S. housing boom and bust has strengthened the perception that ‘irrational exuberance’ as much as fundamental factors explain price developments. For instance, Shiller (2007) argues that
it does not appear possible to explain the boom in terms of fundamentals such as rents or construction costs. A psychological theory, that represents the boom as taking place because of a feedback mechanism or social epidemic ... fits the evidence better.
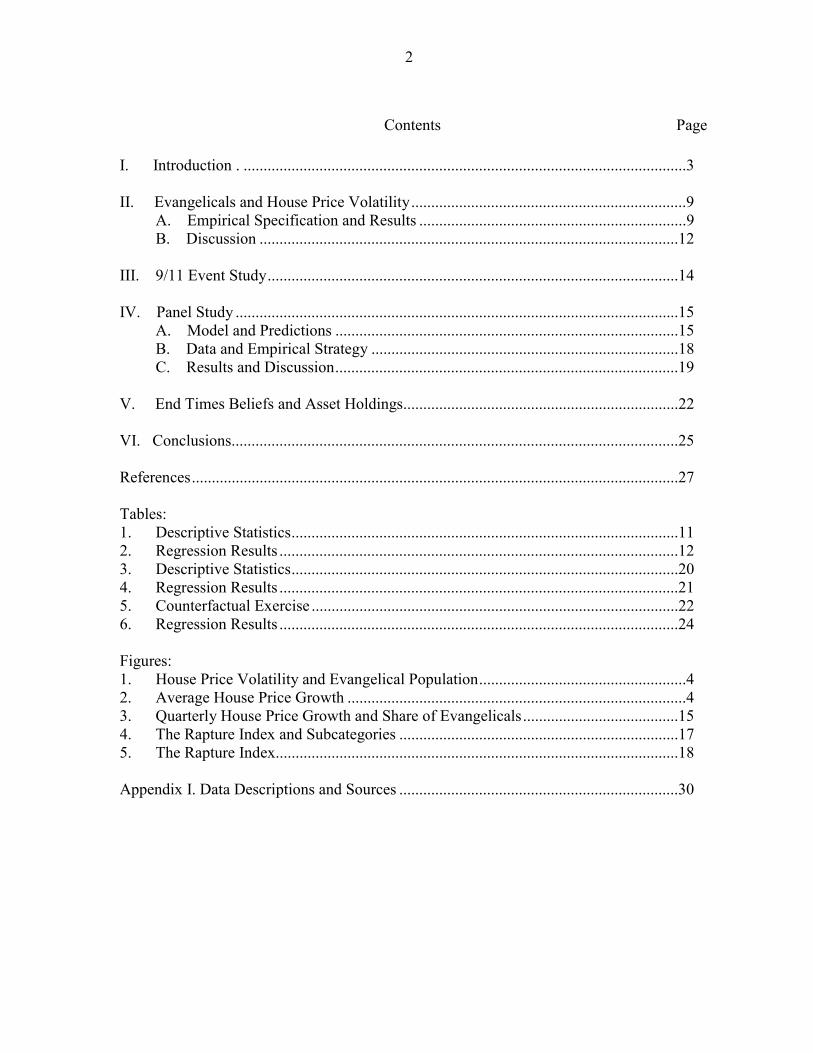
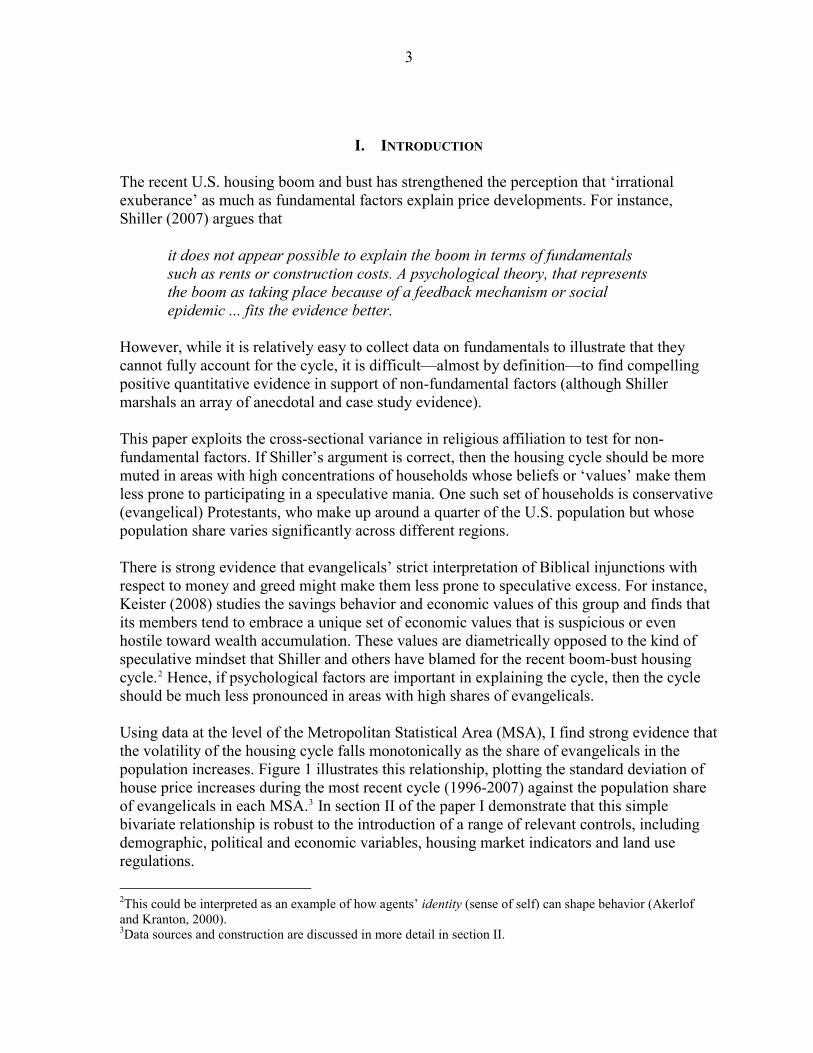
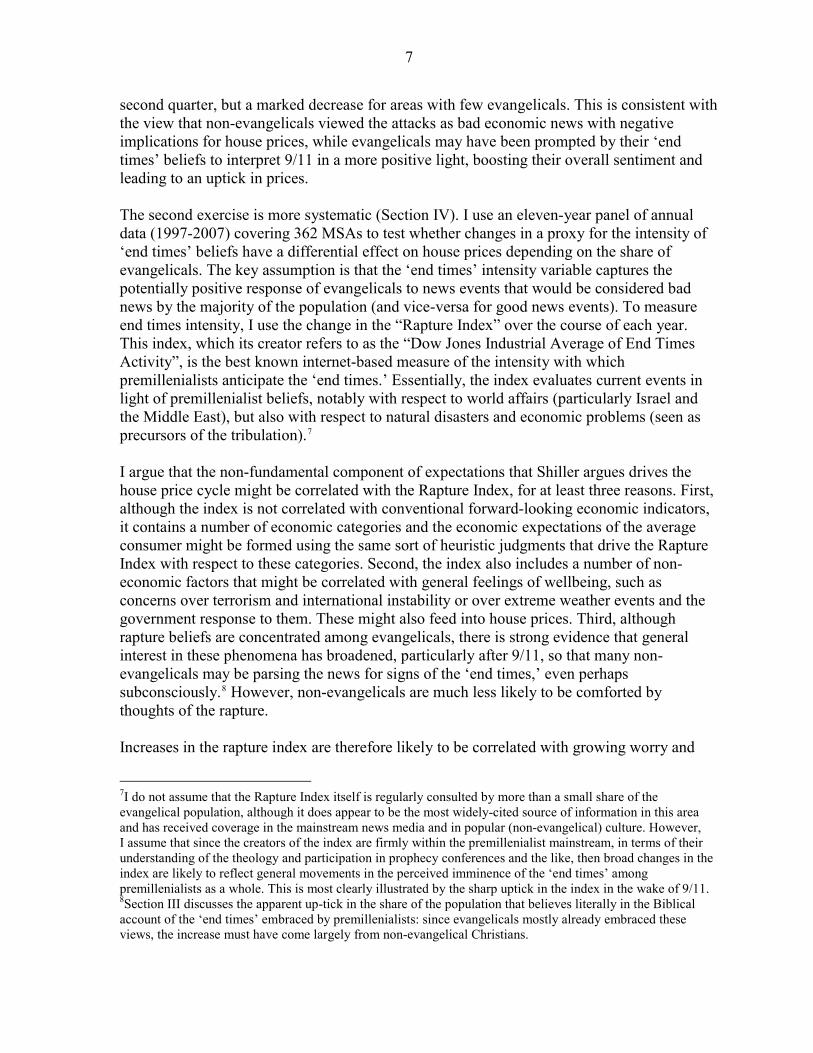
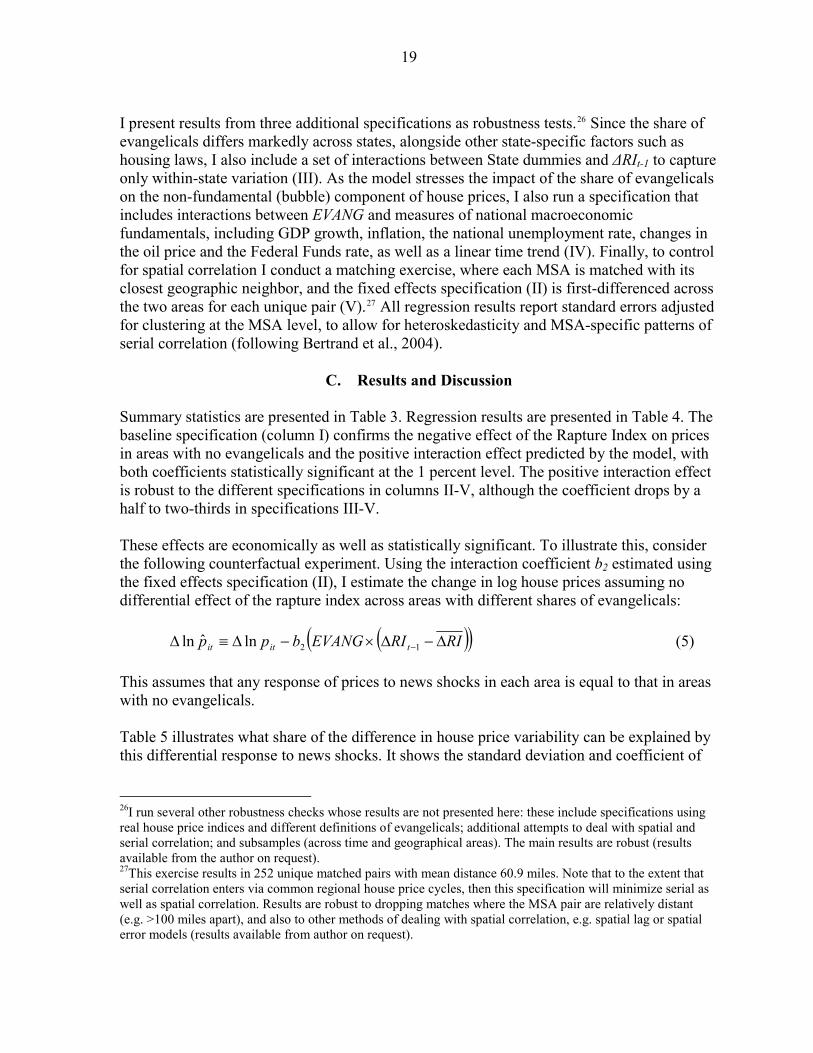
However, while it is relatively easy to collect data on fundamentals to illustrate that they cannot fully account for the cycle, it is difficult—almost by definition—to find compelling positive quantitative evidence in support of non-fundamental factors (although Shiller marshals an array of anecdotal and case study evidence). This paper exploits the cross-sectional variance in religious affiliation to test for non-fundamental factors. If Shiller’s argument is correct, then the housing cycle should be more muted in areas with high concentrations of households whose beliefs or ‘values’ make them less prone to participating in a speculative mania. One such set of households is conservative (evangelical) Protestants, who make up around a quarter of the U.S. population but whose population share varies significantly across different regions. There is strong evidence that evangelicals’ strict interpretation of Biblical injunctions with respect to money and greed might make them less prone to speculative excess. For instance, Keister (2008) studies the savings behavior and economic values of this group and finds that its members tend to embrace a unique set of economic values that is suspicious or even hostile toward wealth accumulation. These values are diametrically opposed to the kind of speculative mindset that Shiller and others have blamed for the recent boom-bust housing cycle.2 Hence, if psychological factors are important in explaining the cycle, then the cycle should be much less pronounced in areas with high shares of evangelicals. Using data at the level of the Metropolitan Statistical Area (MSA), I find strong evidence that the volatility of the housing cycle falls monotonically as the share of evangelicals in the population increases. Figure 1 illustrates this relationship, plotting the standard deviation of house price increases during the most recent cycle (1996-2007) against the population share of evangelicals in each MSA.3 In section II of the paper I demonstrate that this simple bivariate relationship is robust to the introduction of a range of relevant controls, including demographic, political and economic variables, housing market indicators and land use regulations.
2This could be interpreted as an example of how agents’ identity (sense of self) can shape behavior (Akerlof and Kranton, 2000). 3Data sources and construction are discussed in more detail in section II.
4
Figure 1. House Price Volatility and Evangelical Population
0.0
2.0
4.0
6.0
8.1
SD
of a
nnua
l hou
se p
rice
grow
th, 1
996-
2007
0 .2 .4 .6Population share of evangelicals, 2000
House price volatility and evangelical population
Figure 2. Average House Price Growth
0.0
5.1
.15
1980 1985 1990 1995 2000 2005
Top Quartile Bottom Quartile
by share of evangelicals (top and bottom quartiles)Average house price growth
5
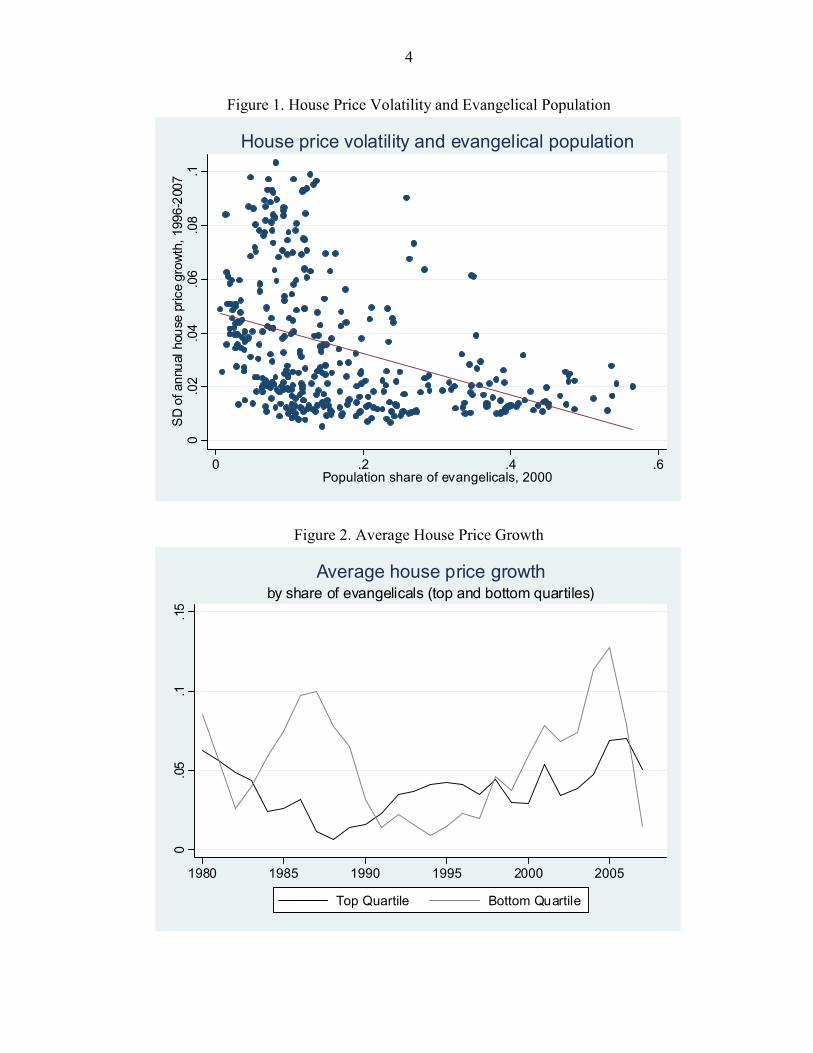
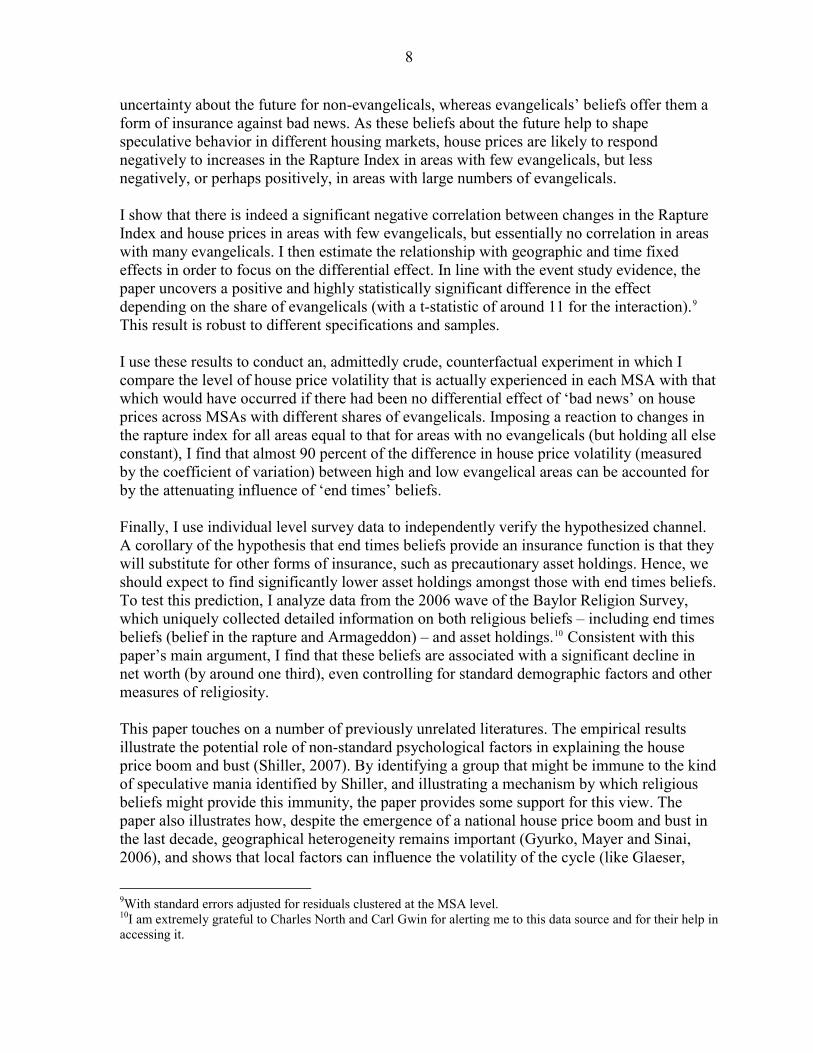
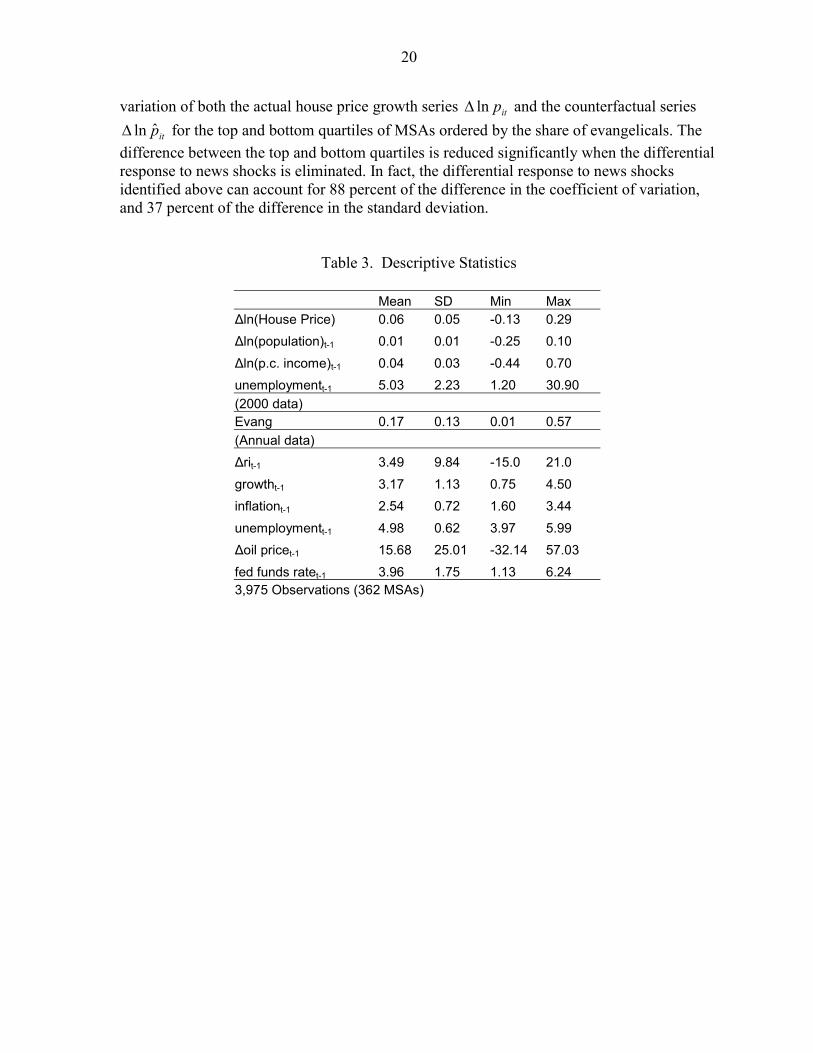
Figure 2 makes the same point somewhat differently: it shows the average annual house price increase since 1980 for the top and bottom quartile of MSAs, ranked by the share of evangelicals. Both the current and previous cycle are clearly more muted in more evangelical areas. I then attempt to investigate in more depth the mechanism that might be driving these results. Since ‘irrational exuberance’ or speculative excess is based on a particular set of (inflated) expectations about the future, I analyze how evangelicals’ own beliefs about the future—in particular, where these views differ systematically from those of the general public—might play an important role in sheltering them from speculative mania. While evangelicals embrace a diverse set of views about the future, a common theme is the belief in the imminent return of Jesus Christ and a view that we are therefore currently living in the ‘end times’. These views are most widely associated with Dispensational Premillenialism, a once-obscure nineteenth century interpretation of Biblical prophecy centered on the ‘rapture’ or accession of true believers to heaven that is now the dominant eschatological (end times) framework amongst evangelicals.4 While premillenialism is most strongly associated with the most conservative, or ‘fundamentalist’, evangelical denominations, polling evidence suggests that its view of the ‘end times’ is the majority one for evangelicals as a whole. For instance, a 1999 poll for Newsweek found that around 71 percent of evangelical Protestants believed that the world would end exactly as prophesied in the Bible, compared to only 28 percent of non-evangelical Protestants and just 18 percent of Catholics (Newsweek, October
4, 1999).
he
2 The prevalence of premillenialist thinking among evangelicals could help to account for t
4Dispensational premillenialism has deep roots among American conservative Protestants, but its interpretation of the Bible’s account of the ‘end times’ was not always in the ascendancy (Boyer, 1992; Grenz, 2004; Kilde, 2004). However, global events since the second world war, including in particular the dropping of the atomic bombs on Japan, the creation of the state of Israel, and the Cold War, lent credence to this belief system. Premillenialism (or dispensationalism) is now the dominant eschatological viewpoint for conservative evangelical Christians (Grenz, 2004). Central to the dispensationalist philosophy is the belief, based on a literal reading of the Bible’s book of Revelation, that a period of ‘tribulation’—a time of extreme and terrible events during which the Antichrist will rule on earth—will commence with the ‘rapture’ or physical ascension of true believers to heaven. The tribulation will end after seven years with the ‘Battle of Armageddon’ in which Jesus Christ will return to earth, vanquish the forces of evil in concert with Israel (whose Jewish population will convert to Christianity), and establish a 1,000-year earthly kingdom. A final battle between good and evil and judgment day will follow (Grenz, 2004). While ‘end times’ beliefs are particularly important for evangelicals, and this group tend to have the most detailed knowledge of premillenialist thinking, opinion surveys suggest that half of Americans believe that the world will end as prophesied in the Bible. For instance, a 1999 poll for Newsweek found that 40 percent of Americans believed that the world would end in the Battle of Armageddon (Newsweek, October 24, 1999). Of these, 47 percent expected it to occur in their lifetime, while 15 percent expected it to occur within the next year. A 2004 poll for Newsweek found an apparent uptick in these beliefs, with 55 percent of the population reportedly believing that the faithful would be taken to heaven in the ‘rapture’ (Denver Post, April 10, 2005). A popular series of novels set during the ‘tribulation,’ the Left Behind series (authored by Tim LaHaye and Jerry B. Jenkins), had sold a total of 65 million copies as of 2007 (source: http://www.leftbehind.com). The tenth title in the series was the best-selling fiction title in the United States in 2001, while a May, 2001 poll found that 9 percent of U.S. adults—overwhelmingly evangelicals—had read at least one of the books in the series (Forbes, 2004).
6
low rates of asset accumulation and the belief that saving for retirement is not important documented by Keister (2008). There is also historic evidence of premillenialists selling altheir possessions in expectation of Christ’s imminent return, including most famously the Millerites of the 1840s (Kilde, 2004), while contemporary press accounts include examples of people selling their houses or cutting
l
short their education for the same reason (Christian cience Monitor, February 18, 2004).5
a
Jesus’s
n experience less house price volatility, such
ehavior would run counter to the evidence.
nt
r.” This could have veral effects on speculative behavior, of which I highlight one here.
y
. In this sense, end times beliefs act as a form of insurance against dverse events.
9/11
ilde, 1
S However, the response of evangelicals is generally more subtle. For instance, ‘end times’writers quote Jesus’s parable (Luke 19: 12-26) cautioning his followers to “occupy till I come.” The parable describes a nobleman who entrusts his savings to his servants ahead offoreign trip, and on his return praises those servants who have invested the money and are able to return it with interest, while castigating the servant who simply holds the original sum for safe-keeping. The parable has been interpreted by end times writers as indicating the need to behave wisely in all spheres of life (including the economic) even while expectingreturn.6 In other words, one should not expect evangelicals to respond to heightened expectations of the ‘end times’ by disposing of property or going on a sudden consumptiobinge. In fact, since heavily evangelical areasb I argue instead that the key aspect of premillenialism that could explain why more evangelical areas experience less volatile house prices is its emphasis on interpreting curreevents in light of Biblical prophecy: what Grenz (2004) refers to as “the dispensationalist admonition to read the newspaper in one hand and the Bible in the othese Many pieces of information that would be viewed as bad news by the public at large—for instance, the 2001 terrorist attacks or hurricane Katrina in 2005—may be interpreted as the fulfillment of crucial Biblical prophecies by dispensationalists and hence as precursors of therapture—i.e. as good news. For instance, Todd Strandberg—author of the popular prophecwebsite www.RaptureReady.com and creator of the “Rapture Index”—confessed to Time magazine to being “joyful” that the September 11 attacks could be a sign that the end times were near (Time, 7/1/02)a To test for this effect, I undertake two exercises. The first is an event study based on the attacks (Section III). There is ample evidence that the attacks were interpreted by some fundamentalists and premillenialists as “indications that Christ’s return is imminent” (K2004). Comparing house price growth in the second quarter and fourth quarter of 200(immediately before and after the attacks), there is a clear differential effect on areas depending on their population share of evangelicals. There is a marked increase in house price growth in areas with large shares of evangelicals in the fourth quarter, compared to the
5According to an April, 13, 1998 report in the New York Times, it was also possible to obtain rapture insurance up until relatively recently, when pressure from within the insurance industry (rather than a lack of demand) halted the practice. 6I am grateful to Paul Boyer for bringing this point to my attention.
7
second quarter, but a marked decrease for areas with few evangelicals. This is consistenthe view that non-evangelicals viewed the attacks as bad economic news with negative implications for house prices, while evangelicals may have been prompted by their ‘end times’ beliefs to interpret 9/11
t with
in a more positive light, boosting their overall sentiment and ading to an uptick in prices.
ty of
nd Times
respect to natural disasters and economic problems (seen as recursors of the tribulation).7
,
ure n-
the
ral on-
er, non-evangelicals are much less likely to be comforted by oughts of the rapture.
le The second exercise is more systematic (Section IV). I use an eleven-year panel of annual data (1997-2007) covering 362 MSAs to test whether changes in a proxy for the intensi‘end times’ beliefs have a differential effect on house prices depending on the share of evangelicals. The key assumption is that the ‘end times’ intensity variable captures the potentially positive response of evangelicals to news events that would be considered bad news by the majority of the population (and vice-versa for good news events). To measureend times intensity, I use the change in the “Rapture Index” over the course of each year. This index, which its creator refers to as the “Dow Jones Industrial Average of EActivity”, is the best known internet-based measure of the intensity with which premillenialists anticipate the ‘end times.’ Essentially, the index evaluates current events in light of premillenialist beliefs, notably with respect to world affairs (particularly Israel and the Middle East), but also with p I argue that the non-fundamental component of expectations that Shiller argues drives the house price cycle might be correlated with the Rapture Index, for at least three reasons. First, although the index is not correlated with conventional forward-looking economic indicatorsit contains a number of economic categories and the economic expectations of the average consumer might be formed using the same sort of heuristic judgments that drive the RaptIndex with respect to these categories. Second, the index also includes a number of noeconomic factors that might be correlated with general feelings of wellbeing, such as concerns over terrorism and international instability or over extreme weather events and government response to them. These might also feed into house prices. Third, although rapture beliefs are concentrated among evangelicals, there is strong evidence that geneinterest in these phenomena has broadened, particularly after 9/11, so that many nevangelicals may be parsing the news for signs of the ‘end times,’ even perhaps subconsciously.8 Howevth Increases in the rapture index are therefore likely to be correlated with growing worry and
7I do not assume that the Rapture Index itself is regularly consulted by more than a small share of the evangelical population, although it does appear to be the most widely-cited source of information in this area and has received coverage in the mainstream news media and in popular (non-evangelical) culture. However, I assume that since the creators of the index are firmly within the premillenialist mainstream, in terms of their understanding of the theology and participation in prophecy conferences and the like, then broad changes in the index are likely to reflect general movements in the perceived imminence of the ‘end times’ among premillenialists as a whole. This is most clearly illustrated by the sharp uptick in the index in the wake of 9/11. 8Section III discusses the apparent up-tick in the share of the population that believes literally in the Biblical account of the ‘end times’ embraced by premillenialists: since evangelicals mostly already embraced these views, the increase must have come largely from non-evangelical Christians.
8
uncertainty about the future for non-evangelicals, whereas evangelicals’ beliefs offeform of insurance against bad news. As these beliefs about the future help to shape speculative behavior in different housing markets, house prices are likely to respond negatively to increases in the Rapture Index in areas with few evangelicals, but
r them a
less egatively, or perhaps positively, in areas with large numbers of evangelicals.
eas
ce, the
round 11 for the interaction).9 his result is robust to different specifications and samples.
at
e
w evangelical areas can be accounted for y the attenuating influence of ‘end times’ beliefs.
fs.
es
third), even controlling for standard demographic factors and other easures of religiosity.
d s
n
r,
n I show that there is indeed a significant negative correlation between changes in the Rapture Index and house prices in areas with few evangelicals, but essentially no correlation in arwith many evangelicals. I then estimate the relationship with geographic and time fixed effects in order to focus on the differential effect. In line with the event study evidenpaper uncovers a positive and highly statistically significant difference in the effect depending on the share of evangelicals (with a t-statistic of aT I use these results to conduct an, admittedly crude, counterfactual experiment in which I compare the level of house price volatility that is actually experienced in each MSA with thwhich would have occurred if there had been no differential effect of ‘bad news’ on house prices across MSAs with different shares of evangelicals. Imposing a reaction to changes in the rapture index for all areas equal to that for areas with no evangelicals (but holding all elsconstant), I find that almost 90 percent of the difference in house price volatility (measured by the coefficient of variation) between high and lob Finally, I use individual level survey data to independently verify the hypothesized channel. A corollary of the hypothesis that end times beliefs provide an insurance function is that they will substitute for other forms of insurance, such as precautionary asset holdings. Hence, we should expect to find significantly lower asset holdings amongst those with end times belieTo test this prediction, I analyze data from the 2006 wave of the Baylor Religion Survey, which uniquely collected detailed information on both religious beliefs – including end timbeliefs (belief in the rapture and Armageddon) – and asset holdings.10 Consistent with this paper’s main argument, I find that these beliefs are associated with a significant decline in net worth (by around onem This paper touches on a number of previously unrelated literatures. The empirical results illustrate the potential role of non-standard psychological factors in explaining the house price boom and bust (Shiller, 2007). By identifying a group that might be immune to the kinof speculative mania identified by Shiller, and illustrating a mechanism by which religioubeliefs might provide this immunity, the paper provides some support for this view. The paper also illustrates how, despite the emergence of a national house price boom and bust ithe last decade, geographical heterogeneity remains important (Gyurko, Mayer and Sinai, 2006), and shows that local factors can influence the volatility of the cycle (like Glaese
9With standard errors adjusted for residuals clustered at the MSA level. 10I am extremely grateful to Charles North and Carl Gwin for alerting me to this data source and for their help in accessing it.
9
Gyourko and Saiz, 2008, who discuss the role of local planning restrictions on supply elasticity and hence price volatility, and Favara and Song, 2008, who argue that house prices are higher in areas where agents’ beliefs are more dispersed). The paper can also be related to an earlier empirical literature on the economic response to expectations about adverse eventhat found that fear of a nuclear holocaust adversely affected savings during the Cold Wa(Russert, Cowden, Kinsella and Mur
ts r
ray, 1994; Russert and Slemrod, 1993; Russert and ackey, 1987; and Slemrod, 1986).
heve rse
to
ion’s
s belief, in helping to dampen speculative excess and reduce boom-bust housing cycles.
II. EVANGELICALS AND HOUSE PRICE VOLATILITY
A. Empirical Specification and Results
) and the volatility of home prices that MSA. Equation (1) gives the general specification:
(1)
s)
ae
available for a large and disaggregated set of geographical areas.12 Data is available for 362
L The paper also contributes to a growing literature on the economic effects of religion (Iannaccone, 1998 provides an early survey, while recent contributions include those by Barro and McCleary, 2003 and Guiso, Sapienza and Zingales, 2003). More specifically, the paper illustrates how religion can provide a form of insurance against adverse events (Scand Stasavage, 2006a and 2006b). By allowing evangelicals to view potentially adveexternal developments as implying something positive about the future, I argue that premillenialist theology is a specific example of how religious belief can provide this insurance function. For instance, commentary on the Rapture Ready website, in response the financial turmoil in October 2008, argued that “the meltdown on Wall Street doesn’t worry me ... because I see the turmoil as a positive sign that the time for our departure isdrawing near.” (Nearing Midnight, 10/6/2008; www.raptureready.com). An interesting contrast with Scheve and Stasavage’s work, however, is that while in their analysis religinsurance role imposes negative externalities (by blocking social insurance), this paper suggests a positive role for religiou
In this section I estimate the reduced form relationship between the share of evangelicals in the population of each Metropolitan Statistical Area (MSAin
( ) iiii EVANGHPIolatility εβα +++=Δ ΓXlnV
The dependent variable of interest is the volatility of the (annual) change in the log houseprice index over 1996-2007 (from the end of the last cycle as identified by Glaeser et al (2008) to the latest available annual data; ΔlnHPI). I use the annual average of quarterly house price indices from repeated sales at the level of Metropolitan Statistical Areas (MSAavailable from the Office of Federal Housing Enterprise Oversight.11 The data is based on conventional conforming mortgage transactions obtained from Freddie Mac and Fannie Mand is available at a quarterly frequency. The principal advantage of this data over other similarly constructed and widely-used indices (such as the Case-Shiller index) is that it is
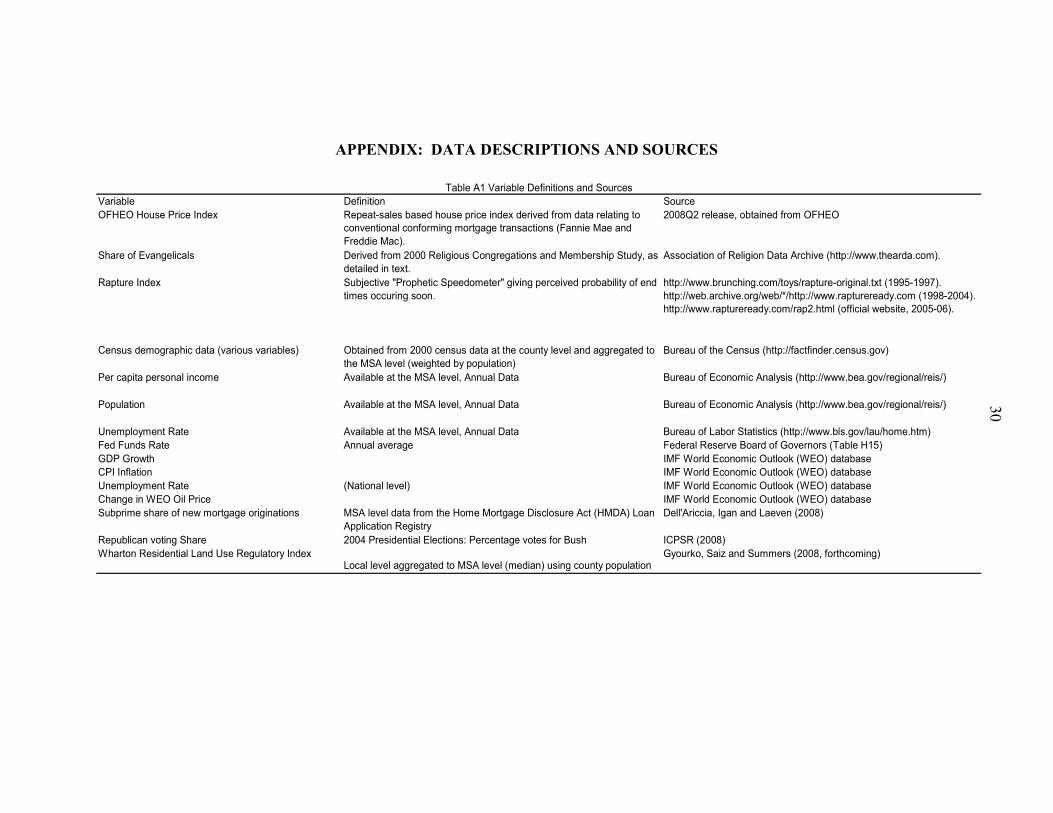
11See Table A1 for information on all variables and data sources employed in the paper. 12Implicitly, individual house prices within each MSA are aggregated geometrically to arrive at the overall
(continued)
10
MSAs. I use two volatility measures, the standard deviation (SD) and coefficient of variation (CV, the ratio of the SD to the mean). The key independent variable is the share of evangelicals per MSA, EVANG. Data on the share of various religious denominations is obtained from the 2000 Religious Congregations and Membership Study.13 Denominations are coded as Evangelical Protestant following Campbell (2006); in addition, independent (charismatic and non-charismatic) churches are also coded as Evangelical.14 I include up to 26 control variables in the vector X. Demographic data at the county level is obtained from the 2000 census and aggregated to the level of MSAs. These variables include the population shares of blacks, Hispanics, urban residents, over-65 year olds, foreign-born population, those with bachelor degrees or above, members of the armed forces and unmarried households, as well as the average commute time, median house price and median real estate taxes, and a measure of income dispersal (mean minus median household income). Annual data on per capita personal income growth and population growth at the MSA level is obtained from the Bureau of Economic Analysis. Annual unemployment data at the MSA level is obtained from the Bureau of Labor Statistics. I enter these controls in terms of mean and standard deviation; in addition I enter average log population and average log income per capita. To capture the impact of geography and climate, admittedly in a crude fashion, I include measures of latitude, longitude and longitude squared.15 I also use the Wharton residential land use regulatory index (WRLURI) from Gyourko et al (2008) as a control for the effect of planning regulations.16 Since religious and political affiliation can be highly correlated, I also include the Republican party vote share in the 2004 presidential elections as a measure of political partisan affiliation (ICPSR, 2008). Finally, to control for the importance of the subprime market in each area I include the average share of new mortgage originations accounted for by subprime lenders, using data obtained from Dell’Ariccia et al. (2008).
index. See Calhoun (1996) for an overview of the underlying methodology and data. 13A description of the data is available at http://www.thearda.com/Archive/Files/Descriptions/RCMSCY.asp. See Jones and others (2002) for more information. 14Campbell follows the ARDA researchers’ own coding of White Evangelical denominations, with the exception of the Community of Christ (see the Appendix to Campbell, 2006). I also include the two independent churches groupings following Mead, Hill and Atwood (2005, p. 318) who note that “the theology and doctrine of [these churches] ... vary according to the beliefs of the pastor, but in general they may be termed conservative evangelical.” 15Latitude is expected to enter monotonically due to the potential impact of climate from moving on the north-south axis. Longitude is entered to capture the effects of being located on the east or west coasts as opposed to the ‘heartland,’ and it is therefore entered with a quadratic term. To reduce the impact of geographical outliers in this specification, the two MSAs located in Hawaii and Alaska are dropped from this sample (their inclusion has no significant impact on the coefficient on EVANG). 16Glaeser et al (2008) argue that house price volatility is higher in areas with more restrictive land use regulations or greater geographic constraints on new building. Since areas with more evangelicals tend to be politically conservative, and therefore likely to favor fewer restrictions on property rights, it is important to condition on land use restrictions. The WRLURI is based on a survey of planning regulations in selected local jurisdictions (i.e. at the sub-MSA level). The (county population-weighted) median value is taken as representative for each MSA; these are available for 311 MSAs. Note that this measure is also highly correlated with the measure of physical/geographic constraints on new construction used by Glaeser et al (2008).
11
Table 1 presents summary statistics for all variables. Table 2 presents results of OLS regressions (to allow for spatial correlation, all columns report standard errors assuming residuals clustered by state). Column I presents the simple bivariate regression with the SD of house price growth as the dependent variable, confirming the significance of the negative relationship shown in Figure 1. Column II also includes mean house price growth, illusthat the standard deviation is strongly positively correlated with the mean. Hence, the remainder of the specifications use the coefficient of variation of house price growth as the dependent variable. Column III replicates column I with the new dependent variab
trating
le, while column IV also includes the regulatory index. Column V includes all 26 controls.
Table 1. Descr Statistics
Obs
iptive
Variable ervations Mean SD Min Max SD Δln(House Price) 362 0.034 0.025 0.005 0.103 CV Δln(House Price) 362 0.590 0.280 0.160 1.646 Mean Δln(House Price) 362 0.053 0.017 0.022 0.102 EVANG 362 0.173 0.129 0.006 0.566 Mean Δln(Population) 362 0.010 0.010 -0.022 0.064 Mean Δln(Income per capita)
t Rate
) te
1e per capita) 1
c
Time (minutes) 2 1
me ($) 1 4 4
0 0
prime Mortgage Loans by value -0 -
sidential Election, percent for Bush
Longitude2 362 8,787.3 3,155.6 4,722.8 24,975.3
362 0.040 0.006 0.016 0.059 Mean Unemploymen 362 5.032 1.943 2.464 20.909 SD Δln(Population) 362 0.005 0.005 0.001 0.075 SD Δln(Income per capita 362 0.022 0.016 0.006 0.259 SD Unemployment Ra 362 0.977 0.610 0.257 6.755 Mean ln(Population) 362 12.594 1.056 0.881 16.727 Mean ln(Incom 362 0.185 0.172 9.556 10.970 Share Black 362 0.102 0.107 0.002 0.485 Share Hispani 362 0.093 0.142 0.005 0.943 Share Urban 362 0.754 0.127 0.439 0.994 Share Over 65 362 0.127 0.035 0.042 0.347 Share Foreign Born 362 0.065 0.064 0.008 0.350 Average Commute 362 3.750 3.422 6.416 38.554 Share BA Degree 362 0.225 0.073 0.099 0.524 Share Member Armed Forces 362 0.014 0.041 0.000 0.381 Mean minus Median Inco 362 10,256 1,822 5,743 21,829 Median House Price ($) 362 11,306 47,193 7,700 41,420Share unmarried households 362 0.049 .010 .014 0.077 Median Real Estate Taxes ($) 362 1216 665 199 3991 Share sub 359 0.080 0.029 0.018 0.242 WRLURI 311 .135 0.826 1.791 4.059 2004 Pre 360 55.3 10.6 24.9 85.8 Latitude 362 38.054 5.421 21.426 64.819 Longitude 362 -92.438 15.593 -158.036 -68.722
12
Table 2. Regression Results
(I) (II) (III) (IV) (V) Dependent Variable SD SD CV CV CV EVANG -0.077*** -0.022*** -0.833*** -0.710*** -0.416*** (0.02) (0.01) (0.18) (0.18) (0.15) Δln(House Price) 1.125*** (0.10) WRLURI 0.080** -0.016 (0.03) (0.02) Constant 0.048*** -0.022*** 0.733*** 0.719*** 5.813*** (0.01) (0.01) (0.06) (0.06) (1.54) Observations 362 362 362 311 306 R-squared 0.16 0.71 0.15 0.22 0.64 Dependent Variable: SD[Δln(House Price)] or CV[Δln(House Price)] Robust standard errors (adjusted for 50 clusters by state) in parentheses. *** p<0.01, ** p<0.05, * p<0.1 Specification V includes 25 additional control variables listed in the text.
The results confirm the negative relationship illustrated in Figure 1. The effect is statistically significant at the 1 percent level in all specifications, and is robust to including economic and demographic controls, including the land use regulatory index. Using the results from specification V, a one SD increase in the share of evangelicals (around .13) is associated with a .05 decrease in the CV of house price growth—or around one fifth of one SD for this variable. To put this in context, one can compare the effect with that of a more conventional variable, the urban population share. As one would expect, MSAs with a higher urban population share (i.e. a higher building density, and hence less space for new construction) have seen significantly greater house price volatility. The effect of a 1 SD increase in the population share of evangelicals is equal to that arising from a 1.13 SD decrease in the urban population share.17
B. Discussion On one level it is not surprising that the share of evangelical protestants is correlated with house price developments. The Bible—treated as the inerrant and literal word of God by most evangelicals—contains a significant volume of material dealing with how one should behave with respect to money and material possessions. According to one conservative Protestant commentator, “15 percent of everything Jesus said related to money and possessions. Our Lord made more references to money and possessions than to either prayer or faith. He spoke about money and possessions more than heaven and hell combined” 17Some other results are worth reporting. The regulatory index has no significant effect on house price volatility once the full set of controls is included. Note as well that the prominent role that subprime lending has played in discussions of the recent U.S. housing cycle appears to have some merit, since a higher share of subprime originations is associated with higher house price volatility.
13
(Randy C. Alcorn, quoted in Keister, 2008). In particular, several prominent passages in the Bible warn against an excessive focus on wealth accumulation: Luke (16:13) warns that “You cannot serve both God and Money.” More famously, the Bible notes that the “love of money is the root of all kinds of evil.” (1 Tim. 6:10). Keister (2008) provides compelling evidence that evangelicals’ attitudes to wealth and their actual wealth holdings match those suggested by Biblical teachings. She finds that evangelicals “have low wealth regardless of family background,” even controlling for other factors such as income, social class and demographic and educational variables (evangelicals marry younger, have larger families and invest less in education, all of which also tend to depress asset holding). She also finds that evangelicals often embrace economic values that are hostile to personal wealth accumulation, being “more likely to think about the relationship between the Bible and personal finances, to agree that money is the root of all evil, to agree that riches prevent knowing God, and to say that saving for retirement is not important.” If evangelicals also take from these teachings the lesson that speculative activity is wrong and refrain from it, then the fact that house prices are less volatile in areas with more evangelicals can be taken as evidence that speculative activity may be driving the volatility in other areas. In addition to their reaction to passages of the Bible admonishing materialism, evangelicals’ focus on the ‘end times’ could further insulate them from speculative activities. There are at least four plausible channels. First, as creator of the Left Behind series of rapture-based novels Tim LaHaye has argued, belief in the “any-moment-coming of Christ” encourages “holy living in an unholy society” (Forbes, 2004). This might include greater attention to those passages of the Bible that are antipathetic to greed and materialism. Second, the belief that all material things will soon be destroyed discourages asset accumulation.18 For instance, Keister, 2008 quotes evangelical commentator Randy C. Alcorn, who argues that “Material things ... cannot escape the coming fire of God that will consume the material world.” Third, an obsessive focus on parsing the news for signs of ‘prophetic activity’ makes it hard to also become caught up in the more materialistic type of ‘social epidemic’ outlined by Shiller, particularly since many evangelicals tend to be cut off from mainstream news media that Shiller credits with feeding the speculative bubble. Finally, because most kinds of bad news can be read as evidence for the oncoming rapture and tribulation, end times eschatology provides some psychic comfort against adverse external conditions. For instance, Todd Strandberg, creator of the Rapture Index, has argued that “a lot of prophetic commentators have what I consider a phony sadness” over some world events that most would consider bad news. “In their hearts they know it means them
18This would be in line with an earlier literature that demonstrated how fear of a nuclear holocaust might have reduced rates of capital accumulation during the Cold War (Russert, Cowden, Kinsella and Murray, 1994; Russert and Slemrod, 1993; Russert and Lackey, 1987; and Slemrod, 1986), and is also confirmed by the analysis in section V.
14
getting closer to their ultimate desire.” (Time, 7/1/02). In other words, a belief in imminent rapture provides some upside to bad news via a form of spiritual insurance.19 The following sections provide some empirical evidence in support of these arguments. The key prediction is that bad news will tend to deflate speculative excess in areas with few evangelicals, but have little impact—or even perhaps a positive impact on prices—in heavily evangelical areas. Although the empirical results match the prediction and can therefore be read as supportive of all four channels discussed here, I think that the insurance role of ‘end times’ beliefs is perhaps the most interesting. Not least, this explanation links to an emerging economic literature on the insurance role of religious beliefs (Scheve and Stasavage, 2006a and 2006b) which is itself informed by a more well-established psychology literature.
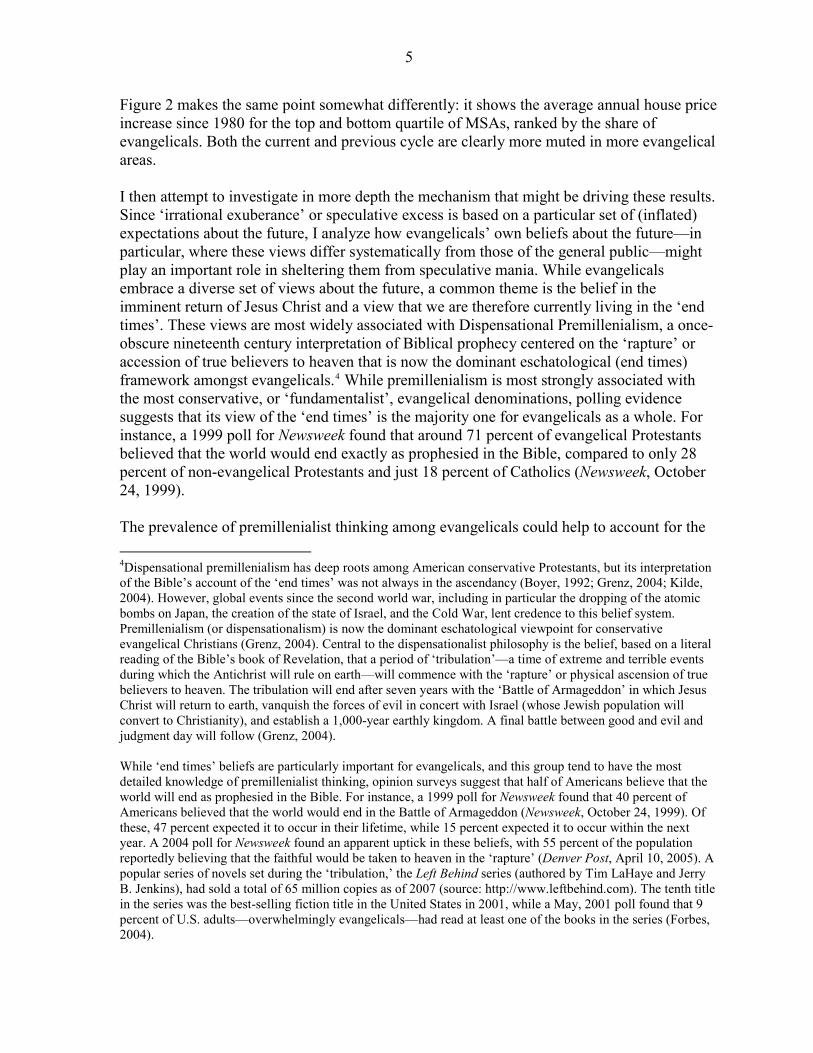
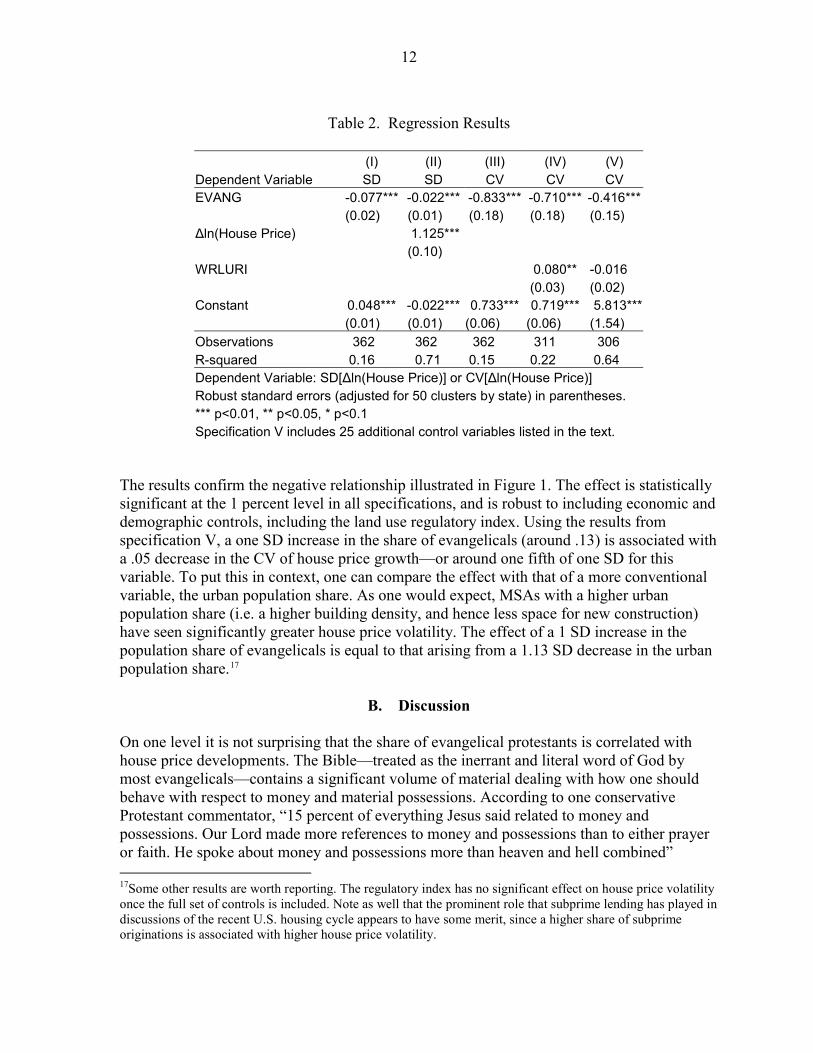
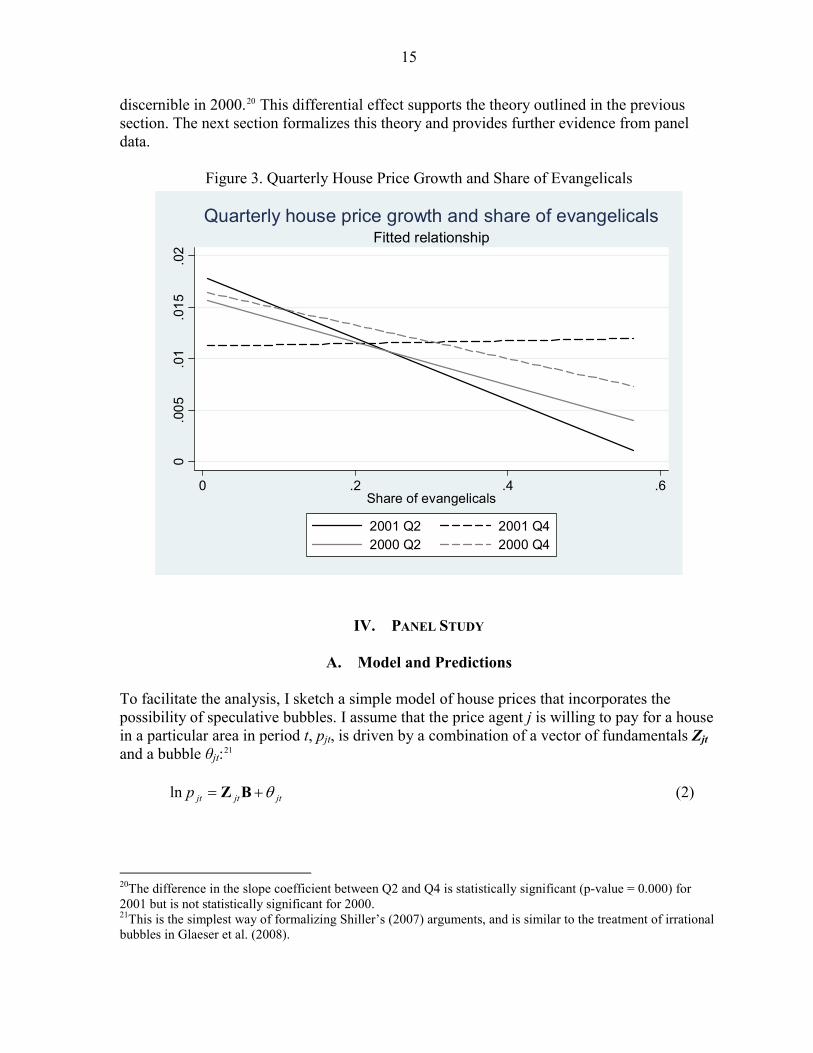
III. 9/11 EVENT STUDY There is ample evidence that 9/11 was interpreted by some premillenialists as evidence that “Christ’s return is imminent” (Kilde, 2004). A Time/CNN poll in 2002 found that interest in the ‘end times’ increased markedly in the wake of the 9/11 attacks: more than one-third of respondents claimed to be paying more attention to how the news might relate to the end of the world, and almost one-quarter believed that the Bible predicted the attacks (Time, July 1, 2002). Some 59 percent claimed to believe that the account of the ‘end times’ in the Bible’s book of Revelation would come true (compared to 40 percent in response to a similar question in 1999). An Evangelical Christian Publishers Association survey of 500 bookstores found sales of nonfiction books about prophecy increased by 71 percent in the last two months of 2001 (Press-Enterprise, 1/10/2002). This up-tick in interest is also reflected in a spike in internet traffic to the Rapture Index site (some eight million visitors in the immediate aftermath of 9/11 according to Time), while the index itself concurrently reached its all-time high. Hence, one means of analyzing the impact of ‘end times’ beliefs on behavior is to analyze the evolution of house prices in the run-up to and immediate aftermath of the attacks. One can exploit the quarterly frequency of the OFHEO data, focusing on the period immediately surrounding the attacks by comparing the behavior of house prices in the second and fourth quarters of 2001. As an additional comparison, one can also compare the behavior of prices in the same two quarters in 2000. Figure 3 then plots the fitted relationship between house price growth and the share of evangelicals in each MSA for the second and fourth quarters of 2001. Figure 3 suggests that 9/11 had a dramatically differential impact on house price growth across MSAs depending on the proportion of evangelicals in their population. Between the second and fourth quarters of 2001 there was a statistically significant upward shift in house price growth for areas with a high share of evangelicals, but a marked drop in areas with a low share. This pattern is not
19Further evidence for this interpretation of ‘end times’ beliefs as providing spiritual insurance or comfort against fears over the future comes from Mojtabai (1986), who studies the ubiquity of these beliefs among residents of Amarillo, TX, home of the U.S.’s only final-assembly plant for nuclear weapons.
15
discernible in 2000.20 This differential effect supports the theory outlined in the previous section. The next section formalizes this theory and provides further evidence from panel data.
Figure 3. Quarterly House Price Growth and Share of Evangelicals 0
.005
.01
.015
.02
0 .2 .4 .6Share of evangelicals
2001 Q2 2001 Q42000 Q2 2000 Q4
Fitted relationshipQuarterly house price growth and share of evangelicals
IV. PANEL STUDY
A. Model and Predictions
To facilitate the analysis, I sketch a simple model of house prices that incorporates the possibility of speculative bubbles. I assume that the price agent j is willing to pay for a house in a particular area in period t, pjt, is driven by a combination of a vector of fundamentals Zjt and a bubble θjt:21
jtjtjtp θ+= BZln (2) 20The difference in the slope coefficient between Q2 and Q4 is statistically significant (p-value = 0.000) for 2001 but is not statistically significant for 2000. 21This is the simplest way of formalizing Shiller’s (2007) arguments, and is similar to the treatment of irrational bubbles in Glaeser et al. (2008).
16
By definition, empirical proxies for θjt are hard to come by. Shiller (2007) argues that speculative bubbles are often driven by “new era stories”. Increases in prices of an asset (in this case, housing) generate a self-fulfilling feedback mechanism: price appreciation reinforces an optimistic paradigm, so that more appreciation is expected, further driving up the price. In particular:
a new era story that has been particularly amplified by the current housing boom is that the world is entering into a new era of capitalism, which is producing phenomenal economic growth, and at the same time producing both extreme winners and unfortunate losers. ... The new era story warns people that they have to join the capitalist world and buy their homestead now, before it is priced out of reach by hordes of wealthy new investors.
I argue that although the speculative bubble is difficult to measure, it is driven by a story about the future that will be shaped in part by agents’ response to news (current events) and what these imply for the new era story. For concreteness, I assume that the speculative bubble combines two elements: news, εt, that is common across agents j, and an individual-specific parameter λj that measures what effect this news has on each agent’s overall perception of the future and hence on the speculative component of house values:
tjjt ελθ = (3)
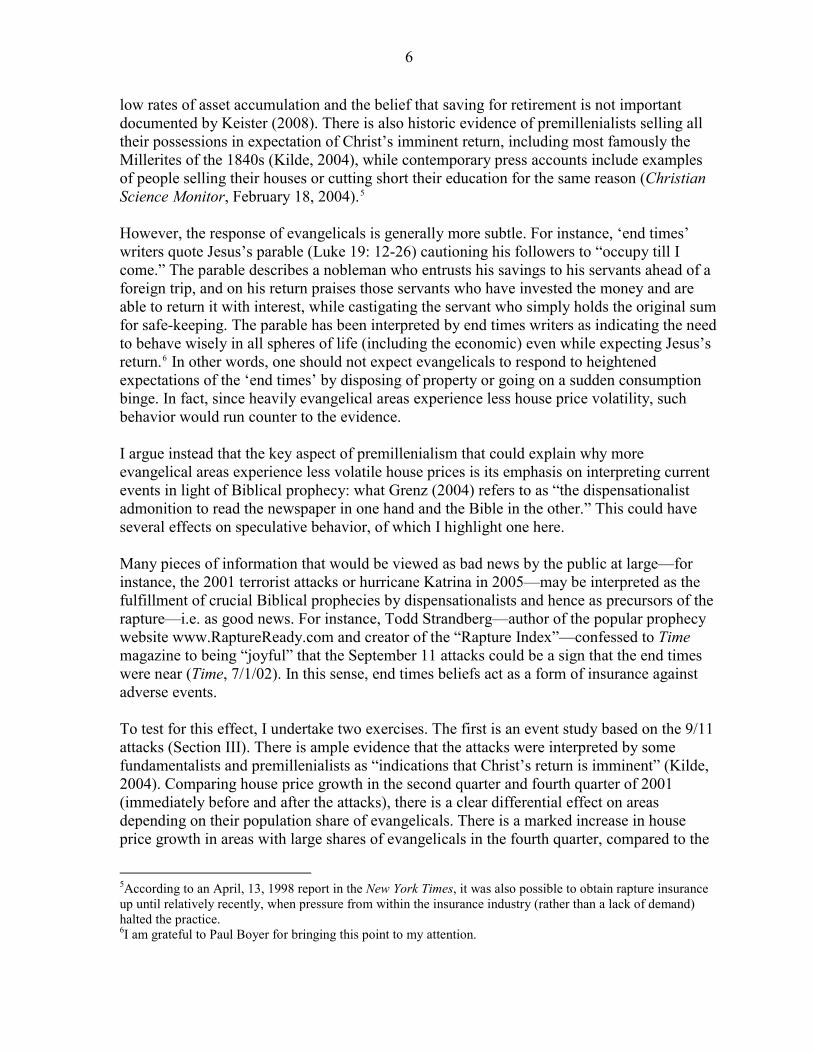
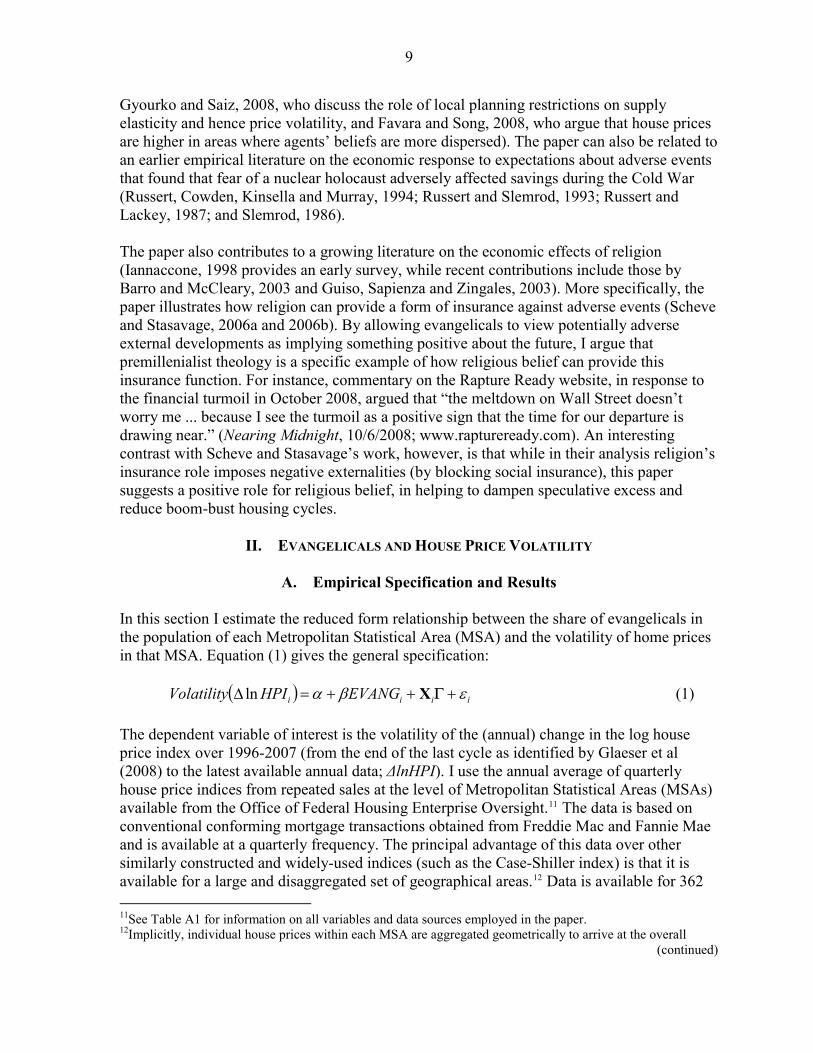
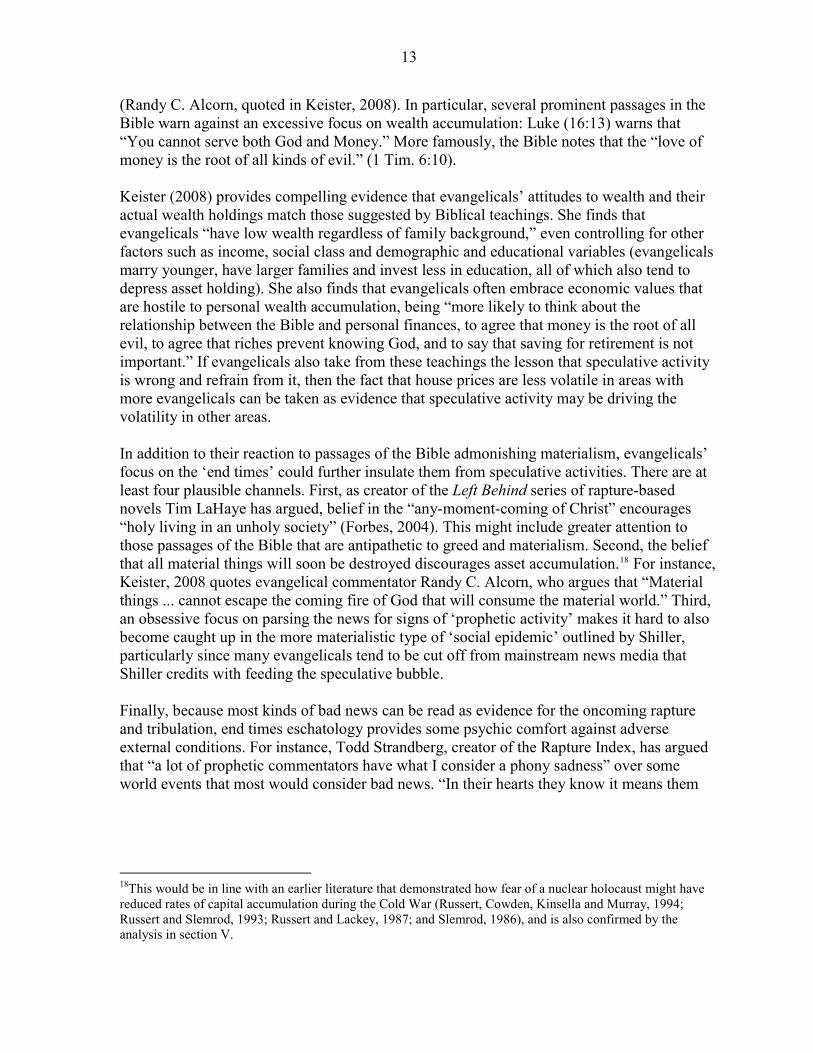
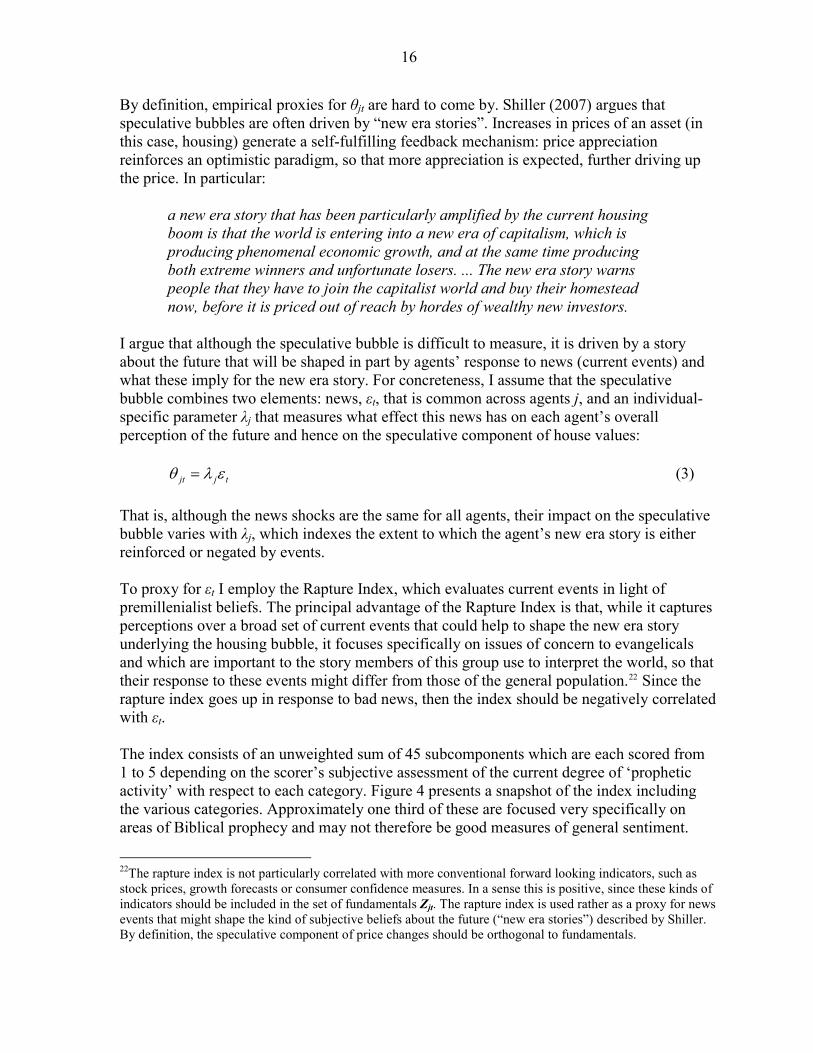
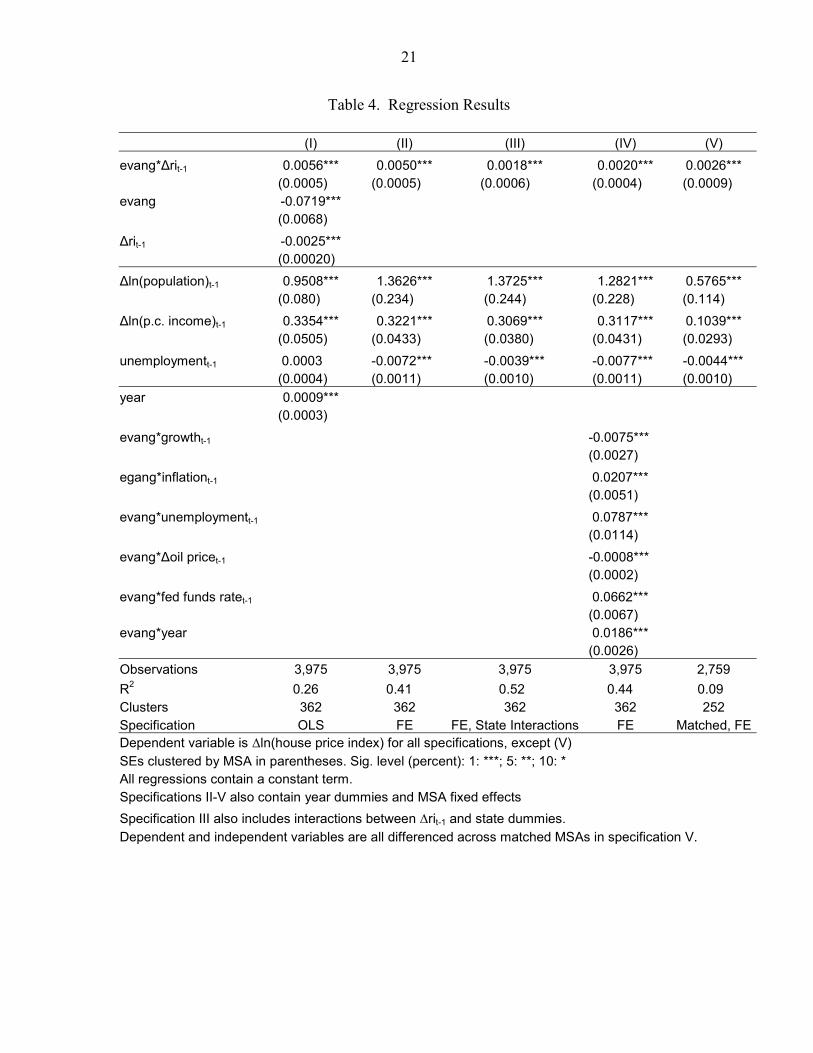
That is, although the news shocks are the same for all agents, their impact on the speculative bubble varies with λj, which indexes the extent to which the agent’s new era story is either reinforced or negated by events. To proxy for εt I employ the Rapture Index, which evaluates current events in light of premillenialist beliefs. The principal advantage of the Rapture Index is that, while it captures perceptions over a broad set of current events that could help to shape the new era story underlying the housing bubble, it focuses specifically on issues of concern to evangelicals and which are important to the story members of this group use to interpret the world, so that their response to these events might differ from those of the general population.22 Since the rapture index goes up in response to bad news, then the index should be negatively correlated with εt. The index consists of an unweighted sum of 45 subcomponents which are each scored from 1 to 5 depending on the scorer’s subjective assessment of the current degree of ‘prophetic activity’ with respect to each category. Figure 4 presents a snapshot of the index including the various categories. Approximately one third of these are focused very specifically on areas of Biblical prophecy and may not therefore be good measures of general sentiment.
22The rapture index is not particularly correlated with more conventional forward looking indicators, such as stock prices, growth forecasts or consumer confidence measures. In a sense this is positive, since these kinds of indicators should be included in the set of fundamentals Zjt. The rapture index is used rather as a proxy for news events that might shape the kind of subjective beliefs about the future (“new era stories”) described by Shiller. By definition, the speculative component of price changes should be orthogonal to fundamentals.
17
These include categories such as ‘apostasy,’ ‘mark of the beast’ and ‘the Antichrist.’23 However, the remainder of the categories cover the kind of issues that are the mainstay of mainstream news media, including world events (e.g. ‘Israel,’ ‘Global Turmoil’ and ‘Arms Proliferation’), domestic economic concerns (e.g. ‘the economy,’ ‘unemployment,’ ‘inflation’) and natural phenomena (‘volcanoes,’ ‘earthquakes,’ ‘wild weather’).
Figure 4. The Rapture Index and subcategories
I. False Christs II. Occult III. Satanism IV. Unemployment V. Inflation VI. Interest Rates VII. The Economy VIII. Oil Supply/Price IX. Debt and Trade X. Financial unrest XI. Leadership XII. Drug abuse XIII. Apostasy XIV. Supernatural XV. Moral Standards XVI. Anti-Christian XVII. Crime Rate
3 2 2 3 3 2 4 4-1 3 5 4 2 4 1 3 3 4
1. Ecumenism 2. Globalism 3. Tribulation Temple 4. Anti-Semitism 5. Israel 6. Gog (Russia) 7. Persia (Iran) 8. The False Prophet 9. Nuclear Nations 10. Global Turmoil 11. Arms Proliferation 12. Liberalism 13. The Peace Process 14. Kings of the East 15. Mark of the Beast 16. Beast Government 17. The Antichrist
4 3 2 4 5 5 5 3 5 4 4 4 3+1 4 3 4 2
• Date Settings • Volcanoes • Earthquakes • Wild Weather • Civil Rights • Famine • Drought • Plagues • Climate • Food Supply • Floods
Rapture Index 159 Net Change unch
Updated Dec 3, 2007
2 4 5 5 3 3 5 3 3 5 5
2004 High 157 2005 High 161 2006 High 163 2007 High 163 2004 Low 135 2005 Low 143 2006 Low 151 2007 Low 154 Record High 182 Record Low 57 24 Sept 01 12 Dec 93 As I argued in section II, the dispensationalist view of history that underpins the index can be thought of as offering a form of insurance for its adherents, reducing the impact of both good and bad news by providing offsetting spiritual payoffs. Hence, I conjecture that λj should be positive for non-evangelicals but zero or even negative for evangelicals. Substituting (3) into (2), aggregating to the level of MSA i and taking first differences, the baseline empirical specification is given by (4):24
( ) ittittit uRIEVANGbRIbEVANGbp ++Δ×+Δ+=Δ −−− ΓΔ 1,12110ln Z (4) The model predicts that and . 01 <b 02 >b 23Unfortunately the data I was able to assemble on the Rapture Index do not allow one to separately capture changes in different subcomponents consistently over a long time series. 24Since house prices adjust relatively sluggishly, all right hand side variables are lagged one year. However, the baseline results are qualitatively identical imposing contemporaneous effects.
18
B. Data and Empirical Strategy
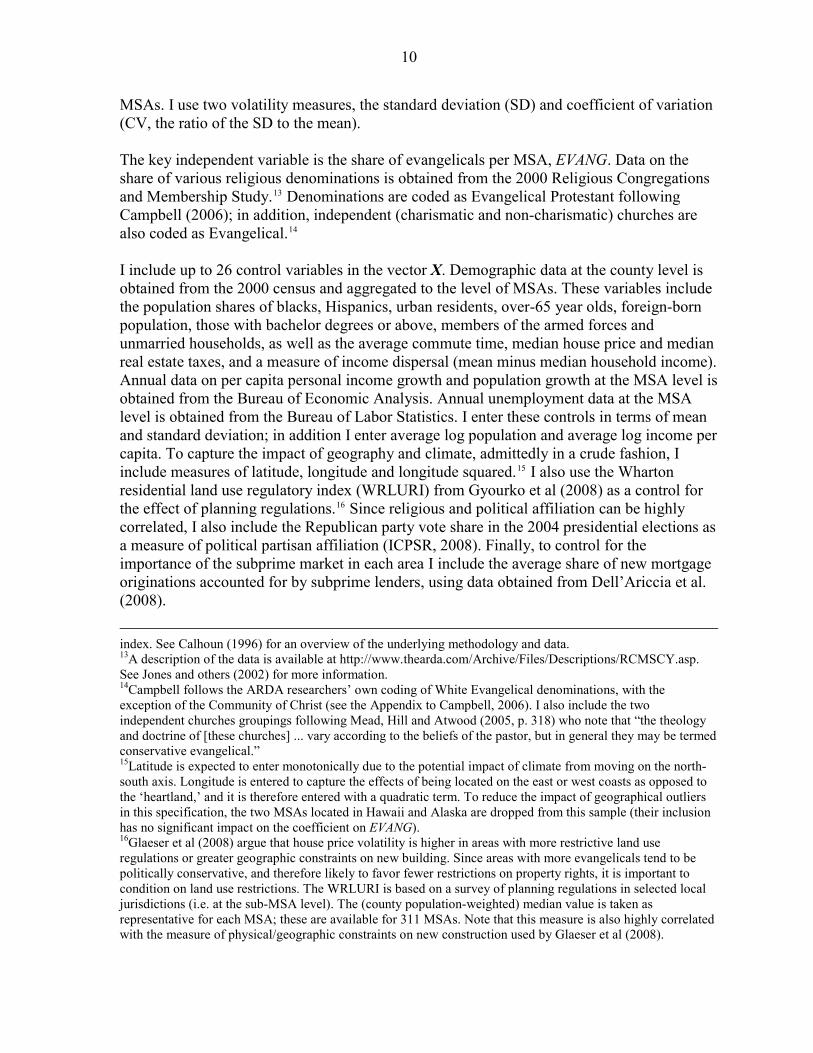
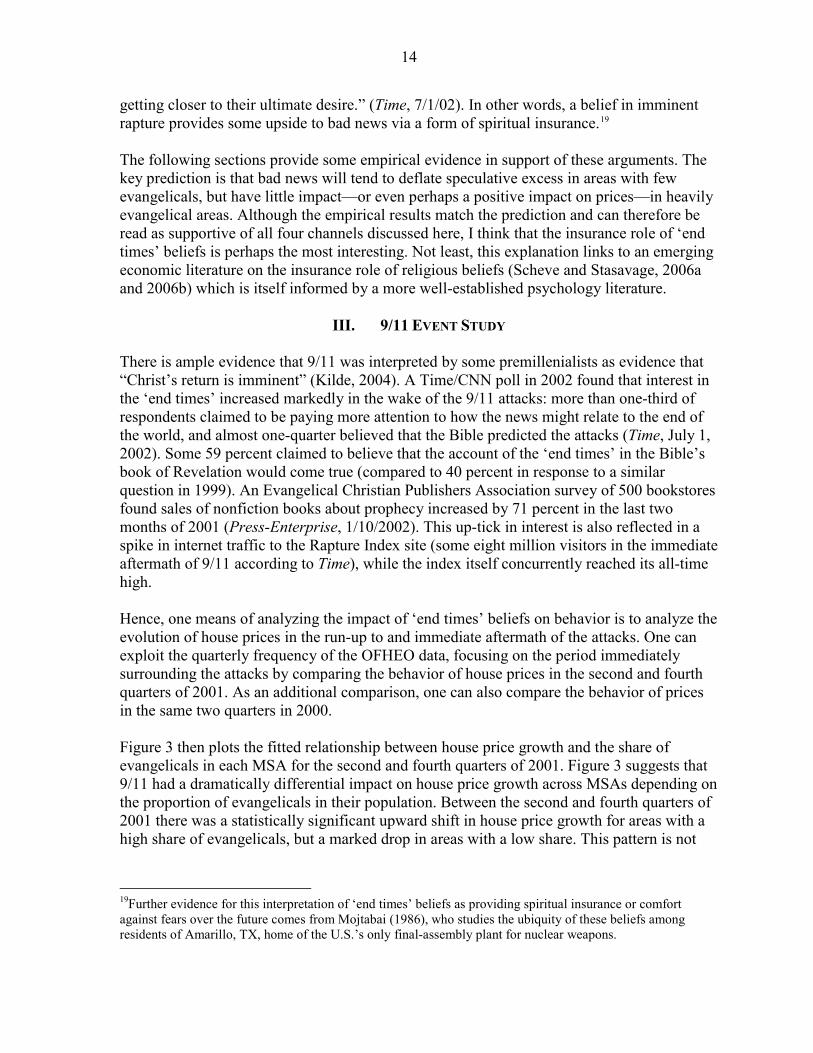
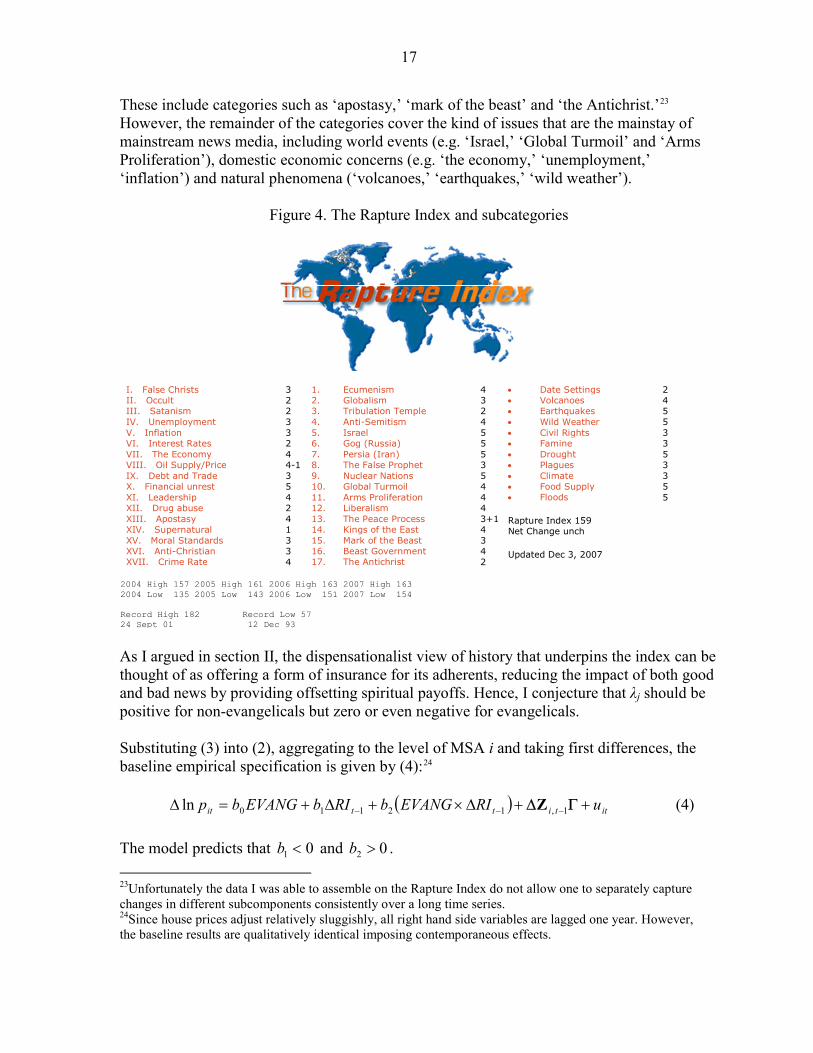
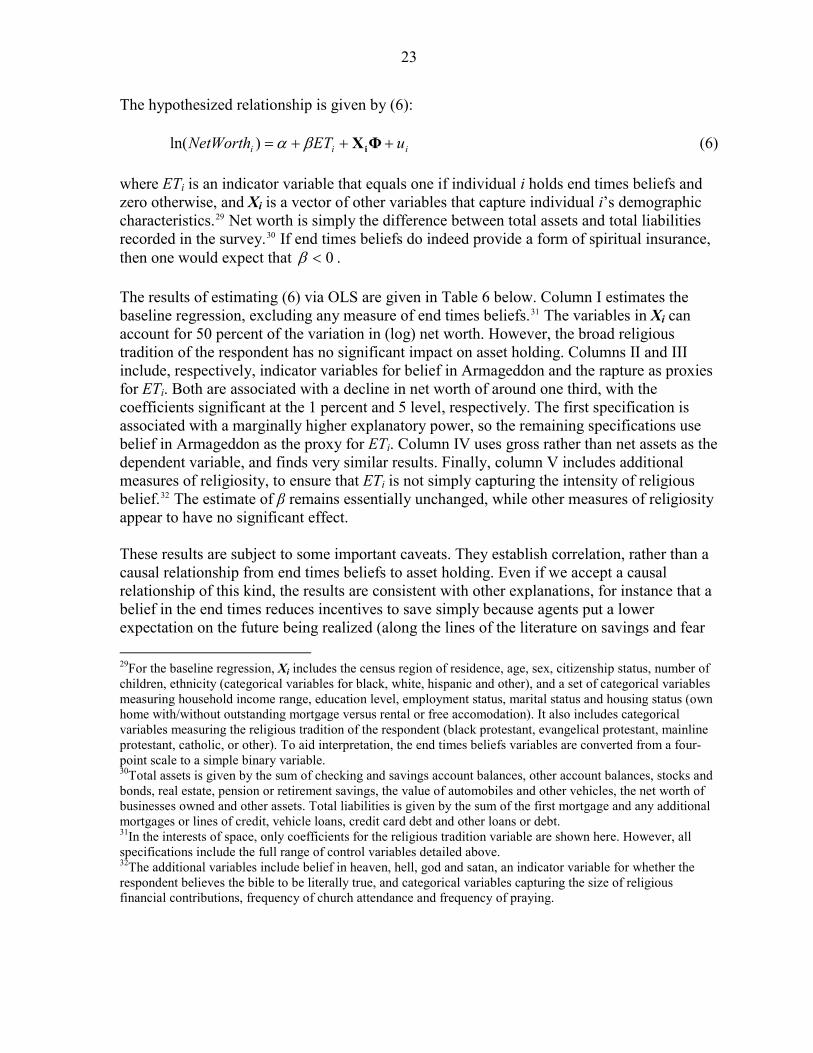
The house price data, share of evangelicals and controls to capture changes in fundamentals (per-capita personal income growth, unemployment and population growth) are from the sources described in section II. Data on the Rapture Index was assembled from several internet sources that provide archived information on past values of the index or information on its current value.25 Figure 5 shows the evolution of the index over time. Additional macroeconomic controls are obtained from the Federal Reserve Board and the IMF’s World Economic Outlook dataset.
Figure 5. The Rapture Index
120
130
140
150
160
170
1995 2000 2005
The Rapture Index
The baseline specification (I) follows (4). The vector of controls ΔZi,t-1 includes personal income and population growth, the local unemployment rate and a linear time trend. Since there are only 11 independent observations for ΔRIt-1 and we are not interested in identifying separately the effect of EVANG the remainder of the specifications include time dummies and MSA fixed effects (and therefore drop ΔRIt-1, EVANG and the linear time trend). In the second specification (II), I rerun the baseline imposing this fixed effect specification.
25Only a subset of the observations of the index and its subcomponents is available (the index is updated approximately weekly). However, because each update of the index provides information on maxima and minima for several past years alongside the current value of the index and its subcomponents, one can reconstruct annual observations covering 1995-2007 by taking the midpoint between the reported annual low and high as a proxy for the annual average.
19
I present results from three additional specifications as robustness tests.26 Since the share of evangelicals differs markedly across states, alongside other state-specific factors such as housing laws, I also include a set of interactions between State dummies and ΔRIt-1 to capture only within-state variation (III). As the model stresses the impact of the share of evangelicals on the non-fundamental (bubble) component of house prices, I also run a specification that includes interactions between EVANG and measures of national macroeconomic fundamentals, including GDP growth, inflation, the national unemployment rate, changes in the oil price and the Federal Funds rate, as well as a linear time trend (IV). Finally, to control for spatial correlation I conduct a matching exercise, where each MSA is matched with its closest geographic neighbor, and the fixed effects specification (II) is first-differenced across the two areas for each unique pair (V).27 All regression results report standard errors adjusted for clustering at the MSA level, to allow for heteroskedasticity and MSA-specific patterns of serial correlation (following Bertrand et al., 2004).
C. Results and Discussion
Summary statistics are presented in Table 3. Regression results are presented in Table 4. The baseline specification (column I) confirms the negative effect of the Rapture Index on prices in areas with no evangelicals and the positive interaction effect predicted by the model, with both coefficients statistically significant at the 1 percent level. The positive interaction effect is robust to the different specifications in columns II-V, although the coefficient drops by a half to two-thirds in specifications III-V. These effects are economically as well as statistically significant. To illustrate this, consider the following counterfactual experiment. Using the interaction coefficient b2 estimated using the fixed effects specification (II), I estimate the change in log house prices assuming no differential effect of the rapture index across areas with different shares of evangelicals:
( )( )RIRIEVANGbpp titit Δ−Δ×−Δ≡Δ −12lnˆln (5) This assumes that any response of prices to news shocks in each area is equal to that in areas with no evangelicals. Table 5 illustrates what share of the difference in house price variability can be explained by this differential response to news shocks. It shows the standard deviation and coefficient of
26I run several other robustness checks whose results are not presented here: these include specifications using real house price indices and different definitions of evangelicals; additional attempts to deal with spatial and serial correlation; and subsamples (across time and geographical areas). The main results are robust (results available from the author on request). 27This exercise results in 252 unique matched pairs with mean distance 60.9 miles. Note that to the extent that serial correlation enters via common regional house price cycles, then this specification will minimize serial as well as spatial correlation. Results are robust to dropping matches where the MSA pair are relatively distant (e.g. >100 miles apart), and also to other methods of dealing with spatial correlation, e.g. spatial lag or spatial error models (results available from author on request).
20
variation of both the actual house price growth series and the counterfactual series for the top and bottom quartiles of MSAs ordered by the share of evangelicals. The
difference between the top and bottom quartiles is reduced significantly when the differential response to news shocks is eliminated. In fact, the differential response to news shocks identified above can account for 88 percent of the difference in the coefficient of variation, and 37 percent of the difference in the standard deviation.
itplnΔ
itp̂lnΔ
Table 3. Descriptive Statistics
Mean SD Min Max Δln(House Price) 0.06 0.05 -0.13 0.29 Δln(population)t-1 0.01 0.01 -0.25 0.10 Δln(p.c. income)t-1 0.04 0.03 -0.44 0.70 unemploymentt-1 5.03 2.23 1.20 30.90 (2000 data) Evang 0.17 0.13 0.01 0.57 (Annual data) Δrit-1 3.49 9.84 -15.0 21.0 growtht-1 3.17 1.13 0.75 4.50 inflationt-1 2.54 0.72 1.60 3.44 unemploymentt-1 4.98 0.62 3.97 5.99 Δoil pricet-1 15.68 25.01 -32.14 57.03 fed funds ratet-1 3.96 1.75 1.13 6.24 3,975 Observations (362 MSAs)
21
Table 4. Regression Results
(I) (II) (III) (IV) (V) evang*Δrit-1 0.0056*** 0.0050*** 0.0018*** 0.0020*** 0.0026*** (0.0005) (0.0005) (0.0006) (0.0004) (0.0009) evang -0.0719*** (0.0068) Δrit-1 -0.0025*** (0.00020) Δln(population)t-1 0.9508*** 1.3626*** 1.3725*** 1.2821*** 0.5765*** (0.080) (0.234) (0.244) (0.228) (0.114) Δln(p.c. income)t-1 0.3354*** 0.3221*** 0.3069*** 0.3117*** 0.1039*** (0.0505) (0.0433) (0.0380) (0.0431) (0.0293) unemploymentt-1 0.0003 -0.0072*** -0.0039*** -0.0077*** -0.0044*** (0.0004) (0.0011) (0.0010) (0.0011) (0.0010) year 0.0009*** (0.0003) evang*growtht-1 -0.0075*** (0.0027) egang*inflationt-1 0.0207*** (0.0051) evang*unemploymentt-1 0.0787*** (0.0114) evang*Δoil pricet-1 -0.0008*** (0.0002) evang*fed funds ratet-1 0.0662*** (0.0067) evang*year 0.0186*** (0.0026) Observations 3,975 3,975 3,975 3,975 2,759 R2 0.26 0.41 0.52 0.44 0.09 Clusters 362 362 362 362 252 Specification OLS FE FE, State Interactions FE Matched, FEDependent variable is Δln(house price index) for all specifications, except (V) SEs clustered by MSA in parentheses. Sig. level (percent): 1: ***; 5: **; 10: * All regressions contain a constant term. Specifications II-V also contain year dummies and MSA fixed effects Specification III also includes interactions between Δrit-1 and state dummies. Dependent and independent variables are all differenced across matched MSAs in specification V.

22
Table 5. Counterfactual Exercise SD Δln(House Price)
Bottom Quartile Top Quartile Difference Actual 0.048 0.021 0.027 Counterfactual 0.049 0.032 0.017 Percentage reduction in Difference 36.7
CV Δln(House Price) Bottom Quartile Top Quartile Difference Actual 0.752 0.443 0.309 Counterfactual 0.734 0.698 0.036 Percentage reduction in Difference 88.2 Top and Bottom Quartiles: MSAs ordered by share of evangelicals
V. END TIMES BELIEFS AND ASSET HOLDING This paper’s main contention is that end times beliefs provide evangelicals with a form of spiritual insurance against potential bad news. An important corollary of this hypothesis is that end times beliefs are a substitute for other means of insuring against uncertainty. Given credit constraints, one means of insuring oneself against shocks is to hold a stock of assets to facilitate consumption smoothing (the precautionary saving motive). Hence, one should expect the net asset position (net worth) of individuals holding end times beliefs to be lower, controlling for other drivers of asset holdings, if end times beliefs do indeed provide this insurance role. To test this prediction, this section analyzes individual-level data from the 2006 wave of the Baylor Religion Survey (Baylor University, 2006). This wave of the survey uniquely collected information on both religious beliefs and asset holdings. The survey’s questions cover general aspects of religious attitudes and behavior (including denomination, attendance, and religious financial contributions) as well as detailed information on assets and liabilities, in addition to standard demographic information. Critically, the survey also captures detailed information on specific religious beliefs, including beliefs concerning the end times (belief in the rapture and in Armageddon). The survey was carried out over a nationally representative sample by Gallup during 2006, and the sample size is just over 1,000 (although missing responses reduce the sample available for estimation by around one half).28
28The median net worth in the full dataset is around $45,000; for the sample in specification I this increases to around $225,000. Median family net worth in the U.S. in 2004, according to the 2004 Survey of Consumer Finances, was around $93,000 (Bucks et al., 2006). Thirty percent of respondents to the survey are evangelical Protestants. Among these evangelicals, belief in the rapture and Armageddon stood at 80 and 81 percent, respectively. Among non-evangelicals, the corresponding figures were 41 percent and 47 percent.
23
The hypothesized relationship is given by (6):
iii uETNetWorth +++= ΦXiβα)ln( (6) where ETi is an indicator variable that equals one if individual i holds end times beliefs and zero otherwise, and Xi is a vector of other variables that capture individual i’s demographic characteristics.29 Net worth is simply the difference between total assets and total liabilities recorded in the survey.30 If end times beliefs do indeed provide a form of spiritual insurance, then one would expect that 0<β . The results of estimating (6) via OLS are given in Table 6 below. Column I estimates the baseline regression, excluding any measure of end times beliefs.31 The variables in Xi can account for 50 percent of the variation in (log) net worth. However, the broad religious tradition of the respondent has no significant impact on asset holding. Columns II and III include, respectively, indicator variables for belief in Armageddon and the rapture as proxies for ETi. Both are associated with a decline in net worth of around one third, with the coefficients significant at the 1 percent and 5 level, respectively. The first specification is associated with a marginally higher explanatory power, so the remaining specifications use belief in Armageddon as the proxy for ETi. Column IV uses gross rather than net assets as the dependent variable, and finds very similar results. Finally, column V includes additional measures of religiosity, to ensure that ETi is not simply capturing the intensity of religious belief.32 The estimate of β remains essentially unchanged, while other measures of religiosity appear to have no significant effect. These results are subject to some important caveats. They establish correlation, rather than a causal relationship from end times beliefs to asset holding. Even if we accept a causal relationship of this kind, the results are consistent with other explanations, for instance that a belief in the end times reduces incentives to save simply because agents put a lower expectation on the future being realized (along the lines of the literature on savings and fear 29For the baseline regression, Xi includes the census region of residence, age, sex, citizenship status, number of children, ethnicity (categorical variables for black, white, hispanic and other), and a set of categorical variables measuring household income range, education level, employment status, marital status and housing status (own home with/without outstanding mortgage versus rental or free accomodation). It also includes categorical variables measuring the religious tradition of the respondent (black protestant, evangelical protestant, mainline protestant, catholic, or other). To aid interpretation, the end times beliefs variables are converted from a four-point scale to a simple binary variable. 30Total assets is given by the sum of checking and savings account balances, other account balances, stocks and bonds, real estate, pension or retirement savings, the value of automobiles and other vehicles, the net worth of businesses owned and other assets. Total liabilities is given by the sum of the first mortgage and any additional mortgages or lines of credit, vehicle loans, credit card debt and other loans or debt. 31In the interests of space, only coefficients for the religious tradition variable are shown here. However, all specifications include the full range of control variables detailed above. 32The additional variables include belief in heaven, hell, god and satan, an indicator variable for whether the respondent believes the bible to be literally true, and categorical variables capturing the size of religious financial contributions, frequency of church attendance and frequency of praying.
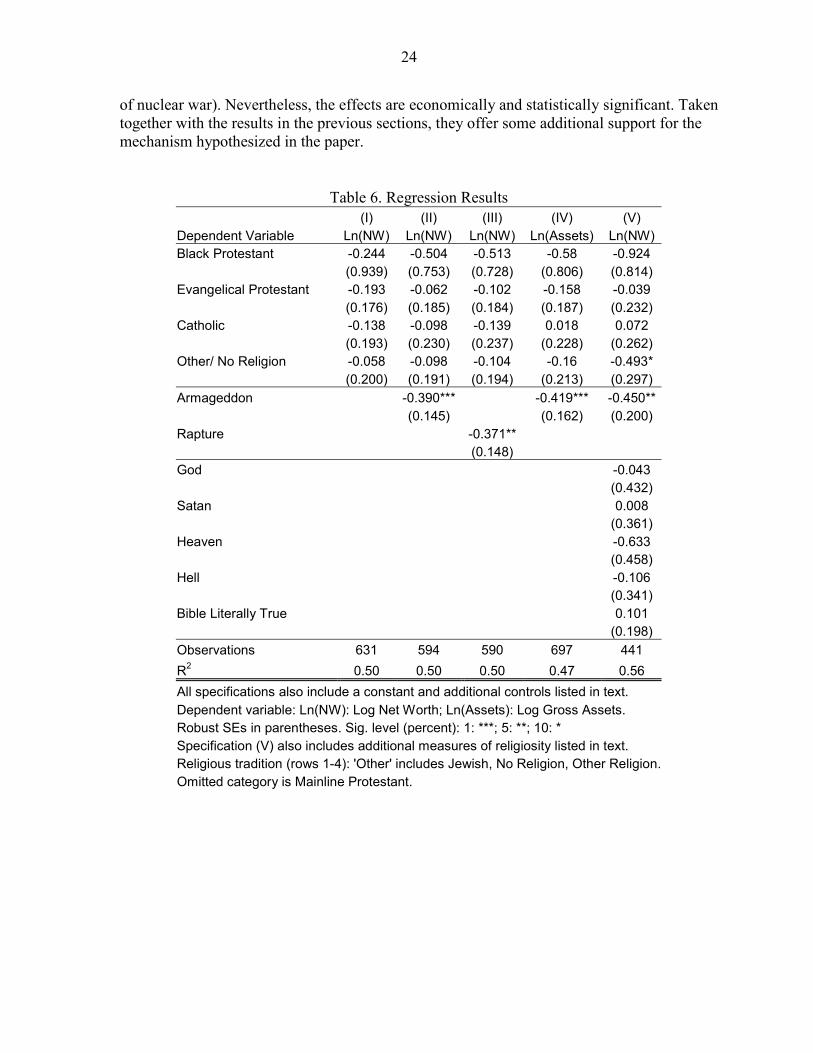
24
of nuclear war). Nevertheless, the effects are economically and statistically significant. Taken together with the results in the previous sections, they offer some additional support for the mechanism hypothesized in the paper.
Table 6. Regression Results (I) (II) (III) (IV) (V) Dependent Variable Ln(NW) Ln(NW) Ln(NW) Ln(Assets) Ln(NW) Black Protestant -0.244 -0.504 -0.513 -0.58 -0.924 (0.939) (0.753) (0.728) (0.806) (0.814) Evangelical Protestant -0.193 -0.062 -0.102 -0.158 -0.039 (0.176) (0.185) (0.184) (0.187) (0.232) Catholic -0.138 -0.098 -0.139 0.018 0.072 (0.193) (0.230) (0.237) (0.228) (0.262) Other/ No Religion -0.058 -0.098 -0.104 -0.16 -0.493* (0.200) (0.191) (0.194) (0.213) (0.297) Armageddon -0.390*** -0.419*** -0.450** (0.145) (0.162) (0.200) Rapture -0.371** (0.148) God -0.043 (0.432) Satan 0.008 (0.361) Heaven -0.633 (0.458) Hell -0.106 (0.341) Bible Literally True 0.101 (0.198) Observations 631 594 590 697 441 R2 0.50 0.50 0.50 0.47 0.56 All specifications also include a constant and additional controls listed in text. Dependent variable: Ln(NW): Log Net Worth; Ln(Assets): Log Gross Assets. Robust SEs in parentheses. Sig. level (percent): 1: ***; 5: **; 10: * Specification (V) also includes additional measures of religiosity listed in text. Religious tradition (rows 1-4): 'Other' includes Jewish, No Religion, Other Religion.Omitted category is Mainline Protestant.
25
VI. CONCLUSIONS This paper has investigated the role of speculative behavior in the recent pronounced U.S. housing cycle. To do this, I identify an important minority of the population—evangelical Protestants—whose values system might have offered them some protection from the speculative mania around housing investment identified by Shiller (2007), and assess whether the share of evangelicals in a particular area is related to house price volatility in that area. I find robust evidence that house price volatility was in fact significantly lower in more evangelical areas during the recent cycle, consistent with this hypothesis. I then provide some evidence on a mechanism that might have contributed to this effect. I argue that evangelicals’ ‘end times’ beliefs—that is, a belief in the imminent second coming of Christ and an intense reading of current events in light of Biblical prophecy—may shape their response to good or bad news. In particular, ‘end times’ beliefs might offer a form of insurance, since they enable believers to view bad news in a more positive light. Shiller (2007) identifies speculative manias as deriving from “new era stories”—that is, a feedback between price developments and price expectations that is shaped by agents’ overall beliefs about the future. These beliefs are shaped in turn by economic and non-economic news. I hypothesize that, by providing a form of psychic insurance against good and bad news, ‘end times’ beliefs limit the impact of news events on the “new era story” by which evangelicals interpret house prices. This then helps to reduce the amplitude of speculative bubbles in heavily evangelical areas.
To provide some evidence for this hypothesis, I first look at the impact on house prices of a particular bad news event that many evangelicals saw as evidence for the end times—9/11. I find that house price growth fell sharply in non-evangelical areas, but rose in evangelical areas, in the wake of the terrorist attacks, in line with the theory. I then analyze the impact of changes in the Rapture Index—a prominent internet prophecy resource that can be thought of as a measure of bad news events that imply good news about the ‘end times’ for premillenialists. I find an extremely significant differential effect of the rapture index on house prices. House price growth falls significantly in response to increases in the index in non-evangelical areas, but the effect shrinks as the share of evangelicals in the area increases. I use these results to carry out a counterfactual exercise, in which I ask what share of the difference in volatility between high and low evangelical areas can be explained by the differential response to news events captured by the Rapture Index. I find that almost 90 percent of the difference can be accounted for by this channel alone. Finally, I provide evidence from a survey of religious beliefs and personal finances that end times beliefs are associated with significantly lower asset holdings. This is consistent with the view that these beliefs provide an insurance function and therefore lower precautionary demand for financial assets to smooth consumption. This paper therefore contributes to two emerging economic literatures. First, it provides some evidence that psychological factors can play an important role in driving housing booms and busts, as argued by Shiller (2007). Second, it outlines a specific example of how religion
26
might play the role of insurance, as argued by Scheve and Stasavage (2006a, 2006b), and provides some evidence to support this claim. However, an interesting difference between Scheve and Stasavage’s work and this paper is that while Scheve and Stasavage’s results suggest that religion has primarily negative externality effects on non-believers (since believers block social insurance against adverse events, leaving non-believers uninsured), this paper illustrates how believers’ psychic insurance could generate positive spillovers for non-believers, by smoothing the housing cycle. The paper makes two additional contributions. First, the interaction of the Rapture Index and the share of evangelicals offers a plausibly exogenous and powerful instrument for house price growth. This could prove useful for empirical economists working on the U.S. housing market (Dell’Ariccia et al., 2008, is an early application). Second, the paper illustrates how ‘end times’ beliefs, often treated as marginal, might play an important role in shaping mass psychology in the contemporary U.S.. In the words of historian Paul Boyer:33
all of us would do well to pay attention to the beliefs of the vast company of Americans who read the headlines and watch the news through a filter of prophetic belief.
33Quoted in Forbes (2004), p. 28.
27
REFERENCES Akerlof, George A. and Rachel E. Kranton, 2000, “Economics and Identity,” Quarterly
Journal of Economics Vol. 115, No. 3, pp. 715–53. Barro, Robert J. and Rachel M. McCleary, 2003, “Religion and Economic Growth
Across Countries,” American Sociological Review, Vol. 68, No. 5, pp. 760–81. Baylor University, 2006, The Baylor Religion Survey (Second Wave). Waco, TX: Baylor
Institute for Studies of Religion [producer]. Bertrand, Marianne, Esther Duflo and Sendhil Mullainathan, 2004, “How Much Should We
Trust Differences-in-Differences Estimates?” Quarterly Journal of Economics 119, pp. 249–75.
Boyer, Paul, 1992, When Time Shall Be No More: Prophecy Belief in Modern American
Culture. Cambridge, Massachusetts: Harvard University Press. Bucks, Brian K., Arthur B. Kennickell, and Kevin B. Moore (2006), “Recent Changes in
U.S. Family Finances: Evidence from the 2001 and 2004 Survey of Consumer Finances,” Federal Reserve Bulletin (2006), pp. A2-A38.
Calhoun, Charles A., 1996, OFHEO House Price Indices: HPI Technical Description.
Washington, DC: Office of Federal Housing Enterprise Oversight. Campbell, David E., 2006, “Religious ‘Threat’ in Contemporary Presidential Election,”
Journal of Politics Vol. 68, No. 1, pp. 104–15. Dell’Ariccia, Giovanni, Deniz Igan and Luc Laeven, 2008, Credit Booms and Lending
Standards: Evidence from the Subprime Mortgage Market. IMF Working Paper WP/08/106 (Washington, DC: International Monetary Fund).
Favara, Giovanni and Zheng Song, 2008, House Price Dynamics with Heterogeneous
Expectations. Mimeo. Forbes, Bruce David and Jeanne Jalgren Kilde, eds., 2004, Rapture, Revelation and the End
Times: Exploring the Left Behind Series. New York: Palgrave MacMillan. Forbes, Bruce David, 2004, “How Popular are the Left Behind Books ... and Why?” in
Forbes and Kilde (2004). Glaeser, Edward L., Joseph Gyourko and Albert Saiz, 2008, Housing Supply and Housing
Bubbles, NBER Working Paper No.14193 (Cambridge, Massachusetts: National Bureau of Economic Research).
28
Grenz, Stanley J., 2004, “When Do Christians Think the End Times Will Happen? A Comparative Theologies Discussion of the Second Coming,” in Forbes and Kilde (2004).
Guiso, Luigi, Paola Sapienza and Luigi Zingales, 2003, “People’s Opium? Religion and
Eeconomic Attitudes,” Journal of Monetary Economics, Vol. 50, pp. 225–82. Gyurko, Joseph, Christopher Mayer and Todd Sinai, 2006, Superstar Cities, NBER Working
Paper No. 12355 (Cambridge, Massachusetts: National Bureau of Economic Research).
Gyourko, Joseph, Albert Saiz and Anita A. Summers, 2008, “A New Measure of the Local
Regulatory Environment for Housing Markets.” Urban Studies 45 (3) pp. 693-729. Iannaccone, Laurence R. (1998), “Introduction to the Economics of Religion,” Journal of
Economic Literature, Vol. XXXVI, pp. 1465–96. Inter-university Consortium for Political and Social Research, 2008, County Characteristics,
2000-2007 [computer file]. Ann Arbor, MI: Inter-university Consortium for Political and Social Research, 2008-01-24. doi: 10/3886/ ICPSR20660.
Jones, Dale E., Sherry Doty, Clifford Grammich, James E. Horsch, Richard Houseal, Mac
Lynn, John P. Marcum, Kenneth M. Sanchagrin and Richard H. Taylor, 2002, Religious Congregations and Membership in the United States 2000: An Enumeration by Region, State and County Based on Data Reported for 149 Religious Bodies. Nashville: Glenmary Research Center.
Keister, Lisa A., 2008, “Conservative Protestants and Wealth: How Religion Perpetuates
Asset Poverty,” American Journal of Sociology Vol. 113 No. 5, pp. 1237–71. Kilde, Jeanne Halgren, 2004, “How Did Left Behind’s Particular Vision of the End Times
Develop? A Historical Look at Millenarian Thought,” in Forbes and Kilde (2004). Mead, Frank S., Samuel S. Hill and Craig D. Atwood, 2005, Handbook of Denominations in
the United States (12th edition). Nashville: Abingdon Press. Mojtabai, A. G., 1986, Blessed Assurance: At Home with the Bomb in Amarillo, Texas.
Boston, MA: Houghton Mifflin Co. Russert, Bruce and Miles Lackey,,1987, “In the Shadow of the Cloud: If There’s No
Tomorrow, Why Save Today?” Political Science Quarterly, Vol. 102, No. 2, pp. 259–72.
Russert, Bruce, Jonathan Cowden, David Kinsella and Shoon Murray, 1994, “Did
Americans’ Expectations of Nuclear War Reduce Their Savings?” International Studies Quarterly, Vol. 38, No.4, pp. 587–603.
29
Russert, Bruce and Joel Slemrod, 1993, “Diminished Expectations of Nuclear War and
Increased Personal Savings: Evidence from Individual Survey Data,” American Economic Review, Vol. 83, No. 4, pp. 1022–33.
Scheve, Kenneth and David Stasavage, 2006a, “Religion and Preferences for Social
Insurance” Quarterly Journal of Political Science, Vol. 2006, No. 1, pp. 255–86. Scheve, Kenneth and David Stasavage, 2006b, “The Political Economy of Religion and
Social Insurance in the United States, 1910-1939,” Studies in American Political Development Vol. 20, pp. 132–159.
Shiller, Robert J., 2007, Understanding Recent Trends in House Prices and Home
Ownership, NBER Working Paper No. 13553 (Cambridge, Massachusetts: National Bureau of Economic Research).
Slemrod, Joel, 1986, “Saving and the Fear of Nuclear War,” Journal of Conflict Resolution,
Vol. 30, No. 3, pp. 403–19.
APPENDIX: DATA DESCRIPTIONS AND SOURCES
30
Variable Definition SourceOFHEO House Price Index Repeat-sales based house price index derived from data relating to
conventional conforming mortgage transactions (Fannie Mae and Freddie Mac).
2008Q2 release, obtained from OFHEO
Share of Evangelicals Derived from 2000 Religious Congregations and Membership Study, as detailed in text.
Association of Religion Data Archive (http://www.thearda.com).
Rapture Index Subjective "Prophetic Speedometer" giving perceived probability of end times occuring soon.
http://www.brunching.com/toys/rapture-original.txt (1995-1997). http://web.archive.org/web/*/http://www.raptureready.com (1998-2004). http://www.raptureready.com/rap2.html (official website, 2005-06).
Census demographic data (various variables) Obtained from 2000 census data at the county level and aggregated to the MSA level (weighted by population)
Bureau of the Census (http://factfinder.census.gov)
Per capita personal income Available at the MSA level, Annual Data Bureau of Economic Analysis (http://www.bea.gov/regional/reis/)
Population Available at the MSA level, Annual Data Bureau of Economic Analysis (http://www.bea.gov/regional/reis/)
Unemployment Rate Available at the MSA level, Annual Data Bureau of Labor Statistics (http://www.bls.gov/lau/home.htm)Fed Funds Rate Annual average Federal Reserve Board of Governors (Table H15)GDP Growth IMF World Economic Outlook (WEO) databaseCPI Inflation IMF World Economic Outlook (WEO) databaseUnemployment Rate (National level) IMF World Economic Outlook (WEO) databaseChange in WEO Oil Price IMF World Economic Outlook (WEO) databaseSubprime share of new mortgage originations MSA level data from the Home Mortgage Disclosure Act (HMDA) Loan
Application RegistryDell'Ariccia, Igan and Laeven (2008)
Republican voting Share 2004 Presidential Elections: Percentage votes for Bush ICPSR (2008)Wharton Residential Land Use Regulatory Index
Local level aggregated to MSA level (median) using county populationGyourko, Saiz and Summers (2008, forthcoming)
Table A1 Variable Definitions and Sources