Embed Size (px)
Citation preview
Is Fraud Contagious? Career Networks and Fraud by Financial
AdvisorsI
Stephen G. Dimmocka, William C. Gerkenb, Nathaniel P. Grahamb
aDivision of Banking & Finance, Nanyang Technological University, Singapore 639798bDepartment of Finance & Quantitative Methods, University of Kentucky, Lexington, KY 40506
Abstract
We show that the propensity to commit fraud is transmitted through career networks. We usea novel dataset of U.S. financial advisors, which includes individuals’ employment historiesand records of fraudulent behavior. To identify the effect of career networks on fraud weuse changes in co-workers caused by mergers of financial advisory firms; the tests includemerger-firm fixed effects to exploit the variation in changes to career networks across differentbranches of the same firm. The probability an advisor commits fraud increases if his newco-workers, encountered in the merger, have a history of fraud. Further, this effect is strongerbetween demographically similar employees.
Keywords: Financial advisors, Financial misconduct, Fraud, Social networks, Peer effects,Career networks
IWe are grateful to Leonce Bergeron, Kristine Hankins, Russell Jame, Bill Johnson, Andy Puckett,Scott Weisbenner, and seminar participants at Hong Kong University of Science & Technology and NationalUniversity of Singapore and conference participants at the 2014 American Law and Economics, 2015 EuropeanFinancial Association, 2014 Financial Management Association, 2015 Midwest Finance Association, 2014University of Kentucky/University of Tennessee “Jim & Jack” Conference, 2015 SFS Cavalcade, and 2015Western Finance Association conferences. The authors thank the Institute for Fraud Prevention for financialsupport and the Attorney General’s Office of Florida and the Arkansas Securities Department (and AnnMcDougal in particular) for providing assistance with the data.
Email addresses: [email protected] (Stephen G. Dimmock), [email protected] (William C.Gerken), [email protected] (Nathaniel P. Graham)
September 18, 2015
Prior to its expulsion from the industry, the investment advisory firm Stratton Oakmont
earned a reputation for fraudulent behavior. After its expulsion, many financial advisors1
from Stratton Oakmont moved to other firms, where they encountered new co-workers.
Shortly thereafter, these new co-workers began to commit frauds similar to those perpetrated
at Stratton Oakmont. Although only a small fraction of financial advisors ever commit
fraud, many of those who do are linked to each other through their employment histories.
Indeed, recognizing the relation between career networks and fraud, the Financial Industry
Regulatory Authority (FINRA) has additional regulatory requirements for any advisory firm
that employs a significant number of alumni from disciplined firms.2
Although there is anecdotal evidence that fraud is correlated within career networks,
empirically identifying whether career networks influence fraudulent behavior is difficult.
Career networks are endogenous; similar people choose to associate with each other. For
example, dishonest financial advisors may select an employer that encourages dishonest
behavior. As a result, it is difficult for observational studies to disentangle whether behavioral
similarity within a network is caused by: (1) contagion, or the transmission of behavior
through interpersonal networks; (2) selection, or the formation of ties due to matching on
individual characteristics; (3) common response to a shared environment (Manski, 1993,
2000).
In this paper, we test whether fraud is transmitted through career networks. We define
an advisor’s career network as the co-workers employed at the same branch of a firm at
the same time. To avoid the problem of endogenous network formation, we use changes to
career networks caused by mergers of financial advisory firms (i.e., the change in co-workers
1Throughout the paper we use “advisor” and “financial advisor” to refer to “registered representatives” -individuals who register as advisors with FINRA. This includes individuals who are commonly referred to asbrokers and financial planners.
2https://www.finra.org/web/groups/industry/@ip/@reg/@notice/documents/notices/p014653.
1
that occurs following a merger). Of course, merger decisions are themselves endogenous;
however, we exploit a unique feature of our data; we can look within the firm and identify
the specific individual who commits fraud. We also observe information about the financial
advisory firm, the branches within the firm, and the individual financial advisors within a
branch. In our empirical tests, we concentrate on the within-firm variation by including
merger-firm fixed effects. The key to our identification is that mergers occur at the firm level,
but changes in co-worker networks occur within firms at the branch level. Our empirical
tests exploit across-branch variation and the impact of combining branches during a merger -
while removing all effects at the firm level - which addresses the most obvious endogeneity
concerns.
For illustration, consider a merger between two hypothetical firms: Acquirer Firm has
branches in Atlanta, Boston, and Chicago. Target Firm has branches in Boston, Chicago, and
Detroit. When the firms merge, the branches in Boston and Chicago are combined, and the
branches in Atlanta and Detroit remain unchanged. Suppose that the financial advisors at
the Boston branch of Acquirer Firm have a history of fraudulent behavior, and the advisors
at all other branches of both firms have clean histories. Thus, following the merger there are
changes to the career networks of the advisors at the Boston and Chicago branches (of both
Acquirer Firm and Target Firm). However, only the career networks of the advisors from
the Boston branch of Target Firm have changed to now include individuals with a history
of fraud (the advisors from the Boston branch of Acquirer Firm). The empirical question,
then, is whether the advisors from the Boston branch of Target Firm are now more likely to
commit fraud relative to advisors from the Chicago branch of Target Firm. The comparison
between the two branches removes any variation common to all branches of the pre-merger
firm and any common time-series changes in the propensity to commit fraud.
We find evidence that fraudulent behavior is transmitted through career networks. Con-
trolling for merger-firm fixed effects, and using changes to a financial advisor’s network due to
2
a merger, we show that an advisor is more likely to commit fraud if his new co-workers have a
history of fraud. These results hold even after conditioning on the history and characteristics
of the advisor, as well as the history and characteristics of the advisor’s pre-merger co-workers.
We conduct multiple robustness tests to rule out alternative explanations. First, we
estimate a placebo test using a bootstrap procedure. In this test, we randomly “assign” each
financial advisor to a branch within the merged firm, and then estimate the relation between
the (counterfactual) Introduced Branch and fraud. We repeat this procedure 5,000 times.
The results confirm that the career network effects documented in our main tests are unlikely
to be spurious. Second, we show the results are not driven by across-branch variation in
supervision. Third, we show the results are similar for both target firm and acquirer firm
advisors. Fourth, we show the results are robust to including merger firm-county fixed effects,
effectively reducing the comparison to different branches of the same firm within the same
county. Finally, we show that the relative size of the merged branches matters; advisors from
the larger branch have more influence on the behavior of advisors from the smaller branch
than vice versa.
Next, we build on prior studies that show network effects are stronger between similar
individuals (e.g., Pool, Stoffman, and Yonker, 2014), and test how similarity amplifies the
transmission of fraudulent behavior within career networks. Although we find evidence of
network effects across all advisors, the effects are stronger among advisors who are of similar
ages or of the same ethnicity.
Our paper contributes to the literature on peer effects in financial markets,3 specifically, the
literature about peer effects on financial misconduct. Chiu, Teoh, and Tian (2013) show that
interlocking boards are associated with the spread of earnings management. Chidambaran,
3Prior studies show peer effects in portfolio choice (Hong, Jeffrey D, and Stein, 2004; Brown, Ivkovic, Smith,and Weisbenner, 2008; Ivkovic and Weisbenner, 2007; Kaustia and Knupfer, 2012), governance practices(Bouwman, 2011), firm policies (Shue, 2013), and retirement savings (Duflo and Saez, 2002, 2003).
3
Kedia, and Prabhala (2012) show that CEO-board connections are associated with financial
statement misreporting. Parsons, Sulaeman, and Titman (2014) find peer effects in financial
statement misreporting among geographically proximate firms. Unlike these studies, which
measure wrongdoing at the firm level, we observe fraud at the level of individual employees
located within distinct branches of the firm. This allows our identification strategy, which is
based entirely on within-firm variation across individual employees.
Our paper also contributes to the literature on financial advisors. The U.S. financial
advisory industry is economically significant, advising trillions of dollars in assets and
generating billions in revenues (more than $98 billion in 2013 according to the Securities
Industry and Financial Markets Association). The industry is also a major employer (635,837
financial advisors4 in 2013), and advisors are important for the financial well-being of many
households; Hung, Clancy, Dominitz, Talley, Berribi, and Suvankulov (2008) report that 73%
of individual investors use an advisor for investment decisions.
Despite the economic importance of the financial advisor industry, there are relatively few
academic studies. Of the studies that do exist, many focus on agency problems. Financial
advice is a credence good and its quality is difficult for households to evaluate, particularly
given the low financial literacy of many households (Lusardi and Mitchell, 2011; van Rooij,
Lusardi, and Alessie, 2011). The difficulty of evaluating financial advice, coupled with
commission-based compensation, creates significant agency problems. Prior studies generally
find that financial advisors steer clients towards high fee investments5 and fail to produce any
measurable benefits (Bergstresser, Chalmers, and Tufano, 2009; Bhattacharya, Hackethal,
Kaesler, Loos, and Meyer, 2012; Chalmers and Reuter, 2011; Hoechle, Ruenzi, Schaub, and
Schmid, 2013; Mullainathan, Noeth, and Schoar, 2012). In our study, we focus on how the
4See http://www.finra.org/Newsroom/Statistics/.5Anagol, Cole, and Sarkar (2013) and Brown and Minor (2013) find similar results in the insurance
industry.
4
career networks of financial advisors affect fraud.
The evidence suggests that fraud by financial advisors is common. FINRA reports
thousands of incidents each year, and during our sample (1999-2011) the average annual
value of fines, settlements, and arbitration awards due to fraud by financial advisors is $717.6
million. To put this in perspective, the average annual value of settlements due to financial
statement misreporting is $527 million (Karpoff, Lee, and Martin, 2008) over a similar period.
Thus, although settlements for financial statement misreporting are generally much larger
per event, financial advisor fraud is much more frequent, and the overall magnitudes are
comparable. Despite these similar magnitudes, there is vastly more research on financial
statement misreporting: Karpoff, Koester, Lee, and Martin (2012) report that over 150
academic studies examine the approximately 1,000 cases of financial statement misreporting
in the U.S. during the past three decades; in contrast, we are the first academic study to
examine the approximately 50,000 cases of financial advisor fraud over the past two decades.
This paper has policy implications regarding the appropriate punishment for fraud by
financial advisors. Our finding of contagion through career networks suggests that the optimal
penalty should reflect not only the harm of the event itself, but also the negative externality
created by influencing the behavior of others (Becker, 1968); an advisor’s fraud harms not
only his clients, but also the clients of the other advisors he influences. More generally, our
results provide evidence that the social transmission of crime, modeled by Glaeser, Sacerdote,
and Scheinkman (1996) and Sah (1991) in the context of street crime, occurs even within a
professional setting.
1. Data
We obtain data on financial advisors’ characteristics, employment histories, and fraud
from the Registered Representative database produced by Meridian-IQ. All registered rep-
resentatives (the formal legal term for what we call “financial advisors”) in the U.S. are
5
registered with FINRA when their employer files a Uniform Application for Securities Industry
Registration or Transfer (Form U4). The information disclosed in Form U4 is collected in the
Central Registration Depository (CRD), which assigns each advisor a unique identification
number that remains constant even if the advisor switches employers. Information about
individual advisors is disclosed to the public through FINRA’s BrokerCheck system and
through state regulatory agencies.
Our primary source of historical U4 filings is Meridian-IQ’s Registered Representative
Database. Meridian-IQ obtains these filings from state regulators. Because not all state
regulators supply the full set of variables we require, our universe of financial advisors consists
of those registered in 32 states. Many firms register all of their employees in all states,6 and
so we have data for many advisors even in the states that do not supply information. The
only advisors we do not observe are those who never register in a reporting state and who
only accept clients living in the non-reporting states (approximately 28% of advisors in 2012).
From Meridian-IQ we obtain a survival-bias free set of U4 filings for the period 1999-2014,
but our sample includes only mergers occurring from 1999 through 2011 because we require at
least three years post-merger to measure fraud (see Section 1.3.). During the sample period,
we have data for 522,363 unique individuals. The Meridian-IQ dataset is missing information
for many of the advisors’ personal characteristics (such as age and gender), and so we obtain
additional data directly from cooperating state securities regulators.7 To our knowledge, the
data set summarized in Table 1, is the most comprehensive sample of financial advisors used
in an academic study.
6This is because an advisor must be registered in every state from which he accepts customers.7We thank the state securities regulators of Alabama, Arkansas, California, Connecticut, Florida, Kentucky,
Maryland, Michigan, Minnesota, Nevada, Pennsylvania, New York, Texas, Vermont, and Washington forproviding data on advisors registered in their states.
6
1.1. Financial Advisory Firms, Branches, and Financial Advisors
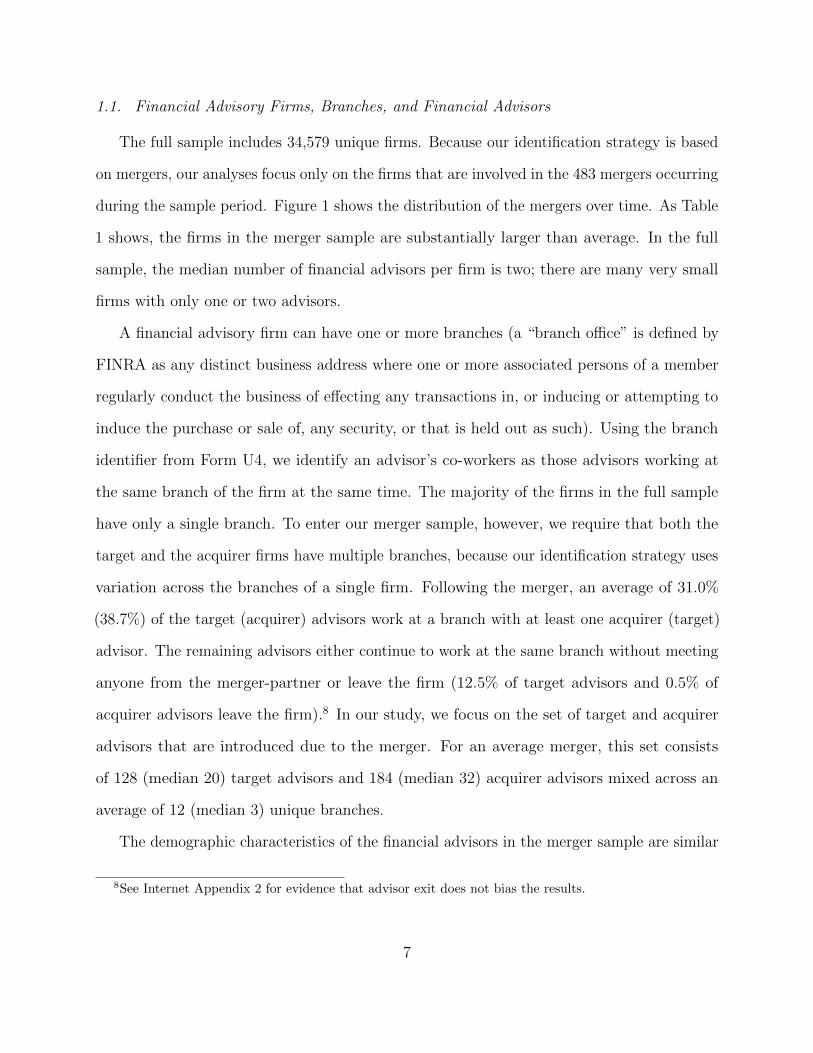
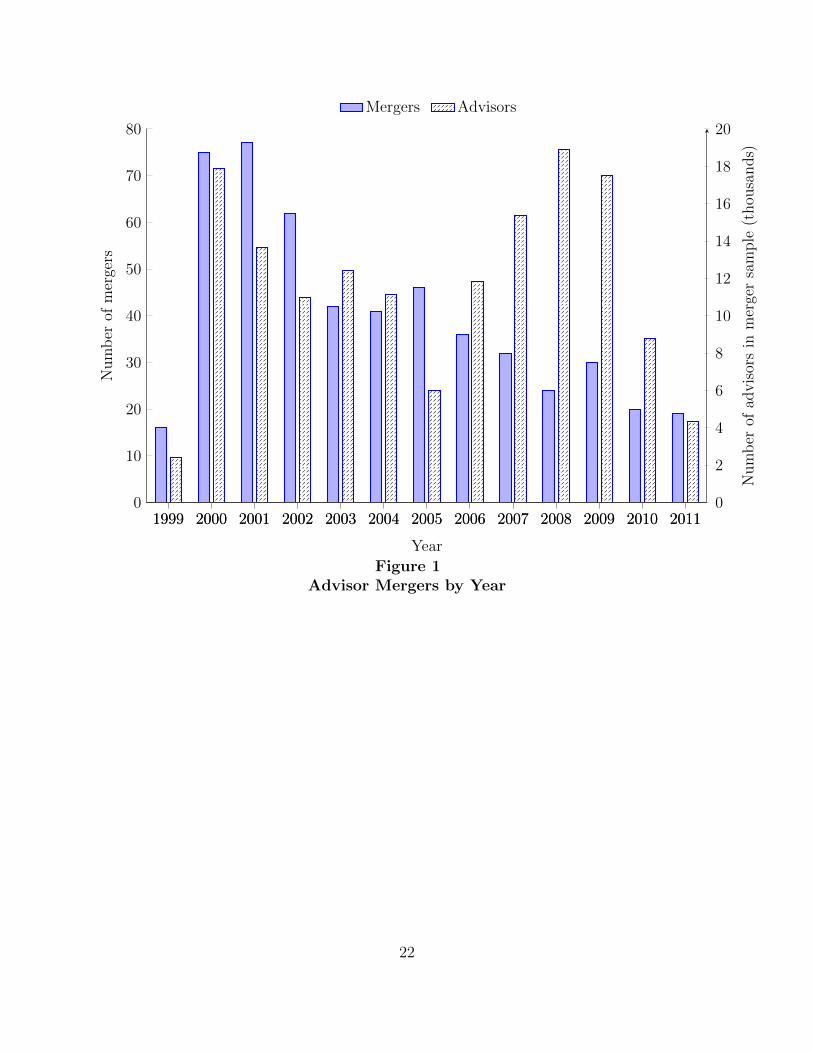
The full sample includes 34,579 unique firms. Because our identification strategy is based
on mergers, our analyses focus only on the firms that are involved in the 483 mergers occurring
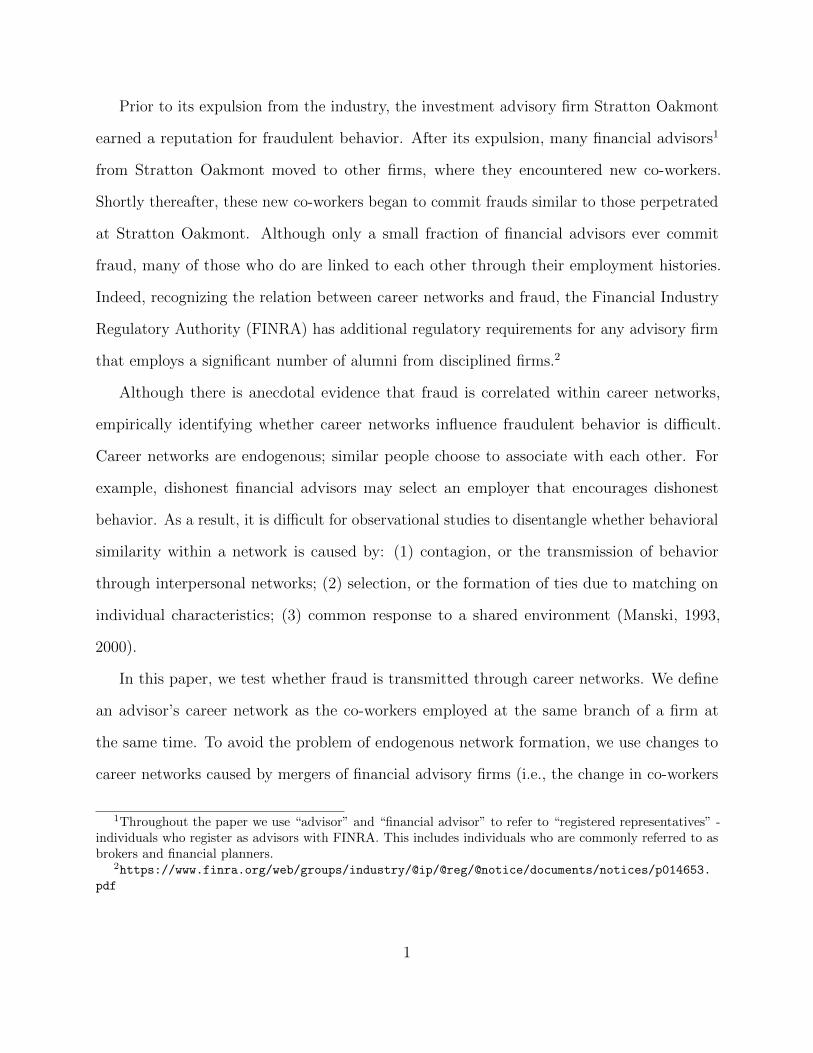
during the sample period. Figure 1 shows the distribution of the mergers over time. As Table
1 shows, the firms in the merger sample are substantially larger than average. In the full
sample, the median number of financial advisors per firm is two; there are many very small
firms with only one or two advisors.
A financial advisory firm can have one or more branches (a “branch office” is defined by
FINRA as any distinct business address where one or more associated persons of a member
regularly conduct the business of effecting any transactions in, or inducing or attempting to
induce the purchase or sale of, any security, or that is held out as such). Using the branch
identifier from Form U4, we identify an advisor’s co-workers as those advisors working at
the same branch of the firm at the same time. The majority of the firms in the full sample
have only a single branch. To enter our merger sample, however, we require that both the
target and the acquirer firms have multiple branches, because our identification strategy uses
variation across the branches of a single firm. Following the merger, an average of 31.0%
(38.7%) of the target (acquirer) advisors work at a branch with at least one acquirer (target)
advisor. The remaining advisors either continue to work at the same branch without meeting
anyone from the merger-partner or leave the firm (12.5% of target advisors and 0.5% of
acquirer advisors leave the firm).8 In our study, we focus on the set of target and acquirer
advisors that are introduced due to the merger. For an average merger, this set consists
of 128 (median 20) target advisors and 184 (median 32) acquirer advisors mixed across an
average of 12 (median 3) unique branches.
The demographic characteristics of the financial advisors in the merger sample are similar
8See Internet Appendix 2 for evidence that advisor exit does not bias the results.
7
to those in the full sample. As Table 1 shows, in the merger sample the average advisor is
about 40 years old and has over 10 years of experience in the financial advisory industry.
Target advisors are slightly older, more experienced, and have higher levels of assets under
management.9 We define supervisors as advisors that have passed the necessary tests (Series
9 or 10) to be a General Securities Sales Supervisor, which allows an advisor to manage or
supervise a firm’s sales and securities operations. Approximately 6% of advisors in our sample
are supervisors. We map last names to ethnic categories using the classification algorithm
developed by Ambekar, Ward, Mohammed, Male, and Skiena (2009). Pool, Stoffman, and
Yonker (2014) show this algorithm works well at classifying a sample of mutual fund managers.
Approximately 90% of the advisors in our sample are classified as white, and most of the
remainder are classified as either Asian or Hispanic.10
1.2. Mergers of Financial Advisory Firms
We identify mergers between financial advisory firms using advisors’ employment histories
in the Meridian data. Each financial advisor must disclose his employment history, including
the reason for leaving each prior job. If the advisor left because his firm (the target firm)
was acquired in a merger, the reason for leaving is given as “Mass Transfer.”11 We use mass
transfers to identify mergers, and classify firms as targets or acquirers. We cross-check the
mergers in our sample with news stories and with the mergers listed in the appendix of Hong
9Meridian provides the assets under management (AUM) for 57.2% of the financial advisors in the sample,but this variable is only available as a cross-section observed at the end of the sample period.
10We cannot associate an ethnicity with every advisor for several reasons. First, some last names areindeterminate (e.g., 48.52% and 46.72% with the name Williams identify as white and African American,respectively). Second, we do not have last names for all of the advisors in the Meridian-IQ database. Finally,because of the commonality between white and African American last names, we have difficulty clearlyidentifying African American advisors.
11The mass transfer program is intended to simplify the bulk transfer of registration data in the event ofa merger, consolidation, or reorganization. A mass transfer must involve at least 50 individuals to qualify,and allows the firm to avoid paying some additional registration fees and reduces the number of requiredfilings. Note that this implies our merger sample implicitly conditions on the target firm having at least 50employees.
8
and Kacperczyk (2010), and find this method reliably identifies and classifies merging firms.
We define the merger date as the date of the earliest mass transfer between a target-
acquirer pair (many mergers involve several mass transfers at slightly different dates). The
pre-merger period is defined as the three years prior to the merger date, and the post-merger
period is defined as the three years after the merger date. To avoid biases due to variation in
filing and reporting dates (many target advisors appear to be employed at both the target and
the acquirer for several weeks), we observe pre-merger employment 30 days before the merger
date. Because we use the earliest mass transfer date and some advisors are not reported as
transferred until several months later, we observe post-merger employment 100 days after the
merger. For example, in 2006 Advanced Equities Financial Corp. acquired First Financial
Planners Inc. (FFP). The first mass transfer took place on January 1, 2007. We observe
employment for advisors at Advanced Equities and FFP as of December 2, 2006, thirty days
prior, because some FFP advisors began work at Advanced Equities in December. There were
three additional mass transfers, on January 3, 5, and 16. Because there are multiple transfer
dates, observing employment of FFP advisors in January 2007 could give the appearance
that many advisors remained at FFP, when in fact they all moved to Advanced Equities. To
avoid this problem, we observe where advisors for both firms were registered as of April 11,
2007, one hundred days after the first transfer date. The three year pre-merger period is from
December 2, 2003 to December 2, 2006 and the three year post-merger period is from April
11, 2007 to April 11, 2010; we do not include the initial transfer date in either the pre- or
post-merger period.
1.3. Fraud
We identify cases of fraud by financial advisors based on mandatory disclosures collected
by Meridian-IQ. FINRA Rule 3070 requires firms to report all written customer complaints
to the appropriate regulator through the CRD system. Nearly all customer complaints are
9
based on the legal concepts of fraud or negligence. The most common customer complaints
include one or more of: unsuitability, unauthorized trading, churning, and misrepresentation
or omission. Unsuitability occurs when an advisor recommends assets that are outside the
client’s risk tolerance or are not suited for the client’s financial goals. Unauthorized trading
occurs when an advisor fails to obtain permission before trading securities, or acts against
a client’s express instructions. Churning is the excessive trading of securities to generate
commissions. Misrepresentation or omission occurs when an advisor knowingly misstates
or omits material information about an investment. Financial advisors, however, are not
responsible if their investment advice simply turns out to be unprofitable ex post (i.e., if an
advisor recommends an investment, in good faith and with full disclosure, but the investment
loses money).
A complaint remains on an advisor’s record unless it is dismissed by the FINRA arbitration
panel or the customer withdraws the complaint.12 Nearly all FINRA arbitration decisions
or customer withdrawals occur within two years of the complaint.13 Although the Meridian
data includes complaints filed through 2014, we include only complaints filed before 2012;
thus our sample includes only substantiated complaints.
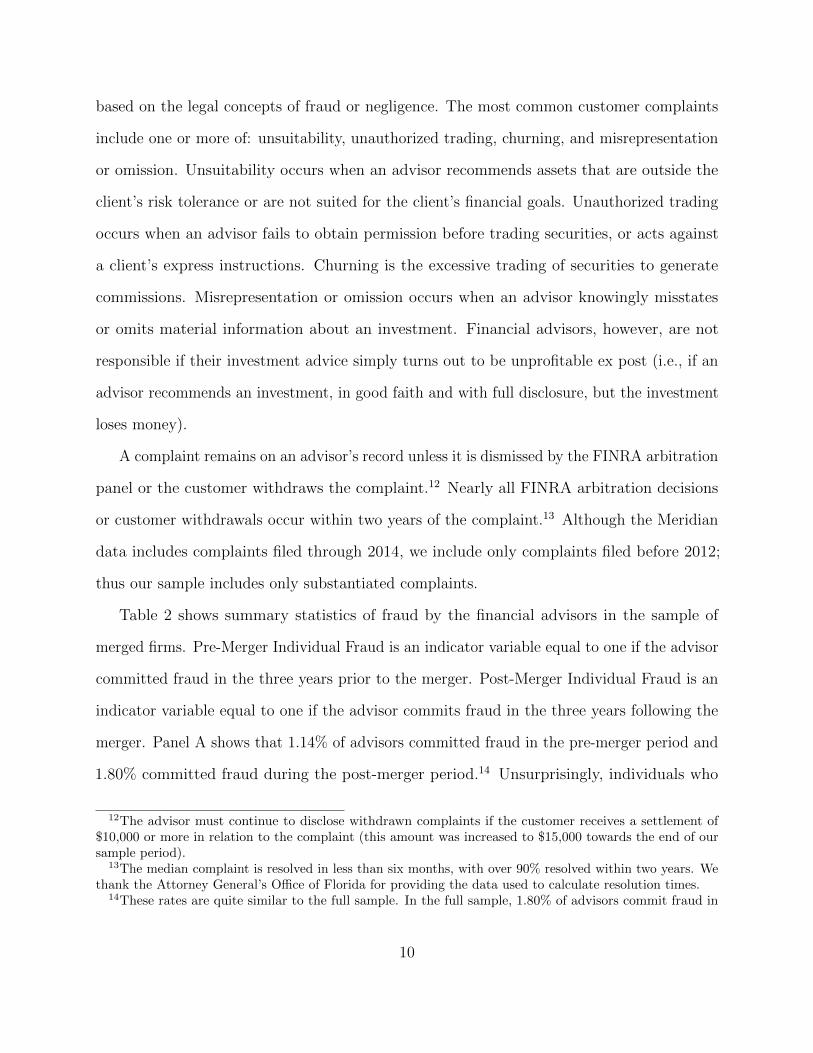
Table 2 shows summary statistics of fraud by the financial advisors in the sample of
merged firms. Pre-Merger Individual Fraud is an indicator variable equal to one if the advisor
committed fraud in the three years prior to the merger. Post-Merger Individual Fraud is an
indicator variable equal to one if the advisor commits fraud in the three years following the
merger. Panel A shows that 1.14% of advisors committed fraud in the pre-merger period and
1.80% committed fraud during the post-merger period.14 Unsurprisingly, individuals who
12The advisor must continue to disclose withdrawn complaints if the customer receives a settlement of$10,000 or more in relation to the complaint (this amount was increased to $15,000 towards the end of oursample period).
13The median complaint is resolved in less than six months, with over 90% resolved within two years. Wethank the Attorney General’s Office of Florida for providing the data used to calculate resolution times.
14These rates are quite similar to the full sample. In the full sample, 1.80% of advisors commit fraud in
10
committed fraud in the pre-merger period are more likely to commit fraud in the post-merger
period: 15.19% vs. 1.65%.
For each advisor, we identify two networks: Pre-Merger Co-Workers are the advisor’s
co-workers at the Original Branch just before the merger. New Co-Workers are the advisor’s
new colleagues who worked at the merger partner, and are then merged into the same branch
as the advisor. For each network, we measure fraud in three ways: (1) Fraud Dummy is
an indicator variable equal to one if any of the other individuals in the advisor’s network
committed fraud during the pre-merger period; (2) Fraud Rate is the percentage of other
individuals in the advisor’s network who committed fraud during the pre-merger period; (3)
High Fraud Rate is an indicator variable equal to one if the Fraud Rate for the advisor’s
network is greater than the sample individual advisor average of 1.14% (i.e., a very large
branch would not be classified as High Fraud Rate if only 1 of 100 advisors had committed
fraud during the pre-merger period). Note that for all three measures of fraud, we do not
include the advisor’s own history of fraud when calculating the network fraud variables.
Further, all three measures include only information from the pre-merger period.
Panel A of Table 2 shows there is a positive relation between fraud by an advisor and
fraud by his Pre-Merger Co-Workers. An advisor whose Pre-Merger Co-Workers committed
fraud in the pre-merger period is 1.33 percentage points more likely to have committed fraud
in the pre-merger period, and 1.10 percentage points more likely to commit fraud in the
post-merger period.
Panel B of Table 2 shows cross-tabulations of the merged branches based on the branches
Pre-Merger fraud status. “Clean” (“Dirty”) indicates a branch at which none (at least one)
of the financial advisors have committed a prior fraud. A significant fraction (33.5%) of
observations are in the off-diagonal cells, suggesting that mergers often change an advisor’s
any three-year window.
11
exposure to co-workers who have committed fraud (i.e., clean and dirty branches are frequently
mixed together).
Panel C summarizes post-merger fraud for the sample of advisors who did not commit
fraud during the pre-merger period. The panel reports a two-by-two cross tabulation: the
top (bottom) row reports results for advisors whose Pre-Merger Co-Worker Fraud Rate was
below (above) the sample average of 1.14%. Similarly, the columns divide the sample based
on the New Co-Worker Fraud Rate. The clearest pattern is that an advisor is substantially
more likely to commit fraud during the post-merger period if he encounters new co-workers
with a high fraud rate.
2. Career Networks and Fraud
The primary empirical problem in network studies is distinguishing influence (contagion)
from self-selection (the tendency for individuals to associate with similar individuals). For
example, unethical individuals may actively seek employment at a firm with a reputation for
unethical behavior. Thus, identifying contagion requires an exogenous change to a financial
advisor’s network. We use changes in networks caused by mergers of financial advisory
firms. Of course, it is possible that firms choose to merge for reasons related to fraud. For
example, a firm with a poor reputation might actively solicit acquisition by a firm with
a good reputation, and firms with good reputations may avoid acquiring firms with poor
reputations. Such endogenous reasons for a merger, however, operate at the firm-level, and
not the branch- or individual-level. In our tests, we include merger-firm fixed effects (i.e., for
each merger all advisors from the acquirer receive one fixed effect and all advisors from the
target receive a separate fixed effect). By including these fixed effects, we effectively eliminate
any variation at the firm-level, including the (potentially) endogenous reasons for the merger.
Our analyses use only the residual variation that remains at the branch- or individual-level.
This allows our tests to measure contagion and not self-selection, subject to the assumption
12
that firms do not systematically make merger decisions based on within-firm, branch-specific
characteristics that are correlated with fraud.
Another important point is that the dependent variable, Post-Merger Individual Fraud, is
measured during the post-merger period. All of the independent variables are measured during
the pre-merger period. By measuring the dependent variable over a separate time-period
from the independent variables, we avoid some of the mechanical biases that can occur in
network studies (e.g., see Angrist, 2014).
2.1. Networks and Fraud: Changes in Career Networks and Changes in Fraud
Table 3 reports the results from logit regressions that relate fraud by financial advisors
to the advisor’s network. There is one observation per advisor-merger, and we estimate the
following specification:
Pr(yi,m = 1|xi,m) = F (β ·New Co-Worker Fraudi,m + Xi,m · σ + αm,f ) (1)
Where yi,m is an indicator equal to one if financial advisor i commits fraud in the three-
year period following merger m; F (·)indicates the logit function; New Co-Worker Fraudi,m
measures fraud during the pre-merger period committed by the advisor’s new colleagues at
the merged branch; Xi,m is a vector of control variables; and αm,f indicates a separate fixed
effect for each merger-firm combination (separate fixed effects for the target and acquirer
in each merger). All specifications reported in Table 3 include controls for: (1) Pre-Merger
Co-Worker Fraud, which measures fraud during the pre-merger period by individuals in
the advisor’s Original Branch; (2) Pre-Merger Individual Fraud Dummy, which is set to
one if the advisor was caught for fraud in the pre-merger period; (3) ln(# of Pre-Merger
Co-Workers), which is the natural logarithm of the number of people in the advisor’s branch
prior to the merger; and (4) ln(# of New Co-Workers), which is the natural logarithm of
the number of new co-workers at the branch into which the advisor is merged. The models
13
also include controls for advisory firm type,15 advisor age, gender, advisor experience, and
assets-under-management.16 The Z scores reported in Table 3 are based on standard errors
clustered by merger. Internet Appendix Table 1 shows the results are similar with alternative
specifications (no fixed-effects panel logit, linear fixed effects model, or a count model of the
number of frauds).
Table 3 reports three specifications, each using a different variable to measure fraud in
an advisor’s network. In column (1), the variable is a dummy equal to one if any of the
co-workers in the network committed fraud during the pre-merger period. In column (2), the
variable is the percentage of co-workers that committed fraud. In column (3), the variable is
set equal to one if the percentage of co-workers that committed fraud is above the individual
advisor sample average. The indicator variable in column (1) has the advantage of simplicity,
but the disadvantage of a mechanical positive relation with the number of advisors in the
branch. All three variables give similar results, and so for the remainder of the paper we
focus on the high percentage variable in column (3) as it combines simplicity while avoiding
a mechanical relation with branch size.
The results show that an advisor is significantly more likely to commit fraud if he is
merged into a branch whose employees have a history of fraud. The coefficient reported in
column (3) of Table 3 implies that an advisor is 38% more likely to commit fraud in the three
years following a merger if his Introduced Branch co-workers have an above average rate of
individuals who have committed fraud. Given the merger-firm fixed effects, the results can
be interpreted as follows. Suppose there are two identical advisors who work at different
branches of the same firm. When the firm merges, one of the advisors is merged into a new
15We include indicator variables for the advisory firm types reported by Meridian-IQ: wirehouse, bank,independent, institutional, regional, discounter, product distributor, insurance, and other.
16Data for for age, assets under management, and gender are missing for some financial advisors. We inserta value of zero for missing data and include dummy variables equal to one if the variable is missing. Theresults are very similar if we instead drop these observations.
14

branch with a high fraud rate (dirty branch). The other advisor is merged into a clean branch.
The advisor merged into the dirty branch is significantly more likely to commit fraud in the
next three years relative to the advisor at the clean branch.
The results for the control variables reported in Table 3 are intuitively reasonable and
consistent across specifications. The coefficients on the Original Branch Fraud variables are
all positive and significant, indicating advisors who worked at a dirty branch prior to the
merger are more likely to commit fraud after the merger. The coefficients on Pre-Merger
Individual Fraud Dummy are also positive and significant, indicating that advisors who
committed fraud before the merger are also more likely to commit fraud after the merger.
Overall, the results are consistent with the transmission of fraudulent behavior through
career networks. The inclusion of merger-firm fixed effects removes the variation common to
all advisors in a pre-merger firm, and shows that the post-merger propensity to commit fraud
varies depending on the characteristics of the new co-workers encountered due to the merger.
2.2. Placebo Test
As robustness test, we use a bootstrap procedure to impose the null of no career network
effects by randomizing assignment to post-Introduced Branches. Specifically, within each
merger-firm, we counterfactually assign each advisor to a random post-Introduced Branch to
create a pseudo post-Introduced Branch. This allows us to randomize the advisors with respect
to their post-Introduced Branch connections, but leave all other characteristics unchanged.
Using these counterfactual branch assignments, we recalculate Introduced Branch High Fraud
Rate (and Introduced Branch Size). We then estimate the regression in column (3) of Table
3. We repeat this procedure 5,000 times.
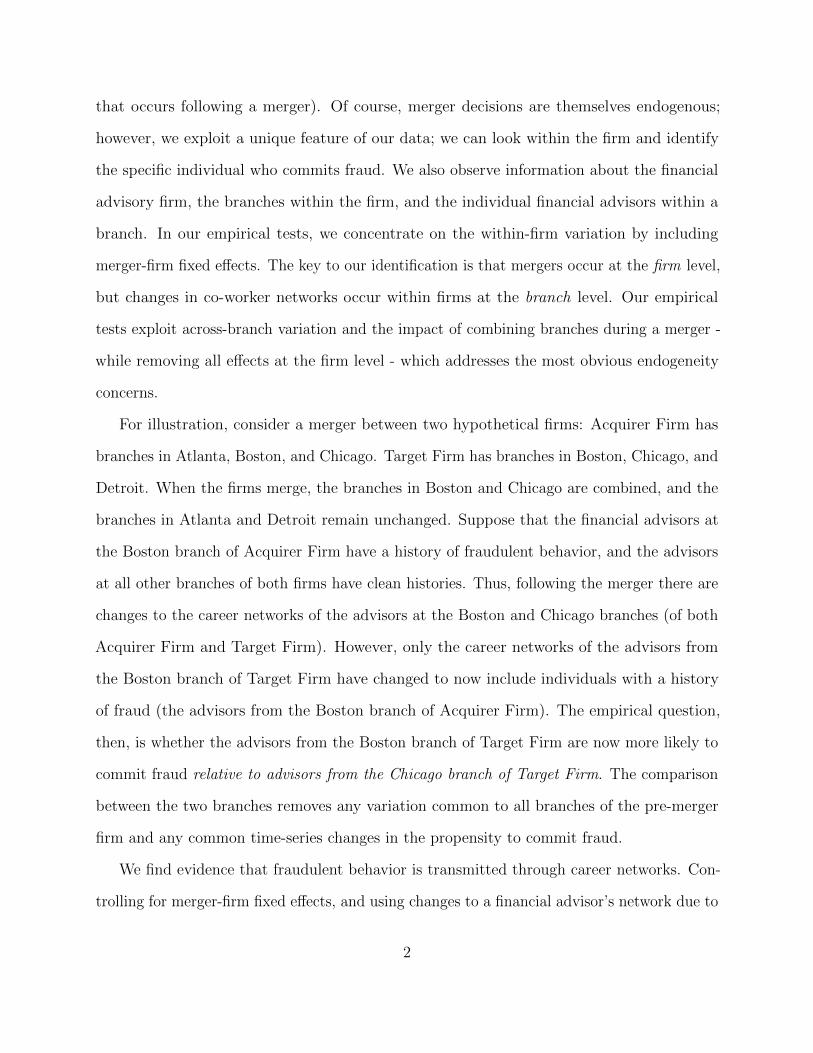
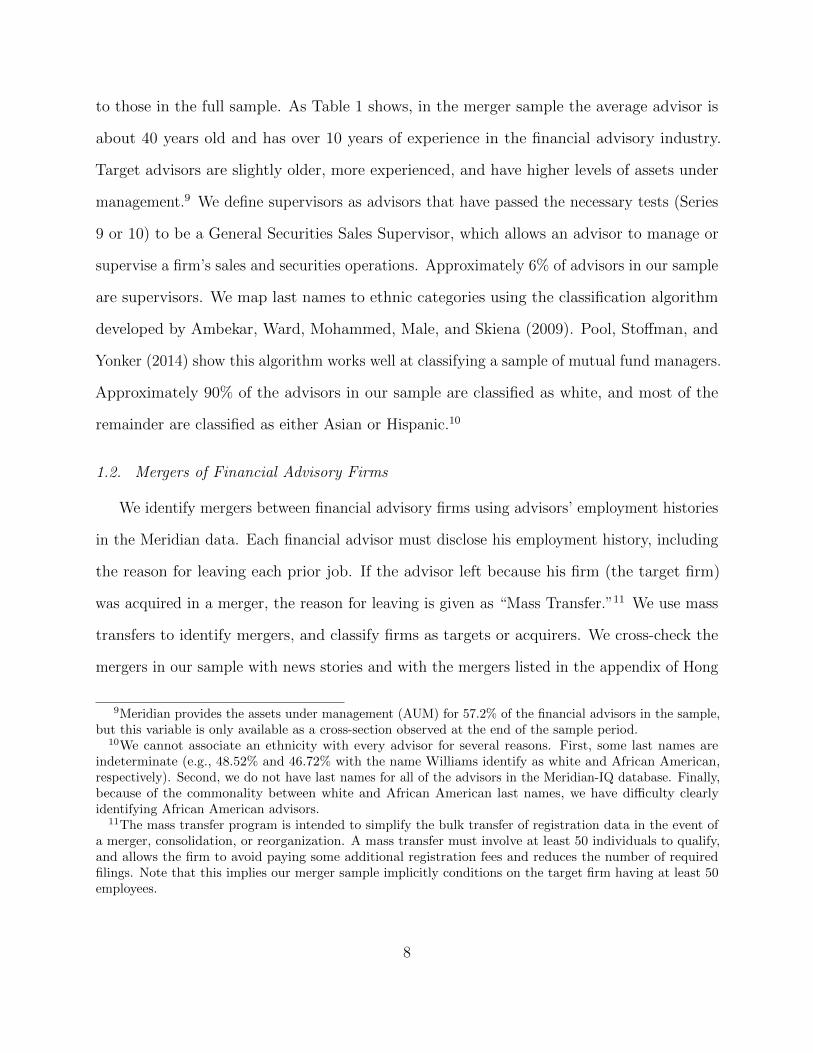
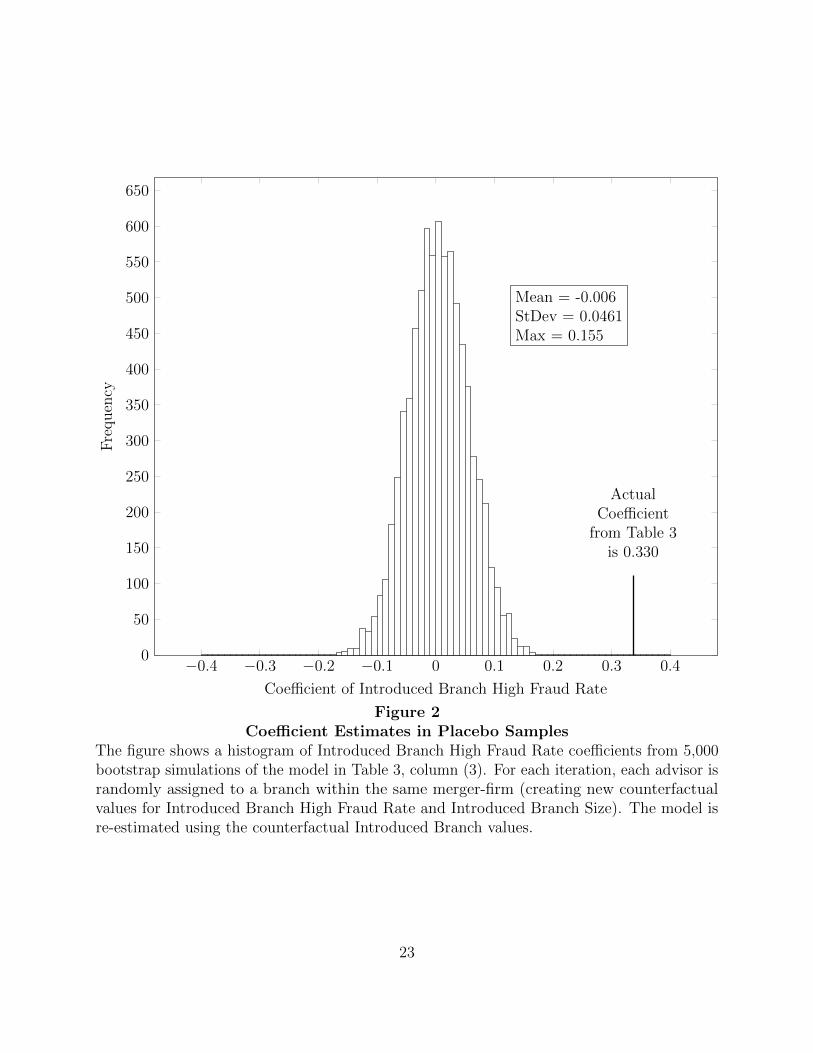
Figure 2 plots the distribution of the coefficients estimated using the counterfactual
Introduced Branch High Fraud Rate variable. The figure clearly shows that the actual
estimate from column (3) of Table 3 lies well to the right of the entire mass of the distribution
15
of estimates from the placebo test. The actual estimated coefficient of 0.330 is over seven
standard deviations above the mean of the simulations (-0.006). The key takeaway is that
actual branch assignments, and thus the actual connections with new co-workers from the
Introduced Branch, are crucial for generating the observed effect of career networks, ruling
out a host of potential alternative explanations.
3. Robustness and Alternative Explanations
Given the placebo test results, any alternative explanation of Table 3 must satisfy two
criteria. First, the alternative mechanism must be based on across-branch variation within a
firm. Second, this across-branch variation must be spuriously correlated with fraud. In this
section, we identify and test potential alternative explanations meeting these criteria.
3.1. Within-Firm Across-Branch Variation in Supervision
One potential alternative explanation is that, even within an advisory firm, the degree of
oversight and supervision varies across branches. In this case, branches with lax supervisors
could have higher (pre-merger) fraud rates than branches with strict supervisors. Advisors
merged into a new branch with a lax supervisor would be relatively more likely to commit
fraud. This alternative explanation is similar to the career-networks explanation; it implies
that an individual’s propensity to commit fraud is affected by the characteristics of the
new co-workers encountered due to a merger, but in this case the new co-worker is also
a supervisor. Although supervisors could affect fraud via the same informal, peer-to-peer
channels as other co-workers, supervisors also have a more formal, hierarchical relation with
the advisors in their branch. Thus, if fraudulent supervisors drive the results, this would
complicate the interpretation, as contagion via supervisors blurs together two conceptually
distinct mechanisms.
The specifications reported in Table 4 test whether fraud by supervisors drives the results.
The specifications in all three columns are based on that reported in column (3) of Table 3,
16
and include merger-firm fixed effects. Columns (1) and (2) of Table 4 also include a control
for whether the advisor is a sales supervisor. Column (2) also includes Introduced Branch
Dirty Supervisor, an indicator variable equal to one if a sales supervisor at the merger-branch
committed fraud during the three years prior to the merger. Column (2) also includes Original
Branch Dirty Supervisor, an indicator variable equal to one if the sales supervisor at the
advisor’s Original Branch has a history of fraud. Column (3) excludes all sales supervisors
from the sample.
In all three specifications reported in Table 4, the coefficient on Introduced Branch High
Fraud Rate is essentially identical to that in Table 3. In columns (2) and (3), the coefficient
on Introduced Branch Dirty Supervisor is not significant. The results show that fraud by
supervisors does not drive the results, and fail to support the notion that across-branch
variation in supervision causes the observed relation between Introduced Branch Fraud and
post-merger fraud.
3.2. Variation in Branch-Level Policies or Internal Controls
A closely related alternative explanation is that there is within-firm, but across-branch,
variation in policies or internal controls. In this case, branches with poor internal controls
could have more fraud before the merger, and because of changed incentives advisors merged
into these branches could commit more fraud post-merger; this would result in a spurious
correlation between carer networks and fraud. This alternative explanation, however, implies
asymmetric effects for advisors from target and from acquirer branches. Target advisors are
generally merged into the acquirer’s branches; it seems reasonable to assume that the oversight
and supervision of the acquiring branch, and not the target branch, persists following the
merger. Thus, this alternative explanation implies a strong effect for advisors from the target
branch, but no effect (or a much weaker effect) for advisors from the acquirer branch.
Column (1) of Table 5 reports a specification that includes an interaction term between
17

Introduced Branch High Fraud Rate and Acquirer Branch; the specification is otherwise
identical to that in column (3) of Table 3. The alternative explanation predicts that the
coefficient on the interaction term would be negative. The estimated coefficient, however, is
positive and insignificant. Thus this test fails to support the alternative explanation that
branch-specific policies or internal controls drive the results.
3.3. Relative Sizes of the Merging Branches
When two branches merge, all else equal, we expect that the culture and social norms of
the larger branch will have a greater effect on behavior in the merged branch. Column (2) of
Table 5 includes an indicator variable, Relative Branch Size, equal to one if the Introduced
Branch is larger than the advisor’s Original Branch. We also interact this indicator variable
with Introduced Branch High Fraud Rate. The coefficient on the interaction term is positive
and significant at the 10% level, suggesting that the effect of fraud by new co-workers from
the Introduced Branch is stronger when the advisor moves from a smaller branch to a larger
branch.
3.4. Geographical Variation
Our identification strategy assumes that, after conditioning on Original Branch and
individual characteristics, advisors at different branches of the same firm would have similar
rates of fraud if the merger had not occurred. Arguably, fraud could vary across different
branches of the same firm due to different local demographic or financial conditions, state-level
regulatory environments, or other variation across geographical regions. If this geographical
variation is correlated with fraud at the merger-branch partner, it could bias the results.
It is not obvious why this geographic variation would be correlated with merger-branch
fraud. Nevertheless, to guard against this possibility we estimate additional specifications
that include geographic fixed effects.
18
The specifications reported in Table 6 extend the baseline specification by including
geographic fixed effects. The specification in column (1) includes 5-digit zip code fixed effects,
effectively removing all time-invariant characteristics of a narrow geographic area. The
specification in column (2) includes state-year fixed effects, effectively removing all variation
in a state during a given year. The strongest specification, in column (3), includes merger
firm-county fixed effect. This last specification effectively compares different branches of the
same firm and in the same county; thus controlling for all common variation across different
branches of the same firm in a given area at a given point in time. For all three specifications,
the coefficient on Introduced Branch Fraud High Rate remains positive and statistically
significant.
4. Similarity and Contagion
Prior studies show that the transmission of behavior through social networks is stronger
between individuals who are more similar. For example, Pool, Stoffman, and Yonker (2014)
find that mutual fund managers in the same community hold similar portfolios, and this
effect is stronger when both managers are similar in age or of the same ethnic background.
(McPherson, Smith-Lovin, and Cook, 2001, rank age and ethnicity as the two most important
factors in social network formation.) Based on the financial advisors’ ages and ethnicities, we
create several additional variables: (1) Same Age Fraud Dummy : an indicator equal to one if
an individual whose age is within 5 years (i.e., the other advisor’s age is +/- 5 years or less)
at the Introduced Branch has previously been caught for fraud; (2) ln(1 + Merger Same Age
Network Size): the natural logarithm of the number of people at the other branch whose age
is within +/- 5 years of the advisor; (3) Same Ethnicity Fraud Dummy : an indicator equal
to one if an individual of the same ethnicity at the Introduced Branch has previously been
caught for fraud; (4) ln(1 + Merger Same Ethnicity Network Size): the natural logarithm
of the number of people at the Introduced Branch with the same ethnicity as the financial
19
advisor.
Column (1) of Table 7 shows the results for similar age. The coefficient estimate for
Introduced Branch High Fraud Rate, reported in the first row, remains positive and significant.
Thus, the effect of career networks is not driven entirely by advisors with similar age. The
coefficient estimate for Introduced Branch High Fraud Rate × Same Age Fraud Dummy is
positive and significant at the 10% level. This result is consistent with a stronger contagion
effect between individuals whose ages are similar.
Column (2) of Table 7 shows the results for same ethnicity. Once again, the coefficient
estimate for Introduced Branch High Fraud Rate remains positive and significant, implying
that the effect of career networks is not driven entirely by advisors with the same ethnicity.
The coefficient estimate for Introduced Branch High Fraud Rate Same Ethnicity Fraud
Dummy is positive and significant at the 10% level. This result is consistent with a stronger
contagion effect between individuals of the same ethnicity.
Both results are consistent with prior studies that find the effects of social networks
on behavior are stronger for similar people. These results also imply that any alternative
explanation of the results, must explain why age and ethnicity would affect the relation
between career networks and fraud within a branch.
5. Conclusion
Despite the large size and economic importance of the financial advisory industry, and
the large losses suffered due to fraud occurring within this industry, there has been little
academic study of financial advisors. We conduct the first large scale academic study of fraud
by financial advisors.
We show that the propensity to commit fraud is transmitted through career networks.
We identify the effects of career networks using changes in co-workers due to mergers; we
include merger-firm fixed effects in our analyses and thus use the variation across different
20

advisors and different branches within the same firm. The results show that fraudulent
co-workers affect the propensity to commit fraud. After a merger, an advisor is 38% more
likely to commit fraud if he is merged into a new branch that includes individuals with a
history of fraud (relative to an advisor from the same firm who is merged into a branch
with no history of fraud). This result holds even controlling for the advisor’s own history of
fraud, the fraudulent behavior of his pre-merger co-workers, individual characteristics such as
age, experience, and assets under management, and firm-level effects. The effect of career
networks is stronger when the co-workers have similar age or the same ethnicity. Our results
suggest that the optimal penalties for fraud by financial advisors should reflect not only the
harm of the event itself, but also the negative spillover created by encouraging such behavior
in others.
21
0
10
20
30
40
50
60
70
80
1999 2000 2001 2002 2003 2004 2005 2006 2007 2008 2009 2010 2011
Year
Num
ber
ofm
erge
rsMergers
0
2
4
6
8
10
12
14
16
18
20
1999 2000 2001 2002 2003 2004 2005 2006 2007 2008 2009 2010 2011
Num
ber
ofad
vis
ors
inm
erge
rsa
mple
(thou
sands)
Advisors
Figure 1Advisor Mergers by Year
22
−0.4 −0.3 −0.2 −0.1 0 0.1 0.2 0.3 0.40
50
100
150
200
250
300
350
400
450
500
550
600
650
Coefficient of Introduced Branch High Fraud Rate
Fre
quen
cy
ActualCoefficient
from Table 3is 0.330
Mean = -0.006StDev = 0.0461Max = 0.155
Figure 2Coefficient Estimates in Placebo Samples
The figure shows a histogram of Introduced Branch High Fraud Rate coefficients from 5,000bootstrap simulations of the model in Table 3, column (3). For each iteration, each advisor israndomly assigned to a branch within the same merger-firm (creating new counterfactualvalues for Introduced Branch High Fraud Rate and Introduced Branch Size). The model isre-estimated using the counterfactual Introduced Branch values.
23
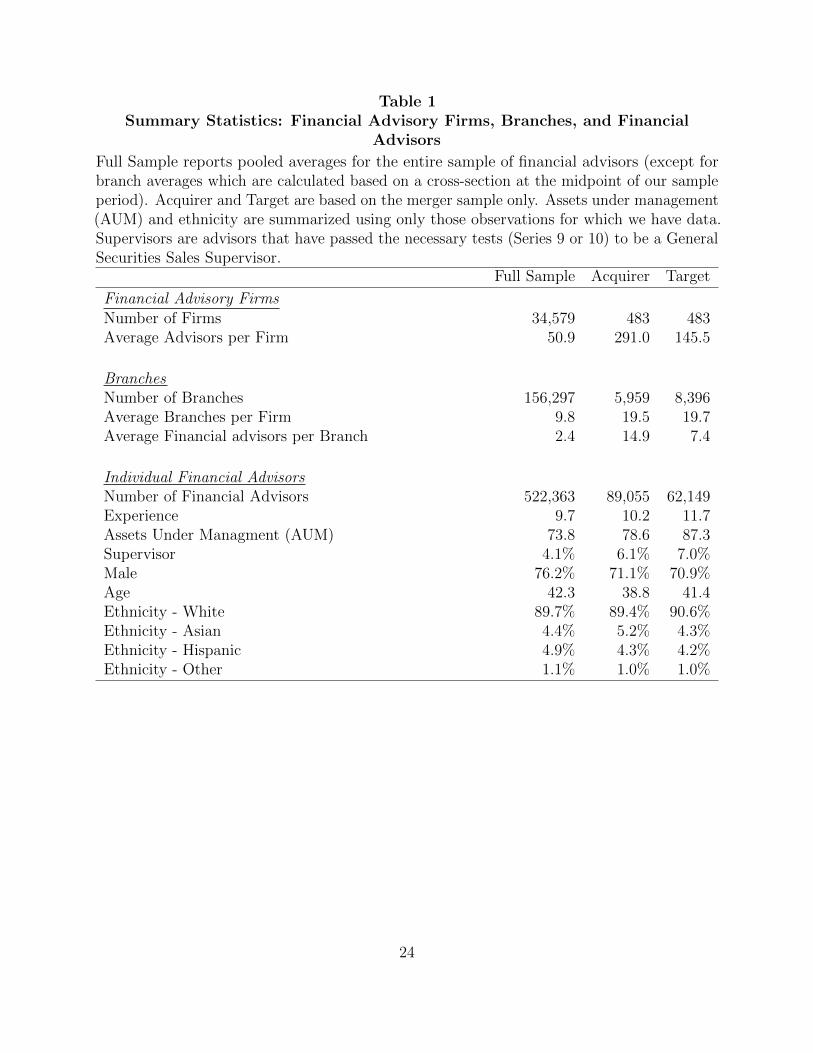
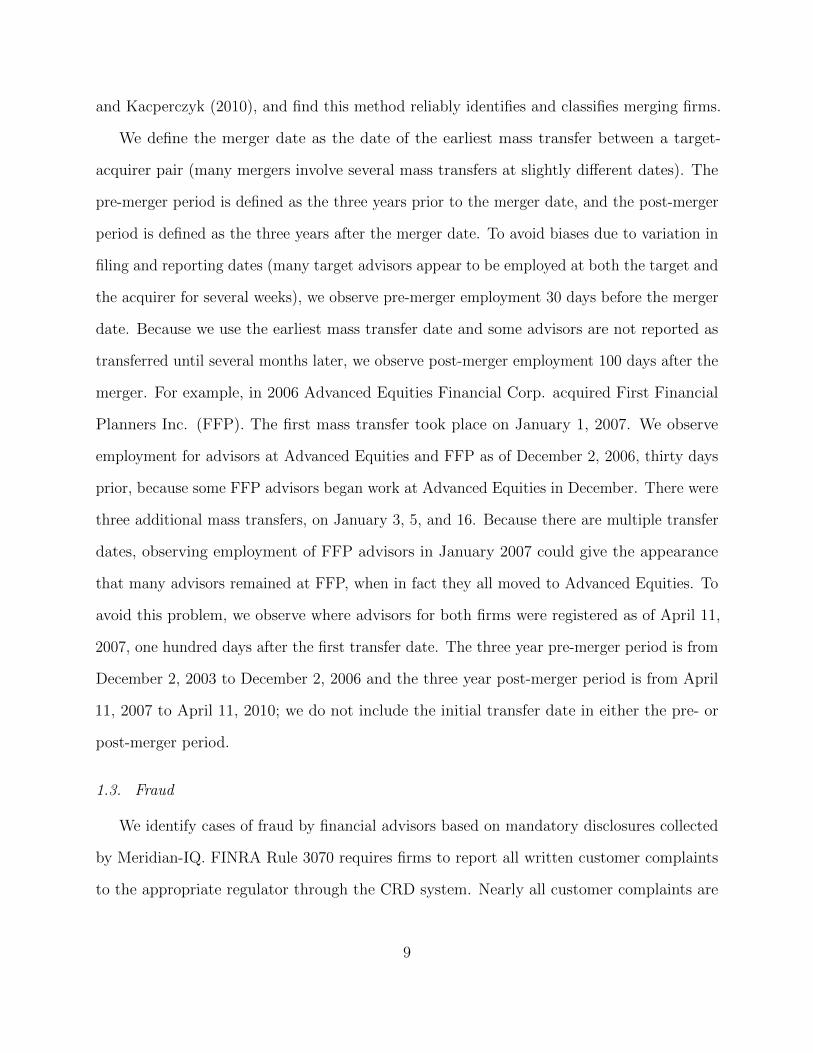
Table 1Summary Statistics: Financial Advisory Firms, Branches, and Financial
Advisors
Full Sample reports pooled averages for the entire sample of financial advisors (except forbranch averages which are calculated based on a cross-section at the midpoint of our sampleperiod). Acquirer and Target are based on the merger sample only. Assets under management(AUM) and ethnicity are summarized using only those observations for which we have data.Supervisors are advisors that have passed the necessary tests (Series 9 or 10) to be a GeneralSecurities Sales Supervisor.
Full Sample Acquirer Target
Financial Advisory FirmsNumber of Firms 34,579 483 483Average Advisors per Firm 50.9 291.0 145.5
BranchesNumber of Branches 156,297 5,959 8,396Average Branches per Firm 9.8 19.5 19.7Average Financial advisors per Branch 2.4 14.9 7.4
Individual Financial AdvisorsNumber of Financial Advisors 522,363 89,055 62,149Experience 9.7 10.2 11.7Assets Under Managment (AUM) 73.8 78.6 87.3Supervisor 4.1% 6.1% 7.0%Male 76.2% 71.1% 70.9%Age 42.3 38.8 41.4Ethnicity - White 89.7% 89.4% 90.6%Ethnicity - Asian 4.4% 5.2% 4.3%Ethnicity - Hispanic 4.9% 4.3% 4.2%Ethnicity - Other 1.1% 1.0% 1.0%
24
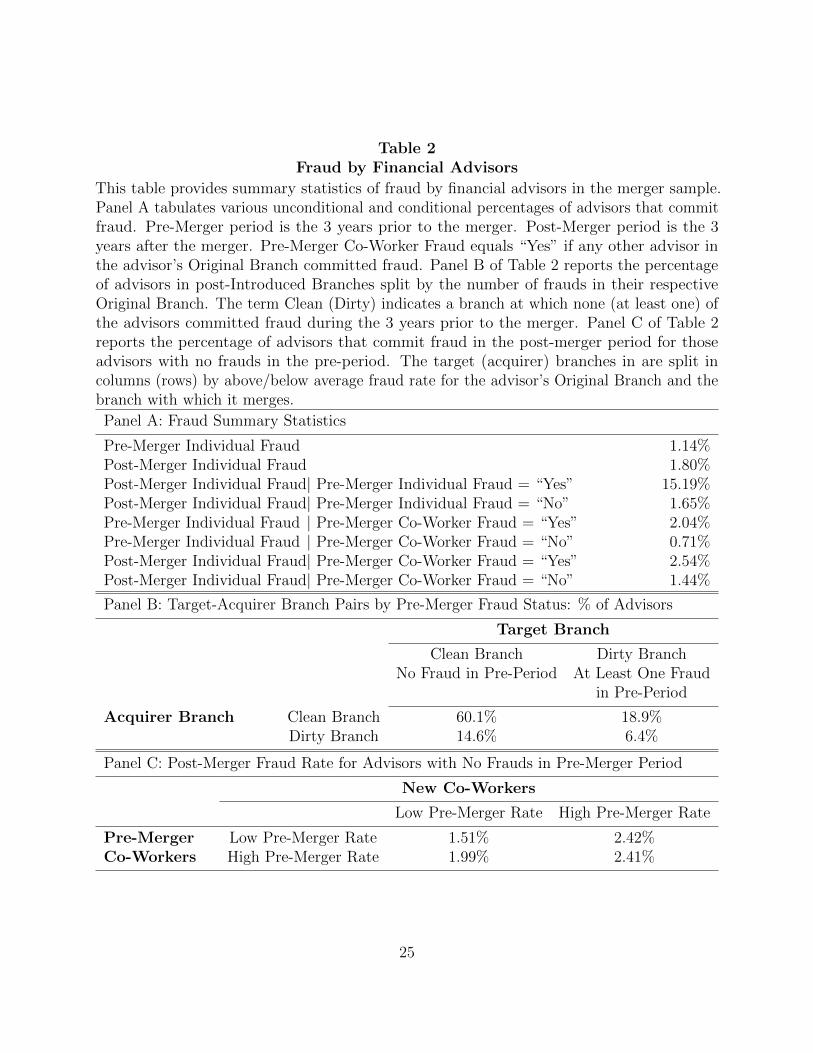
Table 2Fraud by Financial Advisors
This table provides summary statistics of fraud by financial advisors in the merger sample.Panel A tabulates various unconditional and conditional percentages of advisors that commitfraud. Pre-Merger period is the 3 years prior to the merger. Post-Merger period is the 3years after the merger. Pre-Merger Co-Worker Fraud equals “Yes” if any other advisor inthe advisor’s Original Branch committed fraud. Panel B of Table 2 reports the percentageof advisors in post-Introduced Branches split by the number of frauds in their respectiveOriginal Branch. The term Clean (Dirty) indicates a branch at which none (at least one) ofthe advisors committed fraud during the 3 years prior to the merger. Panel C of Table 2reports the percentage of advisors that commit fraud in the post-merger period for thoseadvisors with no frauds in the pre-period. The target (acquirer) branches in are split incolumns (rows) by above/below average fraud rate for the advisor’s Original Branch and thebranch with which it merges.
Panel A: Fraud Summary Statistics
Pre-Merger Individual Fraud 1.14%Post-Merger Individual Fraud 1.80%Post-Merger Individual Fraud| Pre-Merger Individual Fraud = “Yes” 15.19%Post-Merger Individual Fraud| Pre-Merger Individual Fraud = “No” 1.65%Pre-Merger Individual Fraud | Pre-Merger Co-Worker Fraud = “Yes” 2.04%Pre-Merger Individual Fraud | Pre-Merger Co-Worker Fraud = “No” 0.71%Post-Merger Individual Fraud| Pre-Merger Co-Worker Fraud = “Yes” 2.54%Post-Merger Individual Fraud| Pre-Merger Co-Worker Fraud = “No” 1.44%
Panel B: Target-Acquirer Branch Pairs by Pre-Merger Fraud Status: % of Advisors
Target Branch
Clean Branch Dirty BranchNo Fraud in Pre-Period At Least One Fraud
in Pre-Period
Acquirer Branch Clean Branch 60.1% 18.9%Dirty Branch 14.6% 6.4%
Panel C: Post-Merger Fraud Rate for Advisors with No Frauds in Pre-Merger Period
New Co-Workers
Low Pre-Merger Rate High Pre-Merger Rate
Pre-Merger Low Pre-Merger Rate 1.51% 2.42%Co-Workers High Pre-Merger Rate 1.99% 2.41%
25
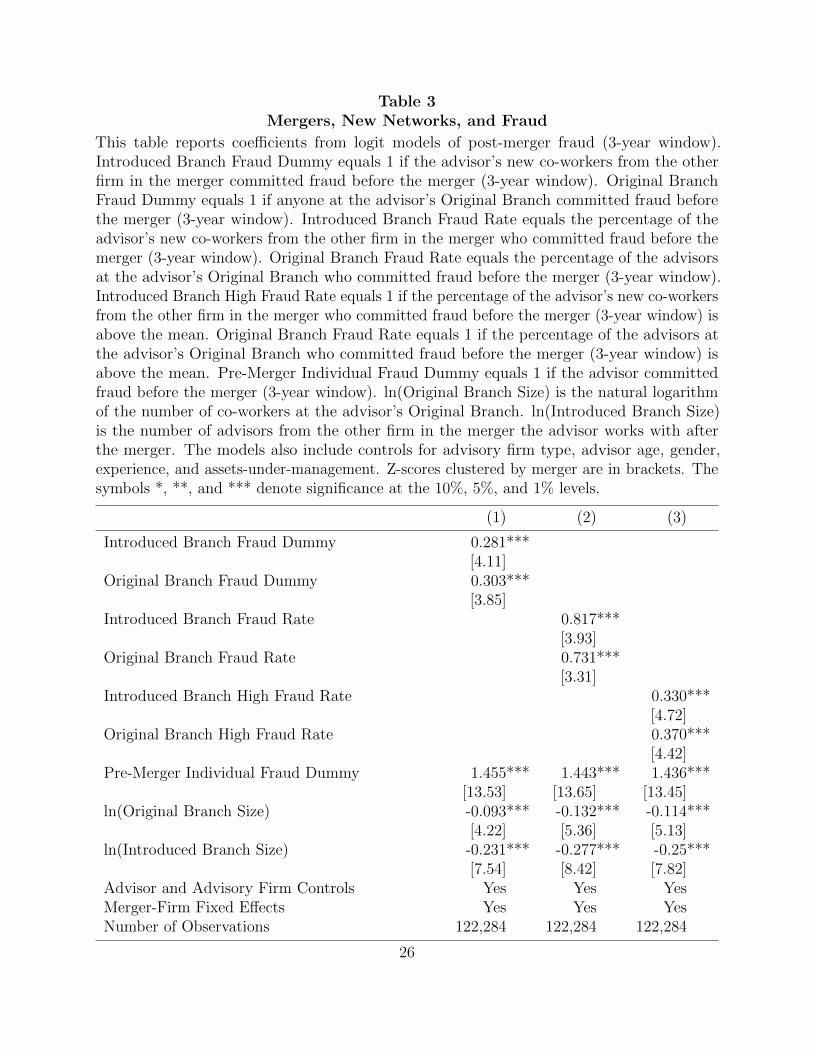
Table 3Mergers, New Networks, and Fraud
This table reports coefficients from logit models of post-merger fraud (3-year window).Introduced Branch Fraud Dummy equals 1 if the advisor’s new co-workers from the otherfirm in the merger committed fraud before the merger (3-year window). Original BranchFraud Dummy equals 1 if anyone at the advisor’s Original Branch committed fraud beforethe merger (3-year window). Introduced Branch Fraud Rate equals the percentage of theadvisor’s new co-workers from the other firm in the merger who committed fraud before themerger (3-year window). Original Branch Fraud Rate equals the percentage of the advisorsat the advisor’s Original Branch who committed fraud before the merger (3-year window).Introduced Branch High Fraud Rate equals 1 if the percentage of the advisor’s new co-workersfrom the other firm in the merger who committed fraud before the merger (3-year window) isabove the mean. Original Branch Fraud Rate equals 1 if the percentage of the advisors atthe advisor’s Original Branch who committed fraud before the merger (3-year window) isabove the mean. Pre-Merger Individual Fraud Dummy equals 1 if the advisor committedfraud before the merger (3-year window). ln(Original Branch Size) is the natural logarithmof the number of co-workers at the advisor’s Original Branch. ln(Introduced Branch Size)is the number of advisors from the other firm in the merger the advisor works with afterthe merger. The models also include controls for advisory firm type, advisor age, gender,experience, and assets-under-management. Z-scores clustered by merger are in brackets. Thesymbols *, **, and *** denote significance at the 10%, 5%, and 1% levels.
(1) (2) (3)
Introduced Branch Fraud Dummy 0.281***[4.11]
Original Branch Fraud Dummy 0.303***[3.85]
Introduced Branch Fraud Rate 0.817***[3.93]
Original Branch Fraud Rate 0.731***[3.31]
Introduced Branch High Fraud Rate 0.330***[4.72]
Original Branch High Fraud Rate 0.370***[4.42]
Pre-Merger Individual Fraud Dummy 1.455*** 1.443*** 1.436***[13.53] [13.65] [13.45]
ln(Original Branch Size) -0.093*** -0.132*** -0.114***[4.22] [5.36] [5.13]
ln(Introduced Branch Size) -0.231*** -0.277*** -0.25***[7.54] [8.42] [7.82]
Advisor and Advisory Firm Controls Yes Yes YesMerger-Firm Fixed Effects Yes Yes YesNumber of Observations 122,284 122,284 122,284
26
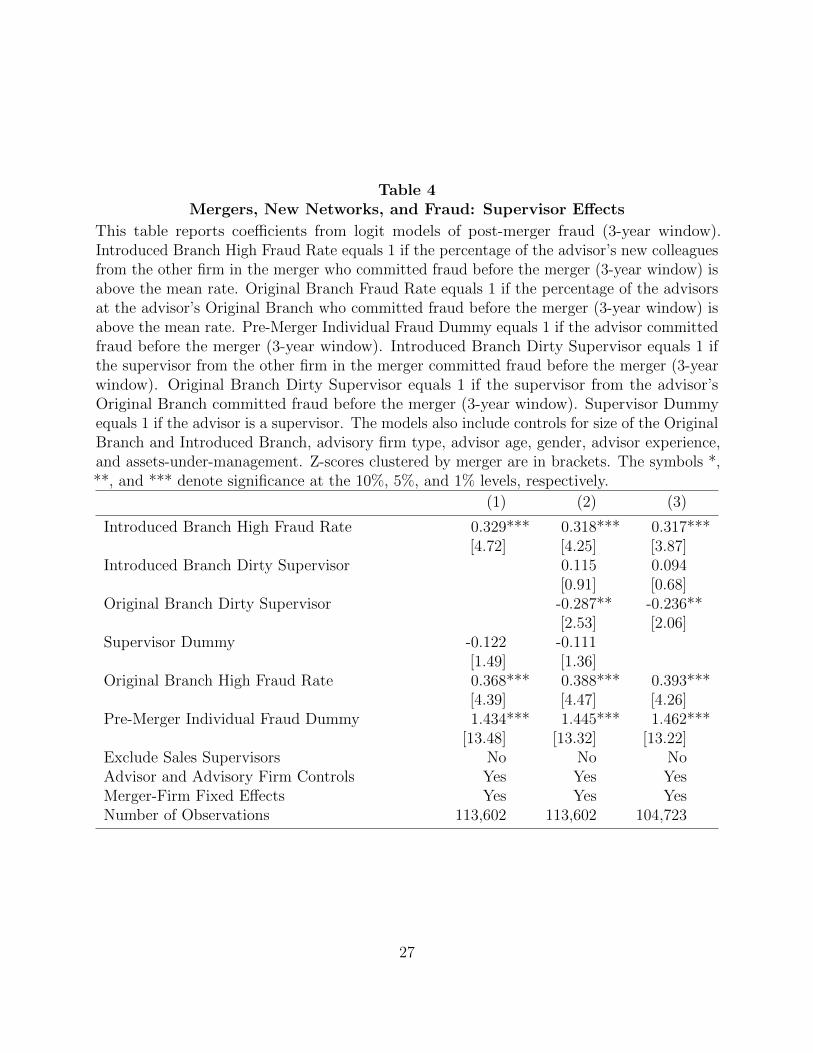
Table 4Mergers, New Networks, and Fraud: Supervisor Effects
This table reports coefficients from logit models of post-merger fraud (3-year window).Introduced Branch High Fraud Rate equals 1 if the percentage of the advisor’s new colleaguesfrom the other firm in the merger who committed fraud before the merger (3-year window) isabove the mean rate. Original Branch Fraud Rate equals 1 if the percentage of the advisorsat the advisor’s Original Branch who committed fraud before the merger (3-year window) isabove the mean rate. Pre-Merger Individual Fraud Dummy equals 1 if the advisor committedfraud before the merger (3-year window). Introduced Branch Dirty Supervisor equals 1 ifthe supervisor from the other firm in the merger committed fraud before the merger (3-yearwindow). Original Branch Dirty Supervisor equals 1 if the supervisor from the advisor’sOriginal Branch committed fraud before the merger (3-year window). Supervisor Dummyequals 1 if the advisor is a supervisor. The models also include controls for size of the OriginalBranch and Introduced Branch, advisory firm type, advisor age, gender, advisor experience,and assets-under-management. Z-scores clustered by merger are in brackets. The symbols *,**, and *** denote significance at the 10%, 5%, and 1% levels, respectively.
(1) (2) (3)
Introduced Branch High Fraud Rate 0.329*** 0.318*** 0.317***[4.72] [4.25] [3.87]
Introduced Branch Dirty Supervisor 0.115 0.094[0.91] [0.68]
Original Branch Dirty Supervisor -0.287** -0.236**[2.53] [2.06]
Supervisor Dummy -0.122 -0.111[1.49] [1.36]
Original Branch High Fraud Rate 0.368*** 0.388*** 0.393***[4.39] [4.47] [4.26]
Pre-Merger Individual Fraud Dummy 1.434*** 1.445*** 1.462***[13.48] [13.32] [13.22]
Exclude Sales Supervisors No No NoAdvisor and Advisory Firm Controls Yes Yes YesMerger-Firm Fixed Effects Yes Yes YesNumber of Observations 113,602 113,602 104,723
27
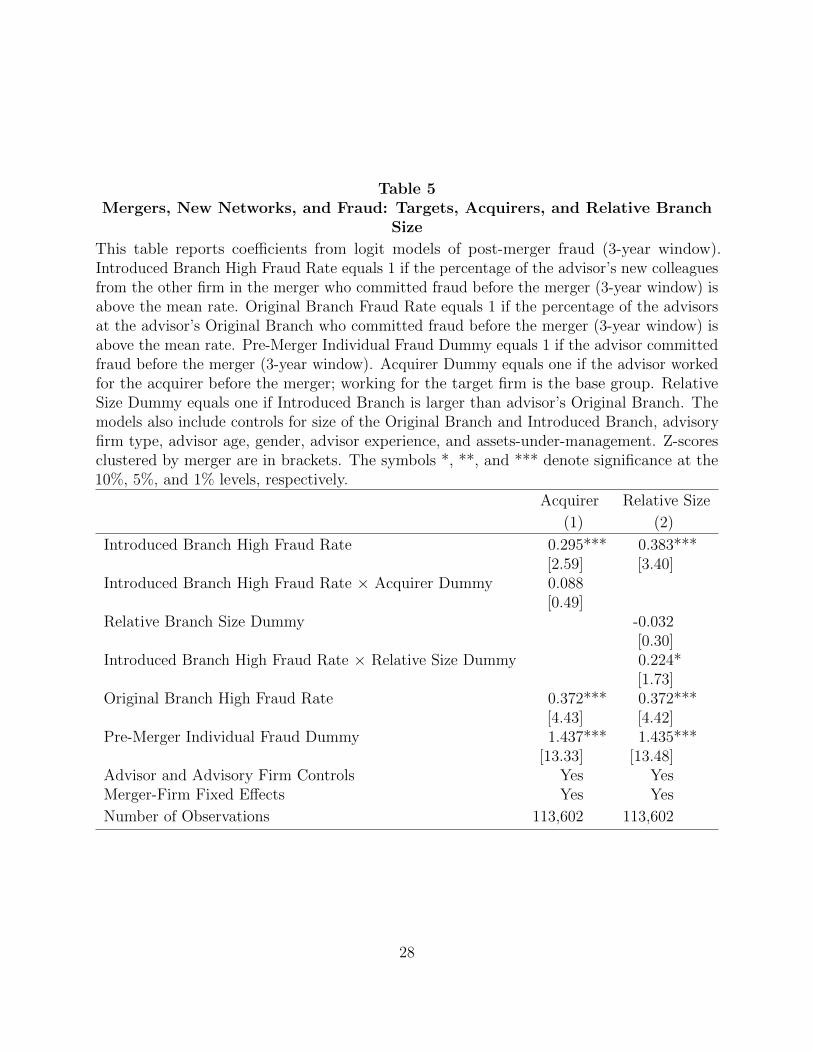
Table 5Mergers, New Networks, and Fraud: Targets, Acquirers, and Relative Branch
Size
This table reports coefficients from logit models of post-merger fraud (3-year window).Introduced Branch High Fraud Rate equals 1 if the percentage of the advisor’s new colleaguesfrom the other firm in the merger who committed fraud before the merger (3-year window) isabove the mean rate. Original Branch Fraud Rate equals 1 if the percentage of the advisorsat the advisor’s Original Branch who committed fraud before the merger (3-year window) isabove the mean rate. Pre-Merger Individual Fraud Dummy equals 1 if the advisor committedfraud before the merger (3-year window). Acquirer Dummy equals one if the advisor workedfor the acquirer before the merger; working for the target firm is the base group. RelativeSize Dummy equals one if Introduced Branch is larger than advisor’s Original Branch. Themodels also include controls for size of the Original Branch and Introduced Branch, advisoryfirm type, advisor age, gender, advisor experience, and assets-under-management. Z-scoresclustered by merger are in brackets. The symbols *, **, and *** denote significance at the10%, 5%, and 1% levels, respectively.
Acquirer Relative Size
(1) (2)
Introduced Branch High Fraud Rate 0.295*** 0.383***[2.59] [3.40]
Introduced Branch High Fraud Rate × Acquirer Dummy 0.088[0.49]
Relative Branch Size Dummy -0.032[0.30]
Introduced Branch High Fraud Rate × Relative Size Dummy 0.224*[1.73]
Original Branch High Fraud Rate 0.372*** 0.372***[4.43] [4.42]
Pre-Merger Individual Fraud Dummy 1.437*** 1.435***[13.33] [13.48]
Advisor and Advisory Firm Controls Yes YesMerger-Firm Fixed Effects Yes Yes
Number of Observations 113,602 113,602
28
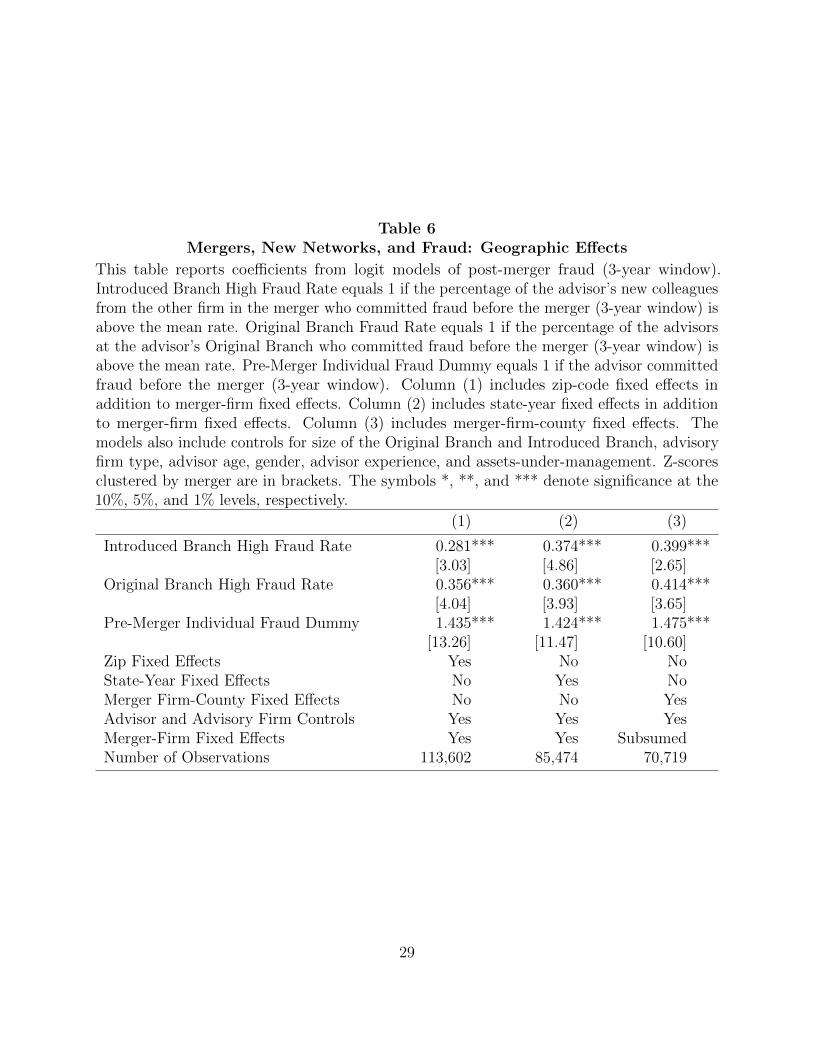
Table 6Mergers, New Networks, and Fraud: Geographic Effects
This table reports coefficients from logit models of post-merger fraud (3-year window).Introduced Branch High Fraud Rate equals 1 if the percentage of the advisor’s new colleaguesfrom the other firm in the merger who committed fraud before the merger (3-year window) isabove the mean rate. Original Branch Fraud Rate equals 1 if the percentage of the advisorsat the advisor’s Original Branch who committed fraud before the merger (3-year window) isabove the mean rate. Pre-Merger Individual Fraud Dummy equals 1 if the advisor committedfraud before the merger (3-year window). Column (1) includes zip-code fixed effects inaddition to merger-firm fixed effects. Column (2) includes state-year fixed effects in additionto merger-firm fixed effects. Column (3) includes merger-firm-county fixed effects. Themodels also include controls for size of the Original Branch and Introduced Branch, advisoryfirm type, advisor age, gender, advisor experience, and assets-under-management. Z-scoresclustered by merger are in brackets. The symbols *, **, and *** denote significance at the10%, 5%, and 1% levels, respectively.
(1) (2) (3)
Introduced Branch High Fraud Rate 0.281*** 0.374*** 0.399***[3.03] [4.86] [2.65]
Original Branch High Fraud Rate 0.356*** 0.360*** 0.414***[4.04] [3.93] [3.65]
Pre-Merger Individual Fraud Dummy 1.435*** 1.424*** 1.475***[13.26] [11.47] [10.60]
Zip Fixed Effects Yes No NoState-Year Fixed Effects No Yes NoMerger Firm-County Fixed Effects No No YesAdvisor and Advisory Firm Controls Yes Yes YesMerger-Firm Fixed Effects Yes Yes SubsumedNumber of Observations 113,602 85,474 70,719
29
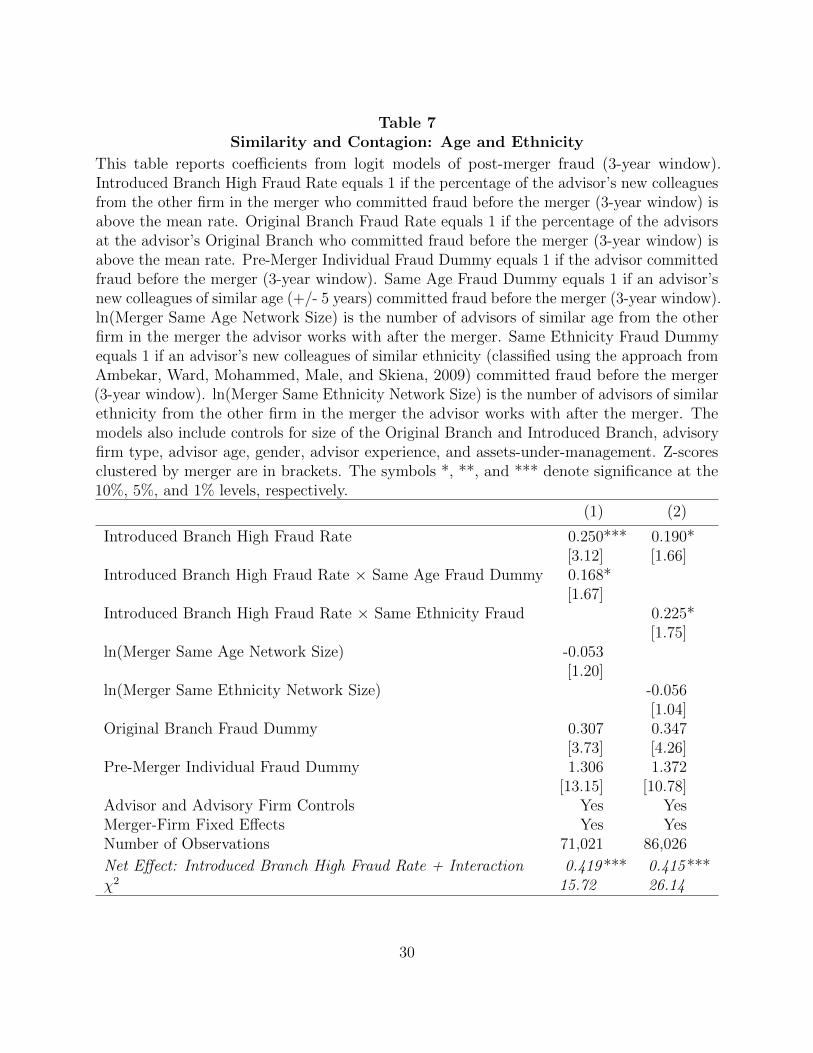
Table 7Similarity and Contagion: Age and Ethnicity
This table reports coefficients from logit models of post-merger fraud (3-year window).Introduced Branch High Fraud Rate equals 1 if the percentage of the advisor’s new colleaguesfrom the other firm in the merger who committed fraud before the merger (3-year window) isabove the mean rate. Original Branch Fraud Rate equals 1 if the percentage of the advisorsat the advisor’s Original Branch who committed fraud before the merger (3-year window) isabove the mean rate. Pre-Merger Individual Fraud Dummy equals 1 if the advisor committedfraud before the merger (3-year window). Same Age Fraud Dummy equals 1 if an advisor’snew colleagues of similar age (+/- 5 years) committed fraud before the merger (3-year window).ln(Merger Same Age Network Size) is the number of advisors of similar age from the otherfirm in the merger the advisor works with after the merger. Same Ethnicity Fraud Dummyequals 1 if an advisor’s new colleagues of similar ethnicity (classified using the approach fromAmbekar, Ward, Mohammed, Male, and Skiena, 2009) committed fraud before the merger(3-year window). ln(Merger Same Ethnicity Network Size) is the number of advisors of similarethnicity from the other firm in the merger the advisor works with after the merger. Themodels also include controls for size of the Original Branch and Introduced Branch, advisoryfirm type, advisor age, gender, advisor experience, and assets-under-management. Z-scoresclustered by merger are in brackets. The symbols *, **, and *** denote significance at the10%, 5%, and 1% levels, respectively.
(1) (2)
Introduced Branch High Fraud Rate 0.250*** 0.190*[3.12] [1.66]
Introduced Branch High Fraud Rate × Same Age Fraud Dummy 0.168*[1.67]
Introduced Branch High Fraud Rate × Same Ethnicity Fraud 0.225*[1.75]
ln(Merger Same Age Network Size) -0.053[1.20]
ln(Merger Same Ethnicity Network Size) -0.056[1.04]
Original Branch Fraud Dummy 0.307 0.347[3.73] [4.26]
Pre-Merger Individual Fraud Dummy 1.306 1.372[13.15] [10.78]
Advisor and Advisory Firm Controls Yes YesMerger-Firm Fixed Effects Yes YesNumber of Observations 71,021 86,026
Net Effect: Introduced Branch High Fraud Rate + Interaction 0.419 *** 0.415 ***χ2 15.72 26.14
30
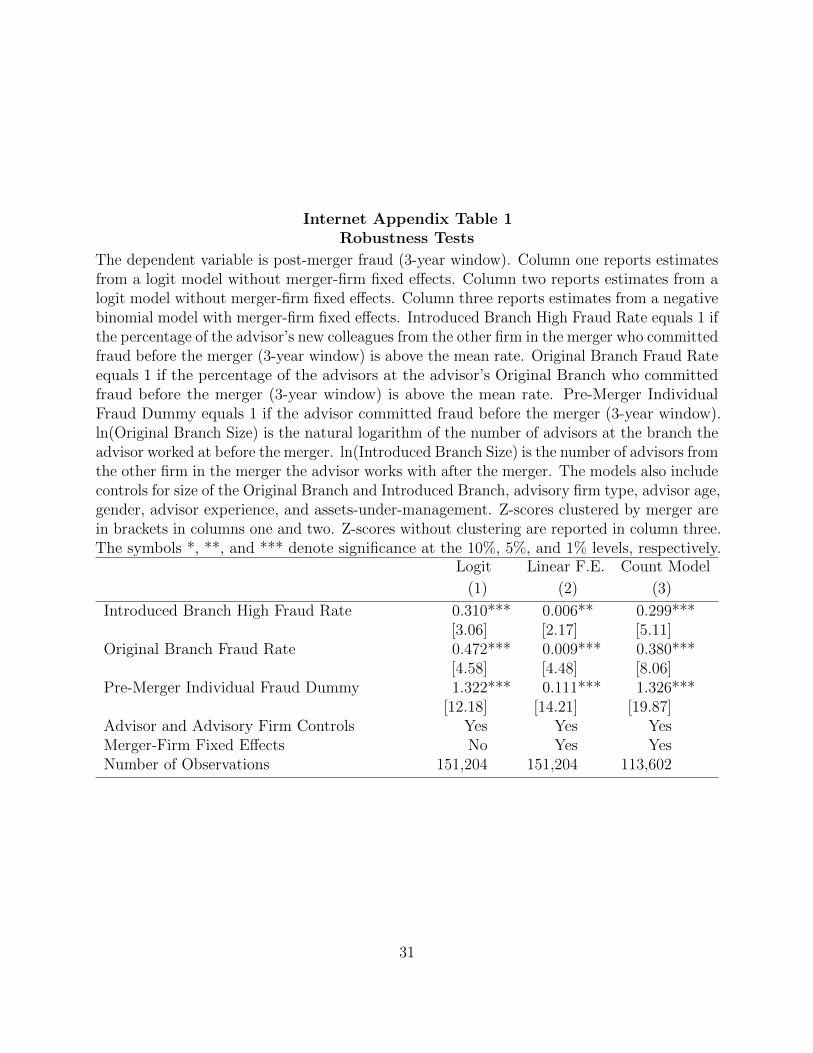
Internet Appendix Table 1Robustness Tests
The dependent variable is post-merger fraud (3-year window). Column one reports estimatesfrom a logit model without merger-firm fixed effects. Column two reports estimates from alogit model without merger-firm fixed effects. Column three reports estimates from a negativebinomial model with merger-firm fixed effects. Introduced Branch High Fraud Rate equals 1 ifthe percentage of the advisor’s new colleagues from the other firm in the merger who committedfraud before the merger (3-year window) is above the mean rate. Original Branch Fraud Rateequals 1 if the percentage of the advisors at the advisor’s Original Branch who committedfraud before the merger (3-year window) is above the mean rate. Pre-Merger IndividualFraud Dummy equals 1 if the advisor committed fraud before the merger (3-year window).ln(Original Branch Size) is the natural logarithm of the number of advisors at the branch theadvisor worked at before the merger. ln(Introduced Branch Size) is the number of advisors fromthe other firm in the merger the advisor works with after the merger. The models also includecontrols for size of the Original Branch and Introduced Branch, advisory firm type, advisor age,gender, advisor experience, and assets-under-management. Z-scores clustered by merger arein brackets in columns one and two. Z-scores without clustering are reported in column three.The symbols *, **, and *** denote significance at the 10%, 5%, and 1% levels, respectively.
Logit Linear F.E. Count Model
(1) (2) (3)
Introduced Branch High Fraud Rate 0.310*** 0.006** 0.299***[3.06] [2.17] [5.11]
Original Branch Fraud Rate 0.472*** 0.009*** 0.380***[4.58] [4.48] [8.06]
Pre-Merger Individual Fraud Dummy 1.322*** 0.111*** 1.326***[12.18] [14.21] [19.87]
Advisor and Advisory Firm Controls Yes Yes YesMerger-Firm Fixed Effects No Yes YesNumber of Observations 151,204 151,204 113,602
31
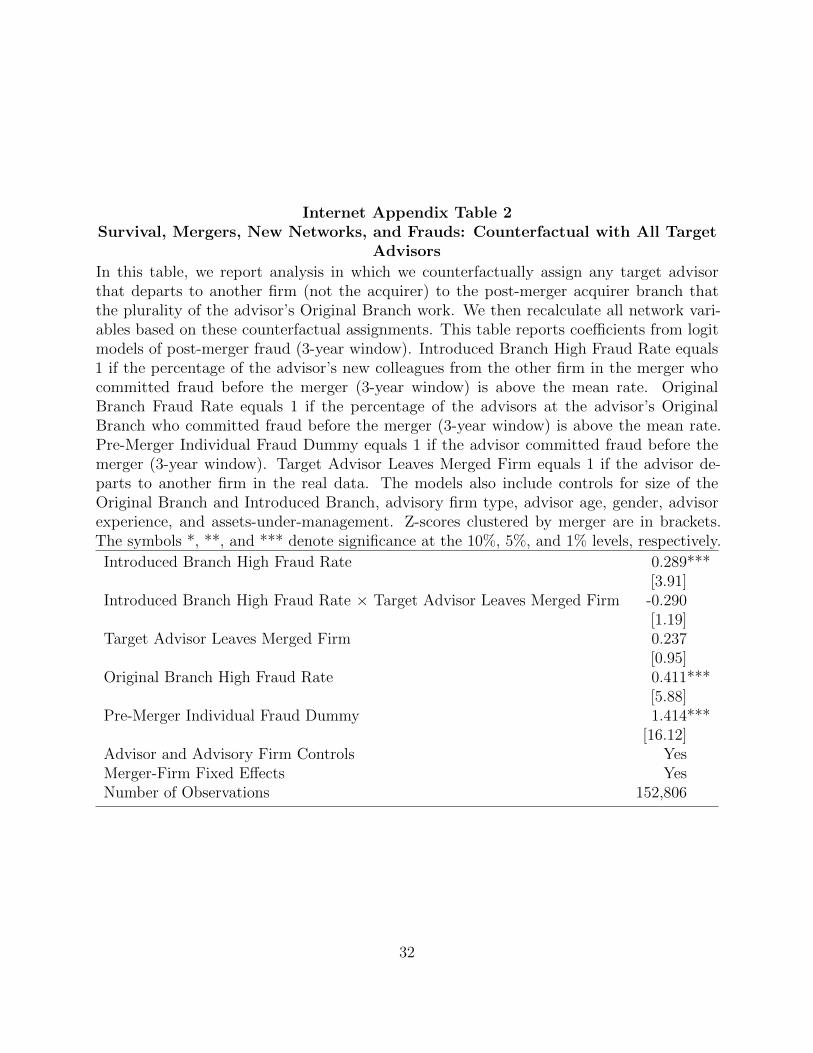
Internet Appendix Table 2Survival, Mergers, New Networks, and Frauds: Counterfactual with All Target
Advisors
In this table, we report analysis in which we counterfactually assign any target advisorthat departs to another firm (not the acquirer) to the post-merger acquirer branch thatthe plurality of the advisor’s Original Branch work. We then recalculate all network vari-ables based on these counterfactual assignments. This table reports coefficients from logitmodels of post-merger fraud (3-year window). Introduced Branch High Fraud Rate equals1 if the percentage of the advisor’s new colleagues from the other firm in the merger whocommitted fraud before the merger (3-year window) is above the mean rate. OriginalBranch Fraud Rate equals 1 if the percentage of the advisors at the advisor’s OriginalBranch who committed fraud before the merger (3-year window) is above the mean rate.Pre-Merger Individual Fraud Dummy equals 1 if the advisor committed fraud before themerger (3-year window). Target Advisor Leaves Merged Firm equals 1 if the advisor de-parts to another firm in the real data. The models also include controls for size of theOriginal Branch and Introduced Branch, advisory firm type, advisor age, gender, advisorexperience, and assets-under-management. Z-scores clustered by merger are in brackets.The symbols *, **, and *** denote significance at the 10%, 5%, and 1% levels, respectively.
Introduced Branch High Fraud Rate 0.289***[3.91]
Introduced Branch High Fraud Rate × Target Advisor Leaves Merged Firm -0.290[1.19]
Target Advisor Leaves Merged Firm 0.237[0.95]
Original Branch High Fraud Rate 0.411***[5.88]
Pre-Merger Individual Fraud Dummy 1.414***[16.12]
Advisor and Advisory Firm Controls YesMerger-Firm Fixed Effects YesNumber of Observations 152,806
32
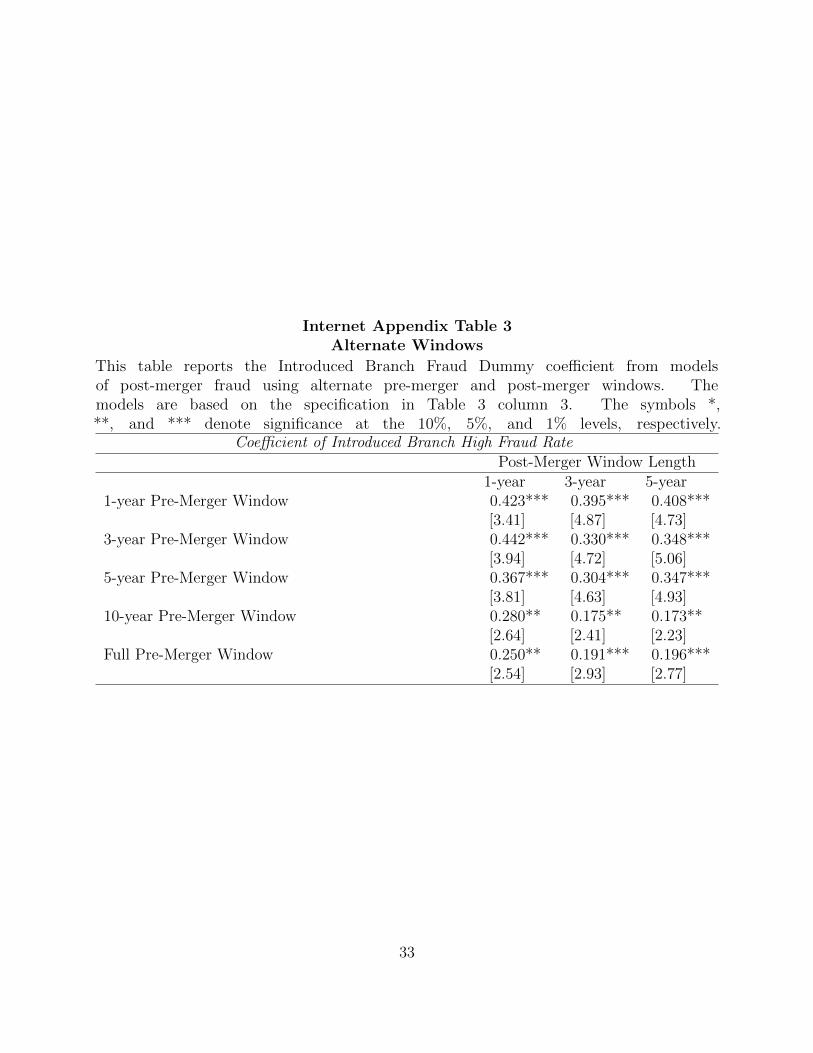
Internet Appendix Table 3Alternate Windows
This table reports the Introduced Branch Fraud Dummy coefficient from modelsof post-merger fraud using alternate pre-merger and post-merger windows. Themodels are based on the specification in Table 3 column 3. The symbols *,**, and *** denote significance at the 10%, 5%, and 1% levels, respectively.
Coefficient of Introduced Branch High Fraud RatePost-Merger Window Length
1-year 3-year 5-year1-year Pre-Merger Window 0.423*** 0.395*** 0.408***
[3.41] [4.87] [4.73]3-year Pre-Merger Window 0.442*** 0.330*** 0.348***
[3.94] [4.72] [5.06]5-year Pre-Merger Window 0.367*** 0.304*** 0.347***
[3.81] [4.63] [4.93]10-year Pre-Merger Window 0.280** 0.175** 0.173**
[2.64] [2.41] [2.23]Full Pre-Merger Window 0.250** 0.191*** 0.196***
[2.54] [2.93] [2.77]
33
References
Ambekar, Anurag, Charles Ward, Jahangir Mohammed, Swapna Male, Steven Skiena. 2009.
Name-ethnicity classification from open sources. Proceedings of the 15th ACM SIGKDD
International Conference on Knowledge Discovery and Data Mining . KDD ’09, ACM, New
York, NY, USA, 49–58.
Anagol, Santosh, Shawn Cole, Shayak Sarkar. 2013. Understanding the advice of commissions-
motivated agents: Evidence from the indian life insurance market. Harvard Business School
Working Paper 12-055 .
Angrist, Joshua D. 2014. The perils of peer effect. Labour Economics , 30 98–108.
Becker, Gary. 1968. Crime and punishment: An economic approach. Journal of Political
Economy , 76 169–217.
Bergstresser, Daniel, John Chalmers, Peter Tufano. 2009. Assessing the costs and benefits of
brokers in the mutual fund industry. Review of Financial Studies , 22 4129–4156.
Bhattacharya, Utpal, Andreas Hackethal, Simon Kaesler, Benjamin Loos, Steffen Meyer.
2012. Is unbiased financial advice to retail investors sufficient? Answers from a large field
study. Review of Financial Studies , 25 975–1032.
Bouwman, Christa H. S. 2011. Corporate governance propagation through overlapping
directors. Review of Financial Studies , 24 2358–2394.
Brown, Jeffrey R., Zoran Ivkovic, Paul A. Smith, Scott Weisbenner. 2008. Neighbors
matter: Causal community effects and stock market participation. Journal of Finance, 63
1509–1531.
Brown, Jennifer, Dylan Minor. 2013. Misconduct in credence good markets. NBER Working
Paper 18608 .
34
Chalmers, John, Jonathan Reuter. 2011. What is the impact of financial advisors on retirement
portfolio choices and outcomes? Working Paper, University of Oregon.
Chidambaran, N. K., Simi Kedia, Nagpurnanand Prabhala. 2012. CEO-director connections
and corporate fraud. Working Paper, Rutgers University .
Chiu, Peng-Chia, Siew Hong Teoh, Feng Tian. 2013. Board interlocks and earnings manage-
ment contagion. Accounting Review , 88 915–944.
Duflo, Esther, Emmanuel Saez. 2002. Participation and investment decisions in a retirement
plan: The influence of colleagues choices. Journal of Public Economics , 85 121–148.
Duflo, Esther, Emmanuel Saez. 2003. The role of information and social interactions in
retirement plan decisions: Evidence from a randomized experiment. Quarterly Journal of
Economics , 118 815–842.
Glaeser, Edward L., Bruce Sacerdote, Jose A. Scheinkman. 1996. Crime and social interactions.
Quarterly Journal of Economics , 111 507–548.
Hoechle, Daniel, Stefan Ruenzi, Nic Schaub, Markus Schmid. 2013. Dont answer the phone:
Financial advice and individual investors performance. Working Paper, University of
Mannheim.
Hong, Harrison, Kubik Jeffrey D, Jeremy C. Stein. 2004. Social interaction and stock-market
participation. Journal of Finance, 59 137–163.
Hong, Harrison, Marcin Kacperczyk. 2010. Competition and bias. Quarterly Journal of
Economics , 125 1683–1725.
Hung, Angela A., Noreen Clancy, Jeff Dominitz, Eric Talley, Claude Berribi, Farrukh
Suvankulov. 2008. Investor and industry perspectives on investment advisors and broker-
dealers. Technical Report RAND Center for Corporate Ethics and Governance.
35
Ivkovic, Zoran, Scott Weisbenner. 2007. Information diffusion effects in individual investors
common stock purchases: Covet thy neighbors investment choices. Review of Financial
Studies , 20 1327–1357.
Karpoff, Jonathan, D. Lee, Gerald Martin. 2008. The cost to firms of cooking the books.
Journal of Financial and Quantitative Analysis , 43 581–612.
Karpoff, Jonathan M., Allison Koester, D. Scott Lee, Gerald S. Martin. 2012. Database
challenges in financial misconduct research. Georgetown McDonough School of Business
Research Paper .
Kaustia, Markku, Samuli Knupfer. 2012. Peer performance and stock market entry. Journal
of Financial Economics , 104 321–338.
Lusardi, Annamaria, Olivia S. Mitchell. 2011. Financial literacy and planning: Implications
for retirement wellbeing. NBER Working Paper 17078 .
Manski, Charles F. 1993. Identification of endogenous social effects: The reflection problem.
Review of Economic Studies , 60 531–542.
Manski, Charles F. 2000. Economic analysis of social interactions. Journal of Economic
Perspectives , 14 115–136.
McPherson, Miller, Lynn Smith-Lovin, James M Cook. 2001. Birds of a feather: Homophily
in social networks. Annual Review of Sociology , 27 415444.
Mullainathan, Sendhil, Markus Noeth, Antoinette Schoar. 2012. The market for financial
advice: An audit study. NBER Working Paper 17929 .
Parsons, Christopher, Johan Sulaeman, Sheridan Titman. 2014. The geography of financial
misconduct. NBER Working Paper 20347 .
36
Pool, Veronika K., Noah Stoffman, Scott E. Yonker. 2014. The people in your neighborhood:
Social interactions and mutual fund portfolios. Journal of Finance forthcoming.
Sah, Raaj K. 1991. Social osmosis and patterns of crime. Journal of Political Economy , 99
1272–1295.
Shalizi, Cosma R., Andrew C. Thomas. 2011. Homophily and contagion are generically
confounded in observational social network studies. Sociological Methods & Research, 40
211–239.
Shue, Kelly. 2013. Executive networks and firm policies: Evidence from the random assignment
of MBA peers. Review of Financial Studies , 26 1401–1442.
van Rooij, Maarten, Annamaria Lusardi, Rob Alessie. 2011. Financial literacy and stock
market participation. Journal of Financial Economics , 101 449–472.
37