Embed Size (px)
Citation preview
Is Intel�s Marketing Campaign Predatory?
Hwa Ryung Lee, Andras Pechy and Michelle Sovinsky1
June 7, 2013
Abstract
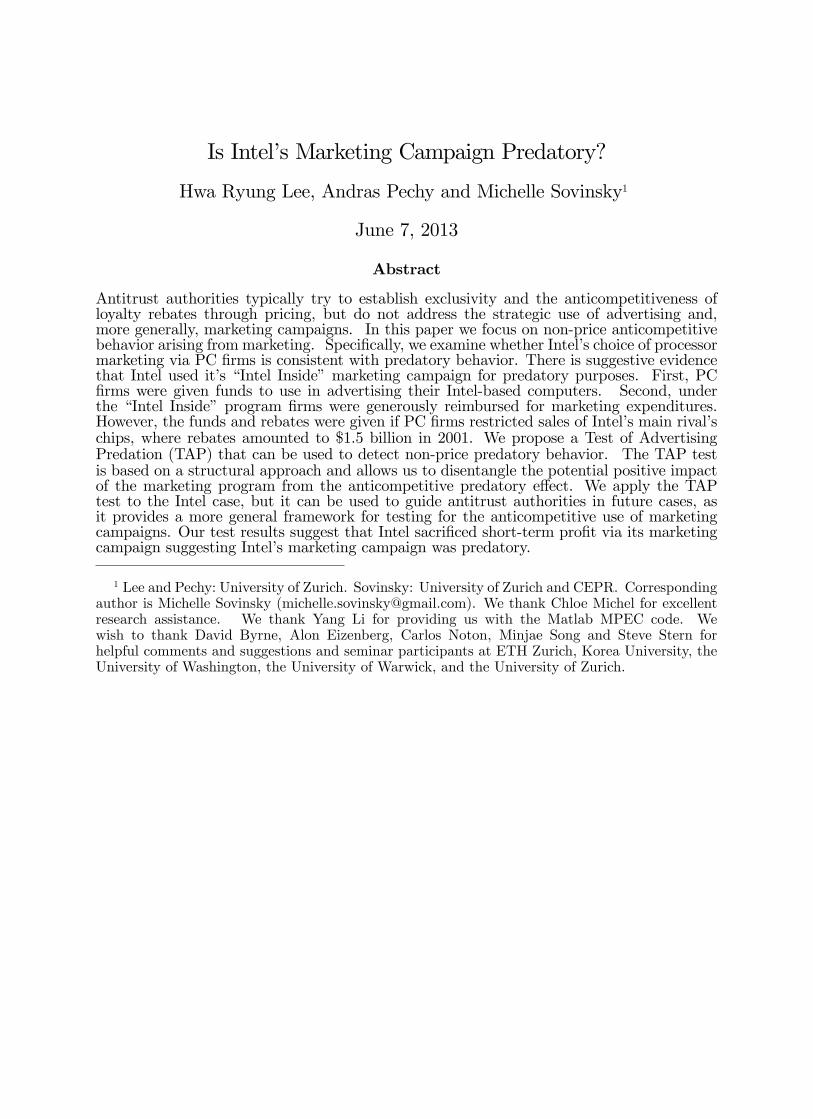
Antitrust authorities typically try to establish exclusivity and the anticompetitiveness ofloyalty rebates through pricing, but do not address the strategic use of advertising and,more generally, marketing campaigns. In this paper we focus on non-price anticompetitivebehavior arising from marketing. Speci�cally, we examine whether Intel�s choice of processormarketing via PC �rms is consistent with predatory behavior. There is suggestive evidencethat Intel used it�s �Intel Inside�marketing campaign for predatory purposes. First, PC�rms were given funds to use in advertising their Intel-based computers. Second, underthe �Intel Inside� program �rms were generously reimbursed for marketing expenditures.However, the funds and rebates were given if PC �rms restricted sales of Intel�s main rival�schips, where rebates amounted to $1.5 billion in 2001. We propose a Test of AdvertisingPredation (TAP) that can be used to detect non-price predatory behavior. The TAP testis based on a structural approach and allows us to disentangle the potential positive impactof the marketing program from the anticompetitive predatory e¤ect. We apply the TAPtest to the Intel case, but it can be used to guide antitrust authorities in future cases, asit provides a more general framework for testing for the anticompetitive use of marketingcampaigns. Our test results suggest that Intel sacri�ced short-term pro�t via its marketingcampaign suggesting Intel�s marketing campaign was predatory.
1 Lee and Pechy: University of Zurich. Sovinsky: University of Zurich and CEPR. Correspondingauthor is Michelle Sovinsky ([email protected]). We thank Chloe Michel for excellentresearch assistance. We thank Yang Li for providing us with the Matlab MPEC code. Wewish to thank David Byrne, Alon Eizenberg, Carlos Noton, Minjae Song and Steve Stern forhelpful comments and suggestions and seminar participants at ETH Zurich, Korea University, theUniversity of Washington, the University of Warwick, and the University of Zurich.

1 Introduction
Intel has been investigated for predatory (pricing), exclusionary behavior, and the abuse of
a dominant position in the market for central processing units (CPU). According to U.S.
lawsuits, Intel used payments, marketing loyalty rebates and threats to persuade computer
manufacturers, including Dell and Hewlett-Packard (HP), to limit their use of AMD (Intel�s
main rival) processors. U.S. antitrust authorities have focused on whether the loyalty rebates
used by Intel were a predatory device in violation of the Sherman Act. The European
Commission (EC) has brought similar charges and imposed a 1.06 billion Euro �ne on Intel
for abuse of a dominant position.2
Generally, predatory pricing is a price reduction that is pro�table only because of the
additional market power gained from excluding or otherwise inhibiting the rival from com-
peting. However, the predator may also induce rivals to exit the industry via non-price
predation. Predatory investments could be made in excessive capacity, product di¤eren-
tiation, advertising, etc.. For example, excessive investments that have the objective and
likely e¤ect of weakening or eliminating competitors can be predatory.
Indeed in many predatory situations, pricing is only one aspect of anticompetitive be-
havior. In the case of Intel, an important component to the case involved their marketing
campaign, �Intel Inside,�which provided marketing support for �rms that sold Intel CPU
chips. Intel was accused of using the marketing program to attempt to prevent computer
makers from o¤ering machines with non-Intel computer chips. It became clear through cor-
respondence that Intel was trying to circumvent antitrust laws by using non-price predatory
avenues. For example, a 2002 Dell document states that the �original basis for the [Intel
marketing] fund is ... Dell�s loyalty to Intel.� The document explains that this means �no
AMD processors.�3
Our paper proposes a Test of Advertising Predation (TAP) that can be used to detect
non-price predatory behavior. The TAP test has the �avor of current cost-based tests of
2 South Korean and Japanese antitrust authorities also imposed �nes on Intel for breach of antitrustregulations.
3 US District Court for the District of Delaware Complaint. 2009
1

predatory pricing in that we propose that marketing/advertising predation has two compo-
nents: short-term pro�t sacri�ce and long-term recoupment. Given high entry barriers in
the CPU industry and the potential for advertising to establish a barrier to entry, we argue
that recoupment of pro�ts is likely.4 Thus, the focus of this paper is on the nature of
predatory marketing/advertising as a short-term pro�t sacri�ce.5 We develop a test based
on a structural approach that allows us to disentangle the potential positive impact of the
marketing program from the anticompetitive predatory e¤ect.
There are two primary aims to this paper. The �rst is to provide a framework to test
if �rms are using marketing/advertising campaigns in an anticompetitive fashion. The TAP
test examines if the return on advertising (i.e., how it impacts demand) is high enough to
justify marketing expenditures (as these are directed at increasing demand). The second is
to determine if the Intel Inside marketing program, which provided marketing support for
�rms that sold Intel processors, was used in a predatory fashion (during 2002� 2005).We provide a general Test of Advertising Predation (TAP) based on the presumption
that, if a �rm�s marketing campaign is not predatory, marketing expenses should be pro�t
maximizing and so should result in su¢ cient increased product demand to justify costs. To
construct TAP, �rst we model consumer�s demand for PCs from which we infer demand
for CPU processors. Speci�cally, we estimate a random-coe¢ cient model of demand for a
PC-CPU, where the coe¢ cients on PC and CPU characteristics and advertising vary with
demographics. Second, we compute Intel�s marginal revenue from the marketing subsidy
using the demand side estimates. The marginal revenue of the marketing program depends
on the parameters of consumer utility (including advertising), CPU price and marginal
manufacturing cost. We compare the estimated marginal revenue to a number of avoidable
incremental (marketing) cost measures to determine if the marketing campaign involves the
sacri�ce of short-term pro�ts (i.e., if the campaign is predatory).
4 The industry is capital intensive and R&D intensive, which results in high barriers to entry. There havebeen only two main competitors in the CPU industry, Intel and AMD, and no e¤ective entry or exit. Wediscuss this in section 2.
5 Our test is related to advertising but as advertising is (a very important) marketing tool, we use theterms marketing and advertising interchangeably, while realizing that marketing can involve more than justadvertising (e.g., corporate training).
2
We focus on Intel�s marketing subsidy to Dell during the 2002� 2005 period to take ad-vantage of antitrust documentation on marketing rebate payments made to Dell. Although
the data are not as extensive for other PC �rms, we evaluate the TAP test for �rms involved
the Intel antitrust case (HP and Toshiba) and a �rm that was not involved (Gateway). TAP
results suggest short-term pro�t sacri�ce by Intel over this period, which indicates that the
Intel Inside campaign was used for predation.
Our work contributes to the recent stream of research that uses structural models to
study strategic behavior in the market for CPUs and PCs. These include papers by Salgado
(2008a), Song (2007, 2010), Gordon (2009), and Goettler and Gordon (2009) who study the
upstream CPU market. This literature mostly abstracts from PC manufacturer and PC
characteristics when estimating CPU demand, and assumes that �nal consumers buy CPUs
directly. Instead we model consumer�s choice of a PC and use it to infer CPU demand. An
advantage of our approach is that we can more easily estimate the e¤ect of advertising by
a PC �rm on demand. Given that the Intel Inside program is the marketing subsidy from
Intel to PC �rms, this will allow us to estimate the e¤ect of the Intel Inside on demand
more directly. As a result our work is related to the literature on estimating demand in
the PC industry. Papers in this area include Eizenberg (2011), Sovinsky Goeree (2008),
Prince (2008), and Gowrisankaran and Rysman (2007). Finally, we estimate the impact of
advertising on PC demand, which is related to work by Sovinsky Goeree (2008) and Salgado
(2008b). While there is a vast theoretical literature on predation there are relatively few
empirical studies, and these focus exclusively on pricing predation.6
This paper is structured as follows. We describe the TAP test for predatory behavior in
section 2. We discuss the data in section 3. In sections 4 and 5, we develop the model and
6 Related papers in the price predation literature include: Weiman and Levin (1994) who examinepredatory behaviour by Southern Bell Telephone Company between 1894 to 1912 when independent phonecompanies were trying to enter the market. Granitz and Klein (1996) provide evidence that Standard Oilengaged in predatory behavior by threatening to withhold inputs from railroads that were not in the railroadcartel. Genesove and Mullin (2006) estimate the price-cost margin in the sugar industry. They �nd thatthe price-cost margin was negative during price wars and predation was pro�table in that it establisheda reputation as a tough competitor. Ellison and Ellison (2011) examine entry deterrence behavior in thepharmaceutical market prior to patent expiration by focusing on the asymmetry in detailing activities inmarkets of di¤erent size. Similarly, Chen and Tan (2007) focus on whether detailing in the pharmaceuticalindustry is consistent with predation incentives. Finally, Snider (2009) and Besenko, Doraszelski, andKryukov (2010) estimate dynamic models of predatory pricing.
3
describe the estimation technique. In section 6, we present estimation results. In sections
7 and 8, we discuss the TAP results and policy implications.
2 Test of Advertising Predation (TAP)
Predation is composed of two phases: short-run pro�t sacri�ce and long-run recoupment.
That is, predation can be seen as an investment in long-run market power. In this section,
we develop a Test of Advertising Predation (TAP) that is focused on the �rst component of
predatory behavior. We discuss why the Intel Inside campaign is a useful application of the
TAP test and provide details of how to implement the test.
The Intel Inside campaign provides marketing support for �rms that sell Intel CPU chips.
Speci�cally, it is a cooperative advertising program in which Intel contributes a percentage
of the purchase price of processors to a pool for PC �rms to use to market Intel-based
computers. According to the rules of the program PC �rms can receive a rebate of their
marketing expenditures if they include the Intel logo in their advertising. By the end of
the 1990s, Intel had spent more than $7 billion on the marketing campaign and over 2,700
PC �rms were participants (Moon and Darwall, 2005). We consider the potential predatory
nature of Intel�s marketing program over the period 2002 to 2005.
The beginning of the alleged anticompetitive use of the Intel Inside program coincides
with the introduction by their main rival AMD�s Athlon chip (in 1999). Antitrust documen-
tation shows that Intel issued �conditional rebates�from December 2002 to December 2005,
whereby they would give rebates to some PC �rms (Dell in particular) under the condition
that the PC �rm buy exclusively from Intel.7 Otherwise, Intel would retract the marketing
rebate and instead use the market development money to fund competitors. An internal
Dell presentation (in 2003) noted that if Dell switched to AMD, Intel�s retaliation �could be
severe and prolonged with impact to all LOBs [Lines of Business].� Intel allegedly treated
HP, Lenovo, and Acer similarly. For example, Intel rebates were conditional on HP buying
95% of its microprocessors for business desktops from Intel. In 2002, an HP executive wrote
7 U.S. District of Court for District of Columbia; SEC (Securities and Exchange Commission) vs. Dell,pp. 10-11 and U.S. District of Court for District of Delaware; State of New York, by Attorney GeneralAndrew M. Cuomo vs. Intel Corporation, p.6.
4

�PLEASE DO NOT . . . communicate to the regions, your team members or AMD that we
are constrained to 5% AMD by pursuing the Intel agreement.�
We focus primarily on Intel and its agreements with Dell. This is for two reasons. First,
both Intel and Dell were examined separately by antitrust authorities for related antitrust
violations. Hence, we have a wealth of information on the amount of Intel�s advertising
subsidy to Dell, relative to other PC �rms, especially during the period 2002�2005. Second,antitrust investigations have produced written evidence that Intel�s agreements with Dell
were intended to exclude their main rival (AMD) from the market, which provides a good
test for our model.
We also apply the TAP test to Intel�s rebates to HP and Toshiba, whom were also in-
vestigated by antitrust authorities as part of the Intel case. In addition, we examine the
predatory nature of Intel�s rebates with Gateway. This latter application serves as a robust-
ness check of our test as there is no evidence that Gateway was involved in anticompetitive
behavior with Intel over this period.8
Our Test of Advertising Predation (TAP) is based on the presumption that, if the market-
ing/advertising campaign is not predatory, marketing expenses should be pro�t maximizing,
and, so should result in su¢ cient increased product demand to justify costs. To construct
TAP, �rst we model consumer�s demand for PCs from which we infer demand for CPU
processors. Speci�cally, we estimate a random-coe¢ cient model of demand for a PC-CPU,
where the coe¢ cients on PC and CPU characteristics and advertising vary with demograph-
ics.9 Second, we compute Intel�s marginal revenue from the marketing subsidy using the
demand side estimates. That is, we compute the marginal revenue of advertising dollars
spent on Intel chips at the �rm or product level.10 The marginal revenue of the market-
8 Most large PC �rms were involved in the Intel case. Gateway is the largest PC �rm that was not underinvestigation in the Intel case.
9 In previous literature that estimates CPU demand, it is generally assumed that �nal consumers directlypurchase the CPU. We think it is more realistic to model consumers�choice of a CPU-PC combination. Inaddition, since we are interested in the e¤ect of PC advertising on CPU demand, and PC advertising doesnot directly a¤ect CPU demand, we model a consumer�s discrete choice over CPU-PC combinations.
10 We do not model strategic decisions of PC �rms over which CPUs to o¤er. This makes the test wedevelop more stringent. Rather, we model the short-run decisions of PC �rms�CPU choices, which areassumed to not be a¤ected by the marketing campaign. Intel was accused of giving refunds to PC �rms
5

ing program depends on the parameters of consumer utility (including advertising), CPU
price and marginal manufacturing cost. We provide details of the speci�c equation for the
marginal revenue in section 4.2.
The TAP test concerns if the return to Intel from advertising done by PC �rms is high
enough to justify their marketing expenditures (i.e., �rm rebates). Assuming there are no
spillovers from the marketing campaign by one �rm to another, Intel�s marketing campaign
should equate the marginal revenue generated by the campaign to the marginal costs for each
�rm. We compare the marginal marketing revenue to a variety of measures of the actual
costs of the marketing campaign to determine if the marketing campaign was optimal.11
More speci�cally, if we �nd that the marginal revenue of the marketing campaign was below
the marginal cost of marketing campaign, it supports a predatory use of the marketing
campaign.12
Alternatively, the marginal cost of the marketing program could be estimated by explic-
itly modeling how the marketing program works. However, the actual form of the marketing
program is quite complicated, inconsistent over time, not exactly executed as publicly stated,
and rather ad-hoc, especially during allegedly anticompetitive periods. These issues raise
practical di¢ culties in explicitly modeling the correct form of the marketing program. In
addition, the form of the marketing program is very speci�c to Intel and may not be gener-
ally applicable to other cases. One of the bene�ts of the TAP approach is it allows us to
in the Intel Inside marketing program on the exclusionary condition that they limit the use of AMD chips.This implies the marketing program would a¤ect PC �rms�CPU choice and, hence, its anticompetitivenesswould be even larger.
11 Whether advertising is over- or under-supplied relative to the social optimal depends on whether itsprimary purpose is to provide information or to complement the advertised product/persusade the consumer,as well as the nature of competition. Most results indicate that non-informative advertising is over-suppliedin equilibrium. We consider the market for CPUs over a time period (2002-2005) in which is reasonableto conjecture that consumers were aware of CPUs, making it less likely that adverting was providing infor-mation. Predatory advertising is de�ned as advertising more than the pro�t maximizing amount, which isalso more than the socially optimal amount for non-informative advertising, hence, even in the short run,predatory advertising can be welfare decreasing. See Bagwell (2007) for an overview of the theoreticaladvertising literature.
12 According to the Areeda-Turner predatory pricing test, a price below cost is evidence of predation.Analogously, we consider marginal revenue of marketing below marginal cost as evidence of marketingpredation. Notice if marginal revenue is above marginal cost it still implies that marketing is not consistentwith pro�t maximization, however advertising is lower than the optimal level.
6
circumvent modeling Intel�s pro�t maximization problem (and marketing program). This is
bene�cial both because the test (and model) would become very complicated and the data
necessary to estimate such a model do not exist, in particular �rm-speci�c rebate rates are
not publicly available.
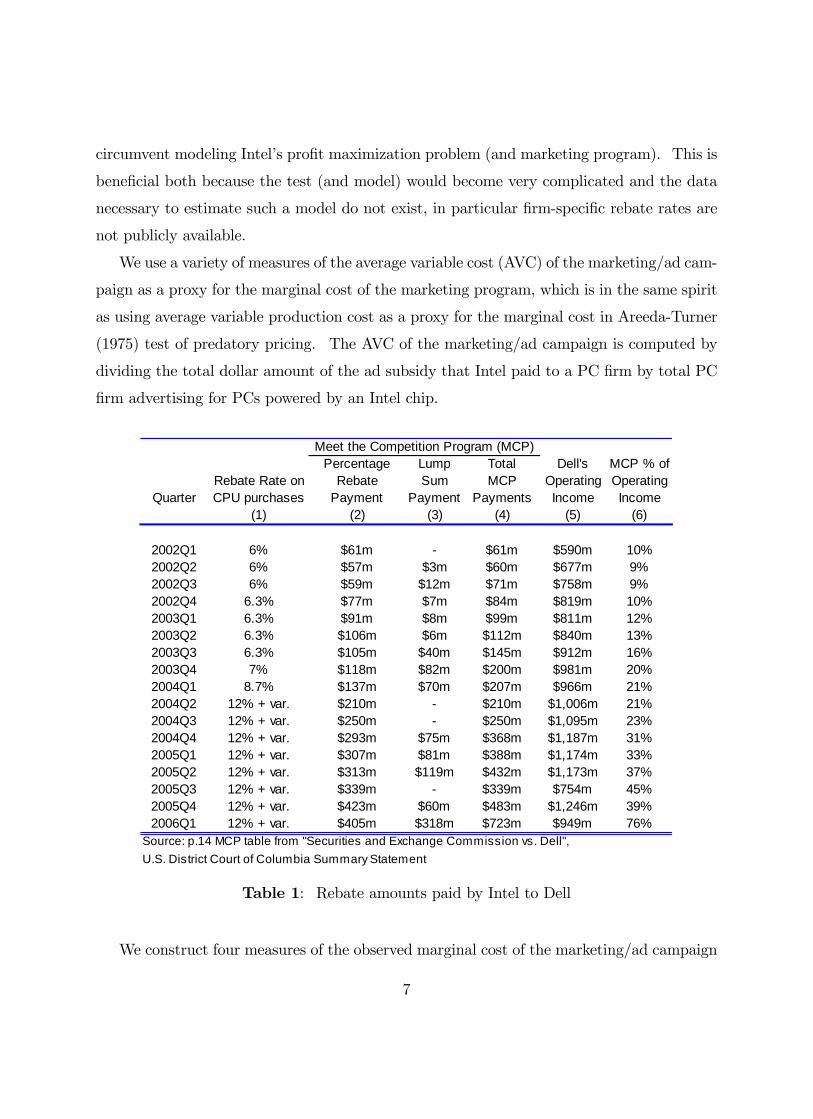
We use a variety of measures of the average variable cost (AVC) of the marketing/ad cam-
paign as a proxy for the marginal cost of the marketing program, which is in the same spirit
as using average variable production cost as a proxy for the marginal cost in Areeda-Turner
(1975) test of predatory pricing. The AVC of the marketing/ad campaign is computed by
dividing the total dollar amount of the ad subsidy that Intel paid to a PC �rm by total PC
�rm advertising for PCs powered by an Intel chip.
Meet the Competition Program (MCP)Percentage Lump Total Dell's MCP % of
Rebate Rate on Rebate Sum MCP Operating OperatingQuarter CPU purchases Payment Payment Payments Income Income
(1) (2) (3) (4) (5) (6)
2002Q1 6% $61m $61m $590m 10%2002Q2 6% $57m $3m $60m $677m 9%2002Q3 6% $59m $12m $71m $758m 9%2002Q4 6.3% $77m $7m $84m $819m 10%2003Q1 6.3% $91m $8m $99m $811m 12%2003Q2 6.3% $106m $6m $112m $840m 13%2003Q3 6.3% $105m $40m $145m $912m 16%2003Q4 7% $118m $82m $200m $981m 20%2004Q1 8.7% $137m $70m $207m $966m 21%2004Q2 12% + var. $210m $210m $1,006m 21%2004Q3 12% + var. $250m $250m $1,095m 23%2004Q4 12% + var. $293m $75m $368m $1,187m 31%2005Q1 12% + var. $307m $81m $388m $1,174m 33%2005Q2 12% + var. $313m $119m $432m $1,173m 37%2005Q3 12% + var. $339m $339m $754m 45%2005Q4 12% + var. $423m $60m $483m $1,246m 39%2006Q1 12% + var. $405m $318m $723m $949m 76%
Source: p.14 MCP table from "Securities and Exchange Commission vs. Dell",U.S. District Court of Columbia Summary Statement
Table 1: Rebate amounts paid by Intel to Dell
We construct four measures of the observed marginal cost of the marketing/ad campaign
7

based on either actual expenditures paid by Intel (as shown in Table 1) or on an assumed
percentage rebate rate.
(MC1) This measure is constructed as the total payment of Intel to Dell as given in the
case �les divided by total advertising by Dell for PCs powered by an Intel chip. Table
1 (column 4) provides the total payment of Intel�s rebates to Dell. Basically Intel
provided discounts on CPU prices and sometimes provided a lump-sum payment. At
the end of 2001, Intel began a program in which it agreed to give Dell a six percent
rebate on all of Dell�s CPU purchases (this came to be called the �Meet Competition
Program (MCP)).�13 These rebates are treated as a reduction in marketing expenses
in accounting by Dell. We can see that rebate rates as well as lump-sum payments
have signi�cantly increased between 2002 and 2005. Relative to the operating income,
the total amount of rebates were over 70% by 2006 (column 6).
(MC2) The second measure is the total rebate amount as a percentage of sales of PCs (across
all segments sold by Dell) given in column 6 divided by total advertising by Dell for
PCs powered by an Intel chip.14 The rebates to Dell can be used for advertising in
all segments including servers. Ours is a model of household demand (due to data
limitations) so when we construct MC2 we assume that the rebates are used in each
sector in proportion to sector market shares. Hence MC2 is MC1 multiplied by the
percentage of Dell�s revenue from PC sector in each quarter.
(MC3) This measure is a proxy for the marginal cost that we would have in the absence of
antitrust documents. The publicly announced subsidy takes the form of a �xed per-
centage rebate of CPU purchases made by the PC �rm with zero lump-sum payments.
To compute this measure we assume six percent of all Dell�s CPU purchases from Intel
are rebated. We recompute the total expenditure of the marketing program to Dell
(i.e., we compute column 4 assuming column 1 is always six percent and column 3
13 It was orginally called the �Mother of All Programs (MOAP).�
14 The second measure is the total rebate amount multiplied by a percentage of revenue from PC sales(across all segments - that is, PCs and servers - sold by Dell) divided by total Dell advertising on Intelpowered CPUs.
8

is zero). We then divide the total expenditure by total advertising by Dell for PCs
powered by an Intel chip.
(MC4) This measure provides a further lower bound on marginal costs. According to
the Intel Inside website, Intel would provide a three percent rebate on purchases if
marketing featured the Intel logo. To compute this measure we assume the rebate rate
is three percent and there are no lump sum payments. Hence MC4 is half of MC3:
Notice that the last two measures of marginal cost (MC3 andMC4) do not rely on infor-
mation obtained by antitrust o¢ cials but are based only on publicly available information.
Therefore, MC3 and MC4 can be used to construct the TAP test for other PC manufac-
turers. In addition, these two measures provide a benchmark as they are computed based
on the assumption that the marketing program has been executed as in normal periods or
as Intel describes on their website. The other two measures (MC1 and MC2) are computed
based on actual payments, which re�ect any potential anticompetitive cost increase.
2.1 TAP Limitations
We would like to point out some limitations to the TAP test. One issue concerns whether
the average cost of the marketing program is a proper measure of the marginal cost of
the marketing program. This issue arises in the predatory pricing literature as there is
a practical di¢ culty in determining the nature of production cost: whether it is variable
or �xed, or whether it is a sunk cost. However, this is less of a concern as it relates to
predatory marketing/advertising as there are few �xed or sunk components to advertising
expenditures.
Another issue concerns situations where a predator operates in multiple markets, which
makes it di¢ cult to determine how to allocate costs across markets. PC �rms are active in
markets for home consumers, but also in markets for education, business, and government
consumers. Also they sell servers as well as PCs. Fortunately, our advertising data allow us
to di¤erentiate PC advertising from advertising for non-PC products. However, we include
general promotions at the �rm-level as an advertising expenditure in the home segment.
If general promotions a¤ect sales in every market segment, then they should be allocated
9
across all segments. In this case, our measure of the average cost of the marketing program
is likely to underestimate the actual average cost. The marginal revenue of the marketing
program would likewise be underestimated, as we cannot allow for spillovers of advertising
across segments (due to data restrictions).
Finally, aside from practical di¢ culties, average variable cost may not be a good proxy for
marginal cost in the presence of returns to scale. Suppose that PC �rms increase advertising
expenditures more as Intel increases spending on the marketing program, that is, there are
increasing return to scale of the marketing program. Then average variable cost would be
larger than marginal cost and the test may lead to a false positive of predation. In contrast,
if PC �rms tend to be less responsive to Intel�s marketing subsidy as the amount of subsidy
increases, average variable cost would be smaller than marginal cost and the test would be
lenient. Our test results re�ect the assumption that PC �rms� responsiveness to Intel�s
marketing program is constant.15
2.2 Motive, Recoupment, and E¢ ciency Motives
Predation is not a sensible business strategy if it cannot drive a rival out of a market,
discipline a rival not to compete against a predator, or if the predator cannot maintain
market power for a su¢ cient period of time after predation. In this section, we discuss the
industry background that speaks to the motives for predation, the prospect of successful
predation and recoupment, and dynamic e¢ ciency.
Intel is a dominant �rm in the CPU industry with about 80 percent of worldwide CPU
sales. Its major (and only e¤ective) rival is AMD, holding about 18 percent market share
(Mercury Research, 2007). In 1999 and 2003, respectively, AMD introduced two new chips,
the Athlon for personal computers and the Opteron for servers. Experts agree that these
15 There are other proposals for how to calculate marginal costs associated with predatory pricing behavior.For example, Bolton, Brodley and Riordan (2000, 2001) suggest that the relevant cost is not average variablecost but the long run average incremental cost. This is measured by the per unit cost of producing thepredatory increment of output where all costs that were incurred (regardless of when they were incurred)are considered. Speci�cally, it is calculated as the �rm�s total production cost less what the �rm�s total costwould have been had it not produced the predatory units divided by the quantity of the product produced.There is no analogy for the advertising predation measure that we could construct without measuring theoutput produced under the predatory behavior.
10

chips were better-performing and cheaper than Intel counterparts (see section 3 for more
evidence). The threat of new, high-performance processors from AMD may have induced
Intel to engage in anticompetitive actions. These events provide the motive for Intel�s
predatory behavior. Indeed, many jurisdictions in the world accused Intel of using various
anticompetitive tactics against AMD starting in 2002.
We are particularly interested in Intel�s marketing subsidies. Predation involves short-
run pro�t sacri�ce and long-run recoupment. The TAP test is used to establish short-run
pro�t sacri�ce. However, we now turn to industry characteristics to examine the ease (or
di¢ culty) with which Intel could successfully drive AMD out of the market and recoup lost
pro�ts by maintaining market power for a su¢ ciently long period after AMD�s exit.
There are a number of factors that make long-run recoupment of pro�ts likely to be
successful in the CPU industry. To remain as a valid competitor in a rapidly changing,
high-technology industry like the CPU industry, �rms need to secure constant cash �ows
and keep investing in innovation. The CPU industry is capital-intensive, hence �rms will
incur substantial costs to construct and maintain manufacturing plants (called �fabs�). If
a �rm does not have su¢ cient internal funding, it must obtain external funding at market
rates. According to industry experts, Intel is able to fund its fabs with revenue, while
AMD must secure funding at market rates, which signi�cantly raises AMD�s cost of capital.
Furthermore, obtaining external �nancing is complicated due to agency problems. Typically
investors require �rms to show a positive prospect of future pro�ts, which is often based on
current performance. Predation would make the future prospect of the prey look lower (and
potentially negative) and ultimately induce it to exit the market. Thus, predation in the
CPU market would be consistent with the long-purse (deep-pocket) theory of predation.
Second, since �rms are continuously innovating, they may be uncertain about how con-
sumers will react to new products. New processors can have di¤erent characteristics possibly
appealing to a di¤erent market segment from current customers. As mentioned before, the
beginning of the anticompetitive use of the marketing program coincides with AMD�s in-
troduction of high-performance chips. By engaging in predatory behavior, Intel could send
a (wrong) signal about the demand for new chips, which is consistent with the demand
signaling theory (test-market theory) of predation.
11

Lastly, economies of scale exist in the CPU industry. The substantial investment in
plants and technologies are sunk. Therefore, a �rm needs to secure a certain amount of
sales in order to recover the sunk costs and stay in business. It is easier for a dominant �rm
to exclude a rival and prevent new entrants in the presence of economies of scale. In this
sense, predation is likely to be successful in driving AMD out of a market and Intel is likely
to keep high pro�t margins for a su¢ ciently long time.
The CPU industry is inviting to predatory behavior for these reasons, and Intel is an
incumbent with a dominant market share. Given that Intel�s recoupment is very likely as
a monopolist due to high entry barriers and that predation can successfully lead to exclude
AMD in the CPU industry, showing sacri�ce of short term pro�ts would support that the
marketing program is predatory.
The TAP test examines if the return on advertising (i.e., how it impacts demand) is
high enough to justify marketing expenditures (as these are directed at increasing demand).
Short-term pro�t sacri�ce may be justi�ed by dynamic e¢ ciency reasons. Although the cost-
based approach is widely used to show pro�t sacri�ce in predatory pricing cases, pricing below
cost does not necessarily mean the behavior is predatory. Short-term pro�t sacri�ce can be
rationalized by potential dynamic e¢ ciency reasons such as learning-by-doing, promotional
purposes (e.g., introductory prices), or network externalities. Our demand model includes
only the current, short-term e¤ect of advertising, hence the potential long-run bene�t of the
marketing program is not taken into account. However, just as the e¢ ciency reasons for
pricing below marginal cost are not usually applicable to an already dominant, incumbent
�rm with a large customer base, here too an unpro�table advertising subsidy by Intel is not
easily justi�ed by e¢ ciency reasons. Intel should already have achieved an e¢ cient scale of
operation, so learning-by-doing does not seem to justify short-term pro�t sacri�ce. Given
that Intel has been present for a long time and consumers already know about Intel and
that the anticompetitive actions have been going on for four years, promotional motives are
an unlikely explanation for short-term pro�t sacri�ce. In addition, network externalities
are not strong in the CPU market. For example, PC purchase guides, such as Consumer
Reports, do not list the size of the customer base using Intel processors as an important
factor for consumers to consider when purchasing a PC.
12

Our main concern is the brand-loyalty-building e¤ect of the marketing program. Adver-
tising is generally believed to build goodwill and this may be a reason for Intel to invest in
marketing at the expense of short-term pro�ts. Notice that, this incentive is constant across
all periods, while the predatory motive is more pronounced during the period of AMD�s new
chip introductions. To consider this the TAP test includes two measures of marginal cost
(MC3 and MC4) that serve as competitive benchmark as they are based on listed rebate
rates that would have been applied prior to 2001/2002. In contrast, MC1 and MC2 are
based on actual payment post AMD�s introduction of the new chips. Hence, these measures
would include brand loyalty building incentives plus anticompetitive motives, while MC3
and MC4 would be driven only by brand loyalty building incentive. We �nd that MC1 and
MC2 (based on actual payment) are much larger than MC3 and MC4 for Dell. The re-
sults suggest that an anticompetitive motive induced Intel to sacri�ce even more short-term
pro�ts as the di¤erence between marginal marketing revenue and marginal costs are much
larger when using MC1 and MC2. Also it is worth to note that, if advertising can establish
strong brand loyalty, predatory marketing can be even more harmful as it would work as an
endogenous entry barrier, deterring further entries and making recoupment even more likely.
We provide further robustness checks regarding brand-loyalty in section 7.1.
3 Data
We use three main data sources for our analysis: PC and CPU sales are from Gartner Group,
advertising data are from Kantar Media Group and Media Dynamics Inc., and CPU price
and cost data are from In-Stat. All data are available from the �rst quarter of 2002 through
the last quarter of 2005. We discuss each in turn.
Quarterly PC and CPU sales from Gartner Group are at the model level, where a model
is de�ned as PC vendor (i.e., Acer), PC vendor brand (i.e., Aspire), platform type (i.e., Note-
book), CPU vendor (i.e., Intel), CPU family (i.e., Pentium 4), CPU speed (i.e., 1600/1799
MHz) combination.16 We focus on the market for US home consumers for two primary rea-
16 For each model we know the processor vendor (Intel, IBM, AMD, or other), the processor type (46types), platform type (10 types; with two general platform type group of desktop or mobile) and processorspeed (22 types).
13

sons. First, businesses make multiple purchases at a time, which would greatly complicate
the empirical model, and second we don�t have access to advertising data for each sector
separately.
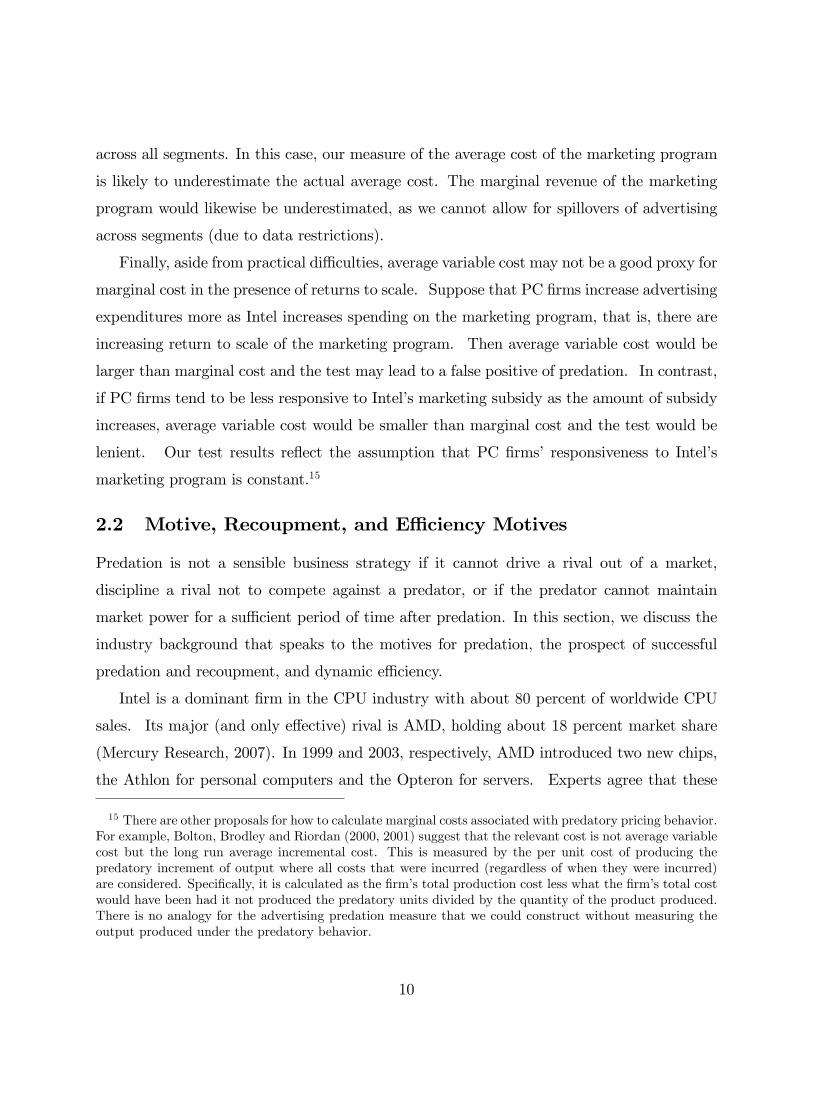
Market share Quarterly AveragePC firm Num.obs (% shipment) Total PCrelated advertising (M$)Acer 428 0.31% 9.45*Apple 223 4.80% Averatec 37 0.42% 0.00Dell 1020 32.44% 1.58emachines 59 3.86% 9.45*Fujitsu 193 0.30% 3.06Gateway 487 11.62% 9.45*HP 1438 29.17% 65.65IBM/Lenovo 535 0.23% 21.78 / 11.45 **Sony 360 2.93% 5.08Systemax 507 0.36% 0.20Toshiba 294 3.54% 4.19Other 1867 10.03%
Total 7,448 100%Notes: Market share is total f irm PC Shipments / total industry PC shipments. *Our measure of advertising includesemachines and Gatew ay together w ith Acer so w e can't separate the three. **21.78 is IBM 11.45 is Lenovo.
Table 2. Market Shares and Advertising Expenditures by PC Firms
Advertising data from Kantar Media Group consist of PC-related advertising expendi-
tures. These include general �rm promotions, general PC promotions, PC-brand advertising,
and brand-speci�c advertising, both by form factor and across all form factors.17 The ad-
vertising data is quite detailed, sometimes even at the level of a speci�c product (e.g., Acer
Aspire AS5735 Notebook Computer). However, it is di¢ cult to match with the data from
Gartner Group because the de�nition of products/models varies di¤erent between the two
datasets. Kantar Media Group uses a model name, such as Aspire AS5735; whereas, Gartner
Group de�nes PC models as a combination of PC vendor, PC brand, platform type, CPU
vendor, CPU family, and CPU speed. We match the two data sets based on brand and plat-
form type. Table 2 shows the market share and total PC-related advertising expenditures
by PC �rm in the entire sample.
17 PC �rms advertise printers and other computer accessories. We do not include these advertisingexpenditures.
14

In-Stat provides data on CPU prices and manufacturing costs for selected processors and
time periods.18 We need to match our PC data (CPU in a PC) from Gartner group with
CPU prices and manufacturing costs from In-Stat. CPU prices are available by processor
core on a quarterly basis.19 In our PC data, we know the brand name (that is, the marketing
name, e.g., Pentium 4) and speed (frequency) of the CPU in a given PC. The same processor
core is often used to make processors that are marketed under di¤erent brand names with
di¤erent sets of features enabled, and the processor core used in a processor changes over time
as technology advances. For instance, processor core �Williamette�was used for processors
marketed as Pentium 4 and as Celeron for desktop computers. The same CPU brands used
the next-generation processor core �Northwood� in later periods. The data are matched
based on platform group (whether desktop or mobile), type (whether mainstream, value, or
ultraportable), marketing name of a CPU, CPU speed, year, and quarter.20 We provide
the product cross-reference in Table A121 in the appendix.
CPU manufacturing cost estimate data are more limited in that the cost estimates are
available by CPU processor core for a broader de�nition as of 2005. For processor core
Willamette, we have cost estimates for di¤erent years, but not throughout the data period.
Intel has constructed fabs and changed the use of existing fabs, which a¤ected cost levels over
time. Also, learning-by-doing drives the cost level downward over time and so cost depends
18 As for reliability of the cost estimates, In-Stat document states �Equations to calculate the number ofdie sites per wafer, yield, and cost per good die are well known throughout the industry. Important physicalparameters, such as package type and die size, are generally published by the vendor and are veri�ablethrough destructive analysis. The key areas of uncertainty are in estimating wafer cost, defect density,testing cost, and package cost.�
19 CPU prices are available at several di¤erent levels of detail. The most detailed information is list pricesof speci�c processors (e.g. Pentium M 1.40GHz). These prices are available for selected processors fromJuly 2004 to July 2005, mostly on a monthly basis. Although it would be ideal to have list prices for allprocessors for all time periods, the data cover only a subset of our sample.
20 Among Dell PCs , we have 78% match. For the CPUs not matched at �rst attempt, we drop type, thenwe have 83% match. When unmatched, the data are matched based on marketing name of a CPU, CPUspeed, year, and quarter, ignoring platform group. Then we obtain a 96% match. When the data are notmatched, we try matching based on platform group, marketing name of a CPU, CPU speed, ignoring time,and then we have 99% match. For observations still not matched, we take the averages of prices and costestimates of CPUs of the same marketing name, year and quarter.
21 The cross-reference table is constructed based on In-Stat�s document and an website specialized inCPU information, www.cpu-world.com.
15
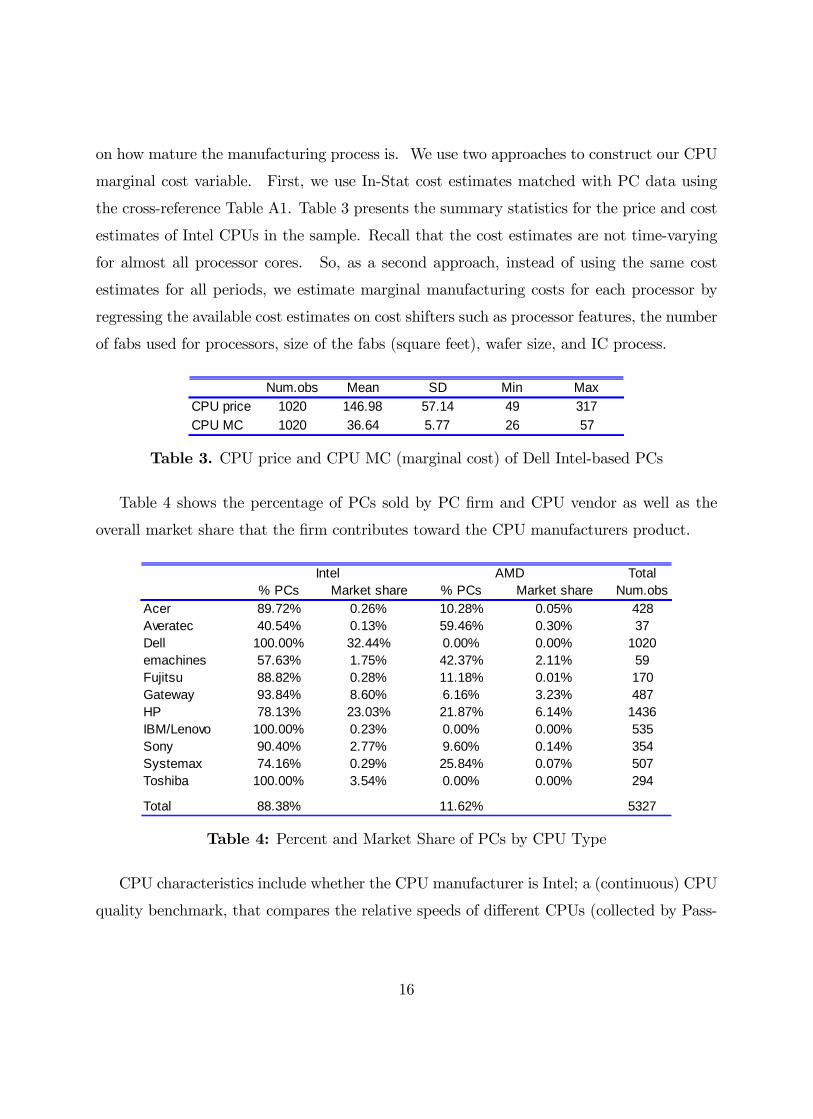
on how mature the manufacturing process is. We use two approaches to construct our CPU
marginal cost variable. First, we use In-Stat cost estimates matched with PC data using
the cross-reference Table A1. Table 3 presents the summary statistics for the price and cost
estimates of Intel CPUs in the sample. Recall that the cost estimates are not time-varying
for almost all processor cores. So, as a second approach, instead of using the same cost
estimates for all periods, we estimate marginal manufacturing costs for each processor by
regressing the available cost estimates on cost shifters such as processor features, the number
of fabs used for processors, size of the fabs (square feet), wafer size, and IC process.
Num.obs Mean SD Min MaxCPU price 1020 146.98 57.14 49 317CPU MC 1020 36.64 5.77 26 57
Table 3. CPU price and CPU MC (marginal cost) of Dell Intel-based PCs
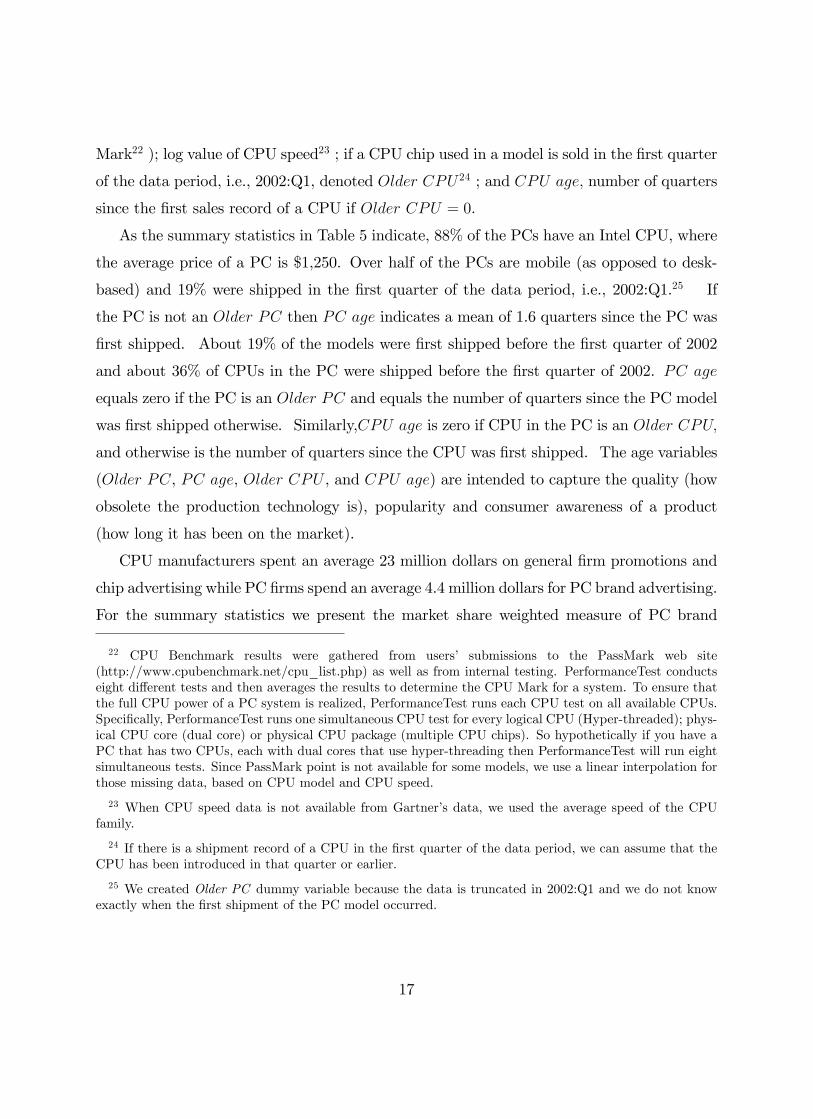
Table 4 shows the percentage of PCs sold by PC �rm and CPU vendor as well as the
overall market share that the �rm contributes toward the CPU manufacturers product.
Total% PCs Market share % PCs Market share Num.obs
Acer 89.72% 0.26% 10.28% 0.05% 428Averatec 40.54% 0.13% 59.46% 0.30% 37Dell 100.00% 32.44% 0.00% 0.00% 1020emachines 57.63% 1.75% 42.37% 2.11% 59Fujitsu 88.82% 0.28% 11.18% 0.01% 170Gateway 93.84% 8.60% 6.16% 3.23% 487HP 78.13% 23.03% 21.87% 6.14% 1436IBM/Lenovo 100.00% 0.23% 0.00% 0.00% 535Sony 90.40% 2.77% 9.60% 0.14% 354Systemax 74.16% 0.29% 25.84% 0.07% 507Toshiba 100.00% 3.54% 0.00% 0.00% 294
Total 88.38% 11.62% 5327
Intel AMD
Table 4: Percent and Market Share of PCs by CPU Type
CPU characteristics include whether the CPU manufacturer is Intel; a (continuous) CPU
quality benchmark, that compares the relative speeds of di¤erent CPUs (collected by Pass-
16
Mark22 ); log value of CPU speed23 ; if a CPU chip used in a model is sold in the �rst quarter
of the data period, i.e., 2002:Q1, denoted Older CPU 24 ; and CPU age; number of quarters
since the �rst sales record of a CPU if Older CPU = 0.
As the summary statistics in Table 5 indicate, 88% of the PCs have an Intel CPU, where
the average price of a PC is $1,250. Over half of the PCs are mobile (as opposed to desk-
based) and 19% were shipped in the �rst quarter of the data period, i.e., 2002:Q1.25 If
the PC is not an Older PC then PC age indicates a mean of 1.6 quarters since the PC was
�rst shipped. About 19% of the models were �rst shipped before the �rst quarter of 2002
and about 36% of CPUs in the PC were shipped before the �rst quarter of 2002. PC age
equals zero if the PC is an Older PC and equals the number of quarters since the PC model
was �rst shipped otherwise. Similarly,CPU age is zero if CPU in the PC is an Older CPU;
and otherwise is the number of quarters since the CPU was �rst shipped. The age variables
(Older PC, PC age, Older CPU , and CPU age) are intended to capture the quality (how
obsolete the production technology is), popularity and consumer awareness of a product
(how long it has been on the market).
CPU manufacturers spent an average 23 million dollars on general �rm promotions and
chip advertising while PC �rms spend an average 4.4 million dollars for PC brand advertising.
For the summary statistics we present the market share weighted measure of PC brand
22 CPU Benchmark results were gathered from users� submissions to the PassMark web site(http://www.cpubenchmark.net/cpu_list.php) as well as from internal testing. PerformanceTest conductseight di¤erent tests and then averages the results to determine the CPU Mark for a system. To ensure thatthe full CPU power of a PC system is realized, PerformanceTest runs each CPU test on all available CPUs.Speci�cally, PerformanceTest runs one simultaneous CPU test for every logical CPU (Hyper-threaded); phys-ical CPU core (dual core) or physical CPU package (multiple CPU chips). So hypothetically if you have aPC that has two CPUs, each with dual cores that use hyper-threading then PerformanceTest will run eightsimultaneous tests. Since PassMark point is not available for some models, we use a linear interpolation forthose missing data, based on CPU model and CPU speed.
23 When CPU speed data is not available from Gartner�s data, we used the average speed of the CPUfamily.
24 If there is a shipment record of a CPU in the �rst quarter of the data period, we can assume that theCPU has been introduced in that quarter or earlier.
25 We created Older PC dummy variable because the data is truncated in 2002:Q1 and we do not knowexactly when the �rst shipment of the PC model occurred.
17
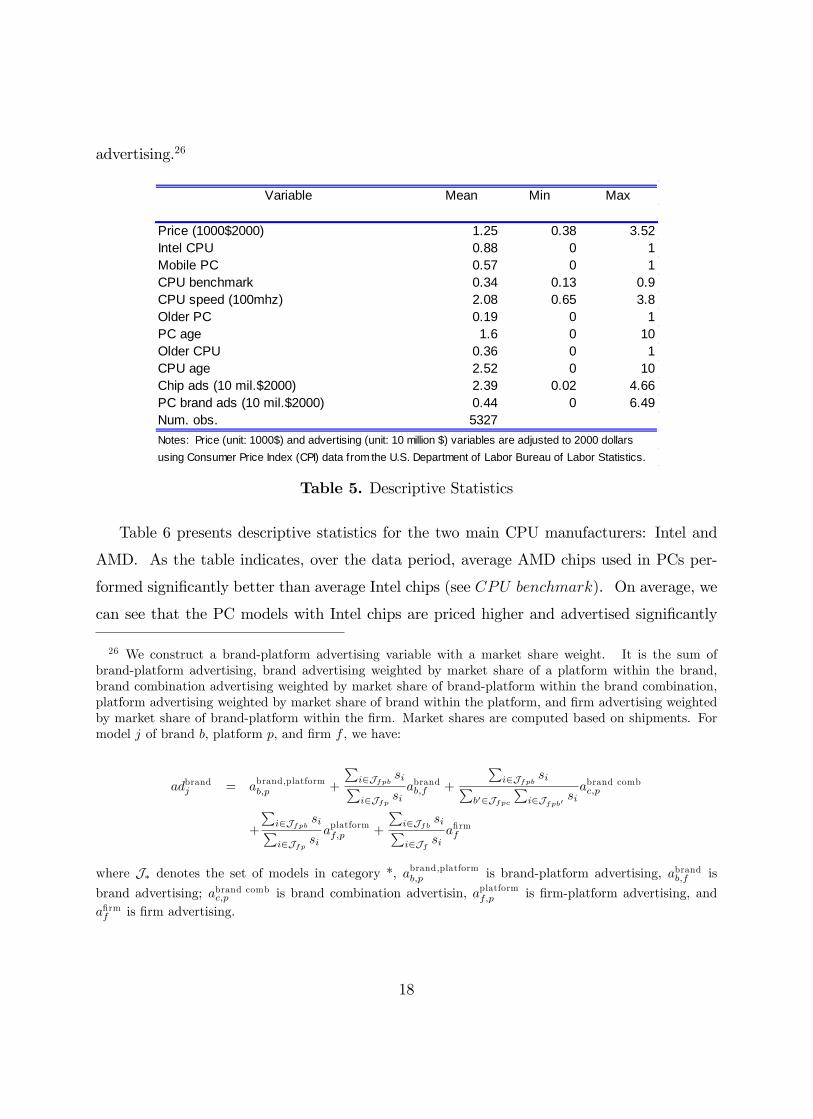
advertising.26
Variable Mean Min Max
Price (1000$2000) 1.25 0.38 3.52Intel CPU 0.88 0 1Mobile PC 0.57 0 1CPU benchmark 0.34 0.13 0.9CPU speed (100mhz) 2.08 0.65 3.8Older PC 0.19 0 1PC age 1.6 0 10Older CPU 0.36 0 1CPU age 2.52 0 10Chip ads (10 mil.$2000) 2.39 0.02 4.66PC brand ads (10 mil.$2000) 0.44 0 6.49Num. obs. 5327Notes: Price (unit: 1000$) and advertising (unit: 10 million $) variables are adjusted to 2000 dollarsusing Consumer Price Index (CPI) data from the U.S. Department of Labor Bureau of Labor Statistics.
Table 5. Descriptive Statistics
Table 6 presents descriptive statistics for the two main CPU manufacturers: Intel and
AMD. As the table indicates, over the data period, average AMD chips used in PCs per-
formed signi�cantly better than average Intel chips (see CPU benchmark). On average, we
can see that the PC models with Intel chips are priced higher and advertised signi�cantly
26 We construct a brand-platform advertising variable with a market share weight. It is the sum ofbrand-platform advertising, brand advertising weighted by market share of a platform within the brand,brand combination advertising weighted by market share of brand-platform within the brand combination,platform advertising weighted by market share of brand within the platform, and �rm advertising weightedby market share of brand-platform within the �rm. Market shares are computed based on shipments. Formodel j of brand b, platform p, and �rm f , we have:
adbrandj = abrand,platformb;p +
Pi2Jfpb siPi2Jfp si
abrandb;f +
Pi2Jfpb siP
b02JfpcP
i2Jfpb0 siabrand combc;p
+
Pi2Jfpb siPi2Jfp si
aplatformf;p +
Pi2Jfb siPi2Jf si
a�rmf
where J� denotes the set of models in category *, abrand,platformb;p is brand-platform advertising, abrandb;f is
brand advertising; abrand combc;p is brand combination advertisin, aplatformf;p is �rm-platform advertising, anda�rmf is �rm advertising.
18

more at the CPU level.27 In many cases, the same PC brand has models with AMD chips
and models with Intel chips. Thus PC brand ads do not accurately capture the di¤erence
between PCs with Intel chips versus those with AMD chips. Although PC brand ads are
larger for the brands of PCs with AMD chip on average, it is because some heavily advertised
brands have models with AMD and Intel chips.
Mean MeanIntel AMD Difference tvalue
Price (1000$2000) 1.28 0.98 0.30 17.10Mobile 0.58 0.52 0.06 2.63CPU benchmark 0.33 0.46 0.14 26.01CPU speed (1000mhz) 2.09 1.93 0.16 5.20Older PC 0.19 0.21 0.02 1.34PC age 1.65 1.25 0.40 4.74Older CPU 0.37 0.33 0.04 1.87CPU age 2.60 1.93 0.67 5.64Chip ads (10 mil.$2000) 2.65 0.36 2.29 45.78PC brand ads (10 mil.$2000) 0.41 0.69 0.27 8.34Num. obs. 4708 619
Table 6: Descriptive Statistics by CPU Manufacturer
Finally, we use surveys on PC purchases from Forrester Research surveys from 2002
through 2005. These data have information about individual consumers� PC and CPU
choices, although they are not detailed at the product level. For example, we observe whether
a survey respondent bought a PC in the last year, some characteristics of the PC such as
PC �rm and CPU manufacturer (Intel, AMD, Apple28 , Other, or Don�t know) if purchased.
In addition, they include information on advertising exposure, which allows us to link de-
mographics to �rm and CPU advertising. Given that ad exposure is very relevant to the
e¤ectiveness of advertising, this information is useful to determine heterogenous advertising
e¤ects over di¤erent demographic groups.
27 Over this time frame, there was advertising of Microsoft products that featured Intel chips. Intel�s chipadvertising expenditures includes advertising that was done with Microsoft.
28 During the data time period, Apple PCs used only IBM chips.
19
4 Model and Estimation Technique
4.1 CPU Demand
Following Berry, Levinsohn, and Pakes (1995) (BLP) and Sovinsky Goeree (2008) we model
the demand for PCs as a random-coe¢ cient logit. The demand for CPUs can be inferred
from the demand for a PC model as a PC comes equipped with a single CPU. When
consumers purchase computers, they choose a combination of PC �rm and CPU type.29
There are T markets, indexed by t = 1; 2; :::; T , each with It consumers, indexed by i. A
home market consumer chooses from J products, indexed j = 1; :::; J , where a product is a
PC vendor (i.e., Acer), PC vendor brand (i.e., Aspire), platform type (i.e., Notebook), CPU
vendor (i.e., Intel), CPU family (i.e., Pentium 4), CPU speed (i.e., 1600/1799 MHz) quarter
combination.
Product j characteristics are price of the PC (p) and non-price observed attributes of the
PC (x); which include the platform and PC vendor dummy variables, dummy variables for
whether the processor is manufactured by Intel, processor speed, the age of the CPU and
the CPU benchmark score.
Advertising is an additional characteristic that may impact consumer demand.30 Given
the di¤erence in advertising campaigns across �rms and CPU suppliers, we allow advertising
by PC �rms (apcjt ) to have di¤erent e¤ect on consumer utility than advertising done by CPU
vendors (acpujt ). Finally, attributes unobserved to the researcher but known to consumers
and producers (�) may in�uence utility. The indirect utility consumer i obtains from j at
time t is
uijt = �jt + �ijt + �ijt; (1)
29 Many websites which provide CPU performance comparisons, such as CPUScoreCard.com, categorizeCPUs depending on computer type (i.e., desktops or laptops), and they compare CPUs within the samecomputer type. Considering that CPU chips intended to be used in desktops and laptops are di¤erent dueto di¤erent requirements, we can think that the choice of CPU type includes the choice of computer type.Song (2007) and Salgado (2008b) modeled consumers�choice of CPU type although consumers more oftenbuy computers, rather than CPU chips without computers.
30 It is reasonable to conjecture that all consumers know of the existence of Intel processors, thereforewe do not model Intel advertising as impacting the consumer�s choice set, but rather as impacting utilitydirectly. We assume that consumers know all �rms and processor types when making a purchase decision.
20
where
�jt = x0jt� + a
pcjt + a
cpujt �+ �jt
captures the base utility every consumer derives from product j and mean preferences for
xj are captured by �. The composite random shock, �ijt + �ijt;31 captures heterogeneity in
consumers�tastes for product attributes, and �ijt is a mean zero stochastic term distributed
i.i.d. type I extreme value across products and consumers.
We observe various levels of aggregation of advertising expenditures by PC �rms. These
include �rm-speci�c advertising (i.e., advertising for Dell), �rm-brand speci�c advertis-
ing (i.e., Dell Presario), �rm-platform advertising (i.e., Dell Notebooks), and �rm-brand-
platform advertising (i.e., Dell Presario Notebooks). CPU vendor advertising is at the �rm
level (i.e., Intel) and at the CPU level. We allow each type of PC �rm advertising and CPU
advertising to have a di¤erent impact on utility, as captured by the vectors and �.32
The apcjt is a vector of PC advertising variables aggregated at di¤erent levels and acpujt is a
vector of CPU advertising variables aggregated at di¤erent levels. For sake of exposition,
we de�ne ajt = fapc0jt acpu0jt g0:The �ijt term includes the interactions between observed consumer attributes (Dit); unob-
served (to the econometrician) random consumer tastes (�i); and observed product attributes
(xj); and the interactions between observed consumer attributes ( eDit) and advertising vari-
ables, where eDit is a subset of Dit: Speci�cally,
�ijt = � ln(yit � pjt) + xjt0(Dit + ��i) + a0jt�
eDit �i � N(0; Ik): (2)
where yit is income of individual i (in market t): The matrix measures how tastes vary
with xj: We assume that �i are independently and normally distributed with a variance to
be estimated. � is a scaling matrix. The � matrix captures how advertising�s impact varies
by observed consumer characteristics.
Consumers have an �outside�option, which includes purchase of a computer with non-
Intel or non-AMD processor (such as IBM chips exclusively used by Apple computers during
31 Choices of an individual are invariant to multiplication of utility by a person-speci�c constant, so we�x the standard deviation of the �ijt:
32 We also consider a speci�cation in which we allow for nonlinear e¤ects of advertising.
21

the sample period), a PC manufactured by a small �rms33 , and self-assembled PCs.34
Normalizing p0t to zero,35 the indirect utility from the outside option is
ui0t = � ln(yit) + �0t + �i0t:
We normalize �0t to zero, because we cannot identify relative utility levels.
The (conditional) probability that consumer i purchases product j is
sijt =expf�jt + �ijtg
yit� +P
r expf�rt + �irtg: (3)
The yit� term in the denominator is from the presence of the outside good. Let � i =
(yit; Dit; �i) be the vector of individual characteristics. We assume that the consumer
purchases at most one good per period,36 that which provides the highest utility, U . Let
Rj � f� : U(�; pj; xj; aj; �j; �ij) � U(�; pr; xr; ar; �r; �ir) 8r 6= jg de�ne the set of variablesthat results in the purchase of j given the parameters of the model. The home market share
of product j is
sjt =
ZRj
dG(y;D; �; �) =
ZRj
sijtdGy;D(y;D)dG�(�) (4)
where G(�) denotes the respective distribution functions. The second equality follows fromindependence assumptions. The conditional probability that i purchases j; sij; is given in
(3).
Note that this implies that the market share for �rm f of processor type c is given by
sfct =P
j2Jc\Jf
ZRj
expf�jt + �ijtgyit� +
Pr expf�rt + �irtg
dGy;D(y;D)dG�(�) (5)
=P
j2Jc\Jfsjt(p; a)
33 These include Everex, Medion, Micro Electronics, Motion Computing, MPC, NEC, Sharp, and VelocityMicro.34 Apple Computer is included in the outside option for CPU�s because they used IBM processors during
the sample period (2002:Q2 - 2005:Q4).
35 The e¤ect of changes over time in prices of the outside option is captured by the relative attractivenessof goods to the outside option.
36 This assumption may be unwarranted for some products for which multiple purchase is common.However it is not unreasonable to restrict a consumer to purchase one computer per quarter. Hendel (1999)examines purchases of PCs by businesses and presents a multiple-choice model of PC purchases.
22
where Jf are the set of products produced by �rm f and Jc are the set of products with aCPU of type c. Note that processor market share is a function of PC prices and advertising
of all PC products. Demand of �rm f for CPU processor c at time t isMtsfct; whereMt is
the market size given by the total number of PCs sold each quarter. The observed market
share of a processor is given by the number of units sold of that processor divided by the
total number of processors sold. The total number of observations is 5,327.
4.2 Marketing Revenue
Intel�s marketing campaign provided support to PC �rms that advertised PCs with Intel
chips. One of the bene�ts of the TAP approach is it allows us to circumvent modeling
Intel�s pro�t maximization problem. This is bene�cial both because the test (and model)
would become very complicated and the data necessary to estimate such a model do not
exist, in particular �rm-speci�c rebate rates are not publicly available. Suppressing time
notation, the total marketing/ad revenue (TMR) of Intel from PC sales is
TMR =X
c2Jintel
Xf
(pCPUc �mcc)Msfc(p; a); (6)
where Jintel is the set of products with an Intel CPU; pCPUc is the price of CPU c; mcc is
the marginal production cost of CPU c and sfc(p; a) is market share of processor c sold by
�rm f given in equation (5), which depends on the product price (i.e., PC price, p) and
advertising (a).37
One issue to address in the PC advertising data is that advertising may involve more than
one product. For example, PC �rms often engage in general promotions both by platform
type and across all platforms (e.g., Acer Laptop Computer; Acer Various Computers) or
PC brands may be jointly advertised (e.g., Acer Veriton & Travelmate Computers Combo).
We will require a composite measure of advertising expenditures by product that includes
all advertising done for that product (so it should include all group advertising). Following
37 The CPU price is the listed price. In practice, many PC �rms paid less than listed price as Intel granteddiscounts on CPU prices to selected �rms. As a results our measure of the TMR will be larger than what itwould be if we had the purchase price. Thus our measure of TMR makes the TAP results more stringentthan what they would be if we had the purchase price.
23
Sovinsky Goeree (2008) we compute product advertising expenditures as a weighted average
of group advertising for that product where the weights are a function of the number of
products in that group. Speci�cally, suppressing the time subscript, let Gj be the set ofall product groups that include product j with group H 2 Gj: Then composite product adexpenditures for product j are given by
atotal pcj =XH2Gj
�HapcjH
jHj :
where the sum is over the di¤erent groups that include product j:We also estimate a non-
linear speci�cation to allow for increasing or decreasing returns to group advertising.
Intel�s marginal revenue from the marketing campaign for �rm f is given by
MMRf =MX
j;r2Jf\c2Jintel
(pCPUc �mcc)@sj(p; a)
@atotal pcr
: (7)
As we discussed previously, we have data on pCPUc and mcc: We can use these data
together with the demand side estimates to compute the marginal revenue of advertising
dollars spent by PC �rm f on Intel chips.
5 Estimation Technique
We implement the econometric technique found in many studies of di¤erentiated products,
such as BLP (1995, 1998) and Nevo (2000). The parameters are � = f�; �; ; �;�;;�g.Under the assumption that the observed data are the equilibrium outcomes, we estimate the
parameters simultaneously using generalized method of moments (GMM).
Following BLP, we restrict the model predictions for j�s market share to match observed
shares. We solve for �(S; �) that is the implicit solution to
Sobst � st(�; �) = 0 (8)
where Sobst and st are vectors of observed and predicted shares respectively. We substitute
24
�(S; �) for � when calculating the moments.38 The �rst moment unobservable is
�jt = �jt(S; �)� x0j�: (9)
We use the Forrester data to construct CPU manufacturer choice micro moments. Petrin
(2002) shows how to combine macro data with data that links average consumer attributes
to product attributes to obtain more precise estimates. We augment market share data with
data relating consumers to product characteristics as in Sovinsky Goeree (2008). The micro
data we have connect consumers to processor manufacturer. We combine the processor �rm
choice data with product level data to obtain more precise estimates of the parameters of the
taste distribution () and the parameters of advertising e¤ectiveness (�). The demographic
characteristics for these moments (denoted Dit) are given by the Forester data, which are
linked directly to purchases and advertising exposure.
Let Bi be a R � 1 vector of processor manufacturer choices for individual i. Let bi be
a realization of Bi where bir = 1 if a CPU produced by r ={Intel, AMD, or Other} was
chosen. De�ne the residual as the di¤erence between the vector of observed choices and the
model prediction given (�; �) :
Bi(�; �) = bi � E�E[Bi j Dit; �; �]: (10)
For example, the element of E�E[Bi j Dit; �; �] corresponding to Intel for consumer i isXc2Jintel
Xj2Jc
ZRj
expf�jt + �ijtgy�it +
Pr expf�rt + �irtg
dG�(�);
where the summand is over products sold by Intel, the integral is over the assumed distrib-
ution of �: The population restriction for the micro moment is E[Bi(�; �) j (x; �)] = 0: LetB(�; �) be the vector formed by stacking the residuals Bi(�; �) over individuals.We use GMM to �nd the parameter values that minimize the objective function, �0ZA�1Z 0�;
where A is an appropriate weighting matrix which is a consistent estimate of E[Z 0��0Z] and
Z are instruments orthogonal to the composite error term �. Speci�cally, if Z�; ZB are the
38 As discussed in Dube et al (2011) we use a precise tolerance level for the contraction mapping. Formore details see section 7.1.
25

respective instruments for each disturbance/residual, the sample moments are
Z 0� =
2664 1J
PJj=1 Z�;j�j(�; �)
1N
PNi=1 ZB;iBi(�; �)
3775where Z�;j is column j of Z�: Joint estimation takes into account the cross-equation restric-
tions on the parameters that a¤ect both the macro and micro moments, which yields more
e¢ cient estimates.
The market shares in (4) must be simulated. As in BLP, the distribution of consumer
demographics is an empirical one. As a result there is no analytical solution for predicted
shares, making simulation necessary. The simulator for the market share is the average over
individuals of choice probabilities. An outline of the technique follows. We sample a set of
�individuals�where each consists of (vi1; : : : ; vik) taste parameters drawn from a multivariate
normal; demographic characteristics, (yi; Di1; : : : ; Did); drawn from the Forrester data in the
case of the macro moments and data in the case of the micro moments. To construct the
market share constraints we draw J uniform random variables for each individual. For
a given value of the parameters, we compute the probability she would buy each product.
The market share simulator is the average over individuals of the choice probabilities. The
process is similar for the micro moment constraints, but we take R draws for each product-
individual pair. The simulator for individual product choice probabilities is the average over
the R draws. Individual �rm choice probabilities are the sum over the products o¤ered by
each �rm.
Using the results of Pakes and Pollard (1989), this estimator is consistent and asymp-
totically normal. As the number of pseudo random draws used in simulation R ! 1 the
method of simulated moments covariance matrix approaches the method of moments covari-
ance matrix. To reduce the variance due to simulation, we employ antithetic acceleration
(for an overview of simulation techniques see Stern, 1997 and 2000). Geweke (1988) shows
if antithetic acceleration is implemented during simulation, then the loss in precision is of
order 1=N (where N are the number of observations), which requires no adjustment to the
asymptotic covariance matrix. The reported (asymptotic) standard errors are derived from
the inverse of the simulated information matrix which allows for possible heteroskedasticity.39
26
5.1 Identi�cation
Following the literature, we assume that the demand unobservables (evaluated at the true
value of the parameters, �0) are mean independent of a vector of observable product char-
acteristics, (x) :
E��jt(�0) j xjt
�= 0: (11)
We do not observe �jt, but market participants do. This may lead to endogeneity of price
and advertising. For example, some products may have higher quality, which is unobserved
by researchers, and PC �rms may set higher prices and/or determine their ad expenditures
based on quality. Also, a CPU manufacturer may advertise more when the PCs with its
CPU are of higher quality. To account for the potential endogeneity of price and advertising,
we employ instrumental variables.
BLP show that variables that shift markups are valid instruments for price in di¤erenti-
ated products models and Sovinsky Goeree (2008) shows that variables that shift markups
are valid instruments for advertising.40 One set of instruments we use is the number of
products per �rm, this is chosen to re�ect competitive pressure. Competitive pressure for
a model is likely to a¤ect price and advertising choices (via their �rst-order conditions) but
does not impact consumer utility from purchasing the model. We also use the character-
istics of other products of the same PC �rm and those of other PC �rms as instruments for
price and advertising. In particular, we use the sum of the values of the characteristics - mo-
bile platform, performance benchmark (PassMark point), CPU speed, PC and CPU ages - of
other products o¤ered by the same PC �rm and the sum of the values of the characteristics
of all the products o¤ered by other PC �rms.
39 The reported standard errors do not included additional variance due to simulation error.
40 Products which face more competition (due to many rivals o¤ering similar products) will tend tohave lower markups relative to more di¤erentiated products. Advertising for j depends on j�s markup.Pricing FOCs show the optimal price (and hence markup) for j depends upon characteristics of all of theproducts o¤ered. Therefore, the optimal price and advertising depends upon the characteristics, prices,and advertising of all products o¤ered. Thus optimal instruments will be functions of attributes and costshifters of all other products.
27
In addition, we construct variables that capture technological change. Technological
change a¤ects production cost and hence would be related to the level of price and advertising
but unrelated to consumer utility. In particular, we use a series of interactions between
CPU cohort41 dummy variables and time (year-quarter) dummy variables and a series
of interactions between PC cohort42 dummy variables and time (year-quarter) dummy
variables. These variables are intended to proxy the change in production cost over time
(e.g., declining production cost due to learning by doing).
An informal identi�cation argument follows. Associated with each PC is a mean utility,
which is chosen to match observed and predicted market shares. All variation in sales
would be driven by variation in product attributes if consumers were identical. Variation
in product market shares corresponding to variation in the observable attributes of those
products (such as CPU speed) is used to identify the parameters of mean utility (�).
A PC may have attributes that provide more utility to certain types of consumers. For
instance, if young male adults prefer to use their PC to play games, then young male con-
sumers may place a higher valuation on CPU speed relative to other cohorts. Identi�cation
of the taste distribution parameters (�;) relies on information on how consumers substitute
(see equation (2)). There are two issues that merit attention. First, new product introduc-
tions are common in the PC industry. Variation of this sort is helpful for identi�cation of �.
The distribution of unobserved tastes, �i; is �xed over time, but the choice set of available
products is changing over time. Variation in sales patterns over time as the choice sets
change allows for identi�cation of �. Second, we augment the market level data with micro
data on CPU manufacturer choice. The extra information in the micro data allows variation
in choices to mirror variation in tastes for product attributes. Correlation between xjDi and
choices identi�es the parameters. The individual-level data contain useful information
on ad exposure across households. Variation in ad exposure corresponding to variation in
observable consumer characteristics ( eDi) identi�es �.
41 CPU cohort is the set of CPU models which have the �rst sales record in the same quarter.
42 PC cohort is the set of PC models which have the �rst sales record in the same quarter.
28

6 CPU Demand Estimation Results
6.1 Preliminary Regressions
First, we present results from a series of probit regressions of the probability of purchasing
a PC in 2002 for use at home as given in the Forrester data. The estimates are presented
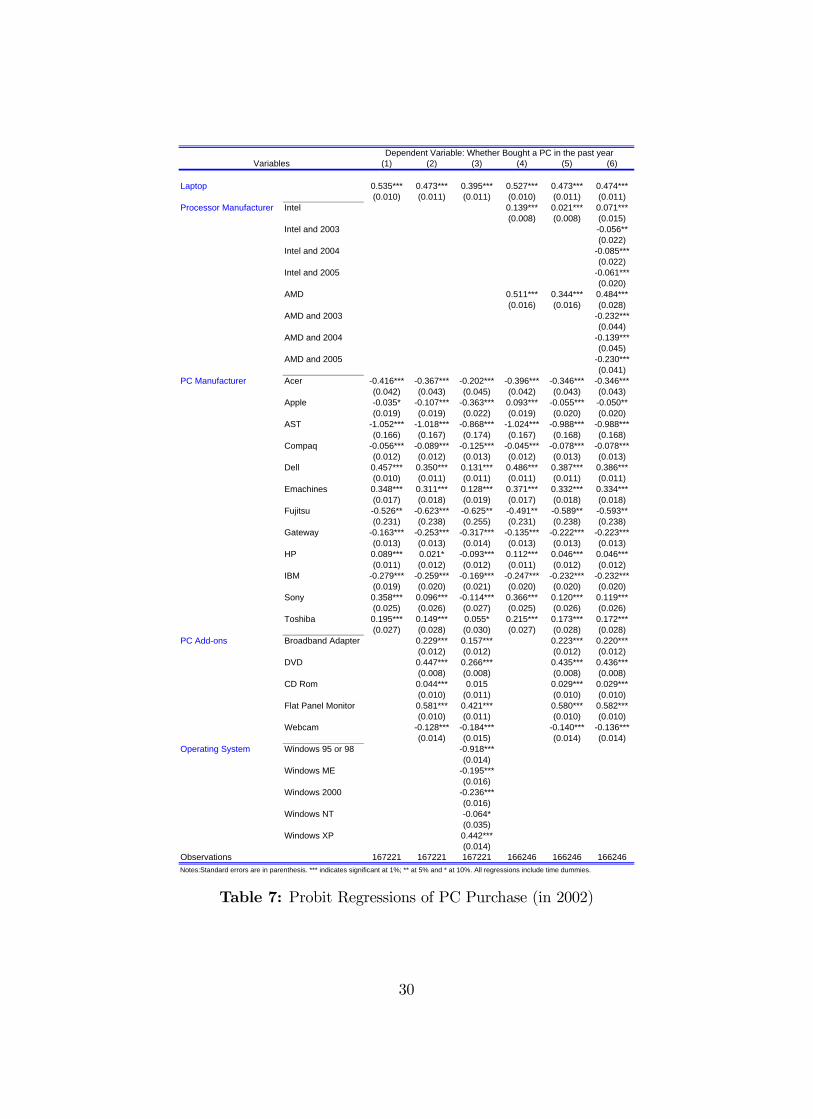
in Table 7 and illustrate the importance of observed product heterogeneity in PC purchases.
The results indicate that the form factor of the PC is important as well as �rm �xed e¤ects.
Finally, the opportunity to add-on certain items (such as a �at-screen monitor) increases the
probability of purchase. As columns (4)-(6) illustrate, consumers value PCs with a Intel or
AMD processor even after controlling for other product characteristics. Furthermore, the
results suggest the valuation of processor type is not constant over time (Column 6).
29
Dependent Variable: Whether Bought a PC in the past yearVariables (1) (2) (3) (4) (5) (6)
Laptop 0.535*** 0.473*** 0.395*** 0.527*** 0.473*** 0.474***(0.010) (0.011) (0.011) (0.010) (0.011) (0.011)
Processor Manufacturer Intel 0.139*** 0.021*** 0.071***(0.008) (0.008) (0.015)
Intel and 2003 0.056**(0.022)
Intel and 2004 0.085***(0.022)
Intel and 2005 0.061***(0.020)
AMD 0.511*** 0.344*** 0.484***(0.016) (0.016) (0.028)
AMD and 2003 0.232***(0.044)
AMD and 2004 0.139***(0.045)
AMD and 2005 0.230***(0.041)
PC Manufacturer Acer 0.416*** 0.367*** 0.202*** 0.396*** 0.346*** 0.346***(0.042) (0.043) (0.045) (0.042) (0.043) (0.043)
Apple 0.035* 0.107*** 0.363*** 0.093*** 0.055*** 0.050**(0.019) (0.019) (0.022) (0.019) (0.020) (0.020)
AST 1.052*** 1.018*** 0.868*** 1.024*** 0.988*** 0.988***(0.166) (0.167) (0.174) (0.167) (0.168) (0.168)
Compaq 0.056*** 0.089*** 0.125*** 0.045*** 0.078*** 0.078***(0.012) (0.012) (0.013) (0.012) (0.013) (0.013)
Dell 0.457*** 0.350*** 0.131*** 0.486*** 0.387*** 0.386***(0.010) (0.011) (0.011) (0.011) (0.011) (0.011)
Emachines 0.348*** 0.311*** 0.128*** 0.371*** 0.332*** 0.334***(0.017) (0.018) (0.019) (0.017) (0.018) (0.018)
Fujitsu 0.526** 0.623*** 0.625** 0.491** 0.589** 0.593**(0.231) (0.238) (0.255) (0.231) (0.238) (0.238)
Gateway 0.163*** 0.253*** 0.317*** 0.135*** 0.222*** 0.223***(0.013) (0.013) (0.014) (0.013) (0.013) (0.013)
HP 0.089*** 0.021* 0.093*** 0.112*** 0.046*** 0.046***(0.011) (0.012) (0.012) (0.011) (0.012) (0.012)
IBM 0.279*** 0.259*** 0.169*** 0.247*** 0.232*** 0.232***(0.019) (0.020) (0.021) (0.020) (0.020) (0.020)
Sony 0.358*** 0.096*** 0.114*** 0.366*** 0.120*** 0.119***(0.025) (0.026) (0.027) (0.025) (0.026) (0.026)
Toshiba 0.195*** 0.149*** 0.055* 0.215*** 0.173*** 0.172***(0.027) (0.028) (0.030) (0.027) (0.028) (0.028)
PC Addons Broadband Adapter 0.229*** 0.157*** 0.223*** 0.220***(0.012) (0.012) (0.012) (0.012)
DVD 0.447*** 0.266*** 0.435*** 0.436***(0.008) (0.008) (0.008) (0.008)
CD Rom 0.044*** 0.015 0.029*** 0.029***(0.010) (0.011) (0.010) (0.010)
Flat Panel Monitor 0.581*** 0.421*** 0.580*** 0.582***(0.010) (0.011) (0.010) (0.010)
Webcam 0.128*** 0.184*** 0.140*** 0.136***(0.014) (0.015) (0.014) (0.014)
Operating System Windows 95 or 98 0.918***(0.014)
Windows ME 0.195***(0.016)
Windows 2000 0.236***(0.016)
Windows NT 0.064*(0.035)
Windows XP 0.442***(0.014)
Observations 167221 167221 167221 166246 166246 166246Notes:Standard errors are in parenthesis. *** indicates significant at 1%; ** at 5% and * at 10%. All regressions include time dummies.
Table 7: Probit Regressions of PC Purchase (in 2002)
30
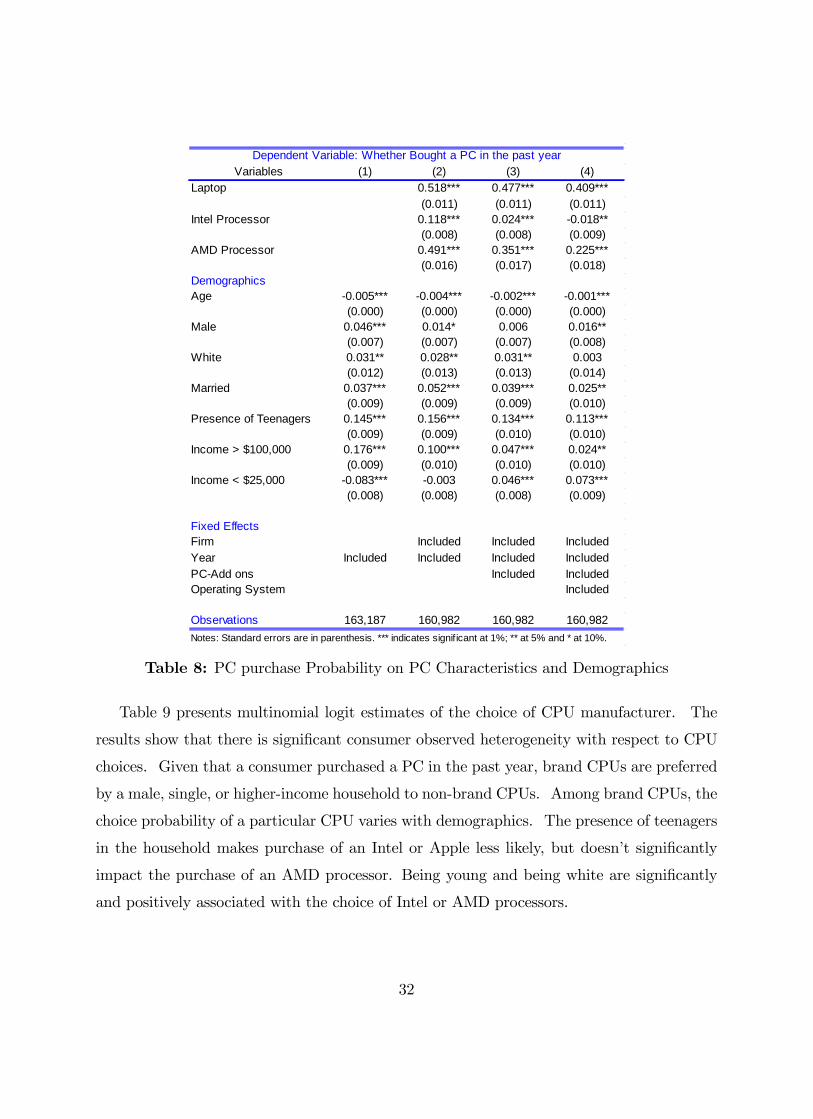
Table 8 presents probit estimates of purchase probabilities that illustrate the importance
of product and individual observed heterogeneity for PC purchases. The independent vari-
able is again whether the individual bought a PC in the past year. We start by including
demographic variables (Column 1). We can see all the estimates on the coe¢ cients of de-
mographic variables are statistically signi�cant. Once we include a laptop dummy and CPU
type (Intel dummy and AMD dummy), some demographic variables become less signi�cant
(Column 2). Not surprisingly, the results indicate individuals are more likely to purchase a
PC with an Intel or AMD processor than non-branded processors. Whether the computer
is a laptop is also a signi�cant factor in the purchase decision. After controlling for PC
add-ons (Column 3) and Operating System dummy variables (Column 4), preference for a
laptop and a PC with Intel or AMD processor have less impact on PC purchase probability.
Overall, the results suggest that PC characteristics a¤ect the purchase decision after con-
trolling for demographics and that certain demographics are more important than others in
the purchase decision.
31
Dependent Variable: Whether Bought a PC in the past yearVariables (1) (2) (3) (4)
Laptop 0.518*** 0.477*** 0.409***(0.011) (0.011) (0.011)
Intel Processor 0.118*** 0.024*** 0.018**(0.008) (0.008) (0.009)
AMD Processor 0.491*** 0.351*** 0.225***(0.016) (0.017) (0.018)
DemographicsAge 0.005*** 0.004*** 0.002*** 0.001***
(0.000) (0.000) (0.000) (0.000)Male 0.046*** 0.014* 0.006 0.016**
(0.007) (0.007) (0.007) (0.008)White 0.031** 0.028** 0.031** 0.003
(0.012) (0.013) (0.013) (0.014)Married 0.037*** 0.052*** 0.039*** 0.025**
(0.009) (0.009) (0.009) (0.010)Presence of Teenagers 0.145*** 0.156*** 0.134*** 0.113***
(0.009) (0.009) (0.010) (0.010)Income > $100,000 0.176*** 0.100*** 0.047*** 0.024**
(0.009) (0.010) (0.010) (0.010)Income < $25,000 0.083*** 0.003 0.046*** 0.073***
(0.008) (0.008) (0.008) (0.009)
Fixed EffectsFirm Included Included IncludedYear Included Included Included IncludedPCAdd ons Included IncludedOperating System Included
Observations 163,187 160,982 160,982 160,982Notes: Standard errors are in parenthesis. *** indicates signif icant at 1%; ** at 5% and * at 10%.
Table 8: PC purchase Probability on PC Characteristics and Demographics
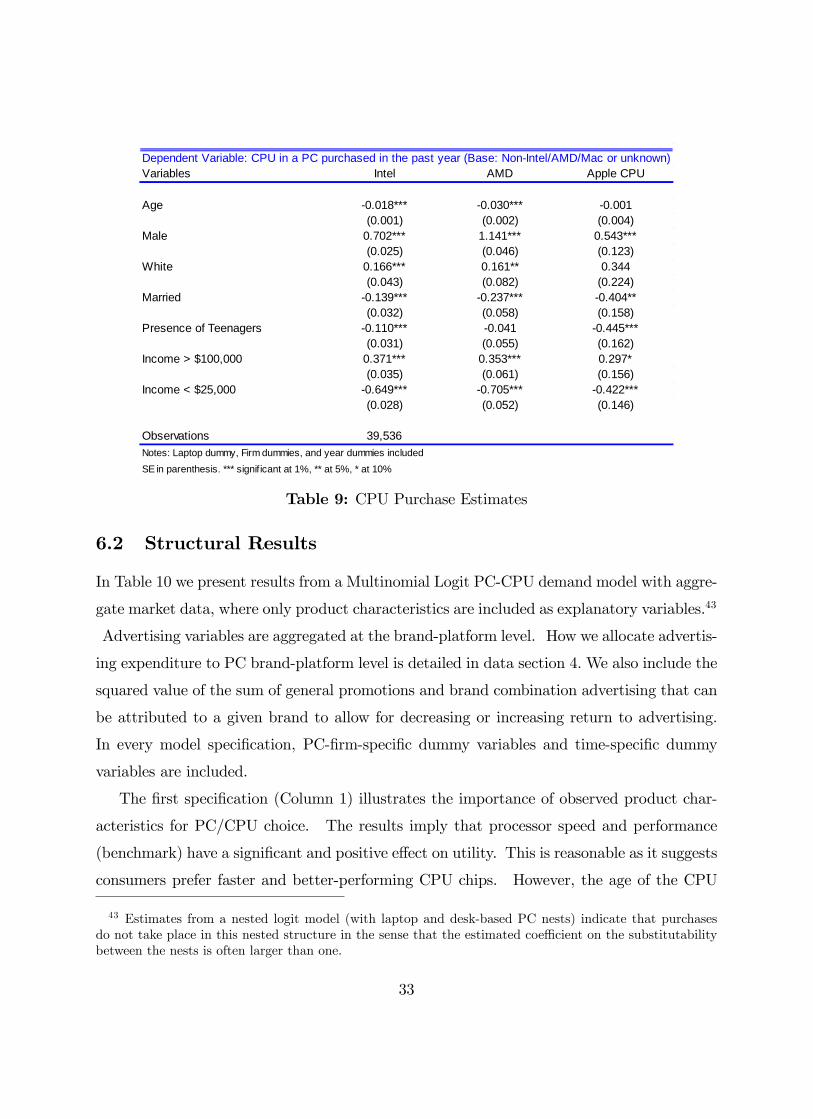
Table 9 presents multinomial logit estimates of the choice of CPU manufacturer. The
results show that there is signi�cant consumer observed heterogeneity with respect to CPU
choices. Given that a consumer purchased a PC in the past year, brand CPUs are preferred
by a male, single, or higher-income household to non-brand CPUs. Among brand CPUs, the
choice probability of a particular CPU varies with demographics. The presence of teenagers
in the household makes purchase of an Intel or Apple less likely, but doesn�t signi�cantly
impact the purchase of an AMD processor. Being young and being white are signi�cantly
and positively associated with the choice of Intel or AMD processors.
32
Variables Intel AMD Apple CPU
Age 0.018*** 0.030*** 0.001(0.001) (0.002) (0.004)
Male 0.702*** 1.141*** 0.543***(0.025) (0.046) (0.123)
White 0.166*** 0.161** 0.344(0.043) (0.082) (0.224)
Married 0.139*** 0.237*** 0.404**(0.032) (0.058) (0.158)
Presence of Teenagers 0.110*** 0.041 0.445***(0.031) (0.055) (0.162)
Income > $100,000 0.371*** 0.353*** 0.297*(0.035) (0.061) (0.156)
Income < $25,000 0.649*** 0.705*** 0.422***(0.028) (0.052) (0.146)
Observations 39,536Notes: Laptop dummy, Firm dummies, and year dummies includedSE in parenthesis. *** signif icant at 1%, ** at 5%, * at 10%
Dependent Variable: CPU in a PC purchased in the past year (Base: NonIntel/AMD/Mac or unknown)
Table 9: CPU Purchase Estimates
6.2 Structural Results
In Table 10 we present results from a Multinomial Logit PC-CPU demand model with aggre-
gate market data, where only product characteristics are included as explanatory variables.43
Advertising variables are aggregated at the brand-platform level. How we allocate advertis-
ing expenditure to PC brand-platform level is detailed in data section 4. We also include the
squared value of the sum of general promotions and brand combination advertising that can
be attributed to a given brand to allow for decreasing or increasing return to advertising.
In every model speci�cation, PC-�rm-speci�c dummy variables and time-speci�c dummy
variables are included.
The �rst speci�cation (Column 1) illustrates the importance of observed product char-
acteristics for PC/CPU choice. The results imply that processor speed and performance
(benchmark) have a signi�cant and positive e¤ect on utility. This is reasonable as it suggests
consumers prefer faster and better-performing CPU chips. However, the age of the CPU
43 Estimates from a nested logit model (with laptop and desk-based PC nests) indicate that purchasesdo not take place in this nested structure in the sense that the estimated coe¢ cient on the substitutabilitybetween the nests is often larger than one.
33

does not impact consumers valuations of the PC, while the age of the PC does. A likely
explanation is that age captures the popularity or consumer awareness of a PC model or a
CPU. If a product has been on the market for a while, it may imply either that consumers
like the product, due to attractive qualities unobserved by the researcher, or that the product
is well-known to potential buyers. Surprisingly, consumers place a lower valuation on the
PC if it is a laptop, but this �nding is not robust across speci�cations. Finally, conditional
on CPU speed and the performance benchmark, consumers place a lower value on CPUs
manufactured by Intel.
As we discussed earlier, prices may be correlated with the structural error term and
hence endogenous. In Column (2) we include instruments for price. The impact of price
on demand becomes much more negative, which is consistent with price being a proxy for
higher quality. The rest of the estimates do not change with the exception of the valuation
of Intel and the valuation of laptop, which are no longer signi�cant.
In speci�cation (3), PC characteristics are taken out and advertising variables are added.
As compared with the price coe¢ cient estimate from speci�cation (1), the price coe¢ cient is
estimated to be smaller (i.e. more negative). This suggests that advertising variables may
be correlated with unobserved product attributes and we need to correct for the possible
correlation between advertising and unobserved high quality. We also �nd that consumers
marginal valuation of PC advertising is positive, while the valuation of �rm level CPU
advertising is negative and statistically insigni�cant.
In speci�cation (4) we allow the e¤ect of advertising to be di¤erent across PC �rms. The
results suggest some �rms are more e¤ective at advertising their products than others, but
otherwise the coe¢ cient estimates do not change much. Speci�cations (5) and (6) include all
explanatory variables (PC characteristics, CPU characteristics, and advertising variables),
but speci�cation (5) instruments only for price while speci�cation (6) instruments for both
price and advertising. We have more elastic demand when using speci�cation (6). Again,
this suggests that advertising is correlated with unobserved product attributes.
The parameter on the Intel dummy variable is negative or insigni�cant in all speci�cations
after other PC/CPU characteristics and CPU advertising amount are taken into account.
This result is consistent with the preliminary regression result in Table 7 that shows that
34

the purchase probability is actually higher when a PC is powered by AMD chip than by an
Intel chip.
Advertising at the CPU level is not valued by consumers in most speci�cations but
has a positive and signi�cant impact in speci�cation (6) after instrumenting for CPU ads.
Advertising by a PC �rm at the brand level is always positive and signi�cant. In particular,
when evaluated at the average value, a one unit increase in PC advertising at the brand
level leads to a 0.99 increase in the utility level (speci�cation (5)). When advertising
variables are instrumented, there is a larger positive impact of advertising on demand at
the PC level: when evaluated at the average value, one unit increase in PC advertising at
brand level leads to 1.43 increase in the utility level (speci�cation (6)). Note that a more
positive advertising a¤ect after instrumenting for advertising suggests that advertising may
be negatively correlated with unobserved product qualities. That is, �rms may engage in
more advertising when they have lower-quality products. This result appears reasonable
given that the low-end processor of Intel, Celeron was heavily advertised during the period.
The positive impact of PC advertising implies that CPU �rms can enhance CPU sales
by inducing PC �rms to advertise PCs that contain their chip. This provides us with
the pro-competitive justi�cations for Intel�s marketing campaign: promoting CPU sales by
subsidizing PC advertising. We will test whether the bene�t of promoting CPU sales by
subsidizing PC advertising exceeds the cost of the marketing subsidy. If not, the marketing
campaign may be driven by anticompetitive motives.
35

Variables (1) (2) (3) (4) (5) (6)
Price 0.286*** 1.047* 0.522*** 0.348*** 1.806*** 2.261***(0.0855) (0.609) (0.0669) (0.0647) (0.541) (0.642)
PC Characteristics Laptop 0.178** 0.146 0.425* 0.510*(0.0711) (0.266) (0.236) (0.292)
Older PC 0.906*** 0.858*** 0.651*** 0.578***(0.122) (0.128) (0.114) (0.145)
PC Age 0.126*** 0.138*** 0.0939*** 0.0901***(0.0222) (0.0241) (0.0215) (0.0238)
CPU Characteristics Intel 0.510*** 0.233 0.00972 0.0282 0.517 2.053(0.103) (0.244) (0.231) (0.219) (0.319) (1.305)
ln(Benchmark) 0.371** 0.851** 0.582*** 0.429*** 1.344*** 1.390***(0.155) (0.414) (0.128) (0.120) (0.372) (0.434)
ln(Speed) 1.594*** 1.731*** 1.382*** 1.115*** 1.632*** 1.730***(0.106) (0.149) (0.0882) (0.0848) (0.135) (0.166)
Older CPU 0.0906 0.0641 0.485*** 0.498*** 0.239** 0.194(0.113) (0.116) (0.0922) (0.0832) (0.107) (0.129)
CPU Age 0.00524 0.0101 0.0993*** 0.0964*** 0.0355* 0.0224(0.0174) (0.0206) (0.0135) (0.0131) (0.0186) (0.0229)
Advertising CPU ad 0.0239 0.0730 0.140 4.166***(0.187) (0.172) (0.193) (1.357)
CPU ad squared 0.00828 0.0335 0.0171 0.862***(0.0306) (0.0277) (0.0321) (0.253)
PC ad 2.353*** 2.368*** 3.480***(0.0828) (0.0861) (0.300)
PC ad squared 0.294*** 0.304*** 0.576***(0.0216) (0.0224) (0.132)
Included ControlsIV for Price Included Included IncludedIV for Advertising IncludedPC Advertising IncludedPC Advertising Squared IncludedPC Firm Fixed Effects Included Included Included Included Included Included
Observations 5,327 5,327 5,327 5,327 5,327 5,327Rsquared 0.498 0.491 0.597 0.650 0.575 0.471Median (Own) Price Elasticity 0.336 1.231 0.613 0.409 2.122 2.658
Dependent Variable: ln(Market Share) ln(Share of Outside Goods)
Notes:Standard errors are in parenthesis. *** indicates signif icant at 1%; ** at 5% and * at 10%. All regressions include time dummies.
Table 10: Multinomial Logit Estimates of PC/CPU Demand
7 Test of Advertising Predation (TAP) Results
We apply the TAP test to the case of Intel. Speci�cally, we consider the potential predatory
nature of Intel�s marketing program over the period 2002 to 2005. We run TAP based on
preliminary demand estimation results from speci�cation (6). Intel�s marginal revenue from
the marketing campaign for �rm f is given by
36

MMRf =MX
j;r2Jf\c2Jintel
(pCPUc �mcc)@sj(p; a)
@atotal pcr
:
where Jintel is the set of Intel CPUs and Jf are the set of products produced by �rm f: Wecompute the marginal revenue from the advertising campaign earned in that time period
(i.e., ours is not a dynamic model). Estimating a dynamic model of demand and computing
the associated marginal revenue that arises from a dynamic pro�t function would introduce
considerable di¢ culties with respect to estimation and data requirements. However, we
conduct robustness checks of our TAP results that consider the potential brand building
e¤ect of advertising. We discuss this in more detail in section 7.1.
The estimated marginal revenue of Intel�s marketing subsidy to Dell and its 95 percent
con�dence interval is given in Table 11, along with the marginal cost of the marketing
campaign computed in four di¤erent ways as described in section (2).44 When the marginal
cost measure is above the 95 percent con�dence interval for marginal revenue, we conclude
that the marketing program is not consistent with pro�t maximization and, more speci�cally,
that there was an excessive marketing subsidy. Then the test result is �positive�. The �nal
column indicates for which of the four measures of marginal cost the TAP result is positive.
44 Since the marginal revenue of the marketing program is a linear combination of utility parameters, thecon�dence interval around the estimate of the marginal revenue can be computed easily. MC1 is Intel�s totalpayment to Dell divided by the total advertising expenditure of Dell on PCs powered by Intel CPU; MC2is MC1 multiplied by the fraction of revenue from PC sales (= PC sales=(PC sales + server sales); MC3 issix percent of Intel�s revenue from selling CPUs to Dell (= 0:06 �M
Pc2Jintel
Pj2Jc\JDell
sjpCPUc ); MC4 is
three percent of Intel�s revenue from selling CPUs to Dell (so MC4 = MC3=2).
37

TAP ResultQuarter Est. (1) (2) (3) (4) Positive in2002Q1 1.45 ( 1.22 1.69 ) 34.54 31.12 3.33 1.66 1,2,32002Q2 0.88 ( 0.73 1.02 ) 45.62 40.70 3.73 1.87 all2002Q3 1.23 ( 1.03 1.43 ) 53.31 48.05 5.90 2.95 all2002Q4 2.22 ( 1.85 2.58 ) 91.86 82.59 13.02 6.51 all
all2003Q1 2.95 ( 2.46 3.45 ) 352.14 315.44 44.78 22.39 all2003Q2 2.38 ( 1.98 2.77 ) 192.68 171.66 17.50 8.75 all2003Q3 3.02 ( 2.52 3.52 ) 140.80 126.81 13.61 6.80 all2003Q4 2.92 ( 2.45 3.40 ) 93.19 82.75 7.57 3.79 all
all2004Q1 3.35 ( 2.79 3.91 ) 682.73 607.55 56.66 28.33 all2004Q2 1.95 ( 1.62 2.27 ) 345.53 306.09 18.57 9.28 all2004Q3 1.72 ( 1.44 2.00 ) 133.28 118.52 7.39 3.69 all2004Q4 2.05 ( 1.71 2.39 ) 192.46 171.46 8.55 4.27 all
all2005Q1 6.27 ( 5.22 7.32 ) 390.02 340.19 15.51 7.75 all2005Q2 4.36 ( 3.64 5.09 ) 370.16 323.16 11.30 5.65 all2005Q3 4.40 ( 3.67 5.14 ) 348.36 307.69 15.67 7.83 all2005Q4 5.83 ( 4.85 6.80 ) 340.69 298.21 13.25 6.63 1,2,3
Notes: Unit: $ (inflation adjusted base: 2000)
Computed Marginal Revenue Observed Marginal Cost95% conf. Interval
Table 11. TAP Results of Intel�s Marketing Campaign for Dell�s Advertising of
Intel-Powered PCs
It is worth to note the following two points. First, the marginal revenue estimates imply
that 1$ PC advertising tends to increase Intel�s revenue by more than 1$ (except in the
second quarter of 2000). Thus, if all of Intel�s payment to Dell are used for marketing
PCs powered by Intel CPU, then the results suggest that Intel gains more than its cost
by subsidizing Dell. However, our measures of marginal cost are much larger than 1, that
is, PC advertising expenditure falls short of Intel�s marketing subsidy to Dell in reality.45
This implies that Intel needs to incur more than 1$ to induce Dell to spend 1$ more on
45 There are a few reasons why marginal costs may be larger than one. First, while, in principle, themarketing subsidy should have been used only for marketing, case �les indicate that stock analysts haddoubt about the use of the subsidy. The subsidy was actually a huge amount that accounts for a signi�cantportion of operating pro�ts. Second, marketing may be broadly de�ned to include more than advertising.For example, it may encompass training employees in how to sell PCs.
38

advertising.
Second, MC3 and MC4 are signi�cantly smaller than MC1 and MC2. Considering
thatMC1 andMC2 are computed based on the actual payment whereasMC3 andMC4 are
computed by assuming the rebate rate applied in the normal periods, our results suggest that
Intel has paid much more to Dell than described in their Intel Inside marketing campaign.
The TAP results show that marginal cost, for all measures, is above the 95 percent
con�dence interval of marginal revenue estimates in most periods. Exceptions are when
MC4 is compared to marginal revenue in the beginning of the anticompetitive period and at
the end of the anticompetitive period. Even in these cases,MC4 is larger than the estimated
marginal revenue. Comparisons of marginal revenue to the actual-payment-based marginal
cost is consistent with predatory marketing.
We do not have the data on Intel�s actual payment to other �rms and thus cannot compute
MC1 and MC2 for �rms other than Dell. Although, we can compute MC3 and MC4 if we
assume �xed rebate rates. The anticompetitive charges were mainly about Intel�s payment
to Dell, but other PC �rms such as HP and Toshiba were also involved in the case. Tables
12 and 13 present the TAP results for HP and Toshiba, respectively. Both the marginal
revenue and marginal cost measures tend to be lower in the cases of HP and Toshiba than
in the case of Dell. Our TAP results show evidence of predation with Toshiba in 2003 and
2004. During this period the TAP results are positive for both measures of marginal cost.
39

Time Est. MC3 MC4 MC3 MC4
2002Q1 0.02 ( 0.32 0.28 ) 0.11 0.052002Q2 1.04 ( 0.89 1.19 ) 0.27 0.132002Q3 1.20 ( 1.01 1.38 ) 0.27 0.132002Q4 5.68 ( 9.93 1.43 ) 0.12 0.06 positive positive
2003Q1 0.42 ( 1.30 0.46 ) 0.09 0.052003Q2 0.15 ( 0.34 0.64 ) 0.11 0.052003Q3 0.36 ( 0.25 0.97 ) 0.17 0.092003Q4 0.59 ( 0.45 1.64 ) 0.30 0.15
2004Q1 0.07 ( 0.80 0.66 ) 0.14 0.072004Q2 0.32 ( 0.01 0.66 ) 0.13 0.072004Q3 0.59 ( 0.31 0.87 ) 0.20 0.102004Q4 0.37 ( 0.04 0.77 ) 0.17 0.09
2005Q1 2.47 ( 0.80 4.15 ) 0.17 0.082005Q2 4.90 ( 4.12 5.68 ) 0.33 0.172005Q3 6.91 ( 5.90 7.92 ) 0.57 0.292005Q4 6.31 ( 5.18 7.43 ) 0.41 0.21
Unit: $ (inflation adjusted base: 2000)
TAP Result
95% conf. Interval
Computed Marginal Revenue Observed Marginal Cost
Table 12. TAP Results for HP
40

Time Est. MC3 MC4 MC3 MC4
2002Q1 0.13 0.11 0.15 0.14 0.072002Q2 0.25 0.22 0.29 0.09 0.042002Q3 0.66 0.56 0.75 0.16 0.082002Q4 0.62 0.52 0.71 0.42 0.21
2003Q1 0.34 0.28 0.40 1.37 0.68 positive positive
2003Q2 0.21 0.18 0.25 0.82 0.41 positive positive
2003Q3 0.31 0.26 0.36 1.47 0.74 positive positive
2003Q4 0.44 0.37 0.51 1.45 0.72 positive positive
2004Q1 0.34 0.28 0.40 0.99 0.50 positive positive
2004Q2 0.35 0.30 0.41 0.99 0.50 positive positive
2004Q3 0.43 0.36 0.49 0.49 0.24 positive
2004Q4 0.98 0.83 1.14 0.30 0.15
2005Q1 1.94 1.63 2.25 0.34 0.172005Q2 1.97 1.66 2.29 0.46 0.232005Q3 2.92 2.44 3.40 0.72 0.362005Q4 2.95 2.48 3.43 0.49 0.25
Unit: $ (inflation adjusted base: 2000)
Computed Marginal Revenue Observed Marginal Cost
95% conf. Interval
TAP Result
Table 13. TAP Results for Toshiba
We are also interested in what TAP would show with other PC �rms not involved in the
case. Since most PC �rms not investigated for the case are small, we consider only Gateway,
which has a signi�cant market share but is not involved in the case. Table 14 presents the
TAP results. We can see that marginal cost measures tend to either fall in the 95 percent
con�dence interval of marginal revenue or just below the interval. The result provides a nice
contrast to the test result for Dell as we do not �nd excessive advertising for Gateway for
both measures of marginal costs in any period. This result also supports the idea that the
Intel�s marketing program, if conducted as described, is driven by pro�t maximization rather
than anticompetitive purposes for the case of Gateway. Overall, the �ndings with other PC
�rms seem to suggest that our model, despite its simplicity, represents demand reasonably
well and captures the important features of the marketing program.
41

Time Est. MC3 MC4 MC3 MC4
2002Q1 0.56 0.37 0.76 0.14 0.072002Q2 0.38 0.28 0.49 0.10 0.052002Q3 0.47 0.38 0.55 0.16 0.082002Q4 0.78 0.66 0.89 0.26 0.13
2003Q1 0.87 0.74 1.00 0.25 0.122003Q2 0.47 0.40 0.54 0.20 0.102003Q3 0.50 0.43 0.57 0.17 0.082003Q4 0.55 0.47 0.64 0.15 0.07
2004Q1 0.66 0.56 0.76 0.78 0.392004Q2 0.40 0.34 0.47 0.50 0.252004Q3 0.52 0.43 0.60 0.37 0.182004Q4 1.15 0.96 1.34 2.66 1.33 positive
2005Q1 4.50 3.75 5.25 6.37 3.18 positive
2005Q2 3.58 2.98 4.17 2.64 1.322005Q3 4.70 3.92 5.48 4.21 2.112005Q4 5.69 4.78 6.61 1.79 0.90
Unit: $ (inflation adjusted base: 2000)
95% conf. Interval
TAP ResultComputed Marginal Revenue Observed Marginal Cost
Table 14. TAP Results for Gateway
7.1 Robustness Checks and Speci�cation Tests
In this section, we conduct robustness checks of the model as it relates to brand-loyalty build-
ing of advertising, cost pass-through, and model speci�cation to insure the objective function
did not converge to a local minimum (Knittle and Metaxoglou, 2008). To be completed...
8 Policy Implications
Price and quantity are not the only strategic variables that can be used for anticompetitive
purposes. Advertising is another important strategic variable commonly employed by �rms.
However, antitrust authorities typically try to establish anticompetitiveness through pricing,
but do not address the strategic use of advertising and, more generally, marketing campaigns.
While the heart of the anticompetitive actions of Intel was their Intel-Inside marketing
program, considerations of advertising/marketing predation where not at the forefront of
the antitrust case. In this paper we focus on non-price anticompetitive behavior arising
42

from marketing/advertising with a focus on the Intel case.
We provide a general Test of Advertising Predation (TAP) based on the presumption
that, if a �rm�s marketing campaign is not predatory, marketing expenses should be pro�t
maximizing and so should result in su¢ cient increased product demand to justify costs. To
construct TAP, �rst we model consumer�s demand for PCs from which we infer demand
for CPU processors. Speci�cally, we estimate a random-coe¢ cient model of demand for a
PC-CPU, where the coe¢ cients on PC and CPU characteristics and advertising vary with
demographics.46 Second, we compute Intel�s marginal revenue from the marketing subsidy
using the demand side estimates. That is, we compute the marginal revenue of advertising
dollars spent on Intel chips at the �rm or product level.47 The marginal revenue of the
marketing program depends on the parameters of consumer utility (including advertising),
CPU price and marginal manufacturing cost.
Test results suggest short-term pro�t sacri�ce by Intel, supporting the predatory use
of the Intel Inside campaign. To rationalize the short-term pro�t sacri�ce, there should
be something Intel can gain from the marketing program other than increasing CPU sales
by boosting the willingness-to-pay for a PC. Antitrust authorities found evidence that
the marketing subsidy is paid on anticompetitive condition that limits the use of AMD
processors. This condition aimed at driving AMD out of a market and the prospect of future
pro�t as a monopolist as a result would have rationalized the short-term pro�t sacri�ce.
Our method can be used to guide antitrust authorities in future cases as it provides a
general framework for testing for anticompetitive use of marketing campaigns. Computing
the test requires little extra estimation over the typical demand estimation usually under-
taken by antitrust authorities. Furthermore, the advertising data necessary to estimate
46 In previous literature that estimates CPU demand, it is generally assumed that �nal consumers directlypurchase the CPU. We think it is more realistic to model consumers�choice of a CPU-PC combination. Inaddition, since we are interested in the e¤ect of PC advertising on CPU demand, and PC advertising doesnot directly a¤ect CPU demand, we model a consumer�s discrete choice over CPU-PC combinations.
47 We do not model strategic decisions of PC �rms and Intel. This makes the test we develop morestringent. Rather, PC �rms� CPU choices are assumed to simply re�ect consumers� demand, and nota¤ected by the marketing campaign. Intel was accused of giving refunds to PC �rms in the Intel Insidemarketing program on the exclusionary condition that they limit the use of AMD chips. This implies themarketing program would a¤ect PC �rms�CPU choice and, hence, its anticompetitiveness would be evenlarger.
43

the model parameters is usually not so di¢ cult to obtain. Thus TAP is practical and easy
to implement. Applying to the Intel case, this paper shows that our test can be used to
show the predatory use of advertising/marketing. In addition, the bene�t of looking at the
advertising side is that, unlike predatory pricing which accompanies low price in the short
term, predatory advertising/marketing does not have a clear bene�t for consumers, even in
the short term. In the long run, predatory marketing can be harmful if it has a long-lasting
e¤ect by establishing goodwill, which may become an endogenous entry barrier for potential
competitors.
44

References
Angel, J (2002) �Retreat and Persist,�Technology Marketing.
Areeda, P. and Turner, D.F. (1975) �Predatory Pricing and Related Issues UnderSection 2 of the Sherman Act, Harvard Law Review,�88, 697-733.
Baker, J.B. 1994. Predatory pricing after Brooke Group: an economic perspective.Antitrust Law Journal 64, 585�604.
Bagwell, Kyle (2007) �The Economic Analysis of Advertising,�Handbook of IndustrialOrganization, Elsevier, edition 1, volume 3, number 1. Mark Armstrong & RobertPorter (eds)
Baumol W. J. (1996) �Predation and the Logic of the Average Variable Cost Test,�Journal of Law and Economics, 39, 49-72.
Berry, S., J. Levinsohn, A. Pakes. (1995) �Automobile prices in market equilibrium,�Econometrica 63(4), 841�890.
Besanko, D., U. Doraszelskiz, and K.Yaroslav (2010) �The Economics of Predation:What Drives Pricing When There is Learning-by-Doing?,�Unpublished Manuscript
Bolton, P., J. Broadley, and M. Riordan (2000) �Predatory Policy: Strategic Theoryand Legal Policy,��Georgetown Law Review, 88, 2239-2330.
Bolton, P., J. Broadley, and M. Riordan (2001) �Predatory Pricing: Response toCritique and further elaboration,�Georgetown Law Journal, 89, 2496-2529.
Bolton, P., and D. Scharfstein (1990) �A theory of predation based on agency problemsin �nancial contracting�, American Economic Review, 80, 93-107.
Bork, R. H.(1978) The Antitrust Paradox, New York: Free Press
Bureau of Labor Statistics, All Urban Consumers CPI-U, U.S. city average(ftp://ftp.bls.gov/pub/special.requests/cpi/cpiai.txt).
Cabral, L. and M. H. Riordan (1997) �The Learning Curve, Predation, Antitrust, andWelfare,�The Journal of Industrial Economics, 2, 155-169.
Chen, Y. and W. Tan (2007) �Predatory Advertising: Theory and Evidence in thePharmaceutical Industry,�Working Paper
Dube, J. P., J. T. Fox, and C.-L. Su (forthcoming) �Improving the Numerical Per-formance of BLP Static and Dynamic Discrete Choice Random Coe¤cients DemandEstimation,�Econometrica

Easterbrook, F.H. 1981. Predatory strategies and counterstrategies. University ofChicago Law Review 48, 263�337.
Easterbrook, F.H. 1984. The limits of antitrust. Texas Law Review 63, 1�40.
Edlin, E. (2012), Research Handbook on the Economics of Antitrust Law, chapter onpredatory pricing, Einer Elhauge editor, Edward Elgar Publishing Massachuseets USA.
Eizenberg A. (2011) �Upstream Innovation and Product Variety in the United StatesHome PC Market,�Working Paper
Ellison, G. and S. F. Ellison (2011) �Strategic Entry Deterrence and the Behaviour ofPharmaceutical Incumbents Prior to Patent Expiration,�American Economic Journal:Microeconomics, 3(1), 1-36.
Elzinga, K.G. and Mills, D.E. 1994. Trumping the Areeda�Turner test the recoupmentstandard in Brooke Group. Antitrust Law Journal 62, 559�84.
Elzinga, K.G and Mills, D.E. 2001. Predatory pricing and strategic theory. GeorgetownLaw Journal 89, 2475�93.
Genesove, D. and W. P. Mullin (2006) �Predation and Its Rate of Return: The SugarIndustry, 1887-1914,�Rand Journal of Economics,
Goettler, R. and B. R. Gordon (2009) �Competition and innovation in the microproces-sor industry: Does AMD spur Intel to innovate more?�Working paper, ColumbiaUniversity, New York
Gowrisankaran, G. and M. Rysman. (2007) �Dynamics of consumer demand for newdurable consumer goods,�Working paper, Boston University, Boston
Gordon, B. (2009). �A Dynamic Model of Consumer Replacement Cycles in the PCProcessor Industry,�Unpublished Working Paper, Columbia Business School.
Granitz, E. and Klein, B. 1996. Monopolization by �raising rivals�costs�: the standardoil case. Journal of Law and Economics 39, 1�47.
In-Stat (2005) �Intel Manufacturing Capacity and Die Cost�
In-Stat (2005) �Intel Rosetta Stone: Intel Processor Shipments, Forecasts, Technology,and Roadmaps�
Joskow, P. and A. K. Klevorick (1978) �A Framework for Analyzing Predatory PricingPolicy,�89 Yale Law Journal, 213, 219-220.
Moon, Y. E. and Darwall, C. (2005) �Inside Intel Inside,�Harvard Business SchoolCase 502-083
46

Petrin, A. (2002) �Quantifying the Bene�ts of New Products: The Case of the Mini-van,�Journal of Political Economy, 110(4), 705-729.
Prince, J. T. (2008), �Repeat Purchase Amid Rapid Quality Improvement: StructuralEstimation of Demand for Personal Computers,�Journal of Economics and Manage-ment Strategy 17(1), 1�33.
Salgado, H. (2008a) �Dynamic Firms Conduct and Market Power: The ComputerProcessors Industry under Learning-by-Doing,�Working Paper, University of Califor-nia at Berkeley
Salgado, H. (2008b) �Brand Loyalty, Advertising and Demand for Personal ComputerProcessors: The Intel Inside E¤ect,�Working Paper, University of California at Berke-ley
Slade, M. E. (2005) �Product Rivalry with Multiple Strategic Weapons: An Analysisof Price and Advertising Competition,�Working Paper.
Snider, C. (2009) "Predatory Incentives and Predation Policy: The American AirlinesCase", Working Paper
Song, M. (2007) �Measuring Consumer Welfare in the CPU Market: An Application ofthe Pure Characteristics Demand Model,�RAND Journal of Economics, 38, 429-446.
Sovinsky Goeree, Michelle (2008) �Limited Information and Advertising in the USPersonal Computer Industry,�Econometrica, 1017-1074.
Thornhill, T. Lee C., and R. Shannon (2001) �Intel Corporation,�UBS Warburg GlobalEquity Research Report.
Rojas, C. and E. Peterson (2008) �Demand for Di¤erentiated Products: Price andAdvertising Evidence from the U.S. Beer Market,�International Journal of IndustrialOrganization, 26, 288-307.
Ying, F. (2010) �Ownership Consolidation and Product Quality: A Study of the U.S.Daily Newspaper Market,�Working Paper.
Weiman, D. and Levin, R. 1994. Preying for monopoly? The case of Southern BellTelephone Company, 1894�1912. Journal of Political Economy 102, 103�26.
Whinston, M. D. (2006) Lectures on Antitrust Economics, The MIT Press, Cambridge,Massachusetts
47
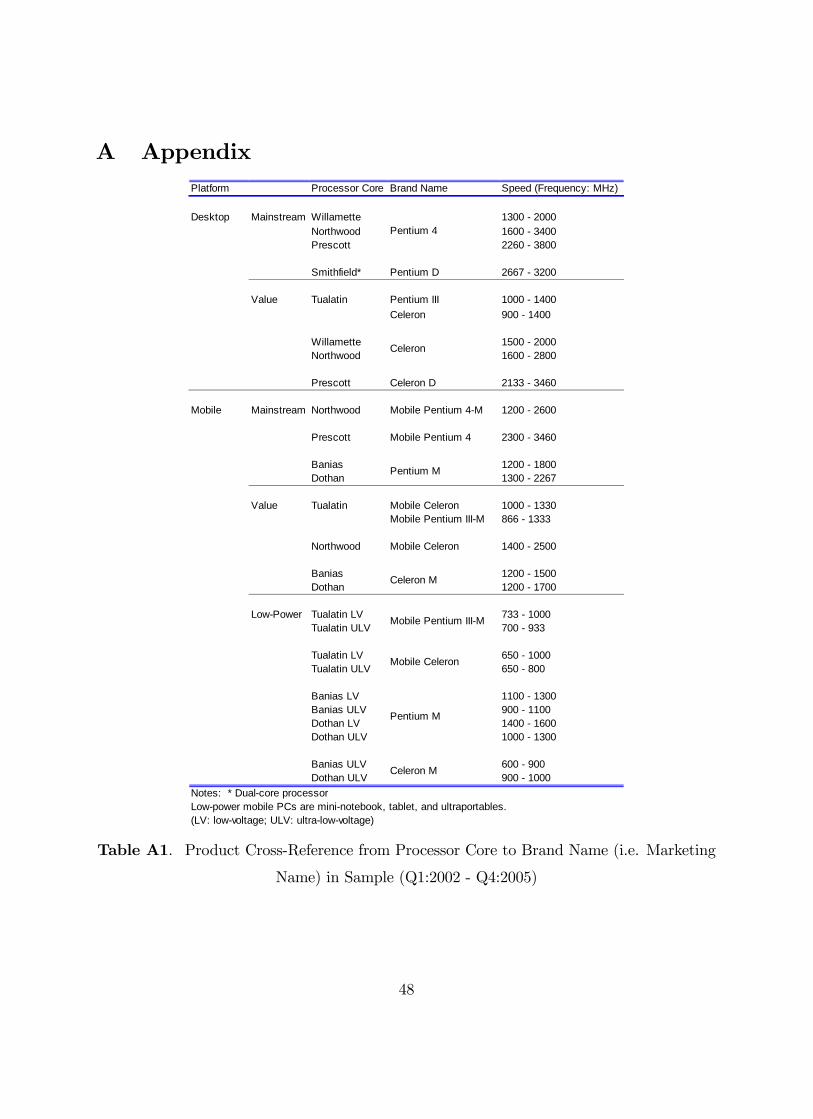
A AppendixPlatform Processor Core Brand Name Speed (Frequency: MHz)
Desktop Mainstream Willamette 1300 2000Northwood 1600 3400Prescott 2260 3800
Smithfield* Pentium D 2667 3200
Value Tualatin Pentium III 1000 1400Celeron 900 1400
Willamette 1500 2000Northwood 1600 2800
Prescott Celeron D 2133 3460
Mobile Mainstream Northwood Mobile Pentium 4M 1200 2600
Prescott Mobile Pentium 4 2300 3460
Banias 1200 1800Dothan 1300 2267
Value Tualatin Mobile Celeron 1000 1330Mobile Pentium IIIM 866 1333
Northwood Mobile Celeron 1400 2500
Banias 1200 1500Dothan 1200 1700
LowPower Tualatin LV 733 1000Tualatin ULV 700 933
Tualatin LV 650 1000Tualatin ULV 650 800
Banias LV 1100 1300Banias ULV 900 1100Dothan LV 1400 1600Dothan ULV 1000 1300
Banias ULV 600 900Dothan ULV 900 1000
Notes: * Dualcore processorLowpower mobile PCs are mininotebook, tablet, and ultraportables.(LV: lowvoltage; ULV: ultralowvoltage)
Celeron M
Mobile Pentium IIIM
Mobile Celeron
Pentium 4
Celeron
Pentium M
Celeron M
Pentium M
Table A1. Product Cross-Reference from Processor Core to Brand Name (i.e. Marketing
Name) in Sample (Q1:2002 - Q4:2005)
48