Embed Size (px)
Citation preview
AMERICAN JOURNAL OF INDUSTRIAL MEDICINE 40:263±270 (2001)
Is Testicular Cancer an OccupationalDisease of Fire Fighters?
Michael N. Bates, PhD,1� Jackie Fawcett, MA,1 Nick Garrett, MSc,1
Richard Arnold, PhD,1 Neil Pearce, PhD,2 and Alistair Woodward, MB, ChB, PhD3
Background A previous investigation showed an increased risk of testicular canceramong ®re ®ghters in Wellington City, New Zealand, during the 1980s. Other studies of®re ®ghters had not identi®ed testicular cancer as an occupational disease.Methods This was an historical cohort study of mortality and cancer incidence in allpaid New Zealand ®re ®ghters, from 1977 to 1995.Results The only cancer for which this study provided evidence of an increased risk wastesticular cancer, even after excluding cases from the previous investigation. Thestandardized incidence ratio for 1990±96 was 3.0 (95% con®dence interval: 1.3±5.90).There was no evidence that ®re ®ghters were at increased risk from any particular causeof death.Conclusions This study con®rmed that New Zealand ®re ®ghters are at increased risk oftesticular cancer, although the reason is unknown. Other incidence studies of cancer in®re ®ghters are needed to con®rm this ®nding. Am. J. Ind. Med. 40:263±270, 2001.ß 2001 Wiley-Liss, Inc
KEY WORDS: cancer; testicular cancer; cohort study; ®re ®ghters; mortality;epidemiology; New Zealand
INTRODUCTION
Increased cancer or mortality risks for ®re ®ghters are
of concern because of the carcinogens in smoke to which
®re ®ghters may be exposed. A cluster of testicular cancer
cases occurred in ®re ®ghters in the city of Wellington in the
1980s. The cluster was identi®ed when the Wellington ®re
®ghters were used as a referent group in another study
[Bandaranayake et al., 1993]. A more detailed investigation
of the Wellington cluster con®rmed an increased risk of
testicular cancer between 1980 and 1991 (relative risk
[RR]� 8.2, 95% con®dence interval [CI]: 2.2±21.0, based
on four cases) [Bates and Lane, 1995]. No obvious
explanation was found, and it was not possible to rule out
the possibility that the risk was more widespread or
continuing.
An earlier cancer registry-based case-control study of
occupational associations with testicular cancer, during the
period 1958±79, had found no evidence of an increased risk
for New Zealand ®re ®ghters [Pearce et al., 1987]. However,
as all the cases in the Wellington investigation were
diagnosed after 1983, it is possible that work-related risk
factors for testicular cancer may not have been apparent
before that year. There have been a number of studies of
health risks in ®re ®ghters, particularly for cancer, both in
New Zealand and elsewhere. The outcomes of most of these
studies have been well summarized in three recent reviews
[Howe and Burch, 1990; Golden et al., 1995; Guidotti,
1995]. Although study results have been far from consistent,
ß 2001Wiley-Liss, Inc.
1Institute of Environmental Science and Research Ltd., Kenepuru Science Centre, PO Box50-348, Porirua, NewZealand
2Centre for Public Health Research, Massey University Wellington Campus, Private Box756,Wellington, NewZealand
3Department of Public Health, Wellington School of Medicine, PO Box 7343, WellingtonSouth, NewZealand
This work was performed at the Institute of Environmental Science and Research.Neil Pearce is supported by a Fellowship from the Health Research Council of
NewZealand.Contract grant sponsor: NewZealand Fire Service.*Correspondence to:Michael N.Bates, School of Public Health,140WarrenHall, University
of California, Berkeley, CA 94720-7360. E-mail: m [email protected]
Accepted 23May 2001
some evidence exists for elevated risks from cancers of the
lung, brain, colon, rectum, the genitourinary tract, and
lymphatic and haematopoietic systems, as well as mela-
noma. None of the reviews suggested that testicular cancer
was associated with ®re ®ghting.
The objectives of this study, which had an historical
cohort design, were: (1) speci®cally to determine whether
there is an elevated risk for testicular cancer in New Zealand
®re ®ghters overall and (2) generally, to determine whether
there was evidence of other cancer or mortality risks for
New Zealand ®re ®ghters.
MATERIALS AND METHODS
Identi®cation and De®nition of theCohort
Data were obtained from a registry of all paid and
volunteer ®re ®ghters maintained by the United Fire
Brigades Association of New Zealand (UFBA). The register
is maintained mainly for the purpose of con®rming eligi-
bility for length-of-service awards. For each ®re ®ghter, the
register contains full name, date of birth, sex, the ®re
brigades that each person belonged to, their joining and
retiring dates from each brigade, and whether they were paid
or volunteer ®re-®ghters. UFBA data available for this study
were current to mid 1995.
The study cohort was de®ned as every person in the
UFBA database who (1) had worked in New Zealand as a
paid ®re ®ghter for a total period of at least one year and (2)
also worked as a paid ®re ®ghter for at least one day during
the period 1 January 1977 to 30 June 1995, inclusive. The
beginning date was the earliest date at which computerised
cancer and mortality data were available through the New
Zealand Health Information Service (NZHIS).
Con®rmation of Vital Status
The list of cohort members (names, dates of birth, and
sex) was matched by the NZHIS with corresponding
information on the New Zealand national mortality index.
For cohort members not recorded by the NZHIS as having
died, a variety of methods were used to con®rm that they
were alive as close as possible to the ®nal date(s) of follow-
upÐDecember 31, 1995 for the mortality analysis and
December 31, 1996 for the cancer analysis. These were the
®nal dates for which national mortality and cancer
registration data were complete at time of analysis.
Sources of information and methods used to con®rm
cohort members as alive and living in New Zealand were:
(1) period of service with the Fire Service (from the UFBA
database), (2) the last recorded date of contact with the New
Zealand public health system, for whatever reason, (3)
matching with Work and Income New Zealand (WINZ)
records of pension and bene®t payments, (4) matching with
New Zealand Defence Force personnel records (some ®re
®ghters were employed in the New Zealand Defence Force
as ®re ®ghters), (5) matching with electronic electoral rolls
for 1997 and 1999, and (6) printed electoral rolls.
Rates for Calculation of ExpectedNumbers
Statistics for the total population of New Zealand, by
age and sex, were obtained from Statistics New Zealand for
the census years between 1971 and 1996 (every ®ve years).
Age- and sex-speci®c inter-censal populations were esti-
mated by straight-line interpolation.
Anonymized data for incident cancer cases and deaths
were obtained from the NZHIS. For deaths these covered the
period from 1977 to 1995 inclusive, and for cancers from
1977 to 1996. Data were coded according to the Australa-
sian Version of ICD-9-CM. Cancer and cause of death rates
were calculated for strata designated by 5-year calendar
period, 5-year age-bands, and separately by sex. These rates
were used in the calculation of the expected numbers of
cases.
Calculation of SIRs and SMRs
Standardized mortality ratios (SMRs) and standardized
incidence ratios (SIRs) were obtained by dividing observed
by expected numbers. Ninety-®ve percent con®dence
intervals were calculated using standard methods [Breslow
and Day, 1987].
RESULTS
Follow-Up of the Cohort
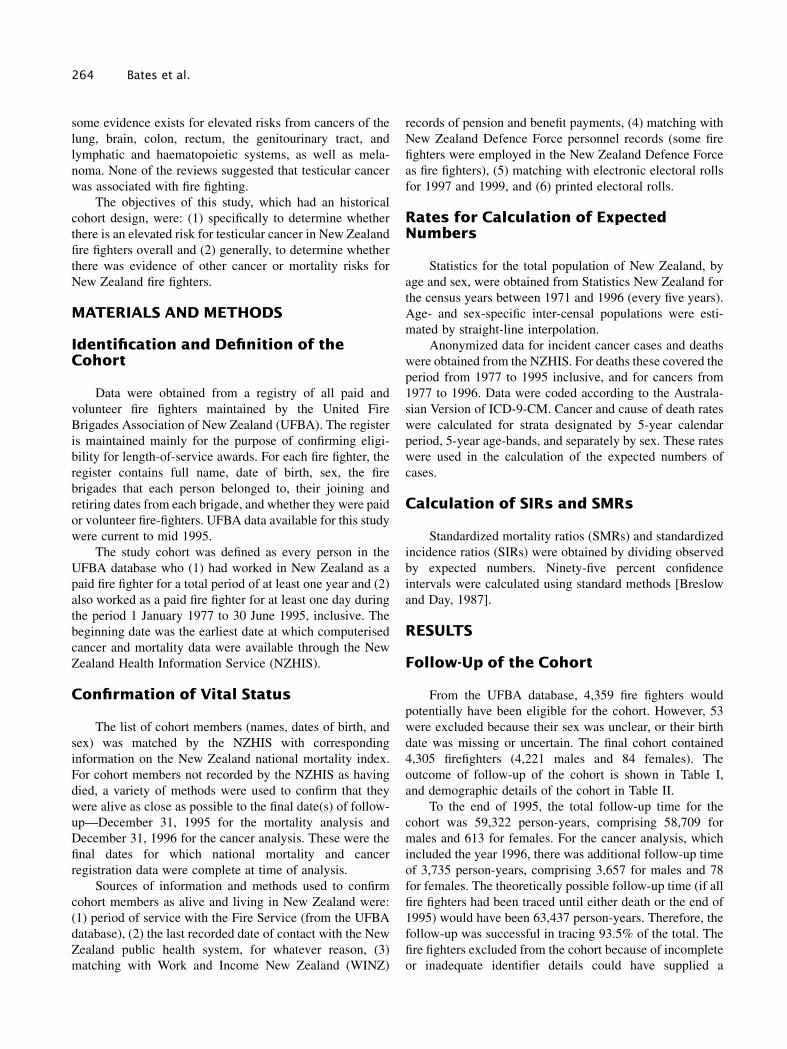
From the UFBA database, 4,359 ®re ®ghters would
potentially have been eligible for the cohort. However, 53
were excluded because their sex was unclear, or their birth
date was missing or uncertain. The ®nal cohort contained
4,305 ®re®ghters (4,221 males and 84 females). The
outcome of follow-up of the cohort is shown in Table I,
and demographic details of the cohort in Table II.
To the end of 1995, the total follow-up time for the
cohort was 59,322 person-years, comprising 58,709 for
males and 613 for females. For the cancer analysis, which
included the year 1996, there was additional follow-up time
of 3,735 person-years, comprising 3,657 for males and 78
for females. The theoretically possible follow-up time (if all
®re ®ghters had been traced until either death or the end of
1995) would have been 63,437 person-years. Therefore, the
follow-up was successful in tracing 93.5% of the total. The
®re ®ghters excluded from the cohort because of incomplete
or inadequate identi®er details could have supplied a
264 Bates et al.
maximum (assuming no deaths) of 687 person-years of
follow-up.
There was a total for the cohort of 67,503 person-years
of service as either a paid or volunteer ®re ®ghter, of which
67,039 years were by males. Eighty-four percent of the
years of service by the cohort were as full-time ®re ®ghters.
Twenty-eight percent of these years occurred before the
beginning of 1977 (the beginning date of follow-up for the
cohort).
Cancer Incidence
Because of the small number of females in the cohort,
computation of SIRs was limited to male ®re ®ghters.
However, three cancers, all at different sites, had been
recorded as occurring in female ®re ®ghters.
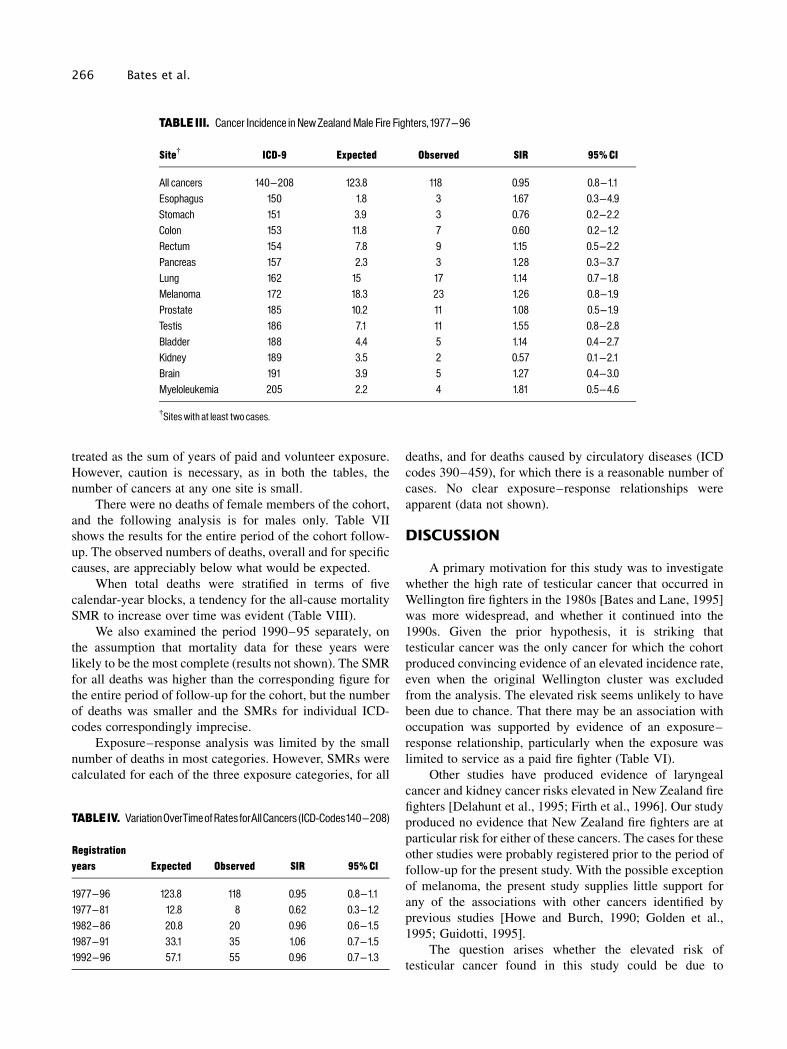
Results for 1977±96 (Table III) show that cancer rates
overall, and at most individual sites, are close to what would
be expected. Eleven testicular cancers occurred in the
cohort, but 7.1 were expected. Although they were part of
the cohort, two of the four ®re ®ghters with testicular cancer
that comprised the cluster occurring in Wellington in the
1980s [Bates and Lane, 1995] were not recorded in the
Cancer Registry, and do not appear in Table III.
The variation in the overall cancer rates across the time
period of follow-up was also investigated. Results of this
analysis are shown in Table IV. This shows that the SIR has
generally remained at around 1.0.
A concern about matching with the NZHIS databases
on mortality and cancer is the possibility of incomplete
registrations. However, our experience is that the NZHIS
databases are most complete from about 1990. Therefore,
we carried out an analysis of cancer rates in the cohort,
limited to cancers occurring in the years 1990±96. Results
of this analysis are shown in Table V. This analysis is also
important in that it excludes the testicular cases in the
original cluster that generated the key hypothesis that this
study was intended to investigate. In so doing, it examines
whether the high testicular cancer rate in Wellington ®re
®ghters during the 1980s was part of a phenomenon that
continued into the 1990s.
For the 1990±96 period, the observed numbers of
cancers for most sites were close to the expected. The ex-
ception was testicular cancer, which had a three-fold elevat-
ed rate. Of the eight testicular cancer cases diagnosed in the
1990±96 period, three had worked in the Wellington area.
For the exposure analysis the cohort was strati®ed
according to the number of years of work as a paid ®re
®ghter, or as either a paid or a volunteer ®re ®ghter. SIRs
were calculated for each of three exposure categories, for all
cancers and for individual cancer sites with reasonable
numbers of observed cases. Results are shown in Table VI.
The period to which this analysis applies ends at 30 June
1995, as that is the ®nal date for which Fire Service
employment information was regarded as complete.
The results for paid ®re ®ghters only show an
exposure±response relationship for testicular cancer
(although the trend test was not statistically signi®cant),
and some evidence for such relationships for lung and rectal
cancers. Such relationships are less clear when exposure is
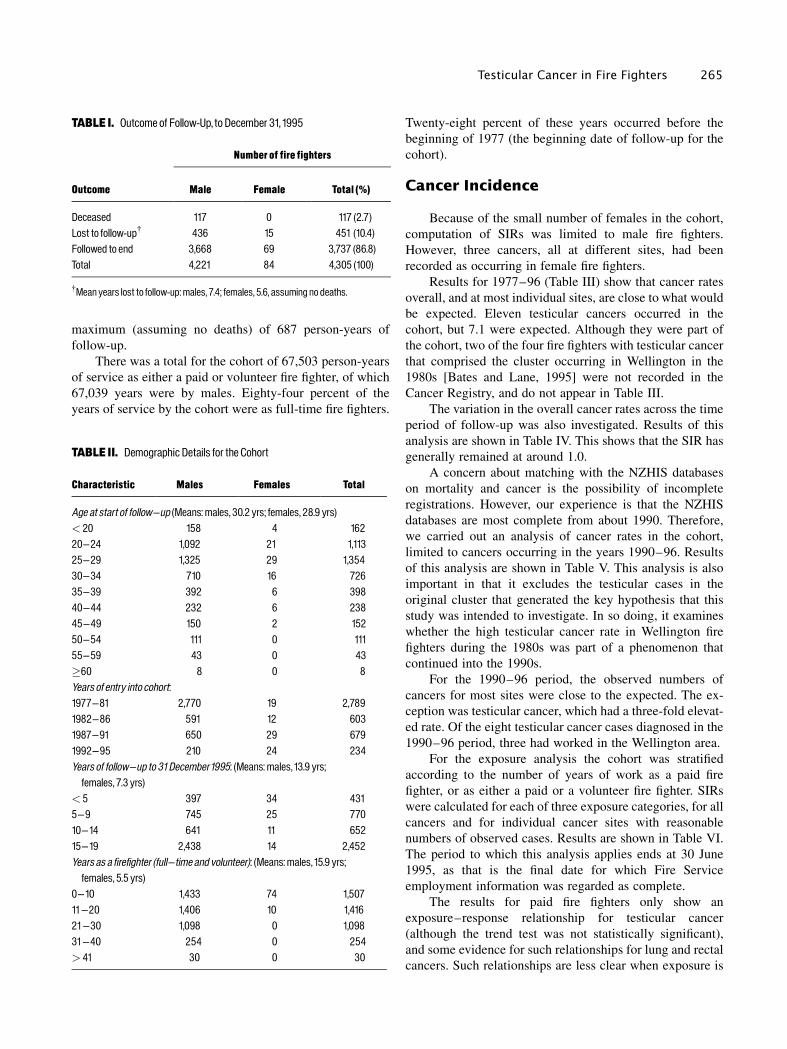
TABLE I. Outcome of Follow-Up, to December 31,1995
Outcome
Number of fire fighters
Male Female Total (%)
Deceased 117 0 117 (2.7)Lost to follow-up{ 436 15 451 (10.4)Followed to end 3,668 69 3,737 (86.8)Total 4,221 84 4,305 (100)
{Mean years lost to follow-up:males, 7.4; females, 5.6, assuming no deaths.
TABLE II. Demographic Details for the Cohort
Characteristic Males Females Total
Age at start of follow^up (Means: males, 30.2 yrs; females, 28.9 yrs)< 20 158 4 16220^24 1,092 21 1,11325^29 1,325 29 1,35430^34 710 16 72635^39 392 6 39840^44 232 6 23845^49 150 2 15250^54 111 0 11155^59 43 0 43�60 8 0 8Years of entry into cohort:1977^81 2,770 19 2,7891982^86 591 12 6031987^91 650 29 6791992^95 210 24 234Years of follow^up to 31December1995: (Means: males,13.9 yrs;females, 7.3 yrs)
< 5 397 34 4315^9 745 25 77010^14 641 11 65215^19 2,438 14 2,452Years as a firefighter (full^time and volunteer): (Means: males,15.9 yrs;females, 5.5 yrs)
0^10 1,433 74 1,50711^20 1,406 10 1,41621^30 1,098 0 1,09831^40 254 0 254> 41 30 0 30
Testicular Cancer in Fire Fighters 265
treated as the sum of years of paid and volunteer exposure.
However, caution is necessary, as in both the tables, the
number of cancers at any one site is small.
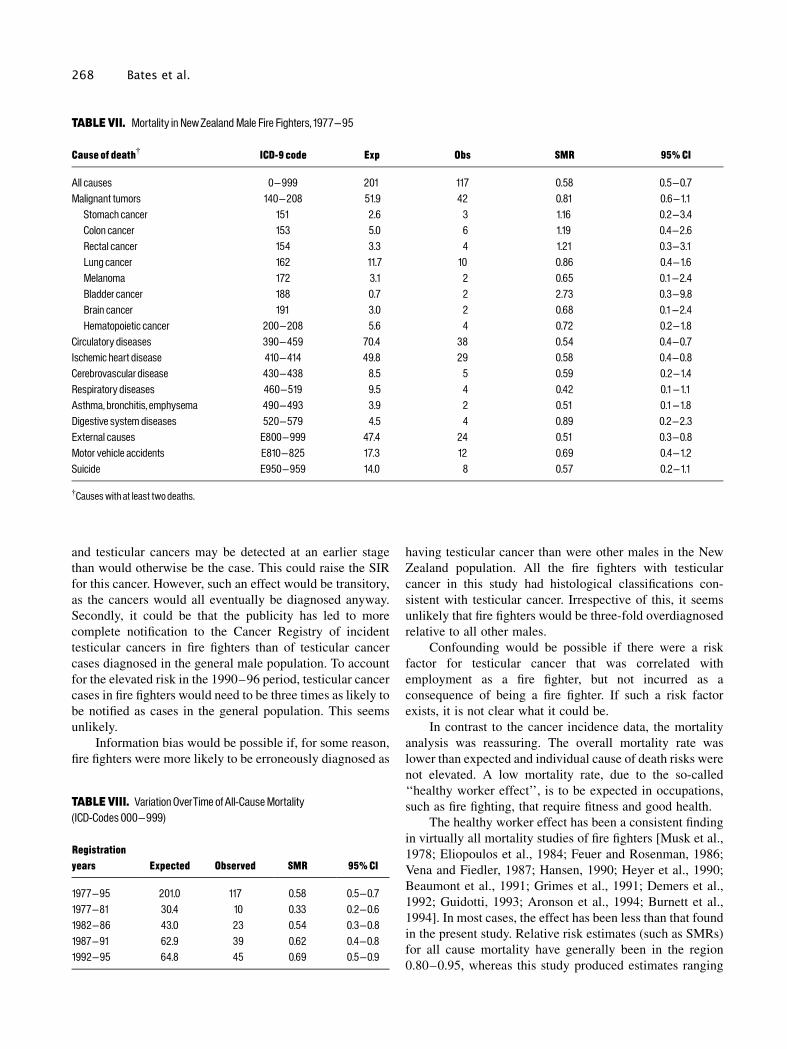
There were no deaths of female members of the cohort,
and the following analysis is for males only. Table VII
shows the results for the entire period of the cohort follow-
up. The observed numbers of deaths, overall and for speci®c
causes, are appreciably below what would be expected.
When total deaths were strati®ed in terms of ®ve
calendar-year blocks, a tendency for the all-cause mortality
SMR to increase over time was evident (Table VIII).
We also examined the period 1990±95 separately, on
the assumption that mortality data for these years were
likely to be the most complete (results not shown). The SMR
for all deaths was higher than the corresponding ®gure for
the entire period of follow-up for the cohort, but the number
of deaths was smaller and the SMRs for individual ICD-
codes correspondingly imprecise.
Exposure±response analysis was limited by the small
number of deaths in most categories. However, SMRs were
calculated for each of the three exposure categories, for all
deaths, and for deaths caused by circulatory diseases (ICD
codes 390±459), for which there is a reasonable number of
cases. No clear exposure±response relationships were
apparent (data not shown).
DISCUSSION
A primary motivation for this study was to investigate
whether the high rate of testicular cancer that occurred in
Wellington ®re ®ghters in the 1980s [Bates and Lane, 1995]
was more widespread, and whether it continued into the
1990s. Given the prior hypothesis, it is striking that
testicular cancer was the only cancer for which the cohort
produced convincing evidence of an elevated incidence rate,
even when the original Wellington cluster was excluded
from the analysis. The elevated risk seems unlikely to have
been due to chance. That there may be an association with
occupation was supported by evidence of an exposure±
response relationship, particularly when the exposure was
limited to service as a paid ®re ®ghter (Table VI).
Other studies have produced evidence of laryngeal
cancer and kidney cancer risks elevated in New Zealand ®re
®ghters [Delahunt et al., 1995; Firth et al., 1996]. Our study
produced no evidence that New Zealand ®re ®ghters are at
particular risk for either of these cancers. The cases for these
other studies were probably registered prior to the period of
follow-up for the present study. With the possible exception
of melanoma, the present study supplies little support for
any of the associations with other cancers identi®ed by
previous studies [Howe and Burch, 1990; Golden et al.,
1995; Guidotti, 1995].
The question arises whether the elevated risk of
testicular cancer found in this study could be due to
TABLE III. Cancer Incidence in NewZealandMale Fire Fighters,1977^96
Site{ ICD-9 Expected Observed SIR 95%CI
All cancers 140^208 123.8 118 0.95 0.8^1.1Esophagus 150 1.8 3 1.67 0.3^4.9Stomach 151 3.9 3 0.76 0.2^2.2Colon 153 11.8 7 0.60 0.2^1.2Rectum 154 7.8 9 1.15 0.5^2.2Pancreas 157 2.3 3 1.28 0.3^3.7Lung 162 15 17 1.14 0.7^1.8Melanoma 172 18.3 23 1.26 0.8^1.9Prostate 185 10.2 11 1.08 0.5^1.9Testis 186 7.1 11 1.55 0.8^2.8Bladder 188 4.4 5 1.14 0.4^2.7Kidney 189 3.5 2 0.57 0.1^2.1Brain 191 3.9 5 1.27 0.4^3.0Myeloleukemia 205 2.2 4 1.81 0.5^4.6
{Siteswith at least two cases.
TABLEIV. VariationOverTimeofRatesforAllCancers (ICD-Codes140^208)
Registrationyears Expected Observed SIR 95%CI
1977^96 123.8 118 0.95 0.8^1.11977^81 12.8 8 0.62 0.3^1.21982^86 20.8 20 0.96 0.6^1.51987^91 33.1 35 1.06 0.7^1.51992^96 57.1 55 0.96 0.7^1.3
266 Bates et al.

selection bias, information bias, or confounding. Since the
cohort involved all paid New Zealand ®re ®ghters, and the
follow-up rate was good for cohorts of this type, it seems
improbable that we could, somehow, have selected ®re
®ghters more likely to be affected by testicular cancer.
However, other possibilities need to be considered. These
are related to the high level of awareness of testicular cancer
within the New Zealand Fire Service, engendered by the
previous testicular cancer cluster investigation. First, ®re
®ghters may be self-examining themselves more regularly
TABLE V. Cancer Incidence in NewZealandMale Fire Fighters,1990^96
Site{ ICD-9 Expected Observed SIR 95%CI
All cancers 140^208 71.2 72 1.01 0.8^1.3Esophagus 150 1.1 2 1.80 0.2^6.5Stomach 151 2.2 2 0.89 0.1^3.2Colon 153 6.9 4 0.58 0.2^1.5Rectum 154 4.6 5 1.08 0.3^2.5Pancreas 157 1.4 3 2.17 0.4^6.4Lung 162 8.6 7 0.82 0.3^1.7Melanoma 172 10.1 15 1.49 0.8^2.5Prostate 185 8.2 9 1.09 0.5^2.1Testis 186 2.7 8 2.97 1.3^5.9Bladder 188 2.7 2 0.74 0.1^2.7Brain 191 1.9 3 1.59 0.3^4.6
{Siteswith at least two cases.
TABLE VI. Cancer byYears of Service as a Fire Fighter (1Jan1977 to 30 June1995)
Cancer (ICD-9)Exposure
length (year)
Paid service only Paid and volunteer service
O/E{ SIR 95%CI P for trend O/E SIR 95%CI P for trend
All cancers (140^208) 0^10 28/27.2 1.03 0.7^1.5 0.68 14/15.1 0.93 0.5^1.6 0.6011^20 31/22.5 1.38 0.9^2.0 33/18.8 1.75 1.2^2.5>20 39/32.7 1.19 0.9^1.6 51/49.2 1.04 0.8^1.4
Colon (153) 0^10 1/2.4 0.41 0.0^2.3 0.18 1/1.2 0.82 0.0^4.6 0.8111^20 1/2.2 0.46 0.0^2.6 1/1.7 0.58 0.0^3.3>20 5/3.6 1.37 0.4^3.2 5/5.5 0.92 0.3^2.1
Rectum (154) 0^10 2/1.6 1.22 0.1^4.4 0.74 1/0.8 1.23 0.0^6.8 0.9711^20 2/1.5 1.38 0.2^5.0 2/1.1 1.75 0.2^6.3>20 4/2.5 1.61 0.4^4.1 5/3.7 1.35 0.4^3.1
Lung (162) 0^10 3/3.2 0.93 0.2^2.7 0.48 1/1.5 0.66 0.0^3.7 0.8511^20 4/2.8 1.45 0.4^3.7 4/2.0 2.04 0.6^5.2>20 8/5.2 1.52 0.7^3.0 10/8.0 1.25 0.6^2.3
Melanoma (172) 0^10 7/4.1 1.72 0.7^3.5 0.97 4/2.5 1.58 0.4^4.0 0.9311^20 6/3.4 1.75 0.6^3.8 6/3.3 1.83 0.7^4.0>20 6/3.6 1.67 0.6^3.6 9/5.3 1.70 0.8^3.2
Prostate (185) 0^10 3/2.1 1.46 0.3^4.3 0.12 1/0.9 1.09 0.0^6.1 0.2111^20 1/1.7 0.60 0.0^3.3 2/1.1 1.9 0.2^6.9>20 1/3.4 0.29 0.0^1.6 2/5.2 0.38 0.0^1.4
Testis (186) 0^10 3/1.9 1.55 0.3^4.5 0.21 2/1.4 1.39 0.2^5.0 0.4411^20 4/1.1 3.51 1.0^9.0 5/1.2 4.03 1.3^9.4>20 2/0.5 4.14 0.5^14.9 2/0.8 2.65 0.3^9.6
{O/E: observed/expectedmortality.
Testicular Cancer in Fire Fighters 267
and testicular cancers may be detected at an earlier stage
than would otherwise be the case. This could raise the SIR
for this cancer. However, such an effect would be transitory,
as the cancers would all eventually be diagnosed anyway.
Secondly, it could be that the publicity has led to more
complete noti®cation to the Cancer Registry of incident
testicular cancers in ®re ®ghters than of testicular cancer
cases diagnosed in the general male population. To account
for the elevated risk in the 1990±96 period, testicular cancer
cases in ®re ®ghters would need to be three times as likely to
be noti®ed as cases in the general population. This seems
unlikely.
Information bias would be possible if, for some reason,
®re ®ghters were more likely to be erroneously diagnosed as
having testicular cancer than were other males in the New
Zealand population. All the ®re ®ghters with testicular
cancer in this study had histological classi®cations con-
sistent with testicular cancer. Irrespective of this, it seems
unlikely that ®re ®ghters would be three-fold overdiagnosed
relative to all other males.
Confounding would be possible if there were a risk
factor for testicular cancer that was correlated with
employment as a ®re ®ghter, but not incurred as a
consequence of being a ®re ®ghter. If such a risk factor
exists, it is not clear what it could be.
In contrast to the cancer incidence data, the mortality
analysis was reassuring. The overall mortality rate was
lower than expected and individual cause of death risks were
not elevated. A low mortality rate, due to the so-called
`̀ healthy worker effect'', is to be expected in occupations,
such as ®re ®ghting, that require ®tness and good health.
The healthy worker effect has been a consistent ®nding
in virtually all mortality studies of ®re ®ghters [Musk et al.,
1978; Eliopoulos et al., 1984; Feuer and Rosenman, 1986;
Vena and Fiedler, 1987; Hansen, 1990; Heyer et al., 1990;
Beaumont et al., 1991; Grimes et al., 1991; Demers et al.,
1992; Guidotti, 1993; Aronson et al., 1994; Burnett et al.,
1994]. In most cases, the effect has been less than that found
in the present study. Relative risk estimates (such as SMRs)
for all cause mortality have generally been in the region
0.80±0.95, whereas this study produced estimates ranging
TABLE VII. Mortality in NewZealandMale Fire Fighters,1977^95
Cause of death{ ICD-9 code Exp Obs SMR 95%CI
All causes 0^999 201 117 0.58 0.5^0.7Malignant tumors 140^208 51.9 42 0.81 0.6^1.1Stomach cancer 151 2.6 3 1.16 0.2^3.4Colon cancer 153 5.0 6 1.19 0.4^2.6Rectal cancer 154 3.3 4 1.21 0.3^3.1Lung cancer 162 11.7 10 0.86 0.4^1.6Melanoma 172 3.1 2 0.65 0.1^2.4Bladder cancer 188 0.7 2 2.73 0.3^9.8Brain cancer 191 3.0 2 0.68 0.1^2.4Hematopoietic cancer 200^208 5.6 4 0.72 0.2^1.8
Circulatory diseases 390^459 70.4 38 0.54 0.4^0.7Ischemic heart disease 410^414 49.8 29 0.58 0.4^0.8Cerebrovascular disease 430^438 8.5 5 0.59 0.2^1.4Respiratory diseases 460^519 9.5 4 0.42 0.1^1.1Asthma, bronchitis, emphysema 490^493 3.9 2 0.51 0.1^1.8Digestive system diseases 520^579 4.5 4 0.89 0.2^2.3External causes E800^999 47.4 24 0.51 0.3^0.8Motor vehicle accidents E810^825 17.3 12 0.69 0.4^1.2Suicide E950^959 14.0 8 0.57 0.2^1.1
{Causeswith at least two deaths.
TABLE VIII. Variation OverTime ofAll-CauseMortality(ICD-Codes 000^999)
Registrationyears Expected Observed SMR 95%CI
1977^95 201.0 117 0.58 0.5^0.71977^81 30.4 10 0.33 0.2^0.61982^86 43.0 23 0.54 0.3^0.81987^91 62.9 39 0.62 0.4^0.81992^95 64.8 45 0.69 0.5^0.9
268 Bates et al.
from 0.33 to 0.69 (Table VIII). However, a recent study of
Paris ®re ®ghters obtained an SMR for all cause mortality of
0.52 (95% CI: 0.35±0.75) [Deschamps et al., 1995]. There
are at least two possible reasons why the mortality rate that
we measured might be low relative to most other studies.
Firstly, it may be that people applying to join the New
Zealand Fire Service have to meet more stringent health and
®tness entry criteria than is the case in other countries where
®re ®ghter mortality studies have been carried out (mainly
the United States, Canada, Australia, and Scandinavia).
Secondly, there is the possibility that errors in recording of
key identi®er data may be such that matching of our cohort
database with the mortality database may be incomplete.
This could occur if there are errors in the recording of names
and birth dates in either database, or in both. If so, some
deaths recorded by the NZHIS would contribute to the
calculation of the expected number of deaths, but not be
recognized as contributing to the observed number of
deaths. This would lead to underestimation of relative risks.
SMRs for consecutive ®ve-year periods steadily increase
(Table VIII). This could be due to the healthy worker effect
wearing off as the average age of the cohort increases, or it
could be due to a greater frequency of errors in the earlier
recorded data.
These two possibilities cannot be discounted. However,
a number of deaths were recorded in the UFBA ®re ®ghter
database, and others in the WINZ data as the reason why
payment of some bene®ts was terminated. Of 33 deaths
recorded in the UFBA database, NZHIS mortality data were
not found for four. It is possible that these four deaths
occurred overseas. WINZ advised us of 43 deaths, all of
which were found on the NZHIS mortality database. This
information suggests that identi®cation of deaths in the
cohort was fairly complete and the low SMR may have been
due to a strong healthy worker effect. Whatever the case, it
is probable that the ®re ®ghter cohort did not have a high
mortality rate. For the cohort to have had an actual mortality
rate that corresponded to the rate of the general male
population, there would need to have been an extra 84
deaths not detected by the follow-up. This seems unlikely.
The reason for the excess risk of testicular cancer
remain obscure. The possibility that it is a chance
occurrence cannot be totally discounted, but is unlikely.
There is no obvious explanation from bias or confounding in
the study, although such possibilities also cannot be
completely dismissed. The question arises as to why, if the
®nding of testicular cancer is a real occupational risk of ®re
®ghting, it has not been detected in studies elsewhere. A
possible reason is the type and timing of most of the other
studies of cancer in ®re ®ghters. Firstly, of the studies done
elsewhere, most have investigated mortality only [Musk
et al., 1978; Feuer and Rosenman, 1986; Vena and Fiedler,
1987; Hansen, 1990; Heyer et al., 1990; Beaumont et al.,
1991; Grimes et al., 1991; Demers et al., 1992; Guidotti,
1993; Aronson et al., 1994; Burnett et al., 1994; Deschamps
et al., 1995]. As testicular cancer can be very successfully
treated, there are few fatal cases (only one occurred in this
cohort). Therefore, unless mortality studies are very large,
they are unlikely to detect an elevated risk of testicular
cancer. A study involving ®re ®ghters in the Toronto
Metropolitan Fire Brigade, from 1950±89, reported an SMR
for testicular cancer of 2.52 (95% CI: 0.52±7.37), based on
three deaths [Aronson et al., 1994].
Some studies have examined cancer incidence in ®re
®ghters and it is important to consider possible reasons why
these did not detect a raised incidence of testicular cancer
[Sama et al., 1990; Giles et al., 1993; Demers et al., 1994;
Tornling et al., 1994]. The timing of the period of follow-up
for these studies may be important. Of the thirteen testicular
cancers known to have occurred in New Zealand ®re ®ghters
during our follow-up (including the two in the Wellington
cluster not recorded by the Cancer Registry), twelve were
registered in the years 1988 to 1996. Of the studies of cancer
incidence in ®re ®ghters carried out elsewhere, the two with
the most recent periods of follow-up concluded in 1989
[Giles et al., 1993; Demers et al., 1994]. It is conceivable,
for example, that there could be a relatively new building
material that produces a combustion product that is a
testicular carcinogen, and only recently has begun to
manifest its effect. Alternatively, there could be new ®re
®ghting work practices or ®re suppressant materials that
carry an increased testicular cancer risk. It is beyond the
scope of this study to investigate such possibilities. A nested
case-control study would be appropriate for that purpose.
An update of this cohort after, for example, ten years, would
be useful to investigate whether the elevated testicular
cancer risk continues. More current cohort studies of cancer
incidence in ®re ®ghters from other countries would
determine whether the ®ndings in this study have more
widespread applicability.
In conclusion, the raised incidence of testicular cancer
that occurred in Wellington ®re ®ghters during the 1980s,
continued into the 1990s, but was more widespread among
New Zealand ®re ®ghters. There are no indications of what
could be causing it. There was no evidence that paid ®re
®ghters in New Zealand are at particular risk for other types
of cancer, and they generally had a low risk of premature
mortality compared with the general New Zealand popula-
tion. Further studies, both in New Zealand and elsewhere,
are needed to con®rm our testicular cancer result, and to
identify possible causal factors.
ACKNOWLEDGMENTS
The authors thank Vince Arbuckle, Eni Toafa, Eliza-
beth Grieves, and Rod Nightingale (New Zealand Fire
Service), Gordon Purdie and Tony Blakeley (Wellington
School of Medicine), Don Roper (UFBA), Chris Lewis
Testicular Cancer in Fire Fighters 269
(NZHIS), and Kevin Hastings (WINZ) for their assistance
with this study.
REFERENCES
Aronson KJ, Tomlinson GA, Smith L. 1994. Mortality among ®re®ghters in metropolitan Toronto. Am J Ind Med 26:89±101.
Bandaranayake D, Read D, Salmond C. 1993. Health consequences ofa chemical ®re. Int J Environ Health Res 3:104±114.
Bates MN, Lane L. 1995. Testicular cancer in ®re ®ghters: a clusterinvestigation. NZ Med J 108:334±337.
Beaumont JJ, Chu ST, Jones JR, Schenker MB, Singleton JA,Piantanida LG, Reiterman M. 1991. An epidemiologic study of cancerand other causes of mortality in San Francisco ®re®ghters. Am J IndMed 19:357±372.
Breslow NE, Day NE. 1987. Statistical methods in cancer research.Volume II-the design and analysis of cohort studies. Lyon: IARCScienti®c Publications No. 82. International Agency for Research onCancer, World Health Organization.
Burnett CA, Halperin WE, Lalich NR, Sestito JP. 1994. Mortalityamong ®re ®ghters: a 27 state survey. Am J Ind Med 26:831±833.
Delahunt B, Bethwait PB, Nacey JN. 1995. Occupational risk for renalcell carcinoma. A case-control study based on the New Zealand CancerRegistry. Brit J Urol 75:578±582.
Demers PA, Heyer NJ, Rosenstock L. 1992. Mortality among ®re®ghters from three northwestern United States cities. Brit J Ind Med49:664±670.
Demers PA, Checkoway H, Vaughan TL, Weiss NS, Heyer NJ,Rosenstock L. 1994. Cancer incidence among ®re®ghters in Seattleand Tacoma, Washington (United States). Cancer Causes Control5:129±135.
Deschamps S, Momas I, Festy B. 1995. Mortality amongst Paris ®re-®ghters. Eur J Epidem 11:643±646.
Eliopoulos E, Armstrong BK, Spickett JT, Heyworth F. 1984.Mortality of ®re ®ghters in Western Australia. Brit J Ind Med 41:183±187.
Feuer E, Rosenman K. 1986. Mortality in police and ®re®ghters inNew Jersey. Am J Ind Med 9:517±527.
Firth HM, Cooke KR, Herbison GP. 1996. Male cancer incidence byocupation: New Zealand, 1972-1984. Int J Epidemiol 25:14±21.
Giles G, Staples M, Berry J. 1993. Cancer incidence in MelbourneMetropolitan Fire Brigade members, 1980±1989. Health Reports5:33±38.
Golden AL, Markowitz SB, Landrigan PJ. 1995. The risk of cancer in®re®ghters. Occupational Medicine: State of the Art Reviews 10:803±820.
Grimes G, Hirsch D, Borgeson D. 1991. Risk of death among Honolulu®re ®ghters. Hawaii Med J 50:82±85.
Guidotti TL. 1993. Mortality of urban ®re®ghters in Alberta, 1927-1987. Am J Ind Med 23:921±940.
Guidotti T. 1995. Occupational mortality among ®re®ghters: assessingthe association. J Occup Env Med 37:1348±1356.
Hansen ES. 1990. A cohort study on the mortality of ®re®ghters. Br JInd Med 47:805±809.
Heyer N, Weiss NS, Demers P, Rosenstock L. 1990. Cohort mortalitystudy of Seattle ®re ®ghters: 1945±1983. Am J Ind Med 17:493±504.
Howe GR, Burch JD. 1990. Fire ®ghters and risk of cancer: anassessment and overview of the epidemiologic evidence. Am JEpidemiol 132:1039±1050.
Musk AW, Monson RR, Peters JM, Peters RK. 1978. Mortality amongBoston ®re®ghters, 1915-1975. Br J Ind Med 35:104±108.
Pearce N, Sheppard RA, Howard JK, Fraser J, Lilley BM. 1987. Timetrends and occupational differences in cancer of the testis in NewZealand. Cancer 59:1677±1682.
Sama SR, Martin TR, Davis LK, Kriebel D. 1990. Cancer incidenceamong Massachusetts ®re®ghters, 1982-1986. Am J Ind Med 18:47±54.
Tornling G, Gustavsson P, Hogstedt C. 1994. Mortality and cancerincidence in Stockholm ®re ®ghters. Am J Ind Med 25:219±228.
Vena JE, Fiedler RC. 1987. Mortality of a municipal-worker cohort: IV.Fire ®ghters. Am J Ind Med 11:671±684.
270 Bates et al.


![Isolated Testicular Tuberculosis Mimicking Testicular ... involvement, but testicular involvement is an unusual clinical condition [3]. In this report, a case with isolated testicular](https://img.pdfslide.net/doc/110x75/5f3d57bf74280d66ef795ba2/isolated-testicular-tuberculosis-mimicking-testicular-involvement-but-testicular.jpg)