Embed Size (px)
Citation preview
39
ISESCO JOURNAL of Science and TechnologyVolume 10 - Number 17 - May 2014 (39-48)
Abstract
The present studydeals with the com-
putational analysis of flowcharacteristics around atwo-bladed Savonius ro-tor. For the computatio-nal investigation, both 2D and 3D models of a clas-sical Savonius rotor were analysed with the help of the commercial com-putational fluid dynamic (CFD) software ANSYS-FLUENT. Variations of drag and torque coefficients were studied for both the 2D and 3D models at different rotor blade angles at each 10° interval. The drag and torque coefficients were found to reach their maximum at 0° and 30° rotor blade angles respectively. More-over, the fact that Savonius rotors are self-starting was
also corroborated from the drag coefficient va-riation. In addition, static pressure, velocity, vorti-city and turbulent kinetic energy were analysed for the 2D model of which vorticity and turbulent kinetic energy were not examined before using CFD. Static pressure and velocity magnitude were found to reach their maxi-mum at a 0o rotor angle.
The vorticity magnitude and turbulent kinetic energy were found to reach their maximum at a 30° rotor blade angle.
Keywords: Two-bladed Savonius rotor, Drag coeffi-cient, Torque coefficient, Turbulent Kinetic Energy, Vorticity magnitude.
Computational Analysis of Flow around a Two-Bladed
Savonius Rotor1Bhaskar Jyoti Choudhury
and 2Gaurav Saraf1Department of Mechanical Engineering,
NERIST2Department of Mechanical Engineering,
IIT KanpurGuwahati-781001, Assam, India
E-mail: [email protected], [email protected]
1. Introduction
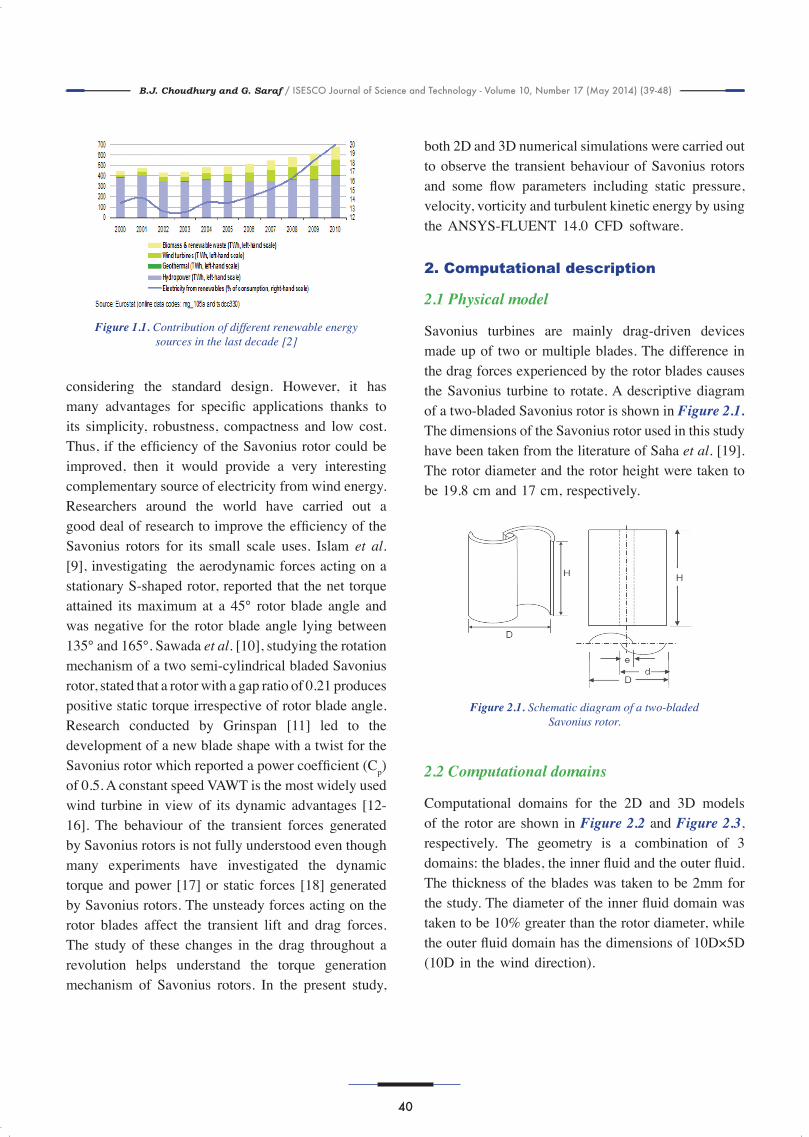
The advance of civilization has led to an increased use of energy generated from coal and other fossil fuels by 1970, in view of their ease of transportation and processing [1]. However, the rise in energy demands has created a need o generate power from renewable energy sources to meet these needs, reduce the use of fossil fuels and alleviate the damages resulting from these fuels. By the late 20th century, wind energy was recognized as an important source of alternative energy in the world and the depletion of fossil fuel reserves served as a strong impetus in this regard. Figure 1.1shows the increasing percentage of wind energy contri-bution to the overall renewable energy supply in the
last decade. Wind turbines occupy a major segment of wind energy converters and are classified as horizontal axis wind turbines (HAWTs) and vertical axis wind turbines (VAWTs). An important category of VAWTs is the Savonius VAWT, introduced by the Finish engineer Savonius [3] in 1920s. He divided a cylinder into two halves along its central axis and then relocated them sideways, which was a redesign of Flettener’s rotor [4].
Savonius rotors are used for a variety of purposes including water pumping, driving an electrical generator, providing ventilation, and agitating water to keep stock ponds ice-free during winter [5-8]. The Savonius rotor is a slow-running wind turbine which explains its lower efficiency when
B.J. Choudhury and G. Saraf / ISESCO Journal of Science and Technology - Volume 10, Number 17 (May 2014) (39-48)
40
considering the standard design. However, it has many advantages for specific applications thanks to its simplicity, robustness, compactness and low cost. Thus, if the efficiency of the Savonius rotor could be improved, then it would provide a very interesting complementary source of electricity from wind energy. Researchers around the world have carried out a good deal of research to improve the efficiency of the Savonius rotors for its small scale uses. Islam et al. [9], investigating the aerodynamic forces acting on a stationary S-shaped rotor, reported that the net torque attained its maximum at a 45° rotor blade angle and was negative for the rotor blade angle lying between 135° and 165°. Sawada et al. [10], studying the rotation mechanism of a two semi-cylindrical bladed Savonius rotor, stated that a rotor with a gap ratio of 0.21 produces positive static torque irrespective of rotor blade angle. Research conducted by Grinspan [11] led to the development of a new blade shape with a twist for the Savonius rotor which reported a power coefficient (Cp) of 0.5. A constant speed VAWT is the most widely used wind turbine in view of its dynamic advantages [12-16]. The behaviour of the transient forces generated by Savonius rotors is not fully understood even though many experiments have investigated the dynamic torque and power [17] or static forces [18] generated by Savonius rotors. The unsteady forces acting on the rotor blades affect the transient lift and drag forces. The study of these changes in the drag throughout a revolution helps understand the torque generation mechanism of Savonius rotors. In the present study,
both 2D and 3D numerical simulations were carried out to observe the transient behaviour of Savonius rotors and some flow parameters including static pressure, velocity, vorticity and turbulent kinetic energy by using the ANSYS-FLUENT 14.0 CFD software.
2. Computational description
2.1 Physical model
Savonius turbines are mainly drag-driven devices made up of two or multiple blades. The difference in the drag forces experienced by the rotor blades causes the Savonius turbine to rotate. A descriptive diagram of a two-bladed Savonius rotor is shown in Figure 2.1. The dimensions of the Savonius rotor used in this study have been taken from the literature of Saha et al. [19]. The rotor diameter and the rotor height were taken to be 19.8 cm and 17 cm, respectively.
2.2 Computational domains
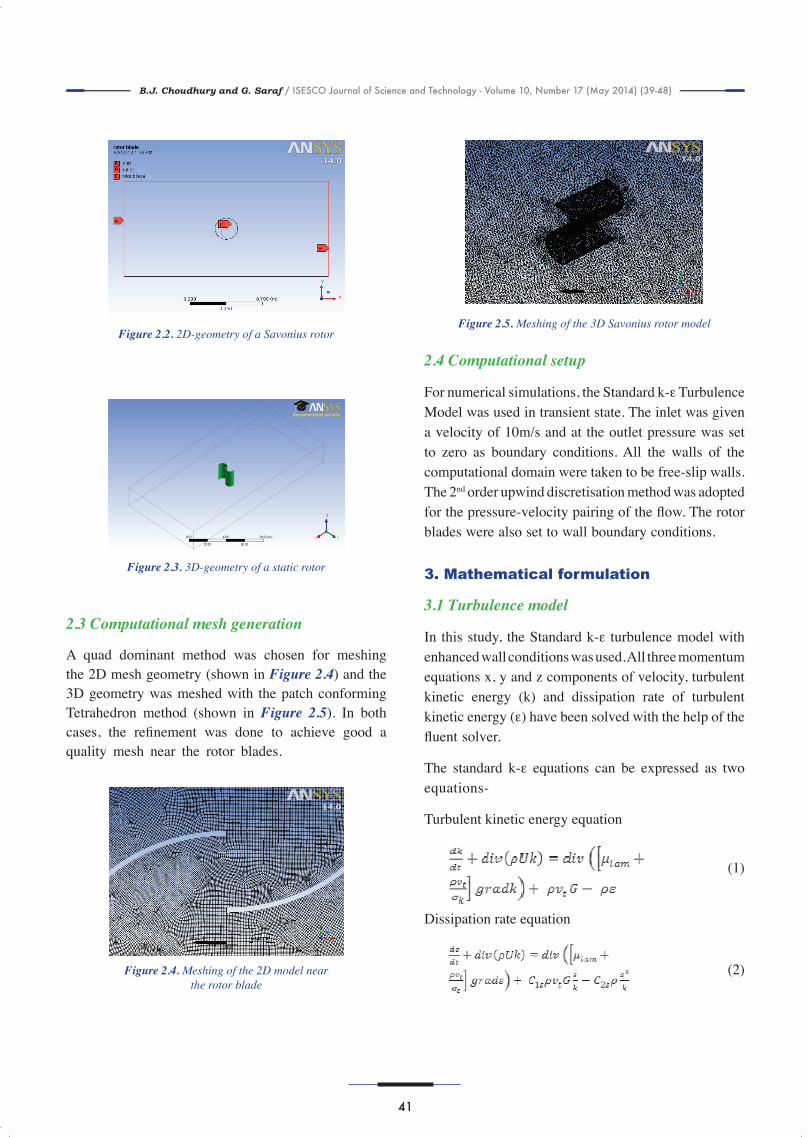
Computational domains for the 2D and 3D models of the rotor are shown in Figure 2.2 and Figure 2.3, respectively. The geometry is a combination of 3 domains: the blades, the inner fluid and the outer fluid. The thickness of the blades was taken to be 2mm for the study. The diameter of the inner fluid domain was taken to be 10% greater than the rotor diameter, while the outer fluid domain has the dimensions of 10D×5D (10D in the wind direction).
Figure 1.1. Contribution of different renewable energysources in the last decade [2]
Figure 2.1. Schematic diagram of a two-bladedSavonius rotor.
B.J. Choudhury and G. Saraf / ISESCO Journal of Science and Technology - Volume 10, Number 17 (May 2014) (39-48)
41
2.3 Computational mesh generation
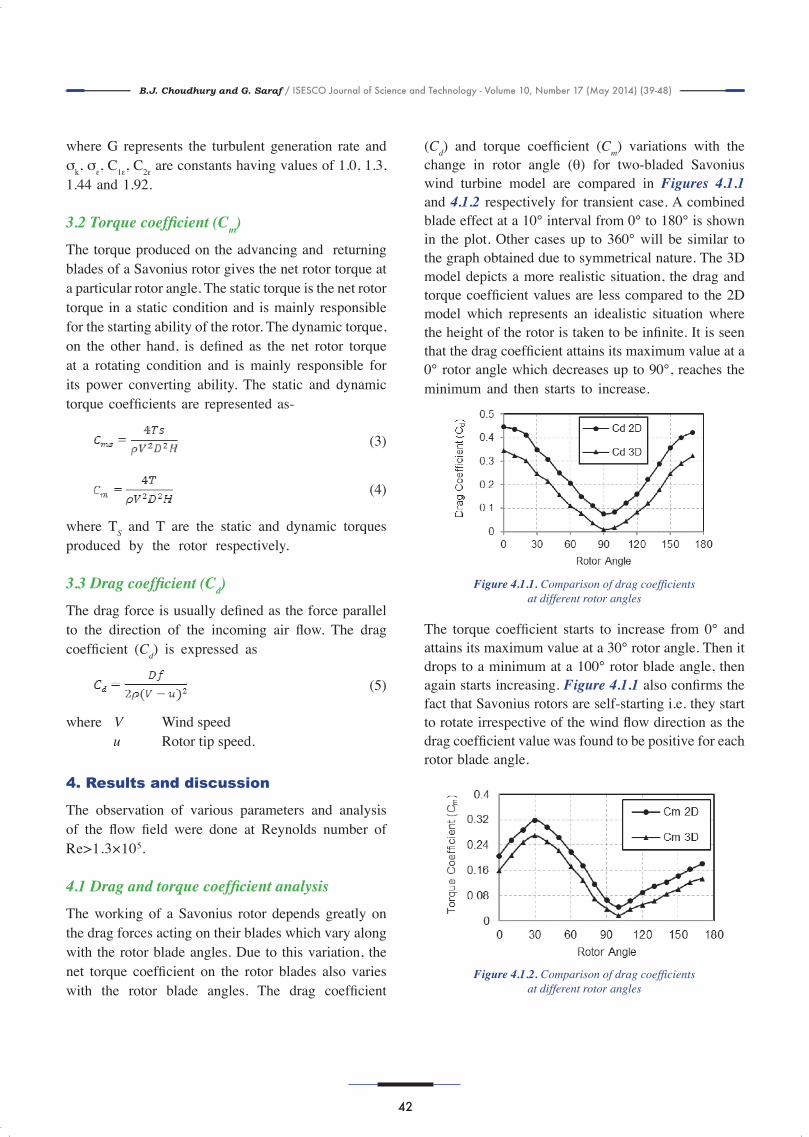
A quad dominant method was chosen for meshing the 2D mesh geometry (shown in Figure 2.4) and the 3D geometry was meshed with the patch conforming Tetrahedron method (shown in Figure 2.5). In both cases, the refinement was done to achieve good a quality mesh near the rotor blades.
2.4 Computational setup
For numerical simulations, the Standard k-ε Turbulence Model was used in transient state. The inlet was given a velocity of 10m/s and at the outlet pressure was set to zero as boundary conditions. All the walls of the computational domain were taken to be free-slip walls. The 2nd order upwind discretisation method was adopted for the pressure-velocity pairing of the flow. The rotor blades were also set to wall boundary conditions.
3. Mathematical formulation
3.1 Turbulence model
In this study, the Standard k-ε turbulence model withenhanced wall conditions was used. All three momentum equations x, y and z components of velocity, turbulent kinetic energy (k) and dissipation rate of turbulent kinetic energy (ε) have been solved with the help of the fluent solver.
The standard k-ε equations can be expressed as two equations-
Turbulent kinetic energy equation
Dissipation rate equation
Figure 2.2. 2D-geometry of a Savonius rotor
Figure 2.3. 3D-geometry of a static rotor
Figure 2.4. Meshing of the 2D model nearthe rotor blade
Figure 2.5. Meshing of the 3D Savonius rotor model
(1)
(2)
B.J. Choudhury and G. Saraf / ISESCO Journal of Science and Technology - Volume 10, Number 17 (May 2014) (39-48)
42
where G represents the turbulent generation rate and σk, σε
, C1ε, C2ε are constants having values of 1.0, 1.3, 1.44 and 1.92.
3.2 Torque coefficient (Cm)
The torque produced on the advancing and returning blades of a Savonius rotor gives the net rotor torque at a particular rotor angle. The static torque is the net rotor torque in a static condition and is mainly responsible for the starting ability of the rotor. The dynamic torque, on the other hand, is defined as the net rotor torque at a rotating condition and is mainly responsible for its power converting ability. The static and dynamic torque coefficients are represented as-
where TS and T are the static and dynamic torques produced by the rotor respectively.
3.3 Drag coefficient (Cd)
The drag force is usually defined as the force parallel to the direction of the incoming air flow. The drag coefficient (Cd) is expressed as
where V Wind speedu Rotor tip speed.
4. Results and discussion
The observation of various parameters and analysis of the flow field were done at Reynolds number of Re>1.3×10⁵.
4.1 Drag and torque coefficient analysis
The working of a Savonius rotor depends greatly on the drag forces acting on their blades which vary along with the rotor blade angles. Due to this variation, the net torque coefficient on the rotor blades also varies with the rotor blade angles. The drag coefficient
(Cd) and torque coefficient (Cm) variations with the change in rotor angle (θ) for two-bladed Savonius wind turbine model are compared in Figures 4.1.1 and 4.1.2 respectively for transient case. A combined blade effect at a 10° interval from 0° to 180° is shown in the plot. Other cases up to 360° will be similar to the graph obtained due to symmetrical nature. The 3D model depicts a more realistic situation, the drag and torque coefficient values are less compared to the 2D model which represents an idealistic situation where the height of the rotor is taken to be infinite. It is seen that the drag coefficient attains its maximum value at a 0° rotor angle which decreases up to 90°, reaches the minimum and then starts to increase.
The torque coefficient starts to increase from 0° and attains its maximum value at a 30° rotor angle. Then it drops to a minimum at a 100° rotor blade angle, then again starts increasing. Figure 4.1.1 also confirms the fact that Savonius rotors are self-starting i.e. they start to rotate irrespective of the wind flow direction as the drag coefficient value was found to be positive for each rotor blade angle.
(3)
(4)
(5)
Figure 4.1.1. Comparison of drag coefficientsat different rotor angles
Figure 4.1.2. Comparison of drag coefficientsat different rotor angles
B.J. Choudhury and G. Saraf / ISESCO Journal of Science and Technology - Volume 10, Number 17 (May 2014) (39-48)
43
4.2 Contour analysis The contour plots obtained by CFD simulations play a vital role in analyzing the fluid flow parameters around the simulated object. In the present study, analysis has been carried out for static pressure, velocity, vorticity and turbulent kinetic energy for every 30° change in the rotor angle varying from 0° to 180°.
4.2.1 Pressure contour analysis
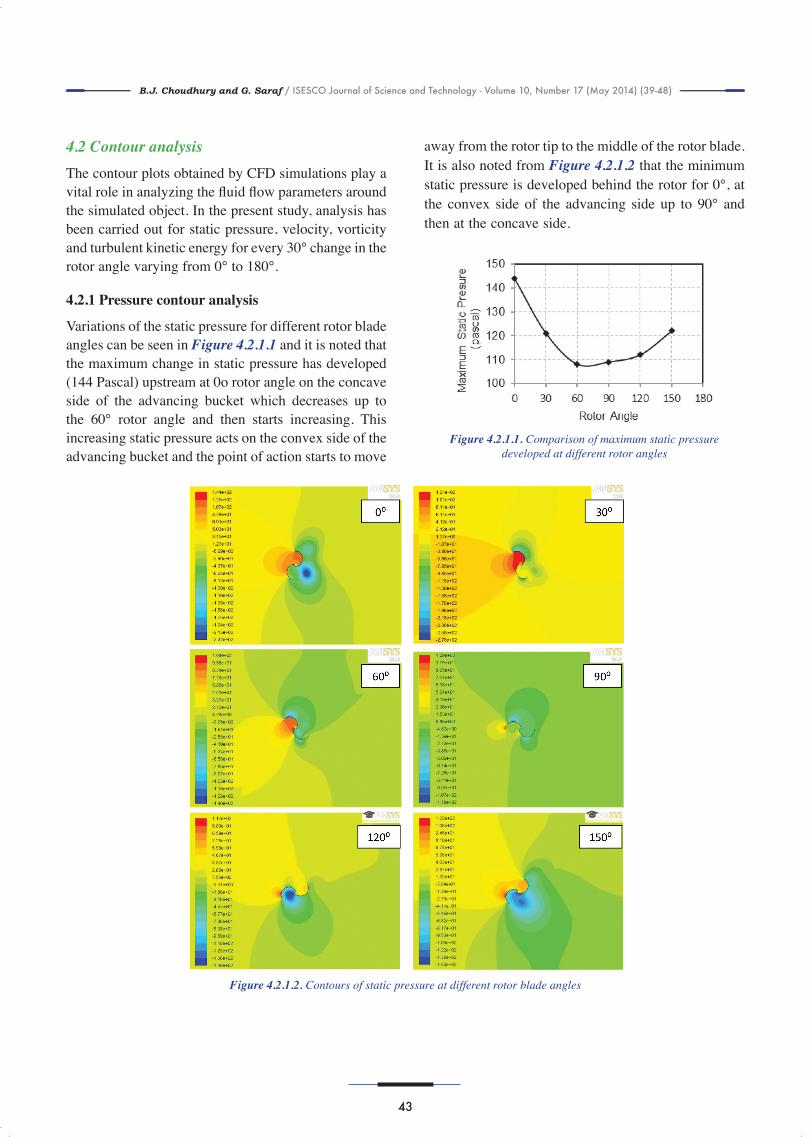
Variations of the static pressure for different rotor blade angles can be seen in Figure 4.2.1.1 and it is noted that the maximum change in static pressure has developed (144 Pascal) upstream at 0o rotor angle on the concave side of the advancing bucket which decreases up to the 60° rotor angle and then starts increasing. This increasing static pressure acts on the convex side of the advancing bucket and the point of action starts to move
away from the rotor tip to the middle of the rotor blade. It is also noted from Figure 4.2.1.2 that the minimum static pressure is developed behind the rotor for 0°, at the convex side of the advancing side up to 90° and then at the concave side.
Figure 4.2.1.1. Comparison of maximum static pressuredeveloped at different rotor angles
Figure 4.2.1.2. Contours of static pressure at different rotor blade angles
B.J. Choudhury and G. Saraf / ISESCO Journal of Science and Technology - Volume 10, Number 17 (May 2014) (39-48)
44
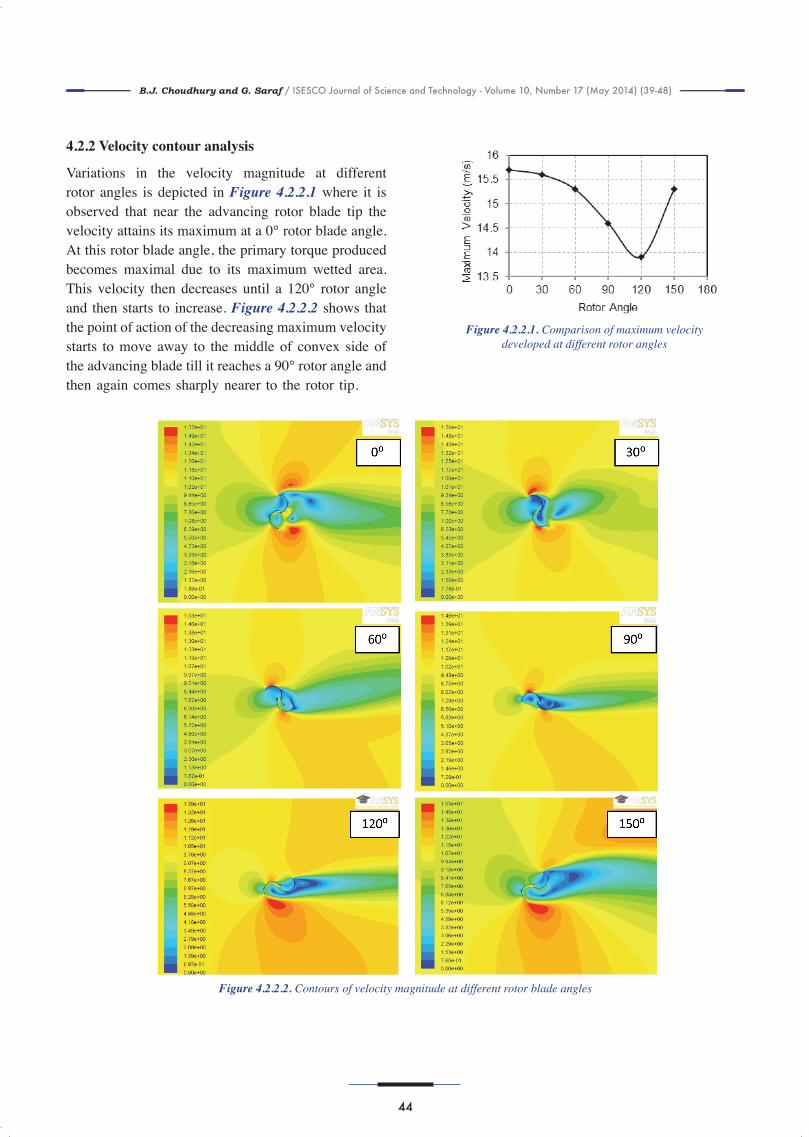
4.2.2 Velocity contour analysis
Variations in the velocity magnitude at different rotor angles is depicted in Figure 4.2.2.1 where it is observed that near the advancing rotor blade tip the velocity attains its maximum at a 0° rotor blade angle. At this rotor blade angle, the primary torque produced becomes maximal due to its maximum wetted area. This velocity then decreases until a 120° rotor angle and then starts to increase. Figure 4.2.2.2 shows that the point of action of the decreasing maximum velocity starts to move away to the middle of convex side of the advancing blade till it reaches a 90° rotor angle and then again comes sharply nearer to the rotor tip.
Figure 4.2.2.1. Comparison of maximum velocitydeveloped at different rotor angles
Figure 4.2.2.2. Contours of velocity magnitude at different rotor blade angles
B.J. Choudhury and G. Saraf / ISESCO Journal of Science and Technology - Volume 10, Number 17 (May 2014) (39-48)
45
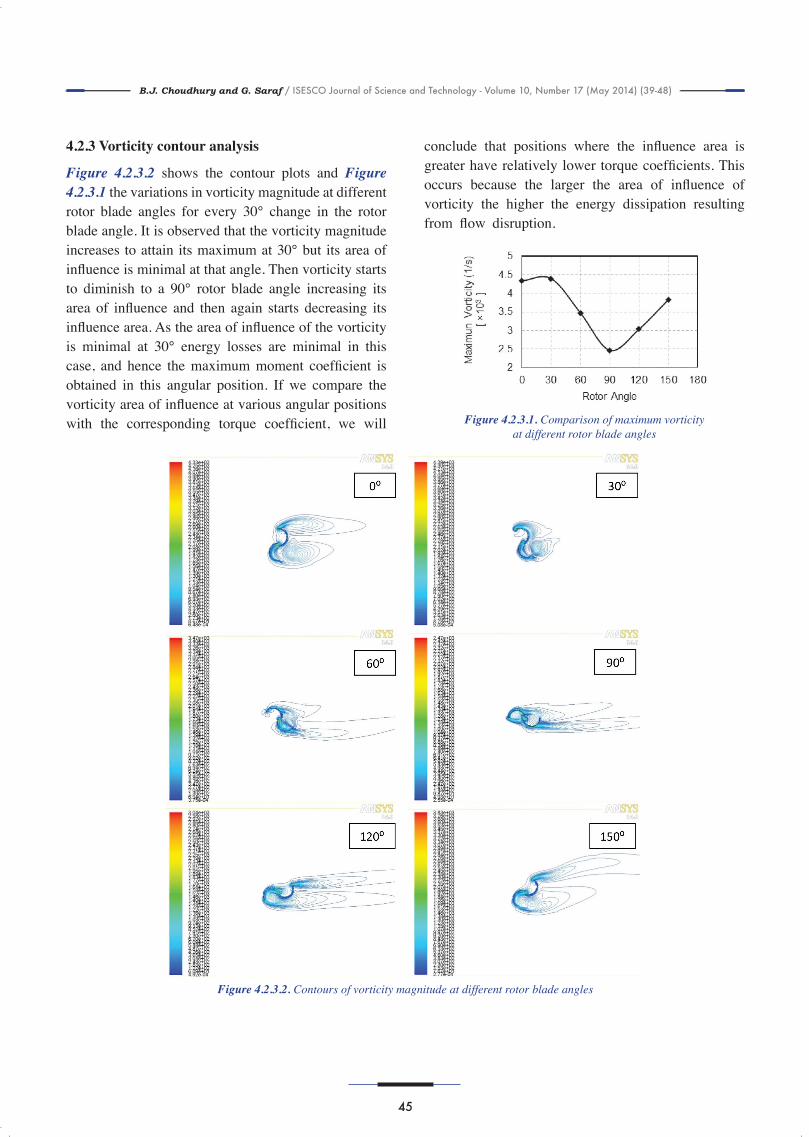
4.2.3 Vorticity contour analysis
Figure 4.2.3.2 shows the contour plots and Figure 4.2.3.1 the variations in vorticity magnitude at different rotor blade angles for every 30° change in the rotor blade angle. It is observed that the vorticity magnitude increases to attain its maximum at 30° but its area of influence is minimal at that angle. Then vorticity starts to diminish to a 90° rotor blade angle increasing its area of influence and then again starts decreasing its influence area. As the area of influence of the vorticity is minimal at 30° energy losses are minimal in this case, and hence the maximum moment coefficient is obtained in this angular position. If we compare the vorticity area of influence at various angular positions with the corresponding torque coefficient, we will
conclude that positions where the influence area is greater have relatively lower torque coefficients. This occurs because the larger the area of influence of vorticity the higher the energy dissipation resulting from flow disruption.
Figure 4.2.3.1. Comparison of maximum vorticityat different rotor blade angles
Figure 4.2.3.2. Contours of vorticity magnitude at different rotor blade angles
B.J. Choudhury and G. Saraf / ISESCO Journal of Science and Technology - Volume 10, Number 17 (May 2014) (39-48)
46
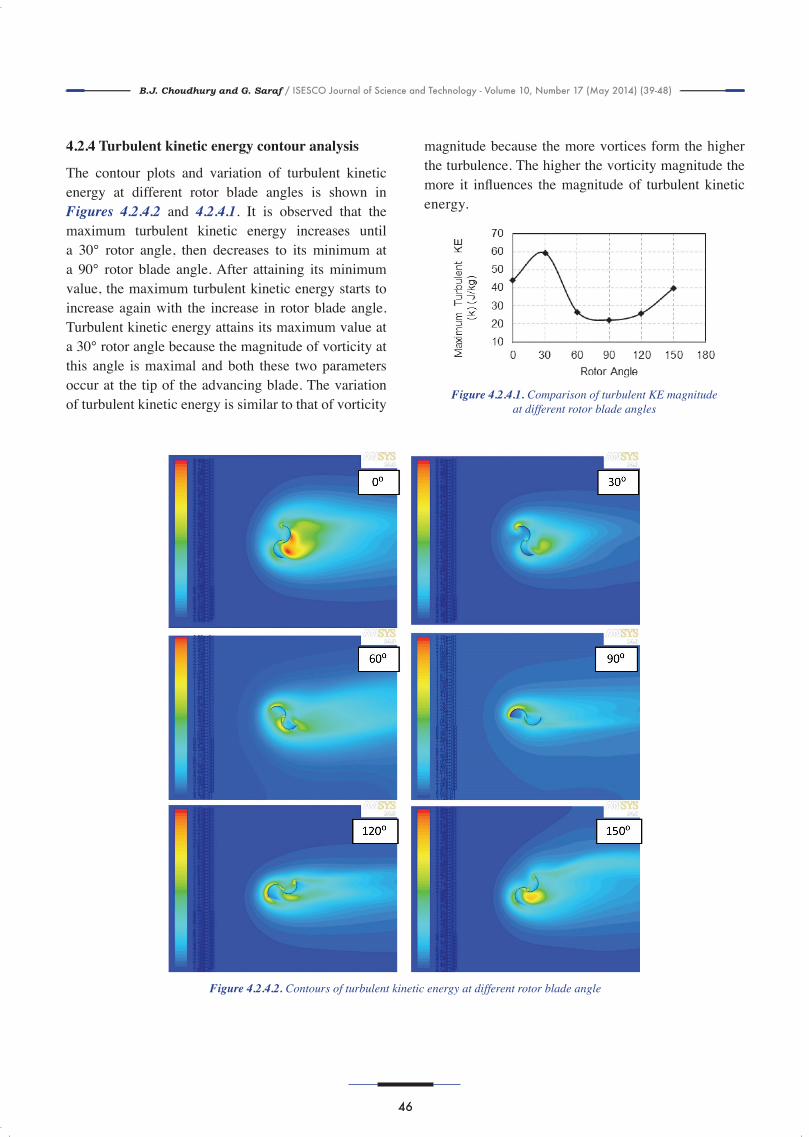
4.2.4 Turbulent kinetic energy contour analysis
The contour plots and variation of turbulent kinetic energy at different rotor blade angles is shown in Figures 4.2.4.2 and 4.2.4.1. It is observed that the maximum turbulent kinetic energy increases until a 30° rotor angle, then decreases to its minimum at a 90° rotor blade angle. After attaining its minimum value, the maximum turbulent kinetic energy starts to increase again with the increase in rotor blade angle. Turbulent kinetic energy attains its maximum value at a 30° rotor angle because the magnitude of vorticity at this angle is maximal and both these two parameters occur at the tip of the advancing blade. The variation of turbulent kinetic energy is similar to that of vorticity
magnitude because the more vortices form the higher the turbulence. The higher the vorticity magnitude the more it influences the magnitude of turbulent kinetic energy.
Figure 4.2.4.1. Comparison of turbulent KE magnitudeat different rotor blade angles
Figure 4.2.4.2. Contours of turbulent kinetic energy at different rotor blade angle
B.J. Choudhury and G. Saraf / ISESCO Journal of Science and Technology - Volume 10, Number 17 (May 2014) (39-48)
47
Conclusion
A numerical analysis of the aerodynamic characteristics of a two-bladed Savonius rotor was carried out in this study.
• The drag and torque coefficients were obtained by simulations for every 30° change in the rotor blade angle varying from 0° to 90°. It was observed that the drag and torque coefficients attain their highest value at 0° and 30° rotor angle respectively. In addition, the drag coefficient was found to be positive for each rotor blade angle, which verifies the fact that Savonius rotors are self-starting.
• It was also observed that the static pressure at concave face and the velocity magnitude near the rotor tip of the advancing bucket were maximum at a 0° rotor angle.
• The vorticity magnitude and the turbulent kinetic energy were observed to reach their maximum at a 30° rotor blade angle.
[1] Boyle G., Renewable energy: power for a sustainable future, New York, Oxford University Press, 978-0-19-958651-6.
[2] Eurostat (online data codes, nrg_105a and ts dcc330)[3] Savonius SJ, The S-rotor and its applications, Mechanical Engineering,
1931, 53 (5), 333-8.[4] Flettner A., The story of the rotor, London, Crosby Lockwood, 1926
OCLC, 277536025[5] Fernando, M.S.U.K., Modi, V. J., A Numerical Analysis of the Unsteady
Flow Past a Savonius Wind Turbine, J. Wind Eng. and Industrial Aerodynamics 32, 303-327 (1989).
[6] Ogawa, T., Yoshida, H. and Yokota, Y., Development of rotational speed control systems for a Savonius type wind turbine, ASME J. Fluids Engg l11, 53-58 (1989).
[7] Islam, S., Islam, A.K.M., Mandal, A.C. and Razzaque, M.M., Aero-dynamic characteristics of a stationary Savonius rotor, Proc. RERIC and Int.J. Energy 15, 125-136 (1993).
[8] Spera, D.A., Wind Turbine Technology, ASME Press (1994).[9] Islam, A.K.M.S., M.Q., Razzaque, M.M., & Ashraf, R., (1995), Static
torque and Drag characteristics of S-shaped Savonius Rotor and Pre-diction of Dynamic Characteristics, Wind Engineering, 19.
[10] Sawada, T., Nahamura, M., Kamada, S. (1986), Blade force measu-rement and flow visualization of Savonius rotors, Bulletin of JSME, 29, 2095-2100.
[11] Grinspan, A.S., Design, development & testing of Savonius wind turbine rotor with twisted blades, Proc. 28th National Conf. on Fluid Mechanics and Fluid Power. Chandigarh, Dec 13-15, 428-431 (2001).
[12] Pope K, Rodrigues V, Doyle R, Tsopelas A, Gravelsins R, Naterer GF, et al., Effects of stator vanes on power coefficients of a zephyr vertical axis wind turbine, Renewable Energy 2010, 35(5), 1043e51.
[13] Menet JL, Leiper A. Prévision des performances aérodynamiques d’un nouveau type d’éolienne à axe vertical dérivée du rotor Savonius, Actes du 17è Congrès Français de Mécanique 2005.
[14] McTavish S, Feszty D, Sankar T., Steady and rotating computational fluid dynamics simulations of a novel vertical axis wind turbine for small-scale power generation. Renewable Energy, 2012, 41, 171e9.
[15] Hwang IS, Lee YH, Kim SJ., Optimization of cycloidal water turbine and the performance improvement by individual blade control, Wind Engineering 2009, 86(9), 1532e40.
[16] Marco RC, Alessandro E, Ernesto B., the Darrieus wind turbine: pro-posal for a new performance prediction model based on CFD. Wind Engineering 2011, 36 (8), 4919e34.
[17] Hayashi T, Li Y, Hara Y., Wind tunnel tests on a different phase three-stage Savonius rotor. JSME International Journal Series B 2005, 48, 9e16.
[18] Irabu K, Roy J., Study of direct force measurement and characteristics on blades of Savonius rotor at static state, Experimental Thermal and Fluid Science 2011, 35, 653e9.
[19] UK Saha, S Thota, D Maity, Optimum design configuration of Savonius rotor through wind tunnel experiments, Journal of Wind Engineering and Industrial Aerodynamics 96 (2008), pp. 1359-1375, (2008).
[20] Sukanta Roy and Ujjwal K. Saha (2013), Review on the numerical investigations into the design and development of Savonius wind rotors, Pages 74-76, (2013).
References
B.J. Choudhury and G. Saraf / ISESCO Journal of Science and Technology - Volume 10, Number 17 (May 2014) (39-48)
48
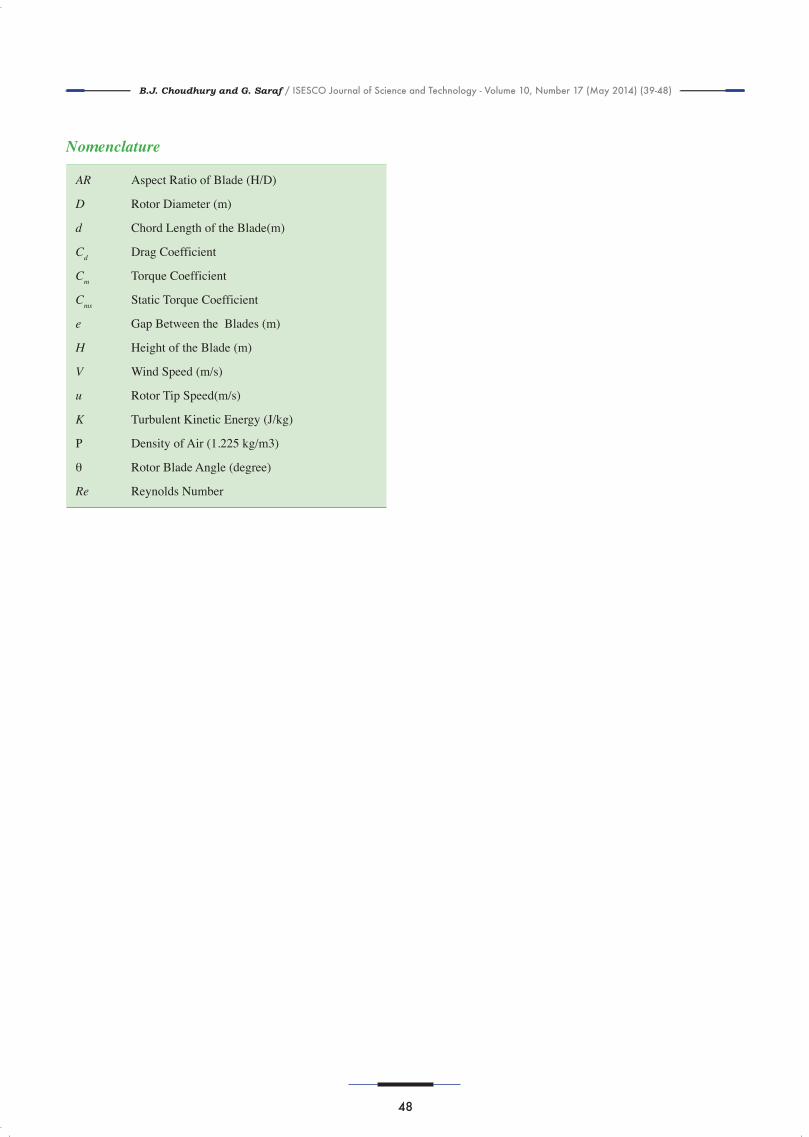
Nomenclature
AR
D
d
Cd
Cm
Cms
e
H
V
u
K
Ρ
θ
Re
Aspect Ratio of Blade (H/D)
Rotor Diameter (m)
Chord Length of the Blade(m)
Drag Coefficient
Torque Coefficient
Static Torque Coefficient
Gap Between the Blades (m)
Height of the Blade (m)
Wind Speed (m/s)
Rotor Tip Speed(m/s)
Turbulent Kinetic Energy (J/kg)
Density of Air (1.225 kg/m3)
Rotor Blade Angle (degree)
Reynolds Number


![ISESCO JOURNAL -% S($,$ ,# T$’,-*-&4 · 2014. 5. 5. · vocabulary to be recognized and to a mono-speaker recognition algortithm[5]. Probabilistic methods, widely used for speech](https://img.pdfslide.net/doc/110x75/613ab3e60051793c8c013118/isesco-journal-s-ta-4-2014-5-5-vocabulary-to-be-recognized.jpg)


![ISESCO JOURNAL of Science and Technologywindsolarhybridaustralia.x10.mx/2-pakistan-solar-panel... · 2014-01-29 · with the findings of Mahar, 2004 [9] and Salman et al., 2012 [10]](https://img.pdfslide.net/doc/110x75/5f08143d7e708231d4203ac7/isesco-journal-of-science-and-technologywindsolarhybridaustraliax10mx2-pakistan-solar-panel.jpg)