Embed Size (px)
Citation preview

ISF:RESEARCHAND CONSULTANCY
THINK.CHANGE.DO
INSTITUTE FOR SUSTAINABLE FUTURES
South African Energy Sector Jobs to 2030. Report for Greenpeace Africa.Jay Rutovitz , 18th August 2010

Introduction to ISF
Overview of analysis
The energy scenarios
Methodology
Employment results
South African Energy Sector Jobs
to 2030

Institute for Sustainable Futures (ISF)
Research institute at University of Technology Sydney, set up in 1996, with mission:
To create change towards a sustainable future through independent, project-based research
ISF undertook analysis of the employment effects of the
Greenpeace International Energy [R]evolution: Working for the Climate, Greenpeace International, 2009,
and Energy sector jobs to 2030: a global analysis, Jay Rutovitz and Alison Atherton, 2009
Greenpeace Africa asked us to analyse the employment effects of the South African Energy [R]evolution.
Overview of our analysis ISF analysed SA Energy [R]evolution for Greenpeace
Africa, looking at three scenarios Business as usual case derived from IEA 2007 projection Energy [R]evolution scenario, which achieves 60% emissions
reduction by 2050 Added in the Growth Without Constraints scenario (from Long
Term Mitigation Scenarios)
We included one scenario with enhanced renewable manufacturing, and export to the rest of Africa
Electricity sector jobs only
Direct jobs only (does not include jobs in accommodation, catering, or from spending wages)

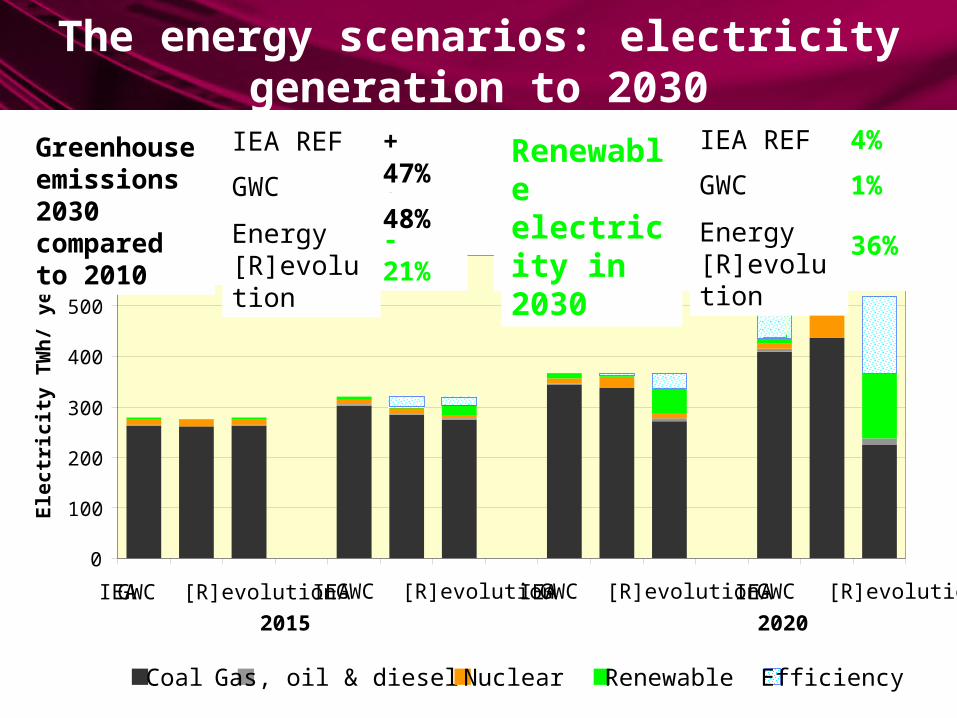
The energy scenarios: electricity generation to 2030
2010 2015 2020 2030
0
100
200
300
400
500
600
IEA GWC [R]evolution IEA GWC [R]evolution IEA GWC [R]evolution IEA GWC [R]evolution
Elec
tric
ity T
Wh/
yea
r
Coal Gas, oil & diesel Nuclear Renewable Efficiency
The energy scenarios: electricity generation to 2030
2010 2015 2020 2030
0
100
200
300
400
500
600
IEA GWC [R]evolution IEA GWC [R]evolution IEA GWC [R]evolution IEA GWC [R]evolution
Elec
tric
ity T
Wh/
yea
r
Coal Gas, oil & diesel Nuclear Renewable Efficiency
Renewable electricity in 2030 Energy
[R]evolution
GWC
IEA REF
36%
1%
4% Greenhouse emissions 2030 compared to 2010 Energy
[R]evolution
GWC
IEA REF
- 21%
+ 48%
+ 47%

Methodology - inputs
Employment factors (jobs per MW)
UNCERTAINTY SA factors where possible, otherwise OECD factors +
multiplier. Adjustment for cost decline. Energy efficiency job factor (only for the reduction in
electricity consumption)- Includes a proportion of energy efficiency achieved
by solar water heating
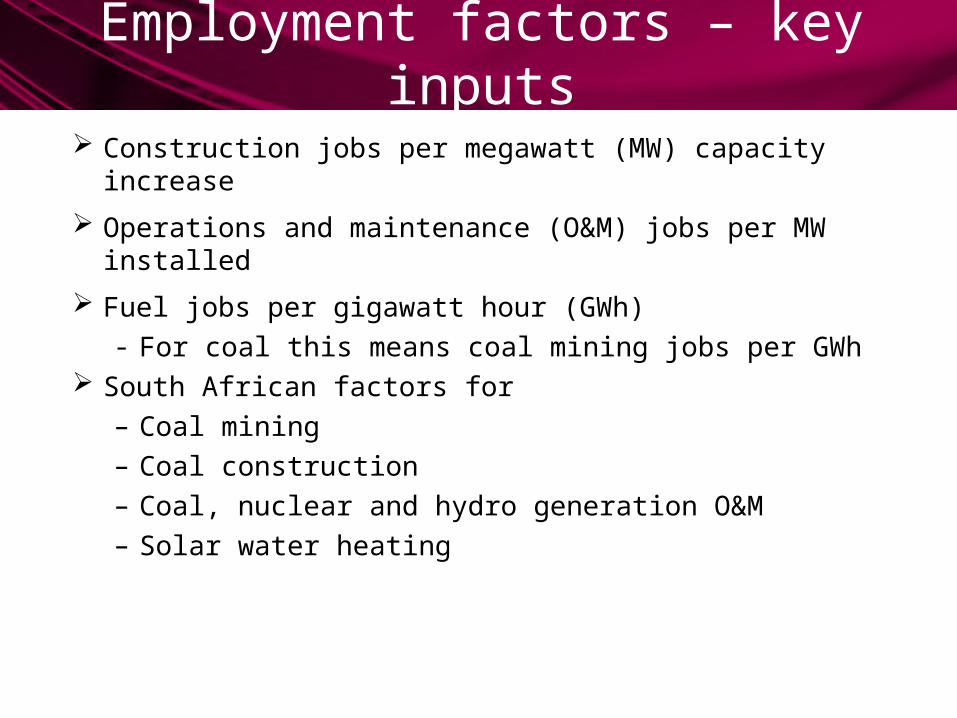
Employment factors – key inputs
Construction jobs per megawatt (MW) capacity increase
Operations and maintenance (O&M) jobs per MW installed
Fuel jobs per gigawatt hour (GWh)- For coal this means coal mining jobs per GWh
South African factors for – Coal mining– Coal construction– Coal, nuclear and hydro generation O&M– Solar water heating

Employment factor - adjustment from OECD
Labour intensity tends to be higher in countries with lower GDP per capita.
One method: multiply OECD factors by the ratio of labour productivity* in SA to labour productivity in the OECD. This would mean multiplying by 4.6.
We used the weighted average of the ratio between local factors and OECD employment factors, which is 2.15.
Conservative approach.
* GDP per person employed

0
40,000
80,000
120,000
160,000
2010 2020 2030 2010 2020 2030 2010 2020 2030
IEA Reference Growth Energy [R]evolutionWithout Constraints
Efficiency
Efficiency - SWH
OceanSolar thermalGeothermal
PV
WindHydro
Biomass
Nuclear
Oil & diesel
Gas
Coal
JOBS
Coal exports
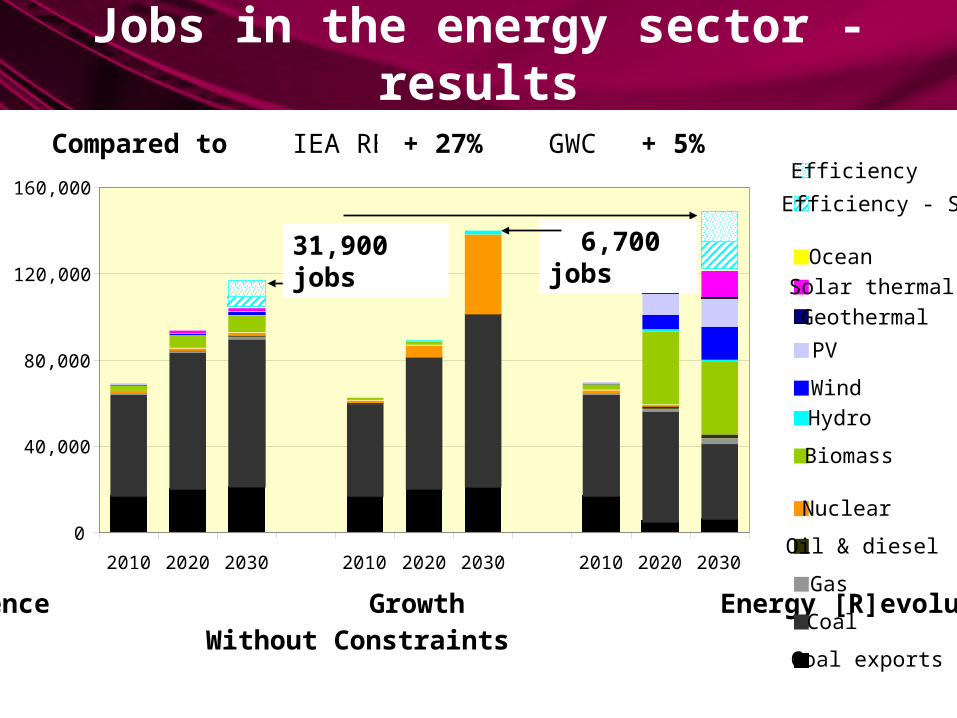
Jobs in the energy sector - results
Jobs in the energy sector - results
0
40,000
80,000
120,000
160,000
2010 2020 2030 2010 2020 2030 2010 2020 2030
IEA Reference Growth Energy [R]evolutionWithout Constraints
Efficiency
Efficiency - SWH
OceanSolar thermalGeothermal
PV
WindHydro
Biomass
Nuclear
Oil & diesel
Gas
Coal
JOBS
Coal exports
IEA REF + 27%
31,900 jobs 6,700 jobs
Compared to GWC + 5%

What if we don’t include coal exports?
0
40,000
80,000
120,000
160,000
2010 2020 2030 2010 2020 2030 2010 2020 2030
IEA Reference Growth Energy [R]evolutionWithout Constraints
Efficiency
Efficiency - SWH
OceanSolar thermalGeothermal
PV
WindHydro
Biomass
Nuclear
Oil & diesel
Gas
Coal
JOBS
Coal exports
IEA REF + 27%
31,900 jobs 6,700 jobs
Compared to GWC + 5%
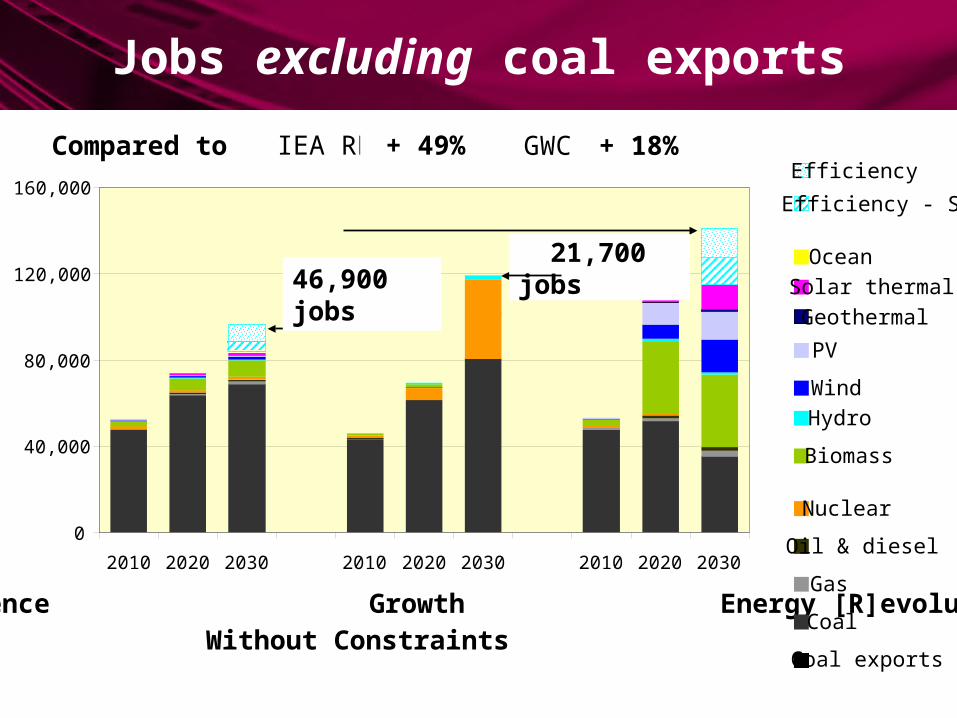
Jobs excluding coal exports
0
40,000
80,000
120,000
160,000
2010 2020 2030 2010 2020 2030 2010 2020 2030
IEA Reference Growth Energy [R]evolutionWithout Constraints
Efficiency
Efficiency - SWH
OceanSolar thermalGeothermal
PV
WindHydro
Biomass
Nuclear
Oil & diesel
Gas
Coal
JOBS
Coal exports
IEA REF + 49%Compared to
46,900 jobs 21,700 jobs
GWC + 18%

Coal
Gas and oil
Nuclear
Fossil CHP
Biomass
Hydro
Wind
PV
Geothermal
Solar thermal
Ocean
Renewable CHP
Energy [R]evolutionTotal jobs 113,000
Renewable 51% of jobs
IEA Reference Total jobs 74,000
Renewable 7% of jobs
Growth Without Constraints
Total jobs 70,000 Renewable 3% of jobs
Energy [R]evolutionTotal jobs 113,000
Renewable 51% of jobs
Growth Without Constraints
Total jobs 70,000 Renewable 3% of jobs
IEA Reference Total jobs 74,000
Renewable 7% of jobs
Energy [R]evolutionTotal jobs 113,000
Renewable 51% of jobsCoal
Gas and oil
Nuclear
Fossil CHP
Biomass
Hydro
Wind
PV
Geothermal
Solar thermal
Ocean
Renewable CHP
Energy [R]evolutionTotal jobs 113,000
Renewable 51% of jobs
Coal
Gas and oil
Nuclear
Fossil CHP
Biomass
Hydro
Wind
PV
Geothermal
Solar thermal
Ocean
Renewable CHP
Energy [R]evolutionTotal jobs 113,000
Renewable 51% of jobs
Renewable and total jobs at 2020*
* Excluding coal exports

Enhanced manufacturing scenario
Standard analysis assumes 20% components for all energy technologies are manufactured in South Africa
In enhanced scenario increased to 50% by 2030 (70% for solar water heating)
Assumes South Africa exports components for 30% of the growth in renewable energy in the rest of Africa by 2030

Energy [R]evolution with enhanced manufacturing – jobs results
0
40,000
80,000
120,000
160,000
200,000
2010 2020 2030 2010 2020 2030 2010 2020 2030 2010 2020 2030
Manufacturingexports
Construction andmanufacturing
Efficiency
Coal exports
Fuel
Operations and maintenance
JOBS
Energy[R]evolution
Energy [R]evolution enhanced manufacturing
Growth Without Constraints
IEA Reference
IEA REF + 56%
65,600 jobs
40,400 jobs
33,700 jobs
GWC + 28%
Compared to

Conclusion The Energy [R]evolution has the potential to create more
employment than business as usual.
Substantial benefit compared to the IEA reference scenario, net increase of 78,000 jobs by 2030 (46,000 in the IEA Reference).
Even if SA does not take action to reduce greenhouse gases, coal exports are vulnerable to action elsewhere.
Developing a strong renewable sector ‘future proofs’ SA economy; enhanced renewable scenario 56% compared to business as usual.
South Africa needs to decide whether to be an importer or an exporter of renewable technology in coming decades.