Embed Size (px)
Citation preview

ISI Tackling problem debt, together
ISI Statistics
Quarter 2 2015

Insolvency Service of Ireland – Statistics Quarter 2 2015 Page 2
Insolvency Service of Ireland
Quarter 2 2015
Table of Contents
1 Foreword ............................................................................................................. 4
2 Case Management – DRN, DSA, PIA ..................................................................... 5
2.1 Increase in Protective Certificates and Arrangements ......................................................... 6
3 Percentage of debt to be written off under a DSA or a PIA .................................. 7
4 Creditor Acceptance/Rejection ............................................................................ 8
5 PIP Support Initiative ......................................................................................... 10
5.1 Summary of claims .............................................................................................................. 10
5.2 PIP Support Initiative claims for failed PIAs in 2015 Q1 ...................................................... 11
5.3 PIP Support Initiative claims for failed DSAs in 2015 Q1 .................................................... 11
6 Qualifying Debt – DRN, DSA, PIA ........................................................................ 12
7 Applicant Profile – DRN, DSA, PIA (from 2013 Q4 to 2015 Q2) ........................... 13
8 Bankruptcy ......................................................................................................... 14
9 Regulation .......................................................................................................... 16
Appendix – Data Tables ............................................................................................ 17

Insolvency Service of Ireland – Statistics Quarter 2 2015 Page 3
THE DEBT RELIEF NOTICE (DRN) PROVIDES FOR THE WRITE OFF OF QUALIFYING DEBT UP TO €20,000,
SUBJECT TO A 3 YEAR SUPERVISION PERIOD.
THE DEBT SETTLEMENT ARRANGEMENT (DSA) PROVIDES FOR THE AGREED SETTLEMENT OF UNSECURED
DEBT WITH NO LIMITS INVOLVED OVER A PERIOD, NORMALLY EXPECTED TO BE 5 YEARS.
THE PERSONAL INSOLVENCY ARRANGEMENT (PIA) PROVIDES FOR THE RESTRUCTURING OR SETTLEMENT
OF SECURED DEBT UP TO €3M AND THE SETTLEMENT OF UNSECURED DEBT OVER A PERIOD, NORMALLY
EXPECTED TO BE 6 YEARS.
IN THE CASE OF A DSA OR PIA, AFTER A PROTECTIVE CERTIFICATE ISSUES, PERSONAL INSOLVENCY
PRACTITIONERS (PIPS) WILL HAVE 70 DAYS IN WHICH TO DEVELOP AN ARRANGEMENT.

Insolvency Service of Ireland – Statistics Quarter 2 2015 Page 4
1 Foreword
I am pleased to publish the statistical report of the Insolvency Service of Ireland (ISI) covering the
second quarter of 2015 (Q2).
This quarter has produced more new cases, more protective certificates and more finalised
arrangements than in previous quarters. However, the number of bankruptcies in Q2 did fall.
Arrangements approved in Q2 are 25% higher than Q1.
Bankruptcy cases are down 43% over the same period.
I am pleased to see that creditor acceptance rates also continue to rise.
Lorcan O'Connor
Director
July 2015
These statistics are for information purposes only. No person should place reliance on the accuracy of the
statistics, nor should they act solely based on them. The statistics are primarily based upon cases created by
duly authorised Approved Intermediaries and Personal Insolvency Practitioners on the ISI Case Management
System, the official registers of Approved Intermediaries and Personal Insolvency Practitioners and the
statement of affairs submitted by those seeking to be declared bankrupt. Figures cover the period 01 April
2015 to 30 June 2015 unless otherwise stated.

Insolvency Service of Ireland – Statistics Quarter 2 2015 Page 5
2 Case Management – DRN, DSA, PIA
107 97
384
588
0
100
200
300
400
500
600
700
2015 Q2
588 new applications in Q2
DRN DSA PIA Total
0
500
1000
1500
2000
2500
3000
2,521 applications since launch
DRN DSA PIA Total
93
251
344
0
50
100
150
200
250
300
350
400
2015 Q2
344 Protective Certificates in Q2
DSA PIA Total
0
200
400
600
800
1000
1200
1400
1600
1,340 Protective Certificates since launch
DSA PIA Total
117
75
150
342
0
50
100
150
200
250
300
350
400
2015 Q2
342 Arrangements in Q2
DRN DSA PIA Total
0
200
400
600
800
1000
1200
1400
1,163 arrangements since launch
DRN DSA PIA Total

Insolvency Service of Ireland – Statistics Quarter 2 2015 Page 6
2.1 Increase in Protective Certificates and Arrangements
Since the ISI began accepting applications, Personal Insolvency Practitioners and Approved
Intermediaries have created more than 2,500 cases. These numbers do not include cases created
on the ISI system and subsequently withdrawn. Approved arrangements reflect the number of
proposals approved by creditors and/or by Court.
Note: Population data taken from the Central Statistics Office Population of each County and City, 2011 Available on their website at http://www.cso.ie/multiquicktables/quickTables.aspx?id=cna23
10
19 15
64
13
108
18 15
44
9 13
1
12 10
22
9
46
12 13 8
4
19 27
21
30 26
Q2 DRN, DSA, PIA by county
1.83
2.60
1.28 1.23
0.81 0.85
0.72
1.03
2.09
0.94
1.61
0.31
0.63
2.56
1.79
0.69
2.50
1.98
1.70
1.25
0.61
1.20
2.37 2.44
2.06
1.90
1.28
Q2 DRN, DSA, PIA by county (rate per 10,000 population)

Insolvency Service of Ireland – Statistics Quarter 2 2015 Page 7
3 Percentage of debt to be written off under a DSA or a PIA
The three charts below set out the average percentage and the range of debt to be written-off
within DSA and PIA arrangements since commencement. In each case, the arrangement is tailored
to the debtor’s individual circumstances and on completion of the arrangement the debtor is
returned to solvency.
0
50
100
150
200
250
0% >0-10% >10-20% >20-30% >30-40% >40-50% >50-60% >60-70% >70-80% >80-90% >90%
Nu
mb
er
of
Cas
es
Range of secured debt write-off
PIA - secured debt Average write-off per case = 21.0%
0
50
100
150
200
250
0% >0-10% >10-20% >20-30% >30-40% >40-50% >50-60% >60-70% >70-80% >80-90% >90%
Nu
mb
er
of
Cas
es
Range of unsecured debt write-off
PIA - unsecured debt Average write-off per case = 83.2%
0
10
20
30
40
50
60
70
0% >0-10% >10-20% >20-30% >30-40% >40-50% >50-60% >60-70% >70-80% >80-90% >90%
Nu
mb
er
of
Cas
es
Range of unsecured debt write-off
DSA - unsecured debt Average write-off per case = 78.6%
Insolvency Service of Ireland – Statistics Quarter 2 2015 Page 8
4 Creditor Acceptance/Rejection
The ISI has undertaken an analysis of protective certificates issued and the extent to which they
have led to a solution that has returned insolvent debtors to solvency. Once a protective
certificate has issued, one of the following outcomes is possible:
PIP successfully uses the protective certificate period of 70 days to reach agreement
between the debtor and his or her creditors. This is ultimately reflected in a 'YES' vote at a
creditors meeting
PIP identifies and implements an alternative solution for the debtor that does not
necessitate a DSA or PIA. No creditors meeting or vote is held
PIP is unsuccessful in reaching an agreement between the debtor and his or her creditors.
This is ultimately reflected in a 'NO' vote at a creditors meeting or, if the PIP is of the view
that a 'NO' vote is inevitable, the PIP may not proceed with a creditors meeting
In collating these figures, where a protective certificate has expired and the ISI is unaware of the
outcome, it is assumed that an alternative solution has not been put in place. This conservative
approach may be overstating the number of cases that have been unsuccessful.
Acceptance rates in Q2 are higher than in Q1 for both DSAs and PIAs.

Insolvency Service of Ireland – Statistics Quarter 2 2015 Page 9
DSA PIA Total
YES
YES vote 85.72% 72.11% 75.84%
Alternative solution 0.79% 1.05% 0.98%
Successful outcome 86.51% 73.16% 76.82%
NO
NO vote 11.51% 22.04% 19.15%
Rejected prior to creditors meeting 0.0% 1.05% 0.76%
Protective Certificate expired 1.98% 3.75% 3.27%
Unsuccessful outcome 13.49% 26.84% 23.18%
Yes vote
Alternative solutions
No vote
Rejected prior to creditors meeting
Protective Certificate expired
Creditor acceptance/rejection (from 2013 Q4 to 2015 Q2)
Insolvency Service of Ireland – Statistics Quarter 2 2015 Page 10
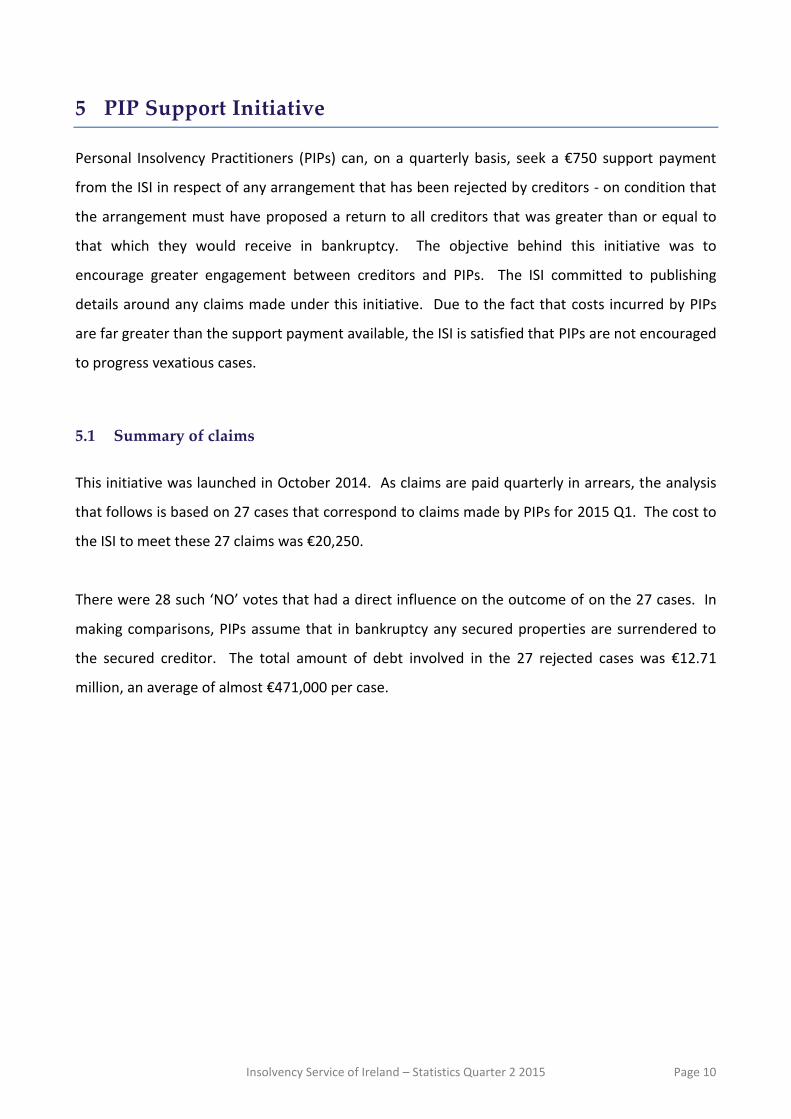
5 PIP Support Initiative
Personal Insolvency Practitioners (PIPs) can, on a quarterly basis, seek a €750 support payment
from the ISI in respect of any arrangement that has been rejected by creditors - on condition that
the arrangement must have proposed a return to all creditors that was greater than or equal to
that which they would receive in bankruptcy. The objective behind this initiative was to
encourage greater engagement between creditors and PIPs. The ISI committed to publishing
details around any claims made under this initiative. Due to the fact that costs incurred by PIPs
are far greater than the support payment available, the ISI is satisfied that PIPs are not encouraged
to progress vexatious cases.
5.1 Summary of claims
This initiative was launched in October 2014. As claims are paid quarterly in arrears, the analysis
that follows is based on 27 cases that correspond to claims made by PIPs for 2015 Q1. The cost to
the ISI to meet these 27 claims was €20,250.
There were 28 such ‘NO’ votes that had a direct influence on the outcome of on the 27 cases. In
making comparisons, PIPs assume that in bankruptcy any secured properties are surrendered to
the secured creditor. The total amount of debt involved in the 27 rejected cases was €12.71
million, an average of almost €471,000 per case.

Insolvency Service of Ireland – Statistics Quarter 2 2015 Page 11
Tables 5.2 and 5.3 list those creditors whose vote had a direct influence on the outcome of a DSA
or PIA proposal in 2015 Q1. The tables identify the frequency at which creditors exercise their
right to vote against a proposal made by a PIP and as a percentage of their total votes. This
analysis of ‘NO’ votes only covers cases where PIPs have claimed under the €750 PIP Support
Initiative.
5.2 PIP Support Initiative claims for failed PIAs in 2015 Q1
2015 Q1 PIAs Number of ‘NO’ Votes Creditors ‘NO’ votes as a %
of their total Q1 votes1
Pepper Finance 4 36%
Shoreline Residential 2 25%
Permanent TSB 7 18%
Danske Bank 1 17%
KBC 2 7%
AIB 2 6%
Ulster Bank 1 5%
Bank of Ireland 1 4%
Bank of Scotland 0 0%
EBS 0 0%
MARS Capital 0 0%
Tanager 0 0%
Others 1 11%
Totals 21 10%
5.3 PIP Support Initiative claims for failed DSAs in 2015 Q1
2015 Q1 DSAs Number of ‘NO’ Votes Creditors ‘NO’ votes as a %
of their total Q1 votes1
Danske Bank 1 100%
Credit Unions 4 29%
Permanent TSB 1 20%
Bank of Ireland 1 8%
AIB 0 0%
AvantCard 0 0%
EBS 0 0%
KBC 0 0%
Ulster Bank 0 0%
Others 0 0%
Totals 7 13%
1 For example, there were 14 DSA cases where the credit unions’ votes had a direct influence on the outcome of the
creditors meeting. They voted ‘YES’ in 10 and ‘NO’ in 4 of those cases. Therefore, the 4 ‘NO’ votes accounted for 28.57% of the total credit union votes (rounded to 29% in table 5.3).

Insolvency Service of Ireland – Statistics Quarter 2 2015 Page 12
6 Qualifying Debt – DRN, DSA, PIA
The total debt involved in the 588 new cases created in Q2 is approximately €262 million. You can
find a breakdown of the type of debt in the chart above and the table below.
Type of debt Value of debt (millions) As % of total
PPR Mortgages € 97.302m 37.16%
BTL Mortgages € 87.909m 33.57%
Financial Institutions € 57.815m 22.08%
Trade Creditors € 6.131m 2.34%
Credit Unions € 3.965m 1.52%
Revenue € 3.939m 1.50%
Other debt* € 4.802m 1.83%
Total Qualifying Debt € 261.863m 100.00%
PPR Mortgages
BTL Mortgages
Financial Institutions
Credit Union
Revenue
Trade Creditors Other*
€262 million debt in Q2
*Other debt includes connected creditors, contingent debt, hire purchase, personal guarantees, utilities,
store cards/catalogues and professional fees.

Insolvency Service of Ireland – Statistics Quarter 2 2015 Page 13
7 Applicant Profile – DRN, DSA, PIA (from 2013 Q4 to 2015 Q2)
Public Sector 10.8%
Private Sector 39.3%
Housewife/ husband
4.6%
Other 2.6%
Retired 2.8%
Self-employed
12.0%
Student 0.9%
Un-employed
27.0%
Occupation Divorced/ Separated
14%
Single 22%
Married/ Civil Partner
63%
Widow/er 1%
Status
18 - 24 0.1%
25 - 34 10.3%
35 - 44 39.9%
45 - 54 31.8%
55 - 64 15.4%
65 + 2.5%
Age Profile of Debtors
Male 53% Female
47%
Gender
Individual (DRN, DSA,
PIA) 56%
Joint (DSA, PIA)
5%
Interlocking (PIA only)
39%
Types of Application
An individual application is an application with a
sole debtor.
Where there are two (or more) debtors, who are
jointly liable for all of the debts to be included in a
DSA or a PIA arrangement, a joint application is
appropriate.
An interlocking application would be appropriate
where two (or more) PIAs are to be administered
in common; usually because of the financial
relationship of the debtors involved. Examples
would be a couple or business partners, where
they are jointly liable for some - but not all - of the
debts to be included in the PIA arrangement.

Insolvency Service of Ireland – Statistics Quarter 2 2015 Page 14
8 Bankruptcy
66 98
137 147 162
92
448
254
0
50
100
150
200
250
300
350
400
450
500
2014 Q1 2014 Q2 2014 Q3 2014 Q4 2015 Q1 2015 Q2 2014 2015
Bankruptcy adjudications
Secured 89.43%
Unsecured 10.57%
€1.4 billion bankruptcy debt in Q2
The total debt involved in bankruptcy adjudications for Q2 is approximately €1.4 billion. This
is made up of 89.43% secured debt and 10.57% unsecured debt. In the case of secured debt,
it is likely that current market values of securities are significantly below debt levels.

Insolvency Service of Ireland – Statistics Quarter 2 2015 Page 15
Note: Population data taken from the Central Statistics Office Population of each County and City, 2011
Available on their website at http://www.cso.ie/multiquicktables/quickTables.aspx?id=cna23
1 0
2
7
5
19
4 3
7
3
1 1 2
0 0 1
5
1
4
1 1
3 4
3
8
6
Q2 bankruptcies by county
0.18
0
0.17
0.13
0.31
0.15 0.16
0.21
0.33 0.31
0.12
0.31
0.10
0 0
0.08
0.27
0.17
0.52
0.16 0.15
0.19
0.35 0.35
0.55
0.44
0.20
Q2 bankruptcies by county (rate per 10,000 population)

Insolvency Service of Ireland – Statistics Quarter 2 2015 Page 16
9 Regulation
There are 257 Personal Insolvency Practitioners and Responsible Persons available to meet
debtors, on a face-to-face basis, to solve their debt problems.
51
95
128 138 141 138
143 146
0
20
40
60
80
100
120
140
160
2013 Q3 2013 Q4 2014 Q1 2014 Q2 2014 Q3 2014 Q4 2015 Q1 2015 Q2
Personal Insolvency Practitioners
35
55
73
87 94
99 104
111
0
20
40
60
80
100
120
2013 Q3 2013 Q4 2014 Q1 2014 Q2 2014 Q3 2014 Q4 2015 Q1 2015 Q2
Responsible Persons
There are currently 146 Personal Insolvency Practitioners on the ISI register.
50 MABS companies and the Irish Mortgage Holders Association (IMHO) have been
authorised as Approved Intermediaries. There are 111 Responsible Persons linked to these
authorisations.

Insolvency Service of Ireland – Statistics Quarter 2 2015 Page 17
Appendix – Data Tables
Case Management
Bankruptcy
Period Adjudications
2014 Q1 66
2014 Q2 98
2014 Q3 137
2014 Q4 147
2015 Q1 162
2015 Q2 92
2013 58
2014 448
2015 254
Percentage change; latest quarter compared with:
2015 Q1 -43%
2014 Q2 -6%
Total DRN DSA PIA Total DSA PIA Total DRN DSA PIA
2013 Q4 112 0 29 83 11 5 6 1 0 1 0
2014 Q1 315 75 57 183 59 24 35 55 44 6 5
2014 Q2 315 74 56 185 152 46 106 124 67 30 27
2014 Q3 306 76 52 178 180 31 149 131 61 22 48
2014 Q4 395 72 78 245 270 52 218 237 79 39 119
2015 Q1 490 104 92 294 324 90 234 273 101 43 129
2015 Q2 588 107 97 384 344 93 251 342 117 75 150
2013 112 0 29 83 11 5 6 1 0 1 0
2014 1,331 297 243 791 661 153 508 547 251 97 199
2015 1,078 211 189 678 668 183 485 615 218 118 279
Total 2,521 508 461 1,552 1,340 341 999 1,163 469 216 478
2015 Q1 20% 3% 5% 31% 6% 3% 7% 25% 16% 74% 16%
2014 Q2 87% 45% 73% 108% 126% 102% 137% 176% 75% 150% 456%
Case Management Quarterly Statistics
Period
1 New applications adjusted for subsequently withdrawn cases2 'Arrangements Approved' include those approved by creditors and/or by court
Percentage change, 2015 Q2 compared with:
New Applications1 Protective Certificates Arrangements Approved2

Insolvency Service of Ireland – Statistics Quarter 2 2015 Page 18
Information line and website data table
Period Telephone Emails Website
Visits Total
Contacts Website
Pageviews PDF
Downloads
Q2 2013 1,828 725 34,611 37,164 203,487 11,201
Q3 2013 2,960 905 50,830 54,695 281,606 17,580
Q4 2013 2,326 339 31,198 33,863 173,567 9,836
Q1 2014 2,814 498 38,645 41,957 229,380 13,150
Q2 2014 2,852 639 32,231 35,722 212,758 9,462
Q3 2014 2,513 825 32,160 35,498 230,019 6,360
Q4 2014 3,186 1,041 40,737 44,964 248,510 6,639
Q1 2015 4,041 1,169 65,559 70,769 277,346 14,245
Q2 2015 3,043 1,447 42,014 46,504 250,518 9,708
2013 7,114 1,969 116,639 125,722 658,660 38,617
2014 11,365 3,003 143,773 158,141 920,667 35,611
2015 7,084 2,616 107,573 117,273 527,864 23,953
Total 25,563 7,588 367,985 401,136 2,107,191 98,181