Embed Size (px)
Citation preview
Isle of Man Census Report 2011
Economic Affairs Division Isle of Man Government Treasury
Laid before Tynwald April 2012 £4.50
GD0009/12
1
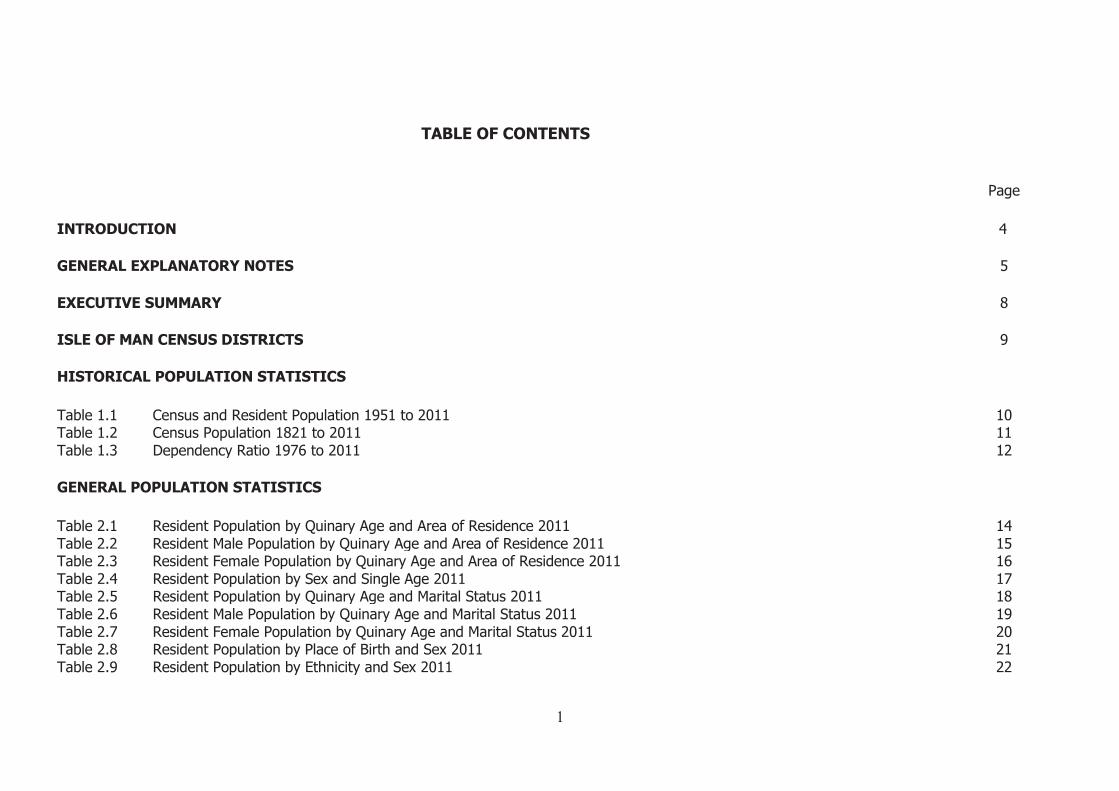
TABLE OF CONTENTS Page INTRODUCTION 4 GENERAL EXPLANATORY NOTES 5 EXECUTIVE SUMMARY 8 ISLE OF MAN CENSUS DISTRICTS 9 HISTORICAL POPULATION STATISTICS Table 1.1 Census and Resident Population 1951 to 2011 10 Table 1.2 Census Population 1821 to 2011 11 Table 1.3 Dependency Ratio 1976 to 2011 12 GENERAL POPULATION STATISTICS Table 2.1 Resident Population by Quinary Age and Area of Residence 2011 14 Table 2.2 Resident Male Population by Quinary Age and Area of Residence 2011 15 Table 2.3 Resident Female Population by Quinary Age and Area of Residence 2011 16 Table 2.4 Resident Population by Sex and Single Age 2011 17 Table 2.5 Resident Population by Quinary Age and Marital Status 2011 18 Table 2.6 Resident Male Population by Quinary Age and Marital Status 2011 19 Table 2.7 Resident Female Population by Quinary Age and Marital Status 2011 20 Table 2.8 Resident Population by Place of Birth and Sex 2011 21 Table 2.9 Resident Population by Ethnicity and Sex 2011 22
2
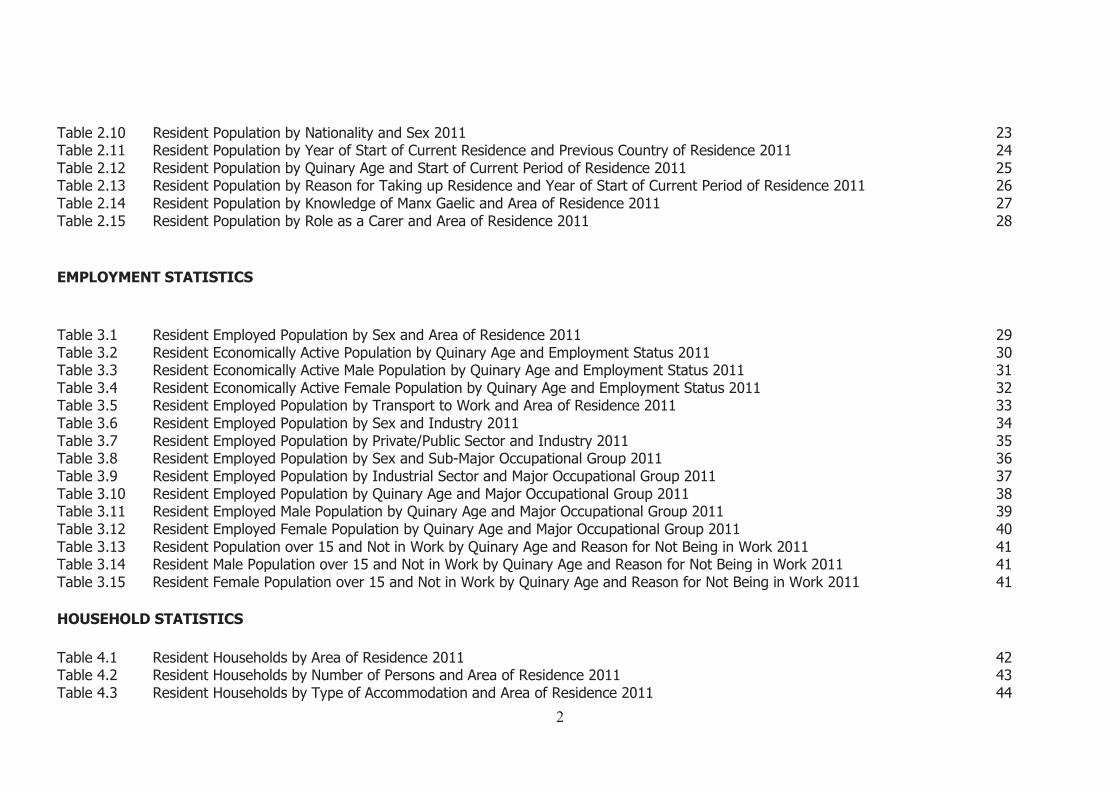
Table 2.10 Resident Population by Nationality and Sex 2011 23 Table 2.11 Resident Population by Year of Start of Current Residence and Previous Country of Residence 2011 24 Table 2.12 Resident Population by Quinary Age and Start of Current Period of Residence 2011 25 Table 2.13 Resident Population by Reason for Taking up Residence and Year of Start of Current Period of Residence 2011 26 Table 2.14 Resident Population by Knowledge of Manx Gaelic and Area of Residence 2011 27 Table 2.15 Resident Population by Role as a Carer and Area of Residence 2011 28 EMPLOYMENT STATISTICS Table 3.1 Resident Employed Population by Sex and Area of Residence 2011 29 Table 3.2 Resident Economically Active Population by Quinary Age and Employment Status 2011 30 Table 3.3 Resident Economically Active Male Population by Quinary Age and Employment Status 2011 31 Table 3.4 Resident Economically Active Female Population by Quinary Age and Employment Status 2011 32 Table 3.5 Resident Employed Population by Transport to Work and Area of Residence 2011 33 Table 3.6 Resident Employed Population by Sex and Industry 2011 34 Table 3.7 Resident Employed Population by Private/Public Sector and Industry 2011 35 Table 3.8 Resident Employed Population by Sex and Sub-Major Occupational Group 2011 36 Table 3.9 Resident Employed Population by Industrial Sector and Major Occupational Group 2011 37 Table 3.10 Resident Employed Population by Quinary Age and Major Occupational Group 2011 38 Table 3.11 Resident Employed Male Population by Quinary Age and Major Occupational Group 2011 39 Table 3.12 Resident Employed Female Population by Quinary Age and Major Occupational Group 2011 40 Table 3.13 Resident Population over 15 and Not in Work by Quinary Age and Reason for Not Being in Work 2011 41 Table 3.14 Resident Male Population over 15 and Not in Work by Quinary Age and Reason for Not Being in Work 2011 41 Table 3.15 Resident Female Population over 15 and Not in Work by Quinary Age and Reason for Not Being in Work 2011 41 HOUSEHOLD STATISTICS Table 4.1 Resident Households by Area of Residence 2011 42 Table 4.2 Resident Households by Number of Persons and Area of Residence 2011 43 Table 4.3 Resident Households by Type of Accommodation and Area of Residence 2011 44
3
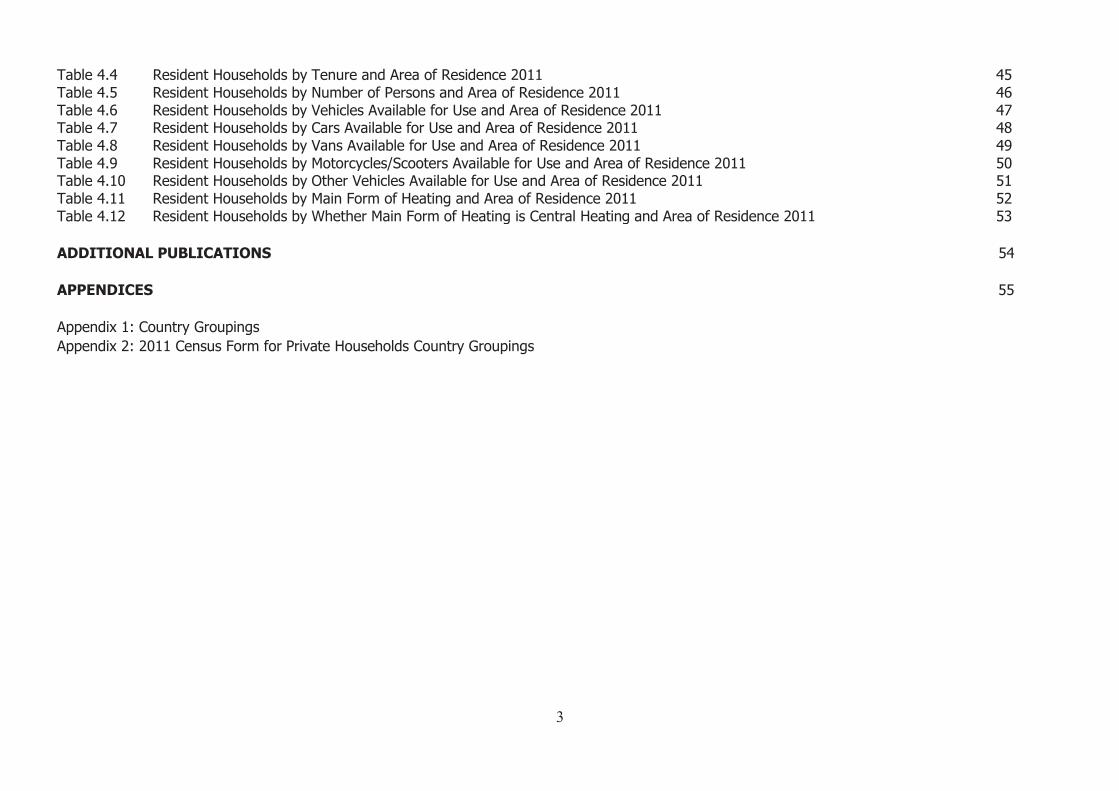
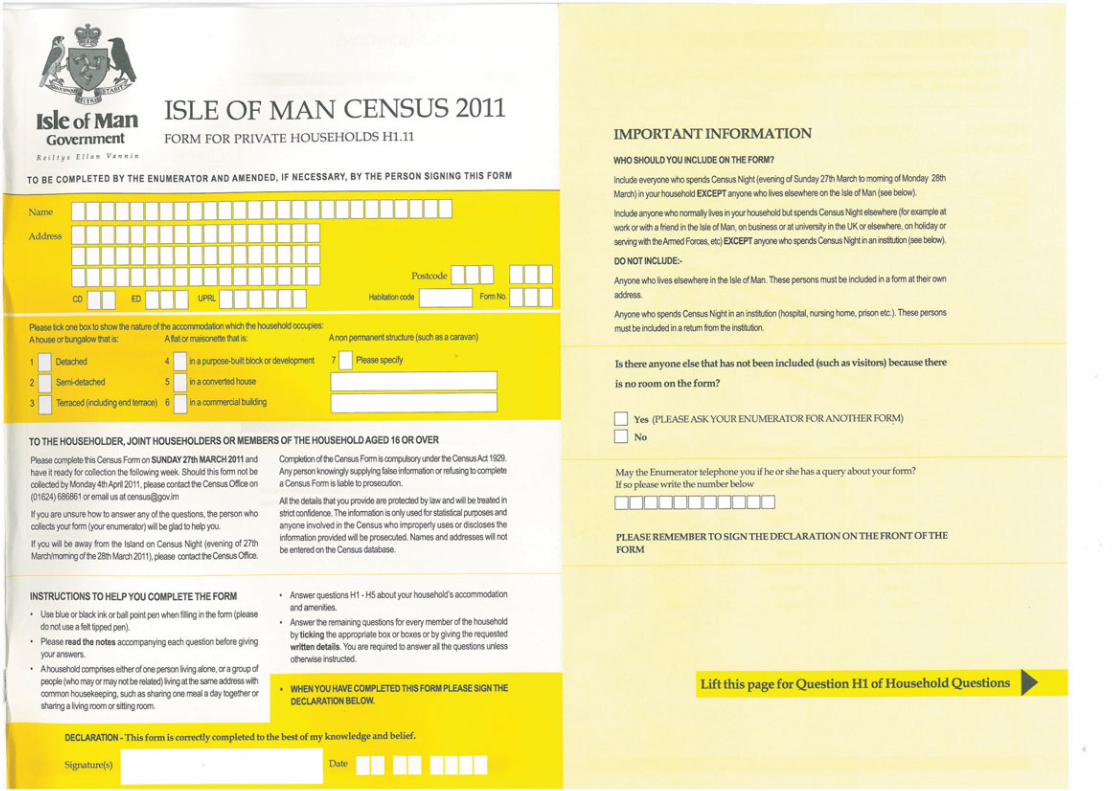
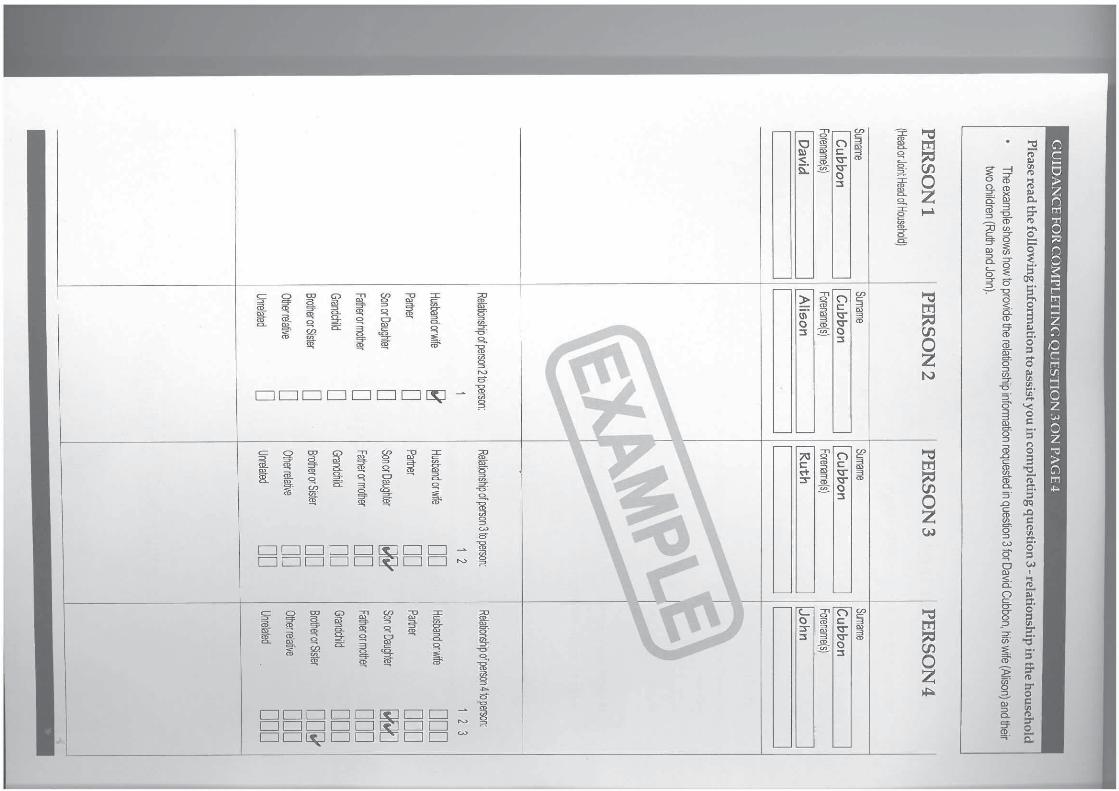
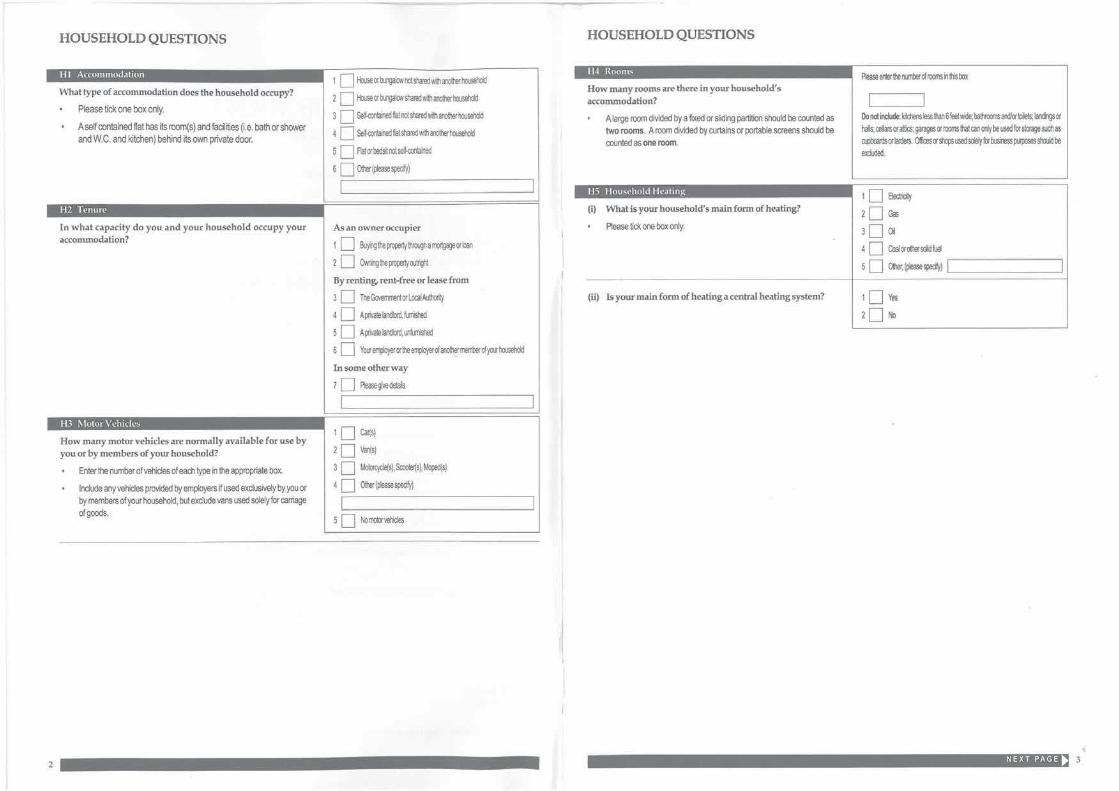
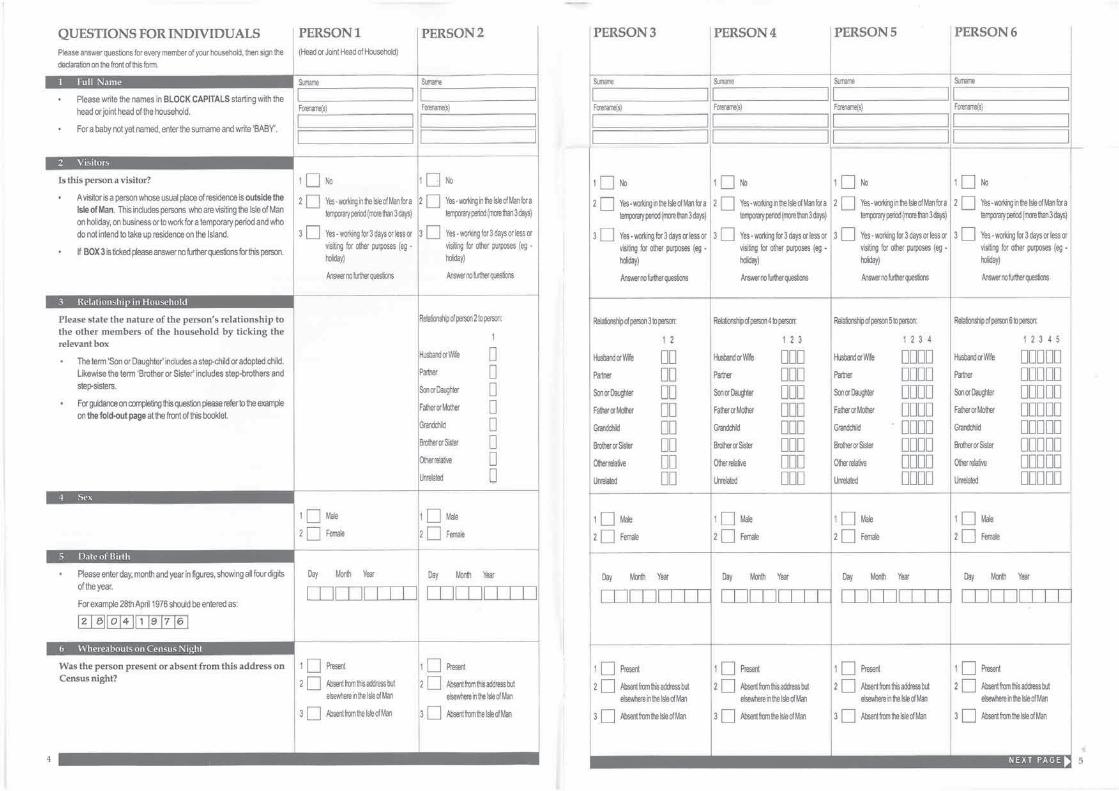
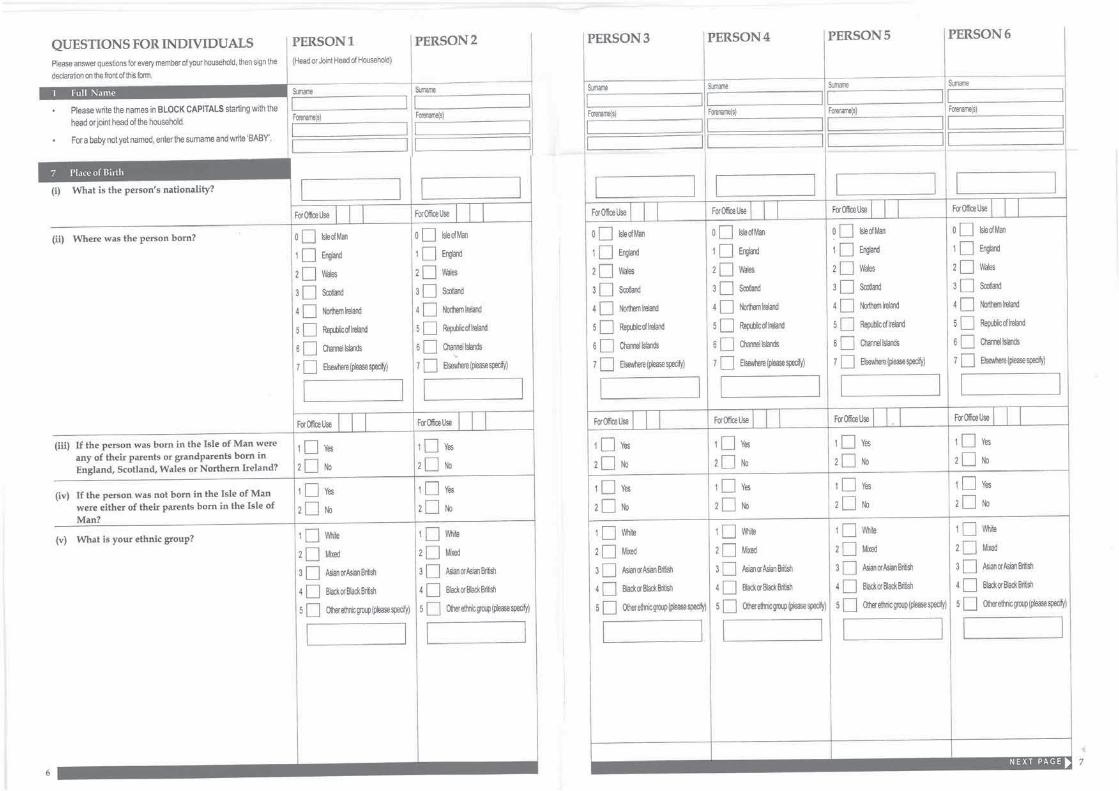
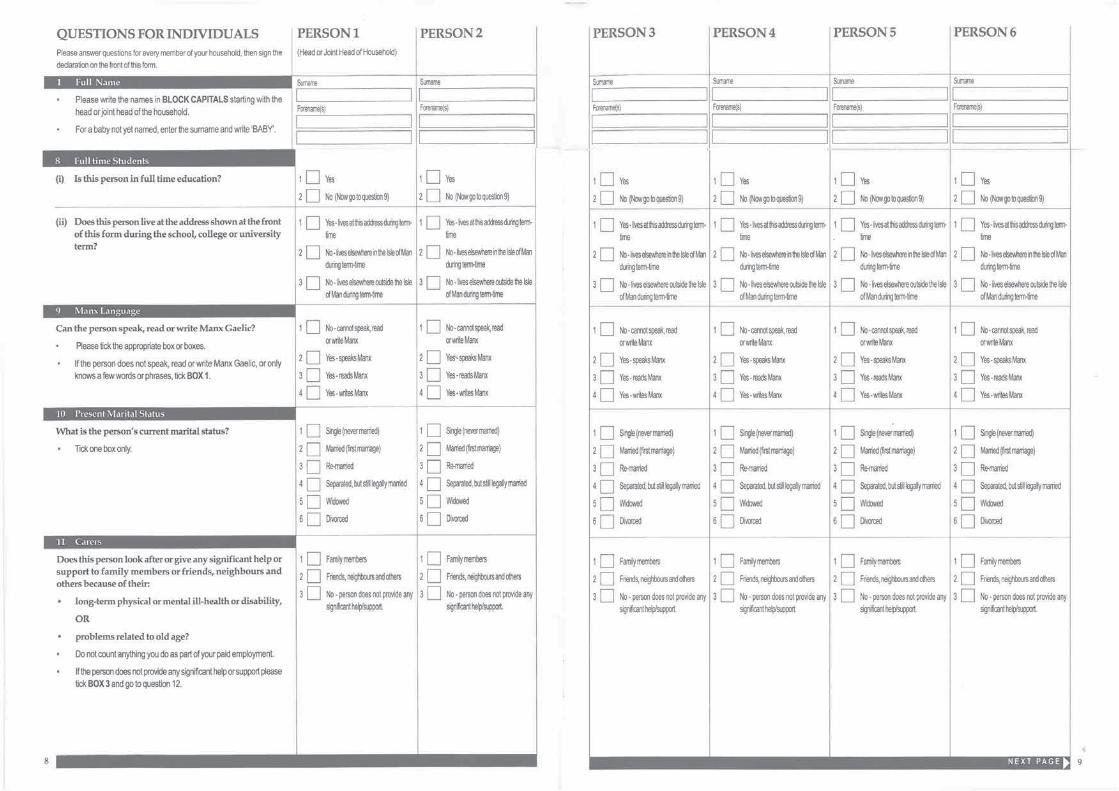
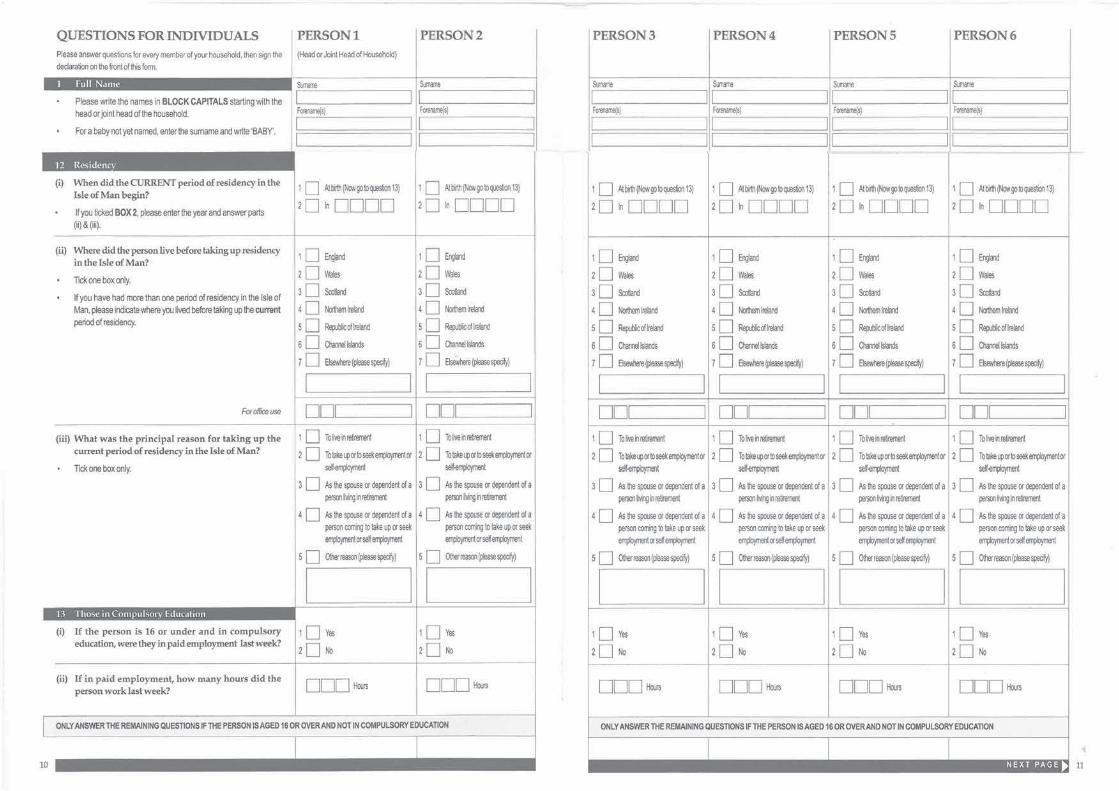
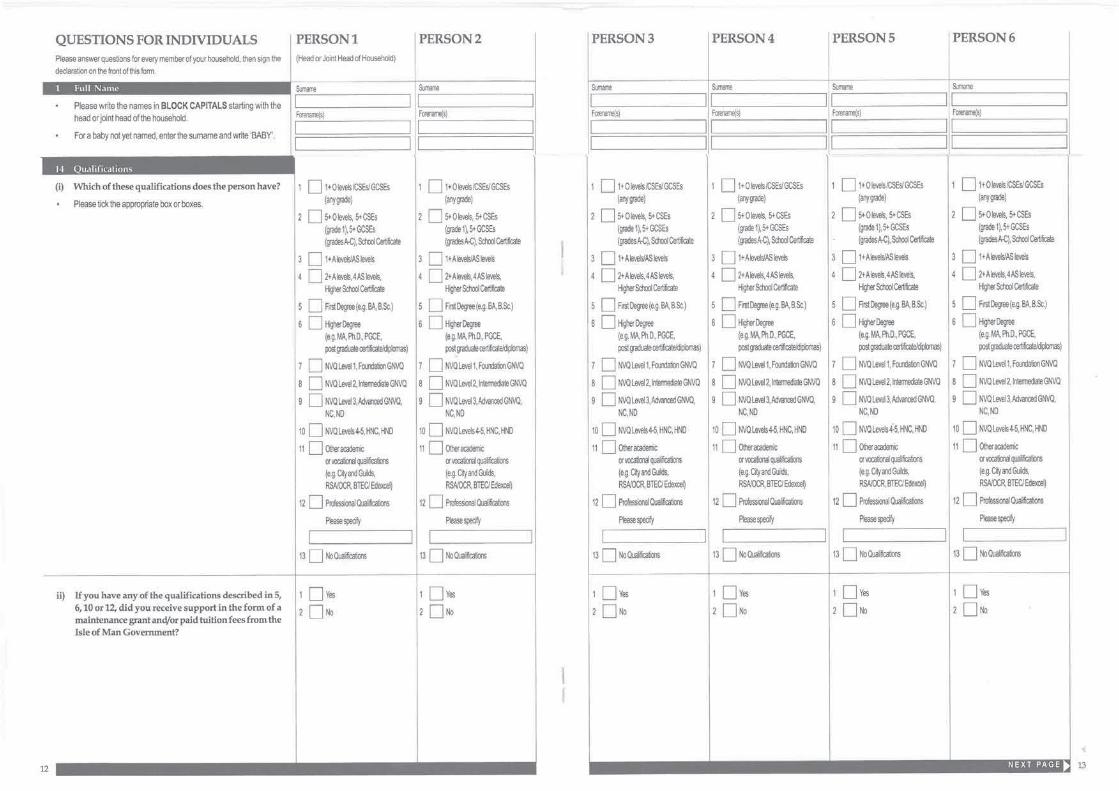
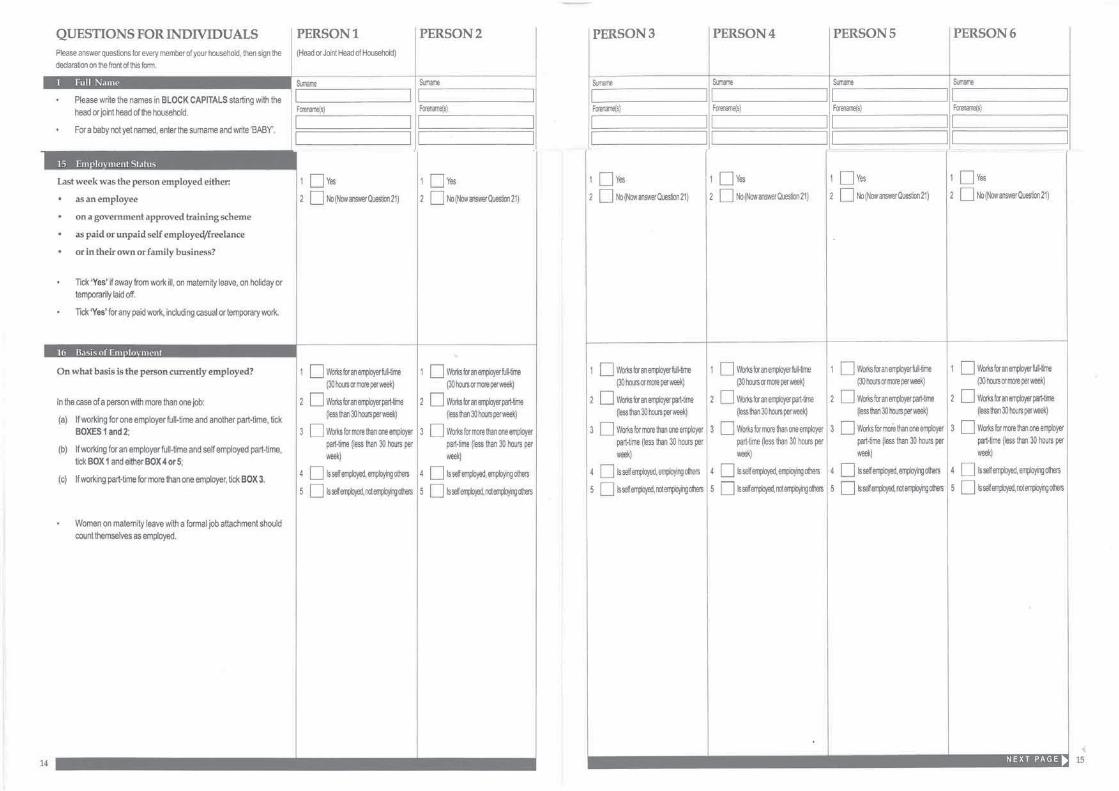
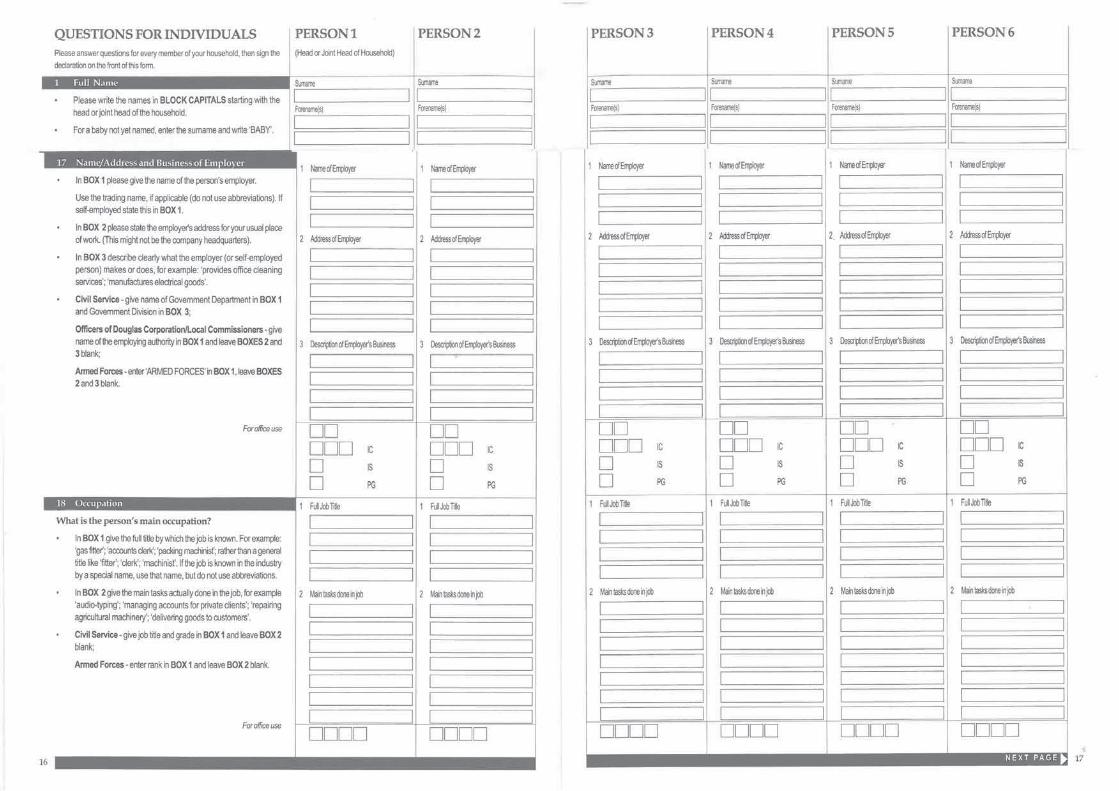
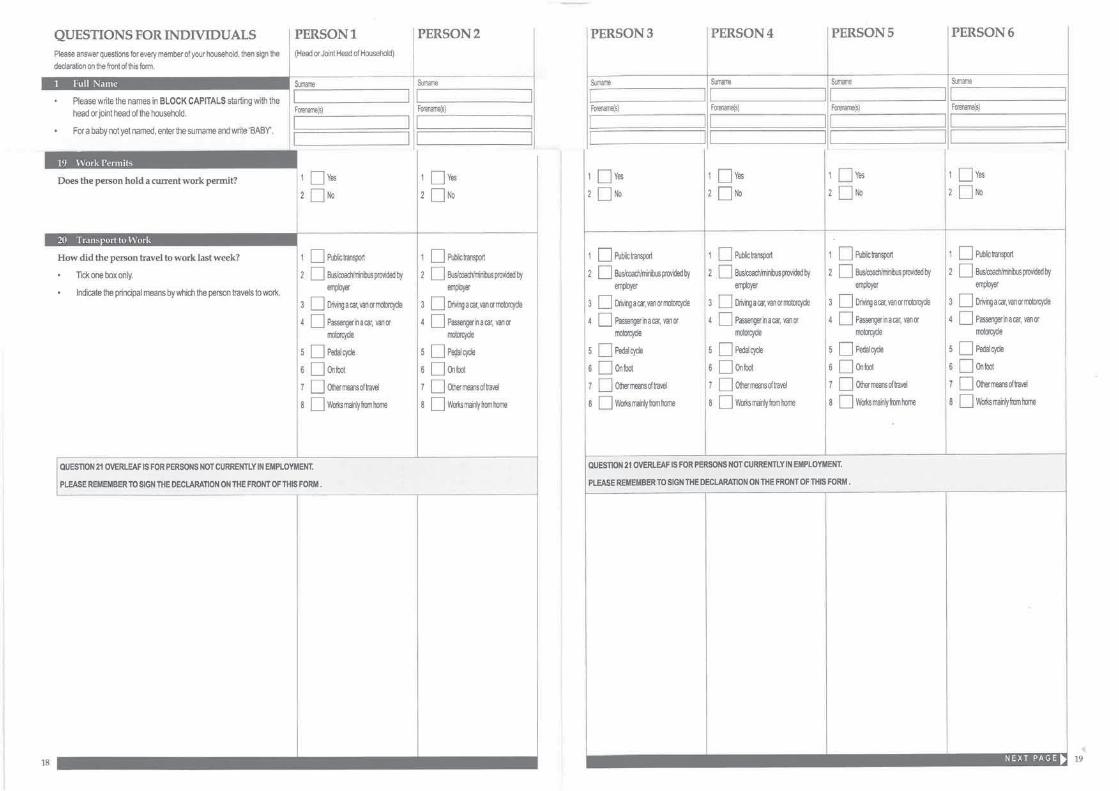
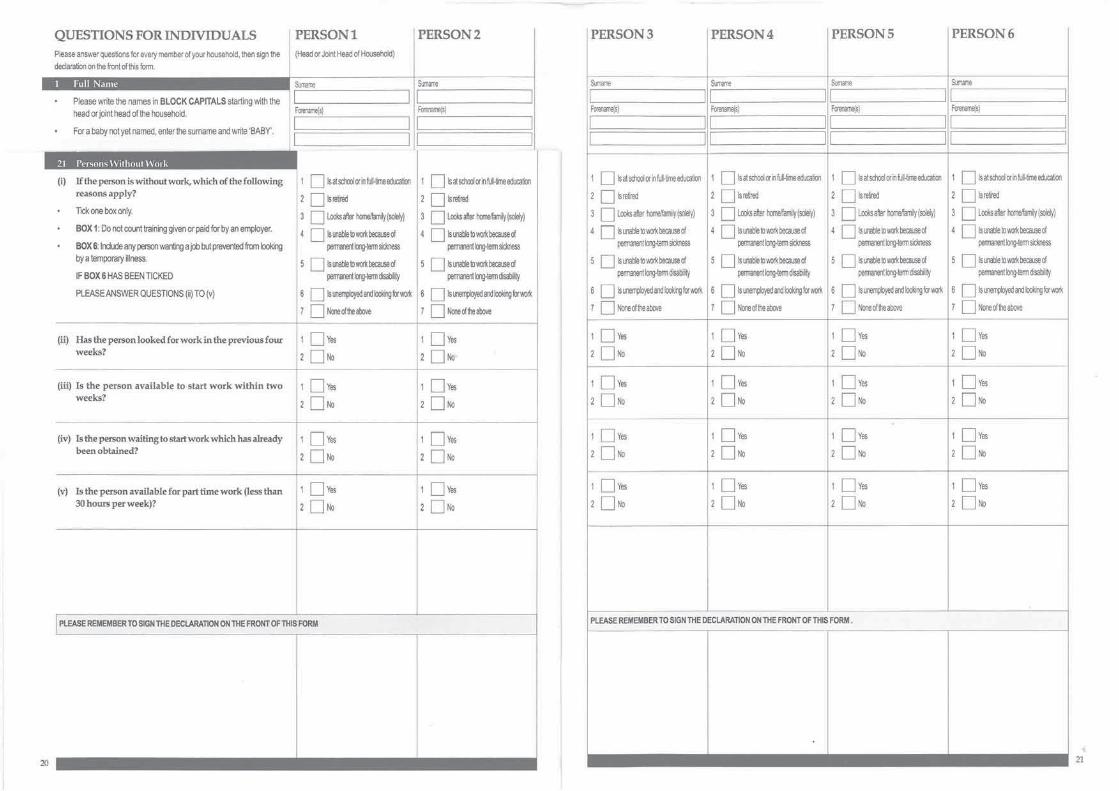
Table 4.4 Resident Households by Tenure and Area of Residence 2011 45 Table 4.5 Resident Households by Number of Persons and Area of Residence 2011 46 Table 4.6 Resident Households by Vehicles Available for Use and Area of Residence 2011 47 Table 4.7 Resident Households by Cars Available for Use and Area of Residence 2011 48 Table 4.8 Resident Households by Vans Available for Use and Area of Residence 2011 49 Table 4.9 Resident Households by Motorcycles/Scooters Available for Use and Area of Residence 2011 50 Table 4.10 Resident Households by Other Vehicles Available for Use and Area of Residence 2011 51 Table 4.11 Resident Households by Main Form of Heating and Area of Residence 2011 52 Table 4.12 Resident Households by Whether Main Form of Heating is Central Heating and Area of Residence 2011 53 ADDITIONAL PUBLICATIONS 54 APPENDICES 55 Appendix 1: Country Groupings Appendix 2: 2011 Census Form for Private Households Country Groupings
4
INTRODUCTION
This report contains information gathered in the 2011 Isle of Man Census, which was held on 27th / 28th March 2011. It is the most recent in a series dating back to 1821. A full Census is held every ten years and is a comprehensive survey of people and households in the Island. The 2011 Census was conducted by the Economic Affairs Division of the Treasury under the authority of the Census Act 1929. This publication is available via the Internet at www.gov.im/treasury/economic/census. Should any further analysis be required a written request should be submitted to the address below and we will endeavour to provide any such figures, subject to practicality (including resource requirement) and confidentiality. Peter Hannay Senior Research Officer Economic Affairs Division, Treasury Isle of Man Government Illiam Dhone House 2 Circular Road Douglas Isle of Man IM1 1PQ Tel: (01624) 685750 Fax: (01624) 685747 email: [email protected]
5
GENERAL EXPLANATORY NOTES
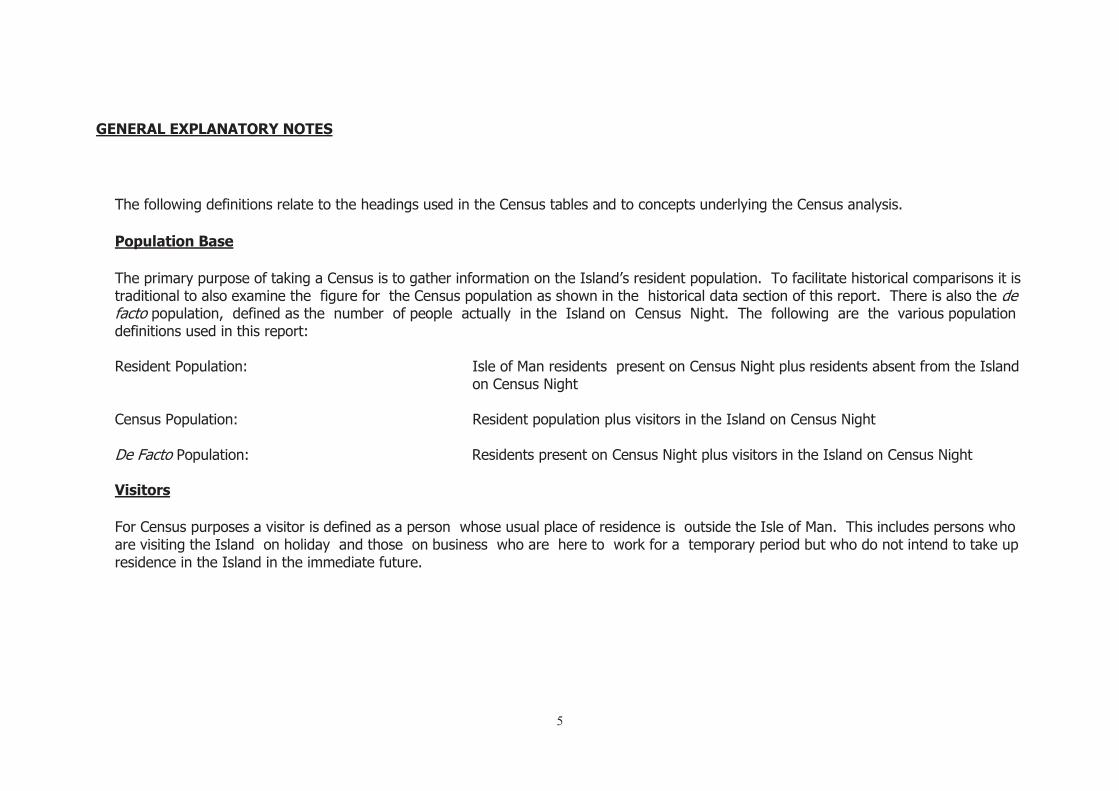
The following definitions relate to the headings used in the Census tables and to concepts underlying the Census analysis. Population Base
The primary purpose of taking a Census is to gather information on the Island’s resident population. To facilitate historical comparisons it is traditional to also examine the figure for the Census population as shown in the historical data section of this report. There is also the de facto population, defined as the number of people actually in the Island on Census Night. The following are the various population definitions used in this report: Resident Population: Isle of Man residents present on Census Night plus residents absent from the Island on Census Night Census Population: Resident population plus visitors in the Island on Census Night De Facto Population: Residents present on Census Night plus visitors in the Island on Census Night Visitors For Census purposes a visitor is defined as a person whose usual place of residence is outside the Isle of Man. This includes persons who are visiting the Island on holiday and those on business who are here to work for a temporary period but who do not intend to take up residence in the Island in the immediate future.
6
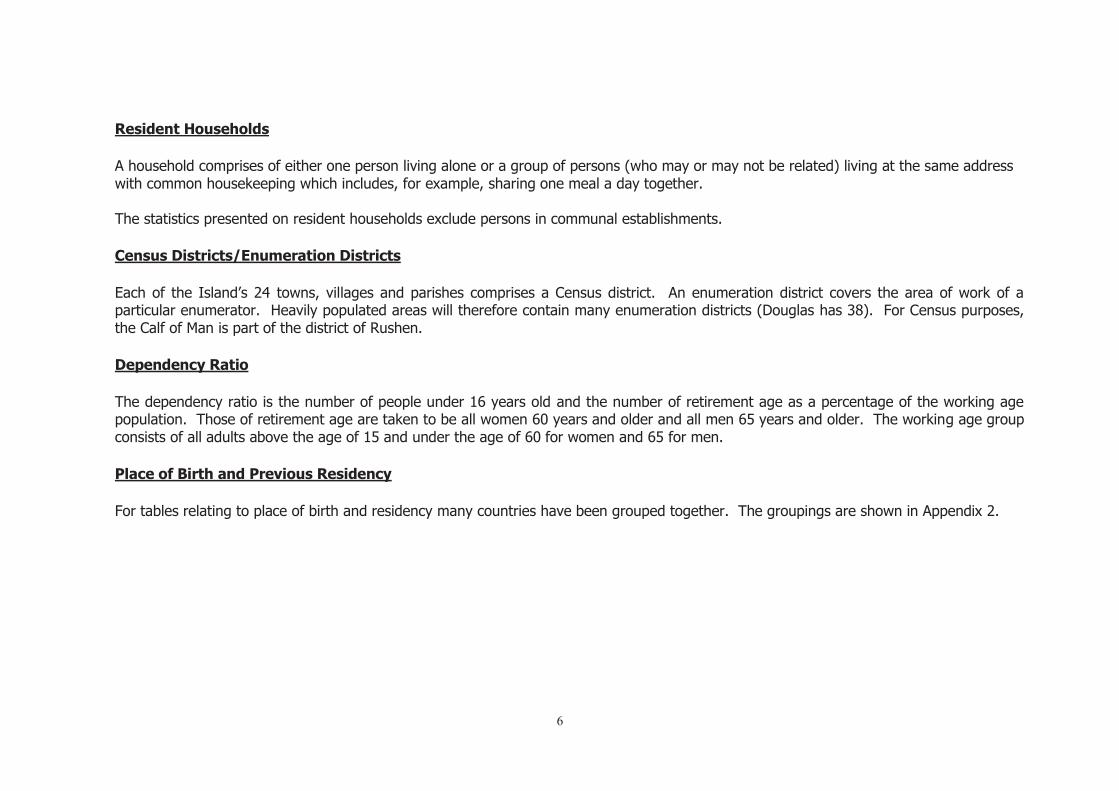
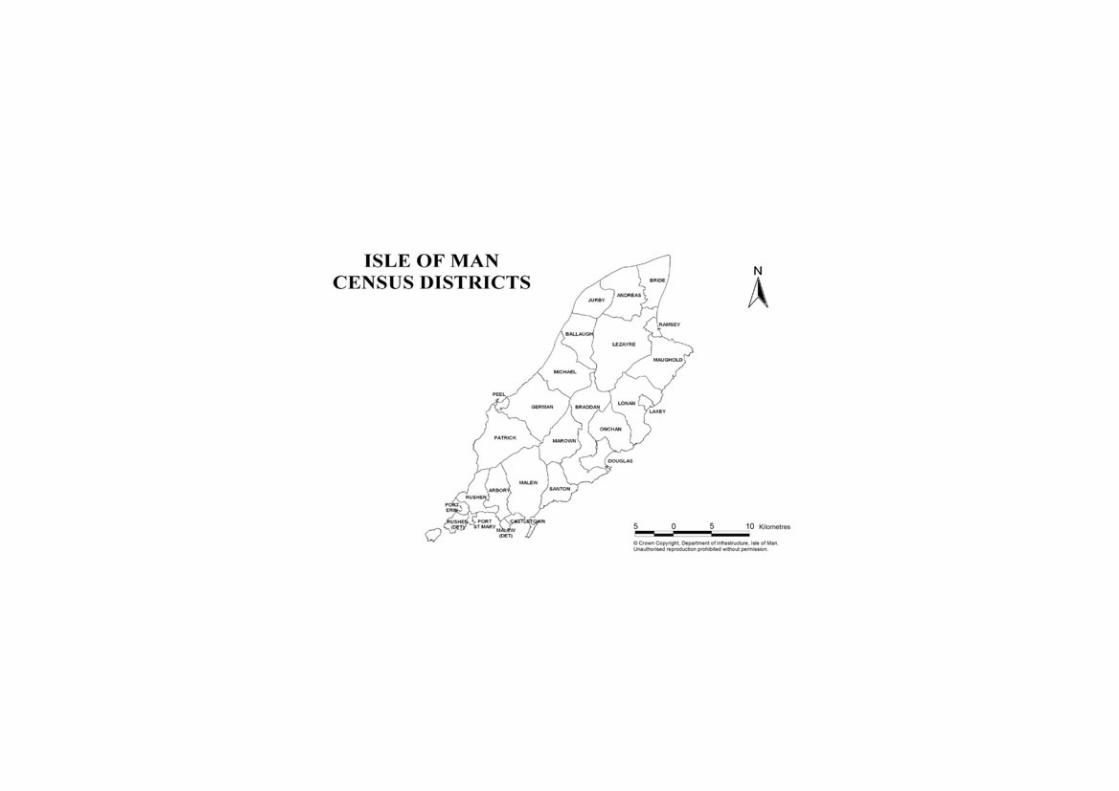
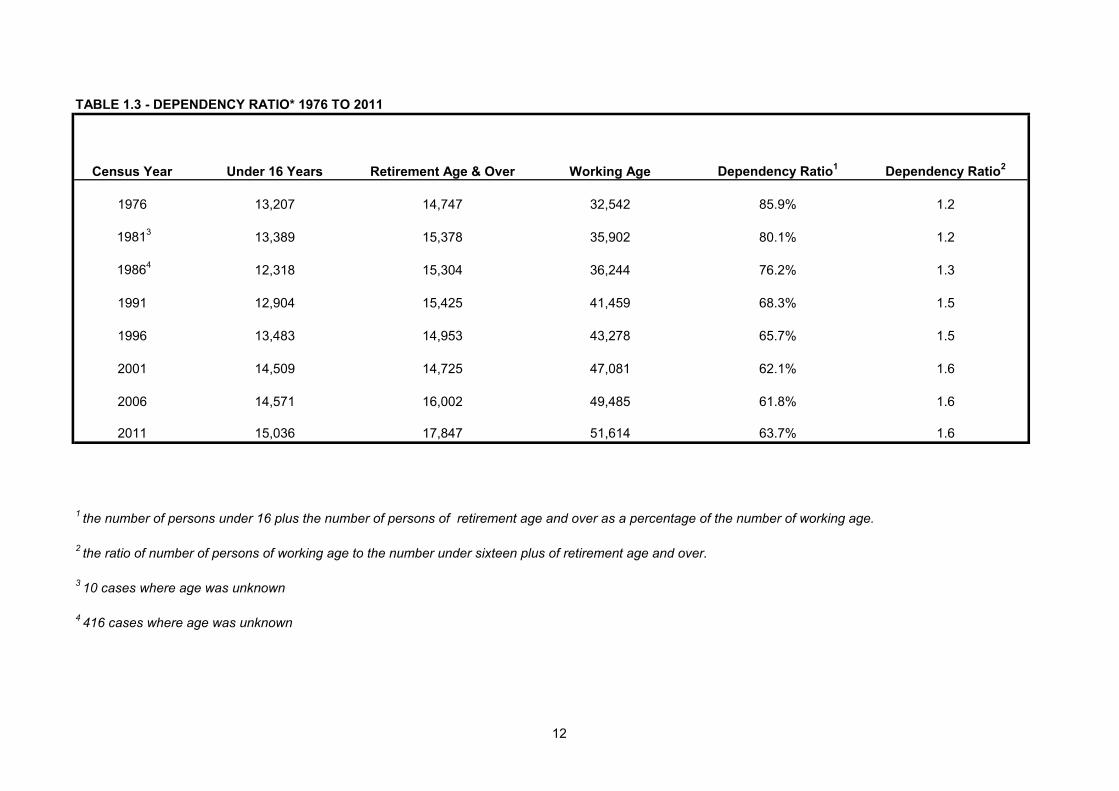
Resident Households A household comprises of either one person living alone or a group of persons (who may or may not be related) living at the same address with common housekeeping which includes, for example, sharing one meal a day together. The statistics presented on resident households exclude persons in communal establishments. Census Districts/Enumeration Districts Each of the Island’s 24 towns, villages and parishes comprises a Census district. An enumeration district covers the area of work of a particular enumerator. Heavily populated areas will therefore contain many enumeration districts (Douglas has 38). For Census purposes, the Calf of Man is part of the district of Rushen. Dependency Ratio The dependency ratio is the number of people under 16 years old and the number of retirement age as a percentage of the working age population. Those of retirement age are taken to be all women 60 years and older and all men 65 years and older. The working age group consists of all adults above the age of 15 and under the age of 60 for women and 65 for men. Place of Birth and Previous Residency
For tables relating to place of birth and residency many countries have been grouped together. The groupings are shown in Appendix 2.
7
Employed/Economically Active
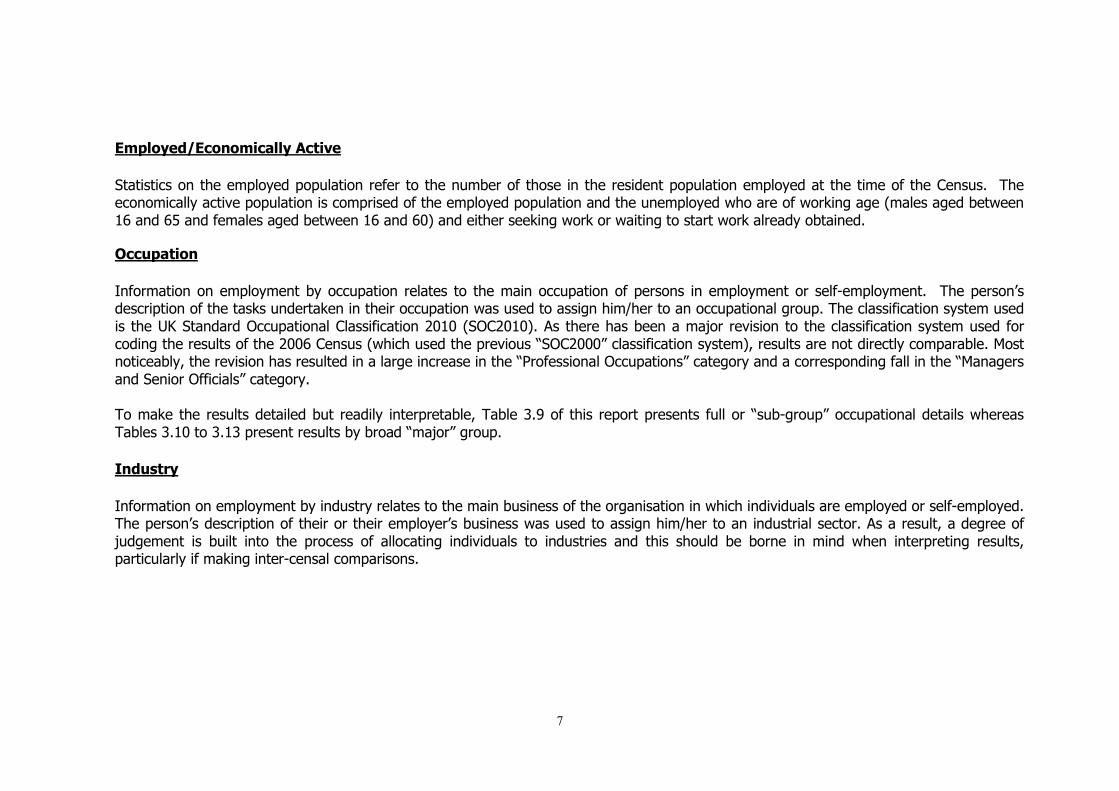
Statistics on the employed population refer to the number of those in the resident population employed at the time of the Census. The economically active population is comprised of the employed population and the unemployed who are of working age (males aged between 16 and 65 and females aged between 16 and 60) and either seeking work or waiting to start work already obtained.
Occupation
Information on employment by occupation relates to the main occupation of persons in employment or self-employment. The person’s description of the tasks undertaken in their occupation was used to assign him/her to an occupational group. The classification system used is the UK Standard Occupational Classification 2010 (SOC2010). As there has been a major revision to the classification system used for coding the results of the 2006 Census (which used the previous “SOC2000” classification system), results are not directly comparable. Most noticeably, the revision has resulted in a large increase in the “Professional Occupations” category and a corresponding fall in the “Managers and Senior Officials” category.
To make the results detailed but readily interpretable, Table 3.9 of this report presents full or “sub-group” occupational details whereas Tables 3.10 to 3.13 present results by broad “major” group.
Industry
Information on employment by industry relates to the main business of the organisation in which individuals are employed or self-employed. The person’s description of their or their employer’s business was used to assign him/her to an industrial sector. As a result, a degree of judgement is built into the process of allocating individuals to industries and this should be borne in mind when interpreting results, particularly if making inter-censal comparisons.
8
EXECUTIVE SUMMARY
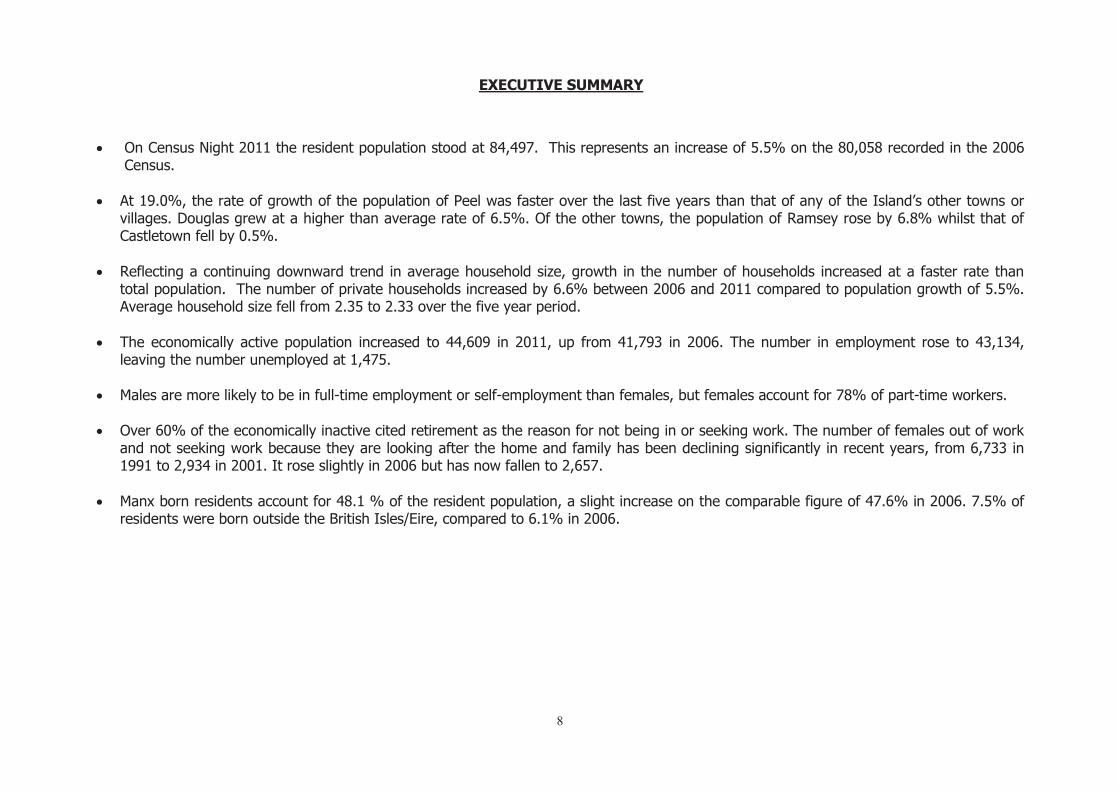
� On Census Night 2011 the resident population stood at 84,497. This represents an increase of 5.5% on the 80,058 recorded in the 2006
Census. � At 19.0%, the rate of growth of the population of Peel was faster over the last five years than that of any of the Island’s other towns or
villages. Douglas grew at a higher than average rate of 6.5%. Of the other towns, the population of Ramsey rose by 6.8% whilst that of Castletown fell by 0.5%.
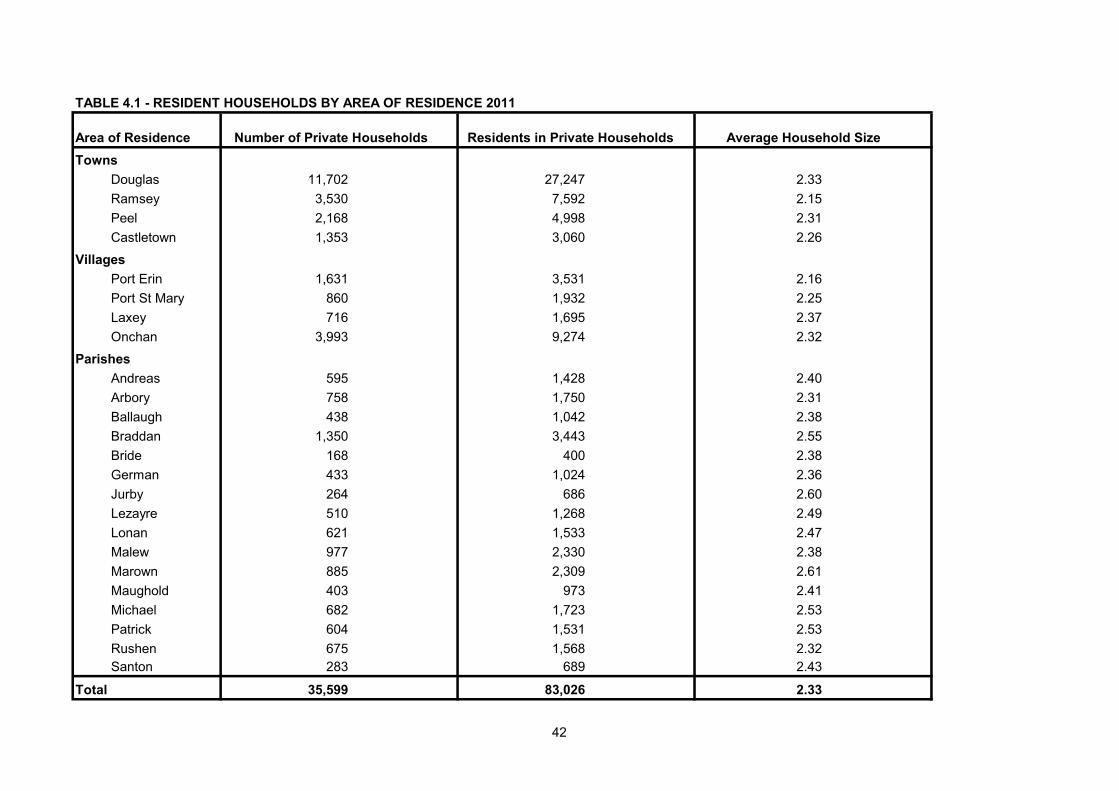
� Reflecting a continuing downward trend in average household size, growth in the number of households increased at a faster rate than
total population. The number of private households increased by 6.6% between 2006 and 2011 compared to population growth of 5.5%. Average household size fell from 2.35 to 2.33 over the five year period.
� The economically active population increased to 44,609 in 2011, up from 41,793 in 2006. The number in employment rose to 43,134,
leaving the number unemployed at 1,475. � Males are more likely to be in full-time employment or self-employment than females, but females account for 78% of part-time workers. � Over 60% of the economically inactive cited retirement as the reason for not being in or seeking work. The number of females out of work
and not seeking work because they are looking after the home and family has been declining significantly in recent years, from 6,733 in 1991 to 2,934 in 2001. It rose slightly in 2006 but has now fallen to 2,657.
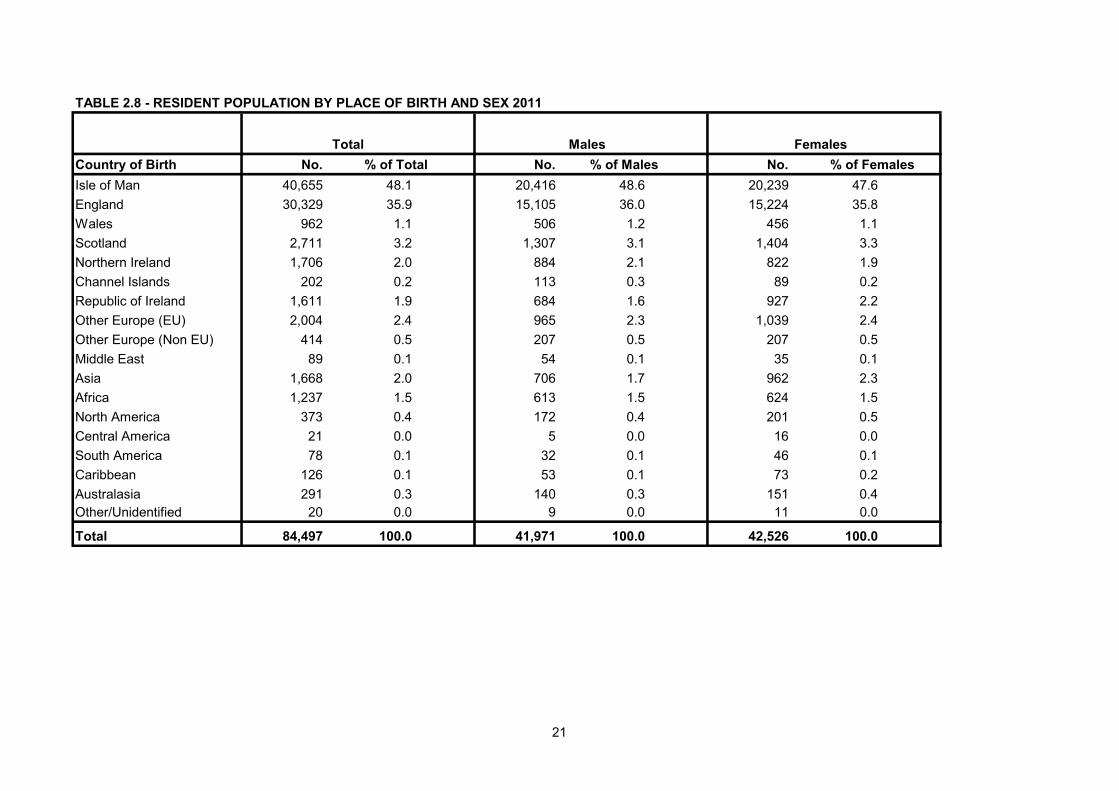
� Manx born residents account for 48.1 % of the resident population, a slight increase on the comparable figure of 47.6% in 2006. 7.5% of
residents were born outside the British Isles/Eire, compared to 6.1% in 2006.
HISTORICAL STATISTICS
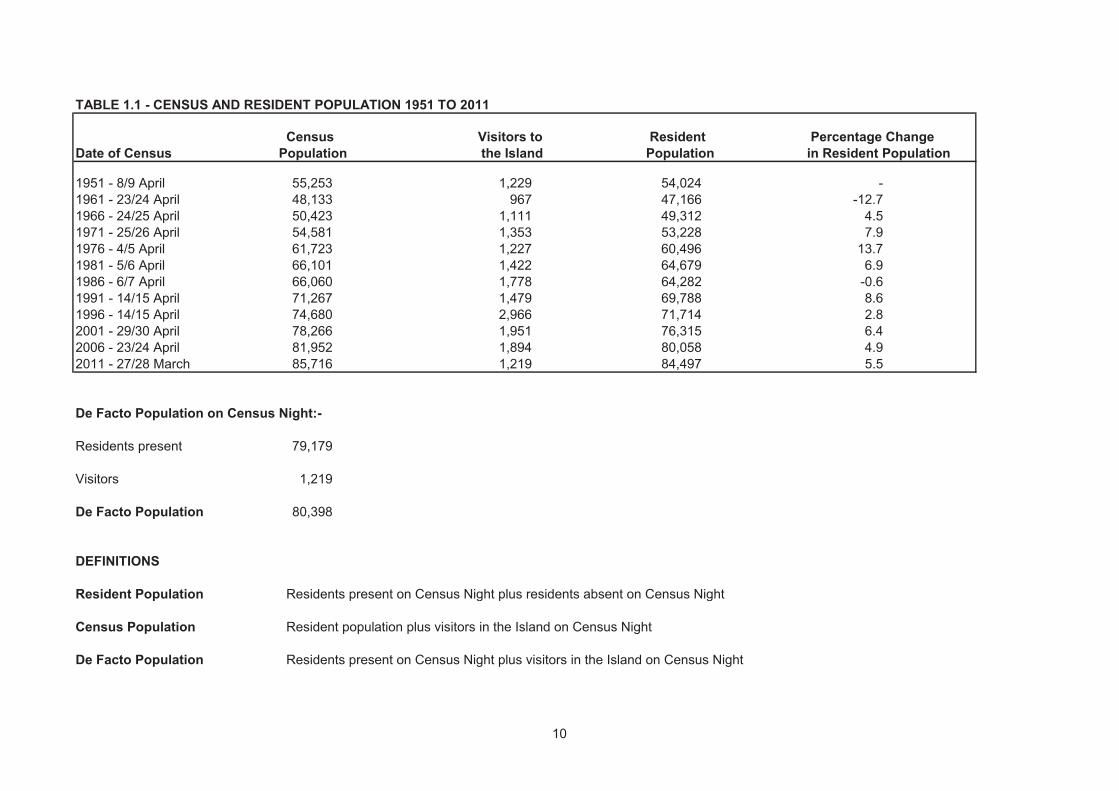
TABLE 1.1 - CENSUS AND RESIDENT POPULATION 1951 TO 2011
Census Visitors to Resident Percentage ChangeDate of Census Population the Island Population in Resident Population
1951 - 8/9 April 55,253 1,229 54,024 -1961 - 23/24 April 48,133 967 47,166 -12.71966 - 24/25 April 50,423 1,111 49,312 4.51971 - 25/26 April 54,581 1,353 53,228 7.91976 - 4/5 April 61,723 1,227 60,496 13.71981 - 5/6 April 66,101 1,422 64,679 6.91986 - 6/7 April 66,060 1,778 64,282 -0.61991 - 14/15 April 71,267 1,479 69,788 8.61996 - 14/15 April 74,680 2,966 71,714 2.82001 - 29/30 April 78,266 1,951 76,315 6.42006 - 23/24 April 81,952 1,894 80,058 4.92011 - 27/28 March 85,716 1,219 84,497 5.5
De Facto Population on Census Night:-
Residents present 79,179
Visitors 1,219
De Facto Population 80,398
DEFINITIONS
Resident Population Residents present on Census Night plus residents absent on Census Night
Census Population Resident population plus visitors in the Island on Census Night
De Facto Population Residents present on Census Night plus visitors in the Island on Census Night
10
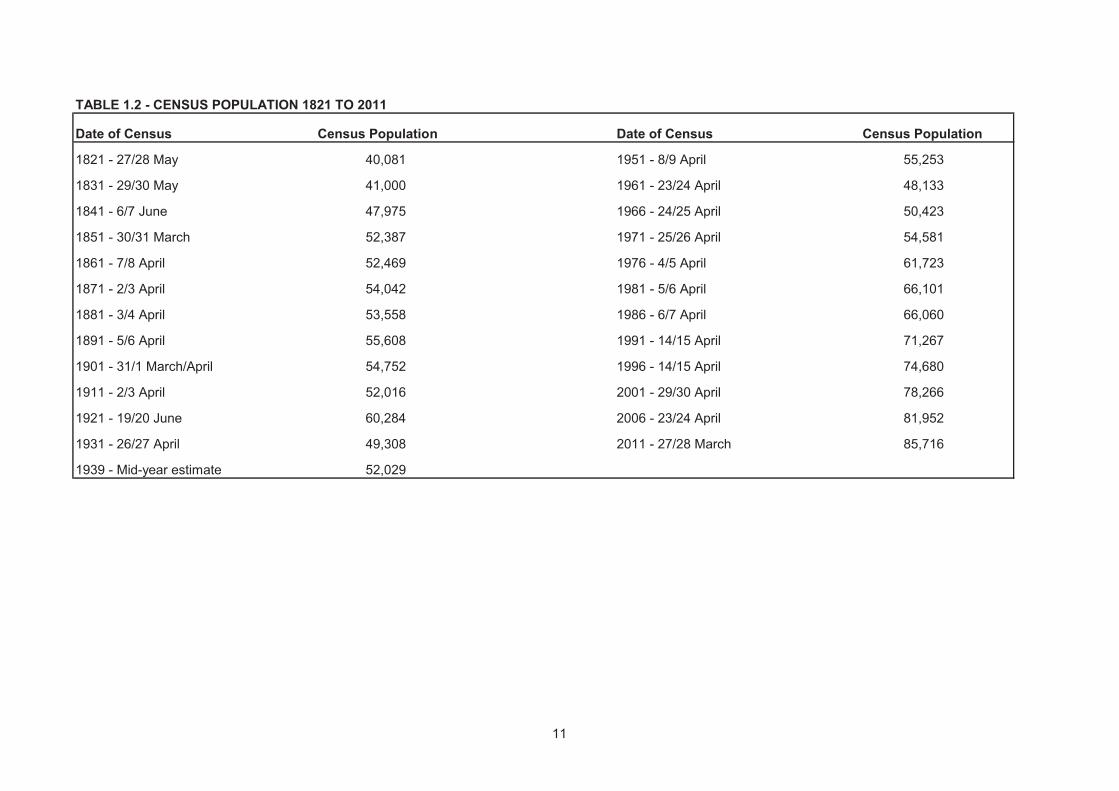
TABLE 1.2 - CENSUS POPULATION 1821 TO 2011
Date of Census Census Population Date of Census Census Population
1821 - 27/28 May 40,081 1951 - 8/9 April 55,253
1831 - 29/30 May 41,000 1961 - 23/24 April 48,133
1841 - 6/7 June 47,975 1966 - 24/25 April 50,423
1851 - 30/31 March 52,387 1971 - 25/26 April 54,581
1861 - 7/8 April 52,469 1976 - 4/5 April 61,723
1871 - 2/3 April 54,042 1981 - 5/6 April 66,101
1881 - 3/4 April 53,558 1986 - 6/7 April 66,060
1891 - 5/6 April 55,608 1991 - 14/15 April 71,267
1901 - 31/1 March/April 54,752 1996 - 14/15 April 74,680
1911 - 2/3 April 52,016 2001 - 29/30 April 78,266
1921 - 19/20 June 60,284 2006 - 23/24 April 81,952
1931 - 26/27 April 49,308 2011 - 27/28 March 85,716
1939 - Mid-year estimate 52,029
11
12
TABLE 1.3 - DEPENDENCY RATIO* 1976 TO 2011
Census Year Under 16 Years Retirement Age & Over Working Age Dependency Ratio1 Dependency Ratio2
1976 13,207 14,747 32,542 85.9% 1.2
19813 13,389 15,378 35,902 80.1% 1.2
19864 12,318 15,304 36,244 76.2% 1.3
1991 12,904 15,425 41,459 68.3% 1.5
1996 13,483 14,953 43,278 65.7% 1.5
2001 14,509 14,725 47,081 62.1% 1.6
2006 14,571 16,002 49,485 61.8% 1.6
2011 15,036 17,847 51,614 63.7% 1.6
1 the number of persons under 16 plus the number of persons of retirement age and over as a percentage of the number of working age.
2 the ratio of number of persons of working age to the number under sixteen plus of retirement age and over.
3 10 cases where age was unknown
4 416 cases where age was unknown
GENERAL POPULATION STATISTICS
14
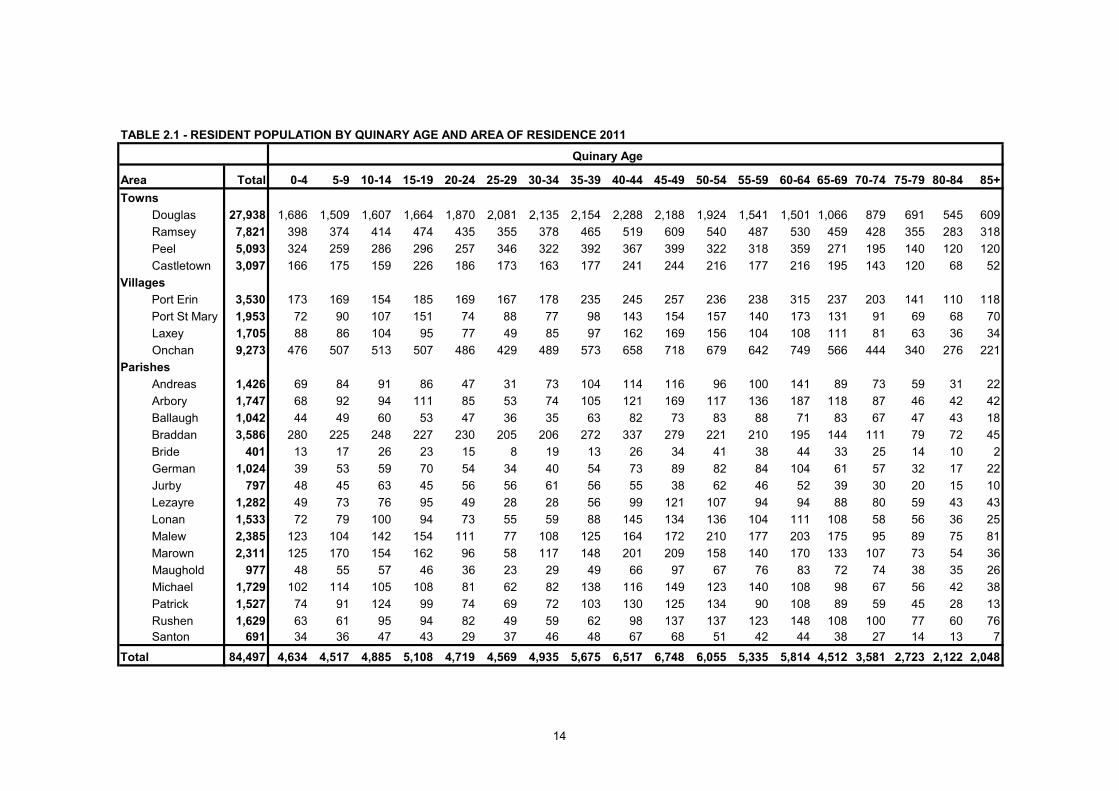
TABLE 2.1 - RESIDENT POPULATION BY QUINARY AGE AND AREA OF RESIDENCE 2011
Quinary Age
Area Total 0-4 5-9 10-14 15-19 20-24 25-29 30-34 35-39 40-44 45-49 50-54 55-59 60-64 65-69 70-74 75-79 80-84 85+Towns
Douglas 27,938 1,686 1,509 1,607 1,664 1,870 2,081 2,135 2,154 2,288 2,188 1,924 1,541 1,501 1,066 879 691 545 609Ramsey 7,821 398 374 414 474 435 355 378 465 519 609 540 487 530 459 428 355 283 318Peel 5,093 324 259 286 296 257 346 322 392 367 399 322 318 359 271 195 140 120 120Castletown 3,097 166 175 159 226 186 173 163 177 241 244 216 177 216 195 143 120 68 52
VillagesPort Erin 3,530 173 169 154 185 169 167 178 235 245 257 236 238 315 237 203 141 110 118Port St Mary 1,953 72 90 107 151 74 88 77 98 143 154 157 140 173 131 91 69 68 70Laxey 1,705 88 86 104 95 77 49 85 97 162 169 156 104 108 111 81 63 36 34Onchan 9,273 476 507 513 507 486 429 489 573 658 718 679 642 749 566 444 340 276 221
ParishesAndreas 1,426 69 84 91 86 47 31 73 104 114 116 96 100 141 89 73 59 31 22Arbory 1,747 68 92 94 111 85 53 74 105 121 169 117 136 187 118 87 46 42 42Ballaugh 1,042 44 49 60 53 47 36 35 63 82 73 83 88 71 83 67 47 43 18Braddan 3,586 280 225 248 227 230 205 206 272 337 279 221 210 195 144 111 79 72 45Bride 401 13 17 26 23 15 8 19 13 26 34 41 38 44 33 25 14 10 2German 1,024 39 53 59 70 54 34 40 54 73 89 82 84 104 61 57 32 17 22Jurby 797 48 45 63 45 56 56 61 56 55 38 62 46 52 39 30 20 15 10Lezayre 1,282 49 73 76 95 49 28 28 56 99 121 107 94 94 88 80 59 43 43Lonan 1,533 72 79 100 94 73 55 59 88 145 134 136 104 111 108 58 56 36 25Malew 2,385 123 104 142 154 111 77 108 125 164 172 210 177 203 175 95 89 75 81Marown 2,311 125 170 154 162 96 58 117 148 201 209 158 140 170 133 107 73 54 36Maughold 977 48 55 57 46 36 23 29 49 66 97 67 76 83 72 74 38 35 26Michael 1,729 102 114 105 108 81 62 82 138 116 149 123 140 108 98 67 56 42 38Patrick 1,527 74 91 124 99 74 69 72 103 130 125 134 90 108 89 59 45 28 13Rushen 1,629 63 61 95 94 82 49 59 62 98 137 137 123 148 108 100 77 60 76Santon 691 34 36 47 43 29 37 46 48 67 68 51 42 44 38 27 14 13 7
Total 84,497 4,634 4,517 4,885 5,108 4,719 4,569 4,935 5,675 6,517 6,748 6,055 5,335 5,814 4,512 3,581 2,723 2,122 2,048
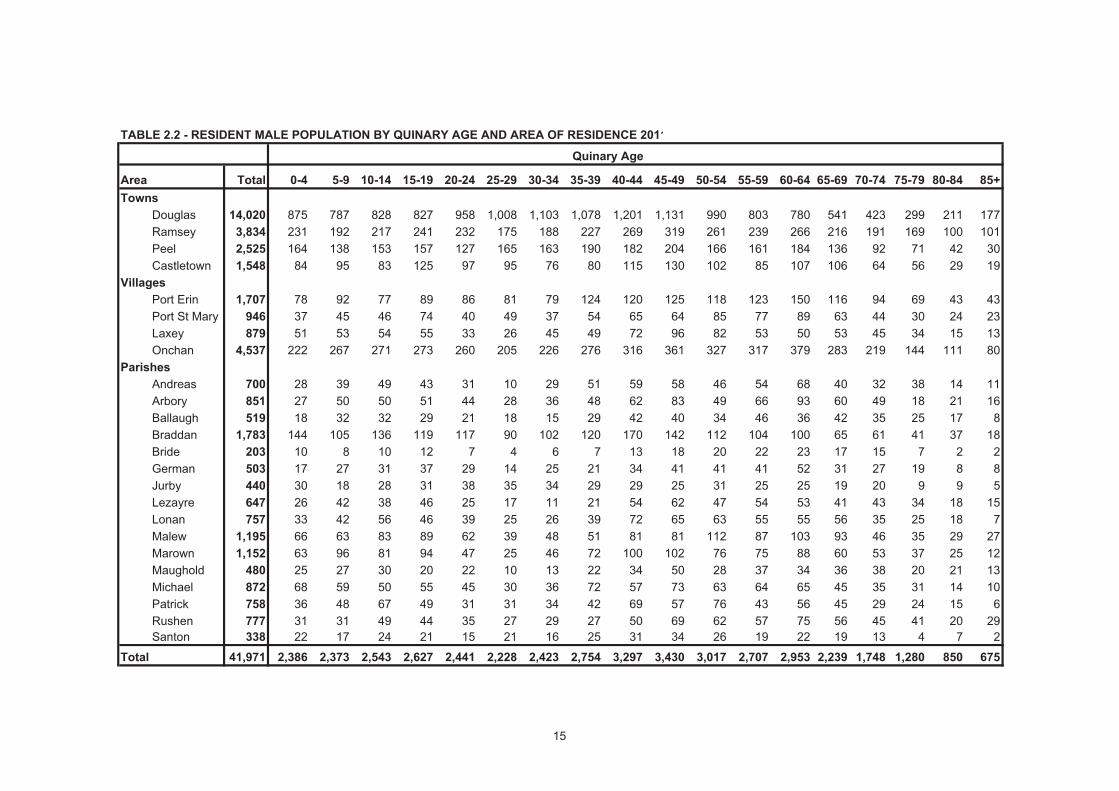
TABLE 2.2 - RESIDENT MALE POPULATION BY QUINARY AGE AND AREA OF RESIDENCE 2011
Quinary Age
Area Total 0-4 5-9 10-14 15-19 20-24 25-29 30-34 35-39 40-44 45-49 50-54 55-59 60-64 65-69 70-74 75-79 80-84 85+Towns
Douglas 14,020 875 787 828 827 958 1,008 1,103 1,078 1,201 1,131 990 803 780 541 423 299 211 177Ramsey 3,834 231 192 217 241 232 175 188 227 269 319 261 239 266 216 191 169 100 101Peel 2,525 164 138 153 157 127 165 163 190 182 204 166 161 184 136 92 71 42 30Castletown 1,548 84 95 83 125 97 95 76 80 115 130 102 85 107 106 64 56 29 19
VillagesPort Erin 1,707 78 92 77 89 86 81 79 124 120 125 118 123 150 116 94 69 43 43Port St Mary 946 37 45 46 74 40 49 37 54 65 64 85 77 89 63 44 30 24 23Laxey 879 51 53 54 55 33 26 45 49 72 96 82 53 50 53 45 34 15 13Onchan 4,537 222 267 271 273 260 205 226 276 316 361 327 317 379 283 219 144 111 80
ParishesAndreas 700 28 39 49 43 31 10 29 51 59 58 46 54 68 40 32 38 14 11Arbory 851 27 50 50 51 44 28 36 48 62 83 49 66 93 60 49 18 21 16Ballaugh 519 18 32 32 29 21 18 15 29 42 40 34 46 36 42 35 25 17 8Braddan 1,783 144 105 136 119 117 90 102 120 170 142 112 104 100 65 61 41 37 18Bride 203 10 8 10 12 7 4 6 7 13 18 20 22 23 17 15 7 2 2German 503 17 27 31 37 29 14 25 21 34 41 41 41 52 31 27 19 8 8Jurby 440 30 18 28 31 38 35 34 29 29 25 31 25 25 19 20 9 9 5Lezayre 647 26 42 38 46 25 17 11 21 54 62 47 54 53 41 43 34 18 15Lonan 757 33 42 56 46 39 25 26 39 72 65 63 55 55 56 35 25 18 7Malew 1,195 66 63 83 89 62 39 48 51 81 81 112 87 103 93 46 35 29 27Marown 1,152 63 96 81 94 47 25 46 72 100 102 76 75 88 60 53 37 25 12Maughold 480 25 27 30 20 22 10 13 22 34 50 28 37 34 36 38 20 21 13Michael 872 68 59 50 55 45 30 36 72 57 73 63 64 65 45 35 31 14 10Patrick 758 36 48 67 49 31 31 34 42 69 57 76 43 56 45 29 24 15 6Rushen 777 31 31 49 44 35 27 29 27 50 69 62 57 75 56 45 41 20 29Santon 338 22 17 24 21 15 21 16 25 31 34 26 19 22 19 13 4 7 2
Total 41,971 2,386 2,373 2,543 2,627 2,441 2,228 2,423 2,754 3,297 3,430 3,017 2,707 2,953 2,239 1,748 1,280 850 675
15
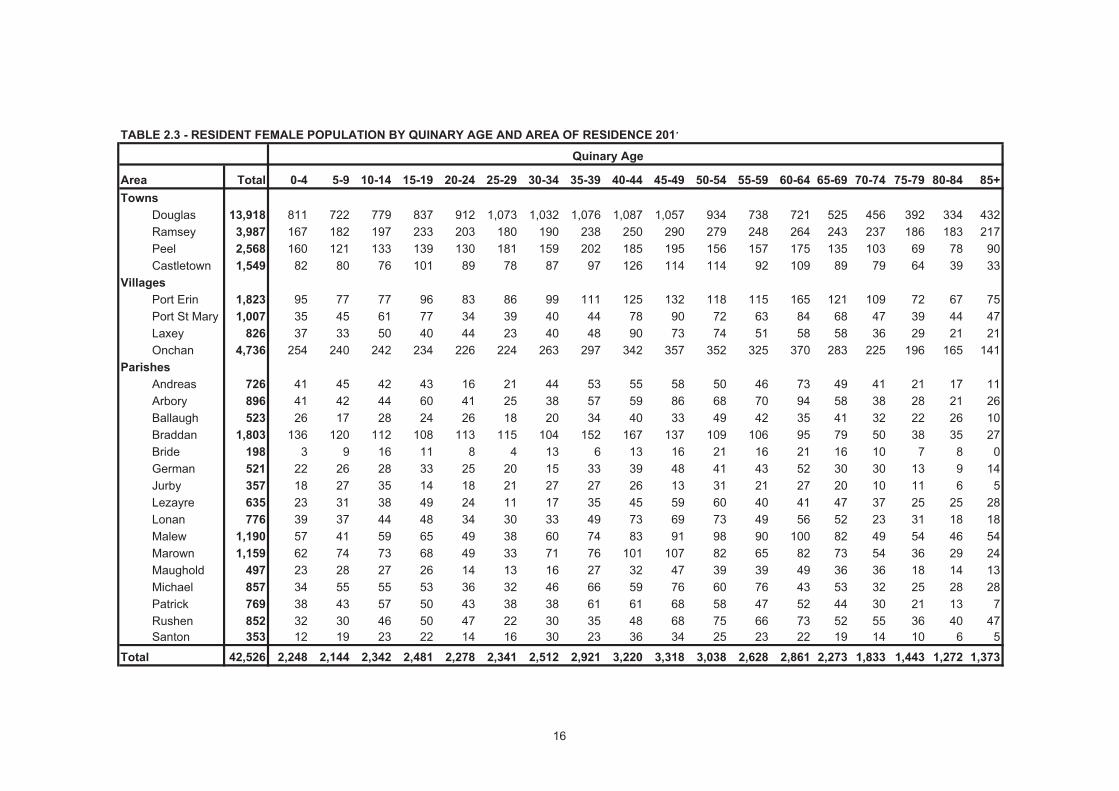
TABLE 2.3 - RESIDENT FEMALE POPULATION BY QUINARY AGE AND AREA OF RESIDENCE 2011
Quinary Age
Area Total 0-4 5-9 10-14 15-19 20-24 25-29 30-34 35-39 40-44 45-49 50-54 55-59 60-64 65-69 70-74 75-79 80-84 85+Towns
Douglas 13,918 811 722 779 837 912 1,073 1,032 1,076 1,087 1,057 934 738 721 525 456 392 334 432Ramsey 3,987 167 182 197 233 203 180 190 238 250 290 279 248 264 243 237 186 183 217Peel 2,568 160 121 133 139 130 181 159 202 185 195 156 157 175 135 103 69 78 90Castletown 1,549 82 80 76 101 89 78 87 97 126 114 114 92 109 89 79 64 39 33
VillagesPort Erin 1,823 95 77 77 96 83 86 99 111 125 132 118 115 165 121 109 72 67 75Port St Mary 1,007 35 45 61 77 34 39 40 44 78 90 72 63 84 68 47 39 44 47Laxey 826 37 33 50 40 44 23 40 48 90 73 74 51 58 58 36 29 21 21Onchan 4,736 254 240 242 234 226 224 263 297 342 357 352 325 370 283 225 196 165 141
ParishesAndreas 726 41 45 42 43 16 21 44 53 55 58 50 46 73 49 41 21 17 11Arbory 896 41 42 44 60 41 25 38 57 59 86 68 70 94 58 38 28 21 26Ballaugh 523 26 17 28 24 26 18 20 34 40 33 49 42 35 41 32 22 26 10Braddan 1,803 136 120 112 108 113 115 104 152 167 137 109 106 95 79 50 38 35 27Bride 198 3 9 16 11 8 4 13 6 13 16 21 16 21 16 10 7 8 0German 521 22 26 28 33 25 20 15 33 39 48 41 43 52 30 30 13 9 14Jurby 357 18 27 35 14 18 21 27 27 26 13 31 21 27 20 10 11 6 5Lezayre 635 23 31 38 49 24 11 17 35 45 59 60 40 41 47 37 25 25 28Lonan 776 39 37 44 48 34 30 33 49 73 69 73 49 56 52 23 31 18 18Malew 1,190 57 41 59 65 49 38 60 74 83 91 98 90 100 82 49 54 46 54Marown 1,159 62 74 73 68 49 33 71 76 101 107 82 65 82 73 54 36 29 24Maughold 497 23 28 27 26 14 13 16 27 32 47 39 39 49 36 36 18 14 13Michael 857 34 55 55 53 36 32 46 66 59 76 60 76 43 53 32 25 28 28Patrick 769 38 43 57 50 43 38 38 61 61 68 58 47 52 44 30 21 13 7Rushen 852 32 30 46 50 47 22 30 35 48 68 75 66 73 52 55 36 40 47Santon 353 12 19 23 22 14 16 30 23 36 34 25 23 22 19 14 10 6 5
Total 42,526 2,248 2,144 2,342 2,481 2,278 2,341 2,512 2,921 3,220 3,318 3,038 2,628 2,861 2,273 1,833 1,443 1,272 1,373
16
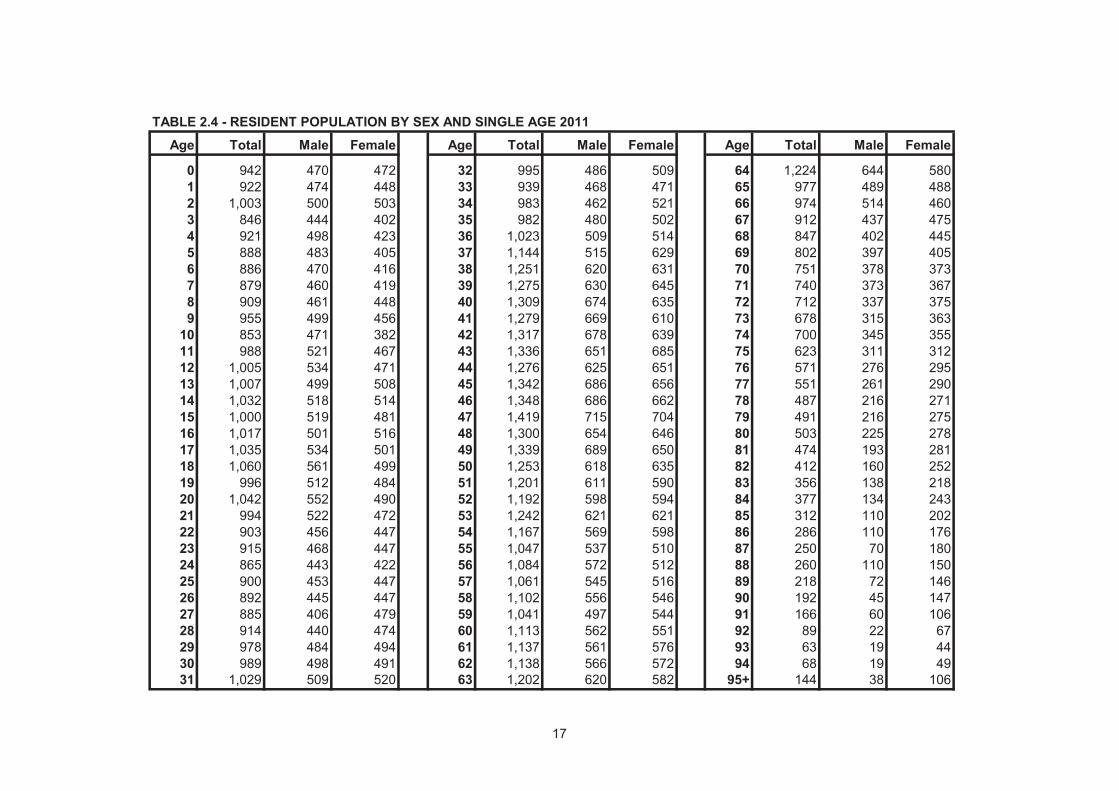
TABLE 2.4 - RESIDENT POPULATION BY SEX AND SINGLE AGE 2011
Age Total Male Female Age Total Male Female Age Total Male Female
0 942 470 472 32 995 486 509 64 1,224 644 5801 922 474 448 33 939 468 471 65 977 489 4882 1,003 500 503 34 983 462 521 66 974 514 4603 846 444 402 35 982 480 502 67 912 437 4754 921 498 423 36 1,023 509 514 68 847 402 4455 888 483 405 37 1,144 515 629 69 802 397 4056 886 470 416 38 1,251 620 631 70 751 378 3737 879 460 419 39 1,275 630 645 71 740 373 3678 909 461 448 40 1,309 674 635 72 712 337 3759 955 499 456 41 1,279 669 610 73 678 315 363
10 853 471 382 42 1,317 678 639 74 700 345 35511 988 521 467 43 1,336 651 685 75 623 311 31212 1,005 534 471 44 1,276 625 651 76 571 276 29513 1,007 499 508 45 1,342 686 656 77 551 261 29014 1,032 518 514 46 1,348 686 662 78 487 216 27115 1,000 519 481 47 1,419 715 704 79 491 216 27516 1,017 501 516 48 1,300 654 646 80 503 225 27817 1,035 534 501 49 1,339 689 650 81 474 193 28118 1,060 561 499 50 1,253 618 635 82 412 160 25219 996 512 484 51 1,201 611 590 83 356 138 21820 1,042 552 490 52 1,192 598 594 84 377 134 24321 994 522 472 53 1,242 621 621 85 312 110 20222 903 456 447 54 1,167 569 598 86 286 110 17623 915 468 447 55 1,047 537 510 87 250 70 18024 865 443 422 56 1,084 572 512 88 260 110 15025 900 453 447 57 1,061 545 516 89 218 72 14626 892 445 447 58 1,102 556 546 90 192 45 14727 885 406 479 59 1,041 497 544 91 166 60 10628 914 440 474 60 1,113 562 551 92 89 22 6729 978 484 494 61 1,137 561 576 93 63 19 4430 989 498 491 62 1,138 566 572 94 68 19 4931 1,029 509 520 63 1,202 620 582 95+ 144 38 106
17
18
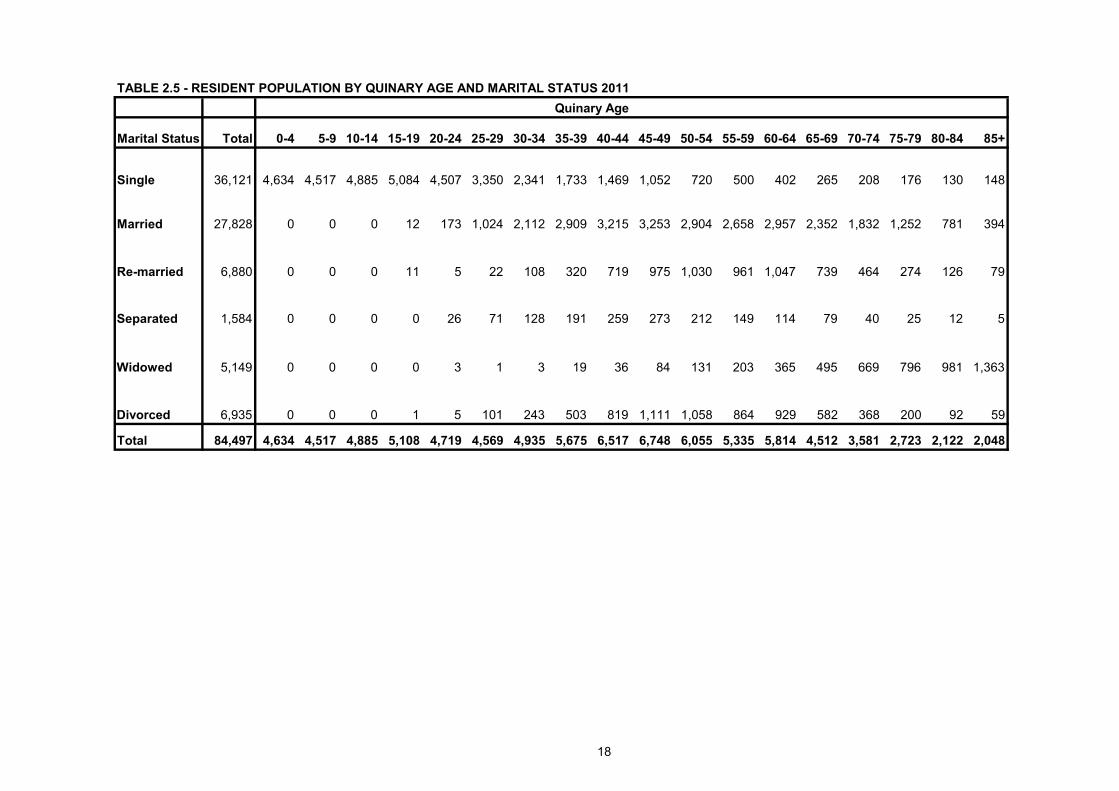
TABLE 2.5 - RESIDENT POPULATION BY QUINARY AGE AND MARITAL STATUS 2011Quinary Age
Marital Status Total 0-4 5-9 10-14 15-19 20-24 25-29 30-34 35-39 40-44 45-49 50-54 55-59 60-64 65-69 70-74 75-79 80-84 85+
Single 36,121 4,634 4,517 4,885 5,084 4,507 3,350 2,341 1,733 1,469 1,052 720 500 402 265 208 176 130 148
Married 27,828 0 0 0 12 173 1,024 2,112 2,909 3,215 3,253 2,904 2,658 2,957 2,352 1,832 1,252 781 394
Re-married 6,880 0 0 0 11 5 22 108 320 719 975 1,030 961 1,047 739 464 274 126 79
Separated 1,584 0 0 0 0 26 71 128 191 259 273 212 149 114 79 40 25 12 5
Widowed 5,149 0 0 0 0 3 1 3 19 36 84 131 203 365 495 669 796 981 1,363
Divorced 6,935 0 0 0 1 5 101 243 503 819 1,111 1,058 864 929 582 368 200 92 59
Total 84,497 4,634 4,517 4,885 5,108 4,719 4,569 4,935 5,675 6,517 6,748 6,055 5,335 5,814 4,512 3,581 2,723 2,122 2,048
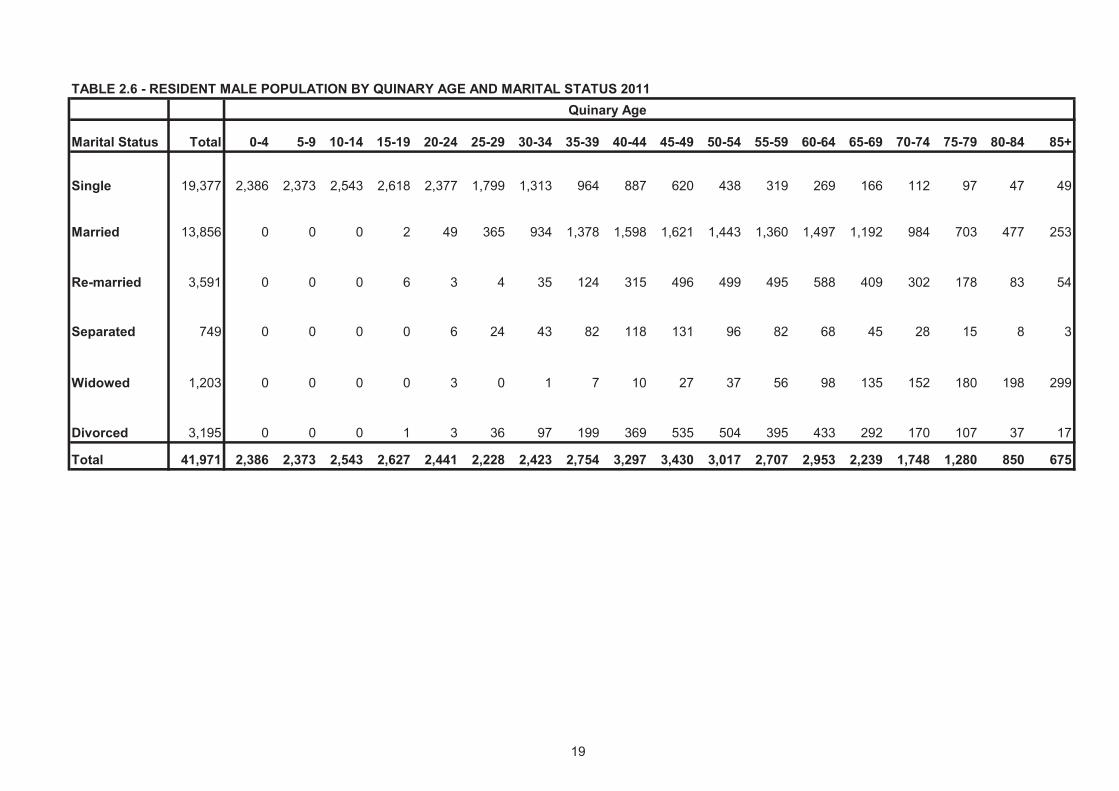
TABLE 2.6 - RESIDENT MALE POPULATION BY QUINARY AGE AND MARITAL STATUS 2011Quinary Age
Marital Status Total 0-4 5-9 10-14 15-19 20-24 25-29 30-34 35-39 40-44 45-49 50-54 55-59 60-64 65-69 70-74 75-79 80-84 85+
Single 19,377 2,386 2,373 2,543 2,618 2,377 1,799 1,313 964 887 620 438 319 269 166 112 97 47 49
Married 13,856 0 0 0 2 49 365 934 1,378 1,598 1,621 1,443 1,360 1,497 1,192 984 703 477 253
Re-married 3,591 0 0 0 6 3 4 35 124 315 496 499 495 588 409 302 178 83 54
Separated 749 0 0 0 0 6 24 43 82 118 131 96 82 68 45 28 15 8 3
Widowed 1,203 0 0 0 0 3 0 1 7 10 27 37 56 98 135 152 180 198 299
Divorced 3,195 0 0 0 1 3 36 97 199 369 535 504 395 433 292 170 107 37 17
Total 41,971 2,386 2,373 2,543 2,627 2,441 2,228 2,423 2,754 3,297 3,430 3,017 2,707 2,953 2,239 1,748 1,280 850 675
19
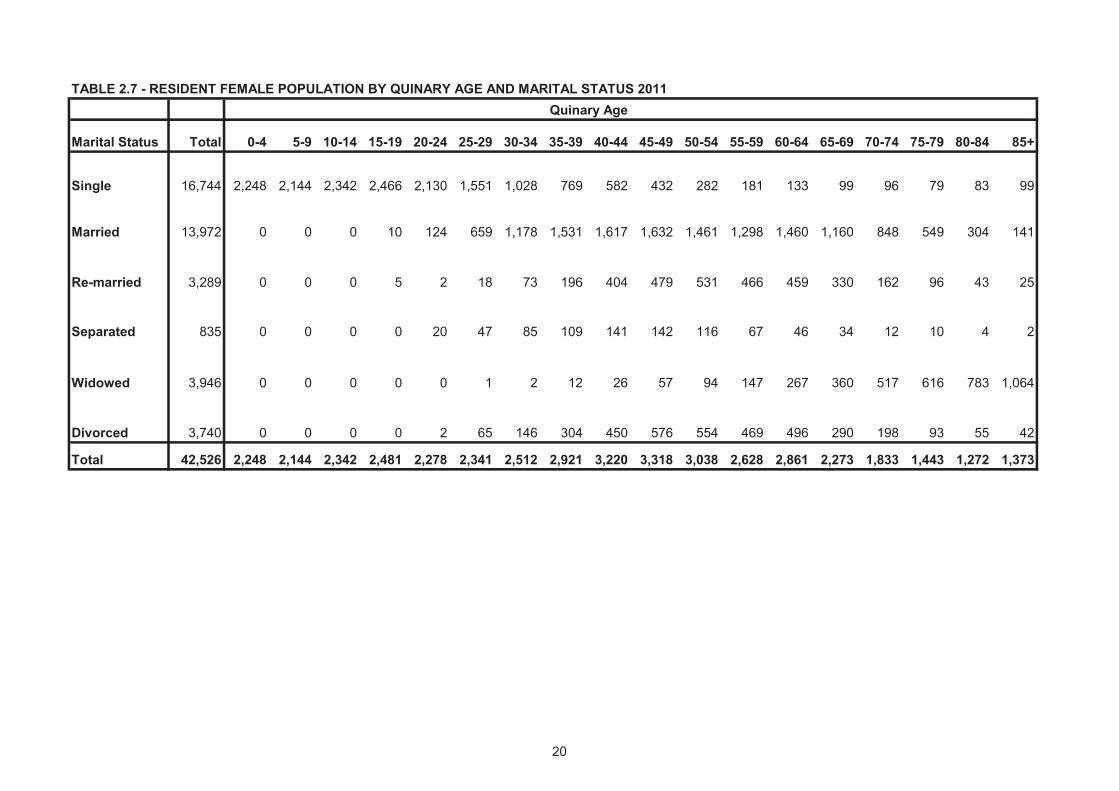
TABLE 2.7 - RESIDENT FEMALE POPULATION BY QUINARY AGE AND MARITAL STATUS 2011Quinary Age
Marital Status Total 0-4 5-9 10-14 15-19 20-24 25-29 30-34 35-39 40-44 45-49 50-54 55-59 60-64 65-69 70-74 75-79 80-84 85+
Single 16,744 2,248 2,144 2,342 2,466 2,130 1,551 1,028 769 582 432 282 181 133 99 96 79 83 99
Married 13,972 0 0 0 10 124 659 1,178 1,531 1,617 1,632 1,461 1,298 1,460 1,160 848 549 304 141
Re-married 3,289 0 0 0 5 2 18 73 196 404 479 531 466 459 330 162 96 43 25
Separated 835 0 0 0 0 20 47 85 109 141 142 116 67 46 34 12 10 4 2
Widowed 3,946 0 0 0 0 0 1 2 12 26 57 94 147 267 360 517 616 783 1,064
Divorced 3,740 0 0 0 0 2 65 146 304 450 576 554 469 496 290 198 93 55 42
Total 42,526 2,248 2,144 2,342 2,481 2,278 2,341 2,512 2,921 3,220 3,318 3,038 2,628 2,861 2,273 1,833 1,443 1,272 1,373
20
21
TABLE 2.8 - RESIDENT POPULATION BY PLACE OF BIRTH AND SEX 2011
Total Males FemalesCountry of Birth No. % of Total No. % of Males No. % of FemalesIsle of Man 40,655 48.1 20,416 48.6 20,239 47.6England 30,329 35.9 15,105 36.0 15,224 35.8Wales 962 1.1 506 1.2 456 1.1Scotland 2,711 3.2 1,307 3.1 1,404 3.3Northern Ireland 1,706 2.0 884 2.1 822 1.9Channel Islands 202 0.2 113 0.3 89 0.2Republic of Ireland 1,611 1.9 684 1.6 927 2.2Other Europe (EU) 2,004 2.4 965 2.3 1,039 2.4Other Europe (Non EU) 414 0.5 207 0.5 207 0.5Middle East 89 0.1 54 0.1 35 0.1Asia 1,668 2.0 706 1.7 962 2.3Africa 1,237 1.5 613 1.5 624 1.5North America 373 0.4 172 0.4 201 0.5Central America 21 0.0 5 0.0 16 0.0South America 78 0.1 32 0.1 46 0.1Caribbean 126 0.1 53 0.1 73 0.2Australasia 291 0.3 140 0.3 151 0.4Other/Unidentified 20 0.0 9 0.0 11 0.0
Total 84,497 100.0 41,971 100.0 42,526 100.0
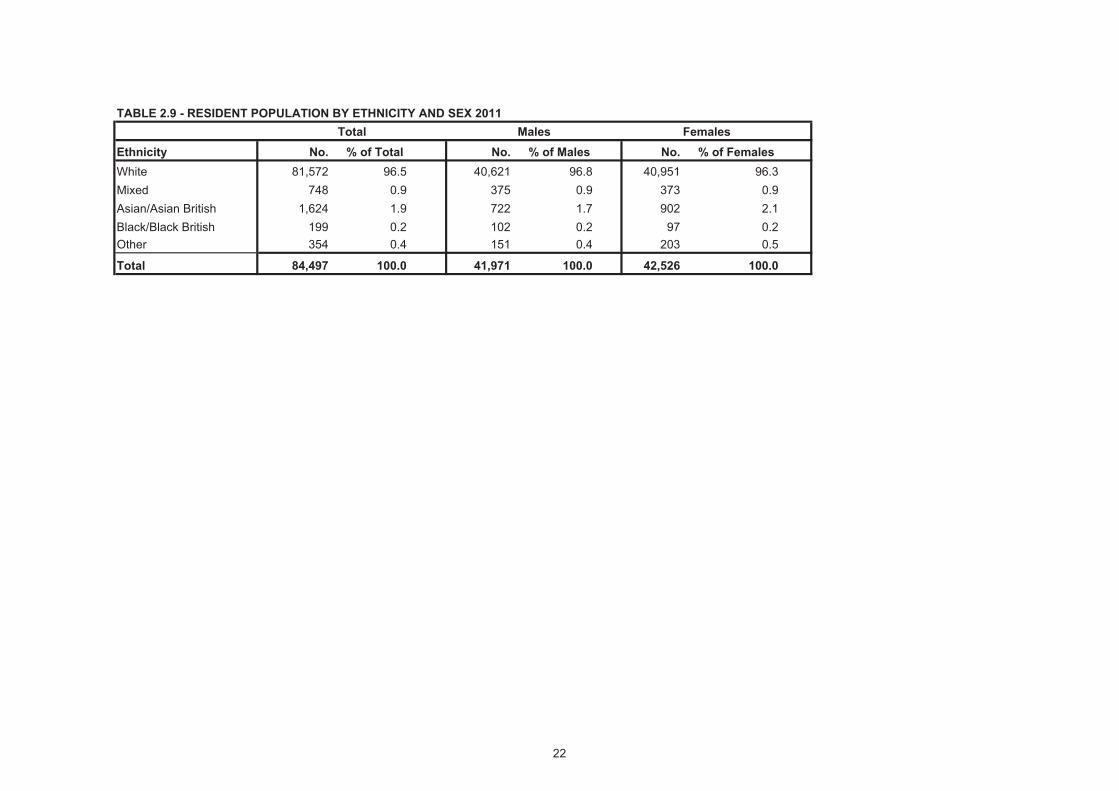
TABLE 2.9 - RESIDENT POPULATION BY ETHNICITY AND SEX 2011 Total Males Females
Ethnicity No. % of Total No. % of Males No. % of FemalesWhite 81,572 96.5 40,621 96.8 40,951 96.3Mixed 748 0.9 375 0.9 373 0.9Asian/Asian British 1,624 1.9 722 1.7 902 2.1Black/Black British 199 0.2 102 0.2 97 0.2Other 354 0.4 151 0.4 203 0.5
Total 84,497 100.0 41,971 100.0 42,526 100.0
22
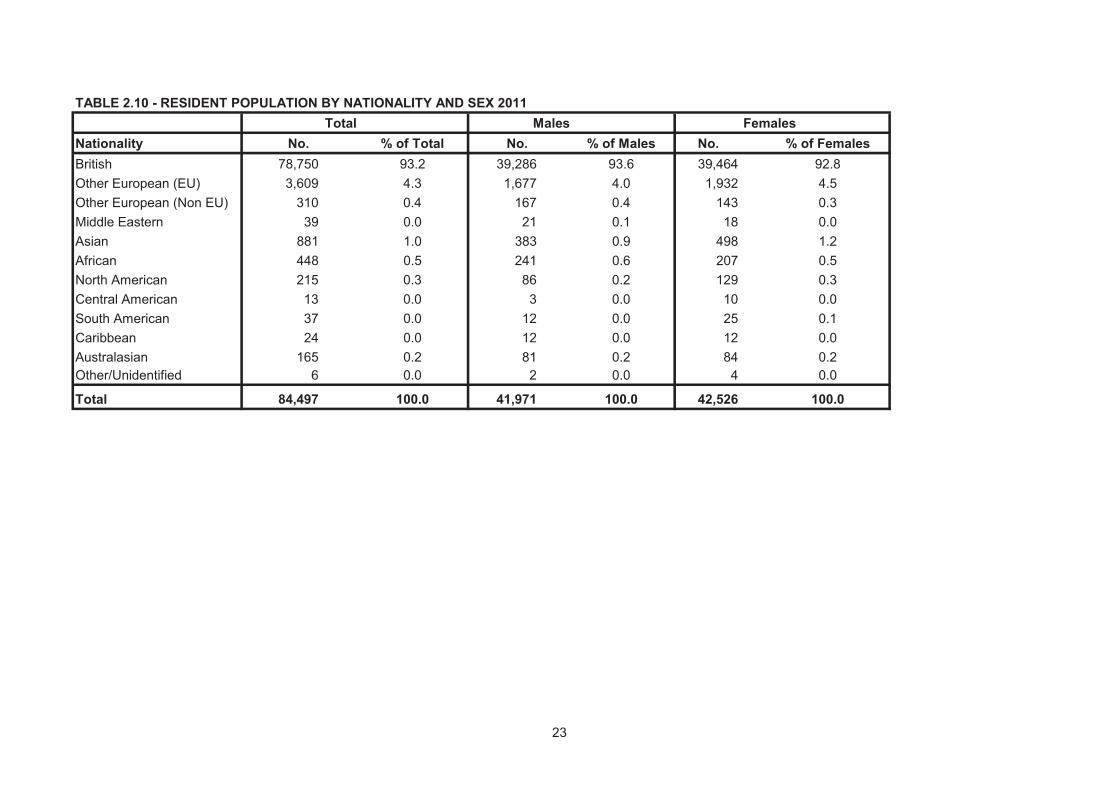
TABLE 2.10 - RESIDENT POPULATION BY NATIONALITY AND SEX 2011 Total Males Females
Nationality No. % of Total No. % of Males No. % of FemalesBritish 78,750 93.2 39,286 93.6 39,464 92.8Other European (EU) 3,609 4.3 1,677 4.0 1,932 4.5Other European (Non EU) 310 0.4 167 0.4 143 0.3Middle Eastern 39 0.0 21 0.1 18 0.0Asian 881 1.0 383 0.9 498 1.2African 448 0.5 241 0.6 207 0.5North American 215 0.3 86 0.2 129 0.3Central American 13 0.0 3 0.0 10 0.0South American 37 0.0 12 0.0 25 0.1Caribbean 24 0.0 12 0.0 12 0.0Australasian 165 0.2 81 0.2 84 0.2Other/Unidentified 6 0.0 2 0.0 4 0.0
Total 84,497 100.0 41,971 100.0 42,526 100.0
23
24
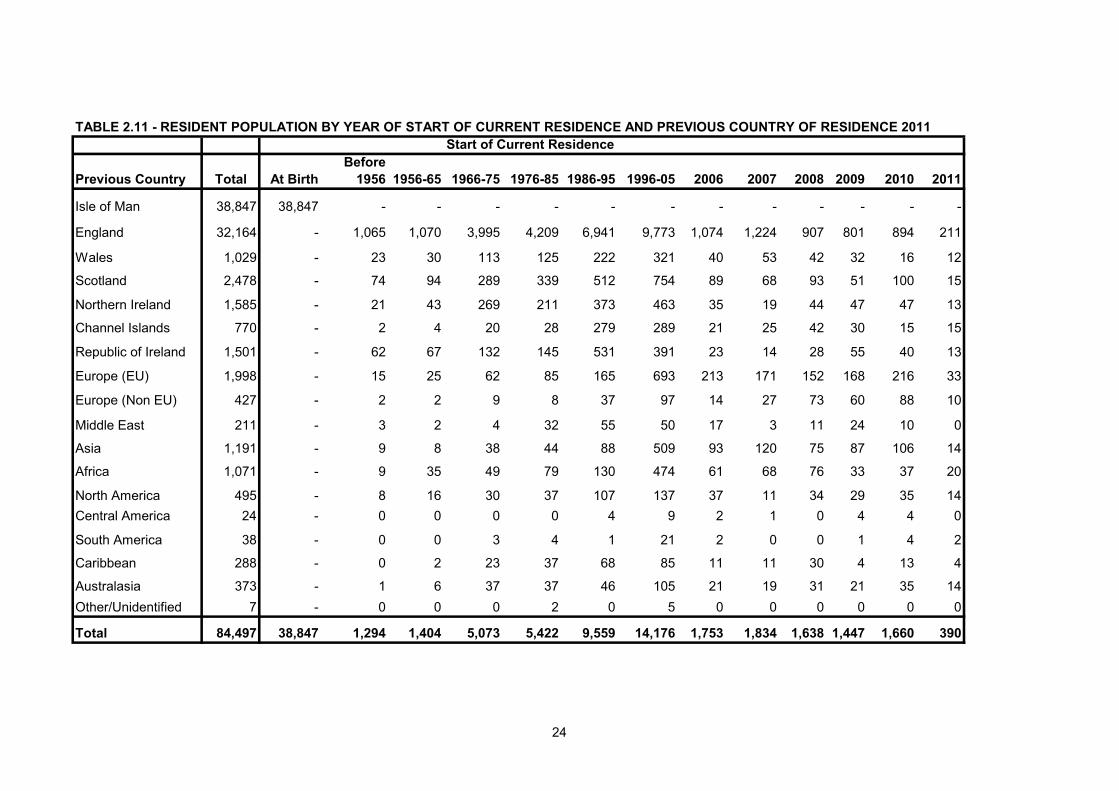
TABLE 2.11 - RESIDENT POPULATION BY YEAR OF START OF CURRENT RESIDENCE AND PREVIOUS COUNTRY OF RESIDENCE 2011Start of Current Residence
BeforePrevious Country Total At Birth 1956 1956-65 1966-75 1976-85 1986-95 1996-05 2006 2007 2008 2009 2010 2011
Isle of Man 38,847 38,847 - - - - - - - - - - - -
England 32,164 - 1,065 1,070 3,995 4,209 6,941 9,773 1,074 1,224 907 801 894 211
Wales 1,029 - 23 30 113 125 222 321 40 53 42 32 16 12
Scotland 2,478 - 74 94 289 339 512 754 89 68 93 51 100 15
Northern Ireland 1,585 - 21 43 269 211 373 463 35 19 44 47 47 13
Channel Islands 770 - 2 4 20 28 279 289 21 25 42 30 15 15
Republic of Ireland 1,501 - 62 67 132 145 531 391 23 14 28 55 40 13
Europe (EU) 1,998 - 15 25 62 85 165 693 213 171 152 168 216 33
Europe (Non EU) 427 - 2 2 9 8 37 97 14 27 73 60 88 10
Middle East 211 - 3 2 4 32 55 50 17 3 11 24 10 0
Asia 1,191 - 9 8 38 44 88 509 93 120 75 87 106 14
Africa 1,071 - 9 35 49 79 130 474 61 68 76 33 37 20
North America 495 - 8 16 30 37 107 137 37 11 34 29 35 14Central America 24 - 0 0 0 0 4 9 2 1 0 4 4 0
South America 38 - 0 0 3 4 1 21 2 0 0 1 4 2
Caribbean 288 - 0 2 23 37 68 85 11 11 30 4 13 4
Australasia 373 - 1 6 37 37 46 105 21 19 31 21 35 14Other/Unidentified 7 - 0 0 0 2 0 5 0 0 0 0 0 0
Total 84,497 38,847 1,294 1,404 5,073 5,422 9,559 14,176 1,753 1,834 1,638 1,447 1,660 390
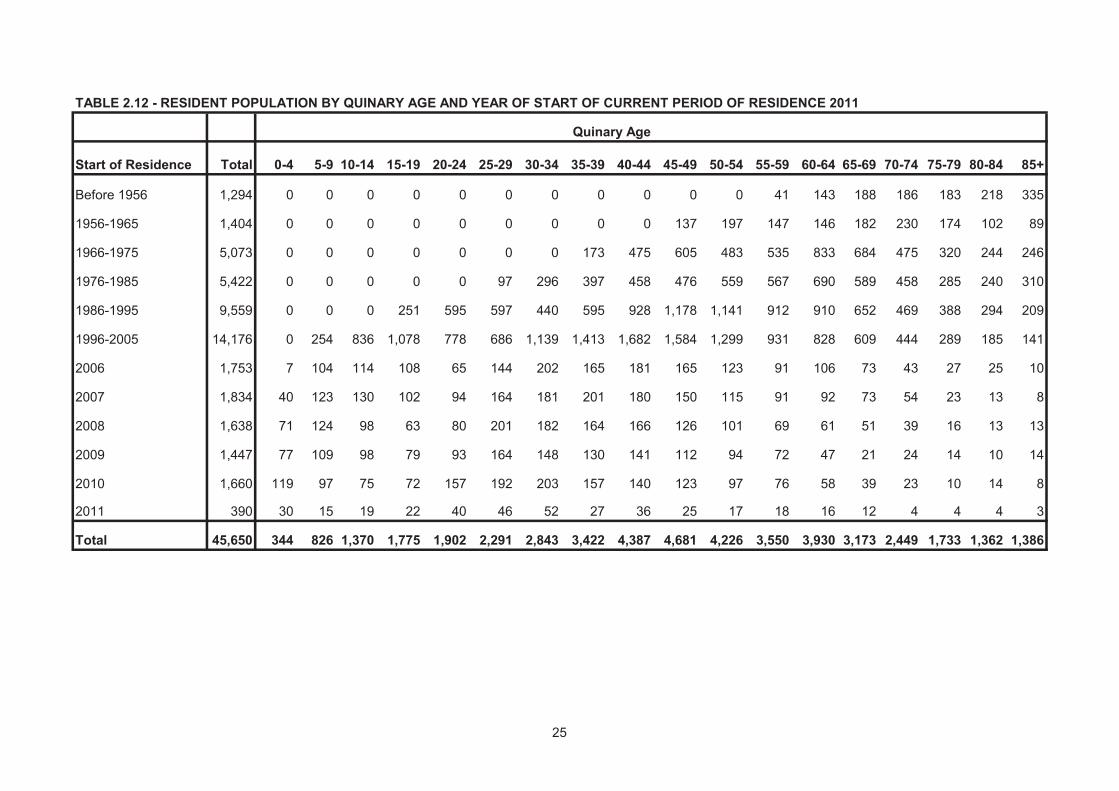
TABLE 2.12 - RESIDENT POPULATION BY QUINARY AGE AND YEAR OF START OF CURRENT PERIOD OF RESIDENCE 2011
Quinary Age
Start of Residence Total 0-4 5-9 10-14 15-19 20-24 25-29 30-34 35-39 40-44 45-49 50-54 55-59 60-64 65-69 70-74 75-79 80-84 85+
Before 1956 1,294 0 0 0 0 0 0 0 0 0 0 0 41 143 188 186 183 218 335
1956-1965 1,404 0 0 0 0 0 0 0 0 0 137 197 147 146 182 230 174 102 89
1966-1975 5,073 0 0 0 0 0 0 0 173 475 605 483 535 833 684 475 320 244 246
1976-1985 5,422 0 0 0 0 0 97 296 397 458 476 559 567 690 589 458 285 240 310
1986-1995 9,559 0 0 0 251 595 597 440 595 928 1,178 1,141 912 910 652 469 388 294 209
1996-2005 14,176 0 254 836 1,078 778 686 1,139 1,413 1,682 1,584 1,299 931 828 609 444 289 185 141
2006 1,753 7 104 114 108 65 144 202 165 181 165 123 91 106 73 43 27 25 10
2007 1,834 40 123 130 102 94 164 181 201 180 150 115 91 92 73 54 23 13 8
2008 1,638 71 124 98 63 80 201 182 164 166 126 101 69 61 51 39 16 13 13
2009 1,447 77 109 98 79 93 164 148 130 141 112 94 72 47 21 24 14 10 14
2010 1,660 119 97 75 72 157 192 203 157 140 123 97 76 58 39 23 10 14 8
2011 390 30 15 19 22 40 46 52 27 36 25 17 18 16 12 4 4 4 3
Total 45,650 344 826 1,370 1,775 1,902 2,291 2,843 3,422 4,387 4,681 4,226 3,550 3,930 3,173 2,449 1,733 1,362 1,386
25

TABLE 2.13 - RESIDENT POPULATION BY REASON FOR TAKING UP RESIDENCE AND START OF CURRENT PERIOD OF RESIDENCE 2011
To seek or take As a spouseStart of Residence Total To retire up employment or dependent Other reason
Before 1956 1,294 21 232 464 577
1956-1965 1,404 33 453 505 413
1966-1975 5,073 223 1,942 1,887 1,021
1976-1985 5,422 557 2,131 1,826 908
1986-1995 9,559 1,170 4,199 2,823 1,367
1996-2005 14,176 1,529 6,339 4,106 2,202
2006 1,753 219 732 479 323
2007 1,834 216 765 483 370
2008 1,638 168 711 483 276
2009 1,447 109 601 411 326
2010 1,660 144 785 448 283
2011 390 38 163 119 70
Total 45,650 4,427 19,053 14,034 8,136
26
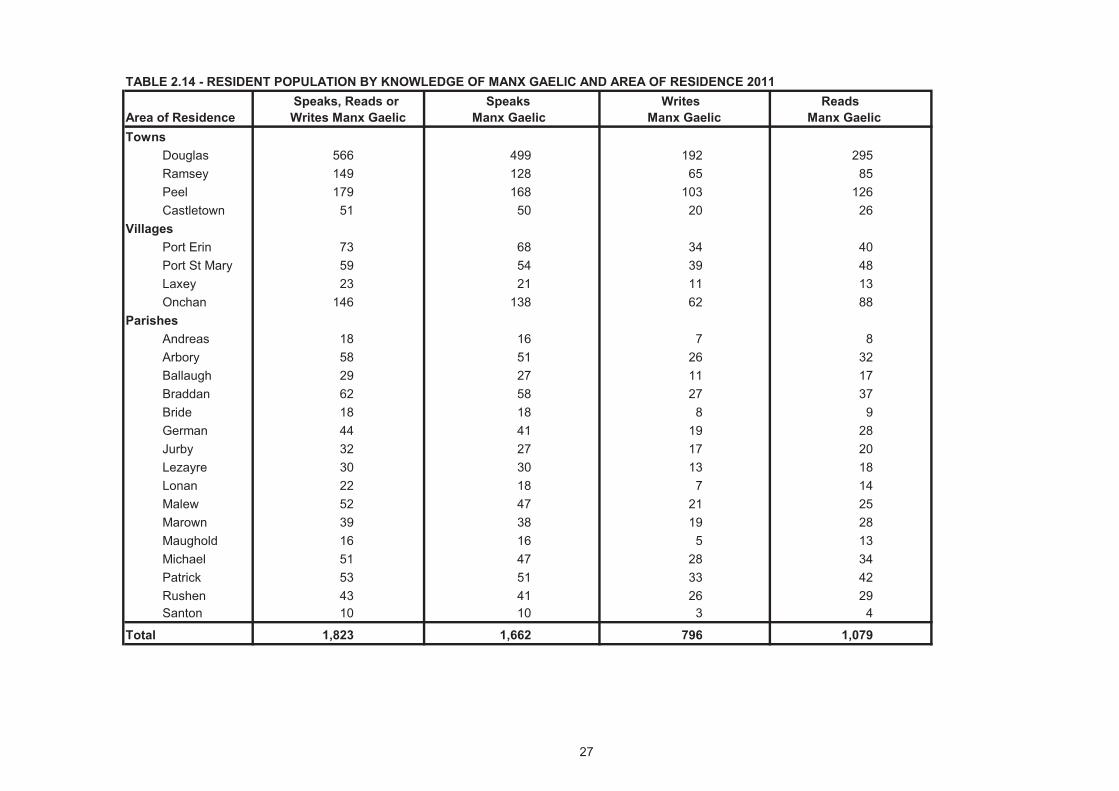
TABLE 2.14 - RESIDENT POPULATION BY KNOWLEDGE OF MANX GAELIC AND AREA OF RESIDENCE 2011 Speaks, Reads or Speaks Writes Reads
Area of Residence Writes Manx Gaelic Manx Gaelic Manx Gaelic Manx GaelicTowns
Douglas 566 499 192 295Ramsey 149 128 65 85Peel 179 168 103 126Castletown 51 50 20 26
VillagesPort Erin 73 68 34 40Port St Mary 59 54 39 48Laxey 23 21 11 13Onchan 146 138 62 88
ParishesAndreas 18 16 7 8Arbory 58 51 26 32Ballaugh 29 27 11 17Braddan 62 58 27 37Bride 18 18 8 9German 44 41 19 28Jurby 32 27 17 20Lezayre 30 30 13 18Lonan 22 18 7 14Malew 52 47 21 25Marown 39 38 19 28Maughold 16 16 5 13Michael 51 47 28 34Patrick 53 51 33 42Rushen 43 41 26 29Santon 10 10 3 4
Total 1,823 1,662 796 1,079
27
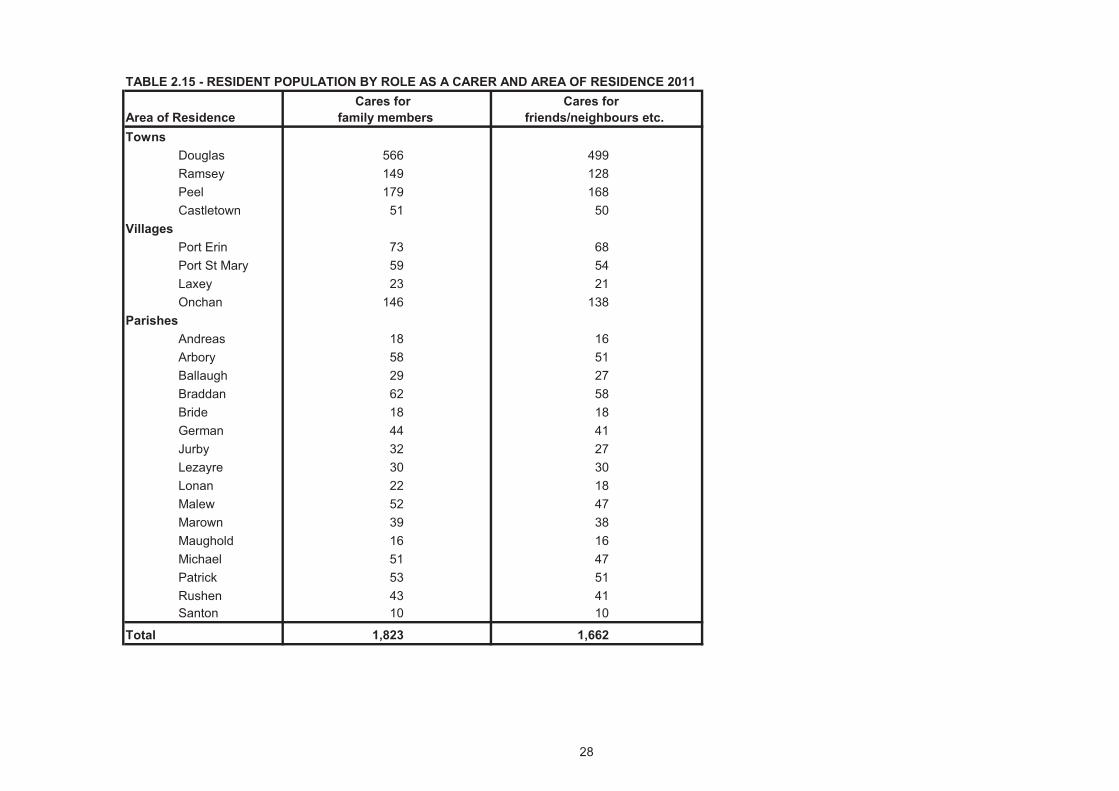
TABLE 2.15 - RESIDENT POPULATION BY ROLE AS A CARER AND AREA OF RESIDENCE 2011 Cares for Cares for
Area of Residence family members friends/neighbours etc.Towns
Douglas 566 499Ramsey 149 128Peel 179 168Castletown 51 50
VillagesPort Erin 73 68Port St Mary 59 54Laxey 23 21Onchan 146 138
ParishesAndreas 18 16Arbory 58 51Ballaugh 29 27Braddan 62 58Bride 18 18German 44 41Jurby 32 27Lezayre 30 30Lonan 22 18Malew 52 47Marown 39 38Maughold 16 16Michael 51 47Patrick 53 51Rushen 43 41Santon 10 10
Total 1,823 1,662
28
EMPLOYMENT STATISTICS
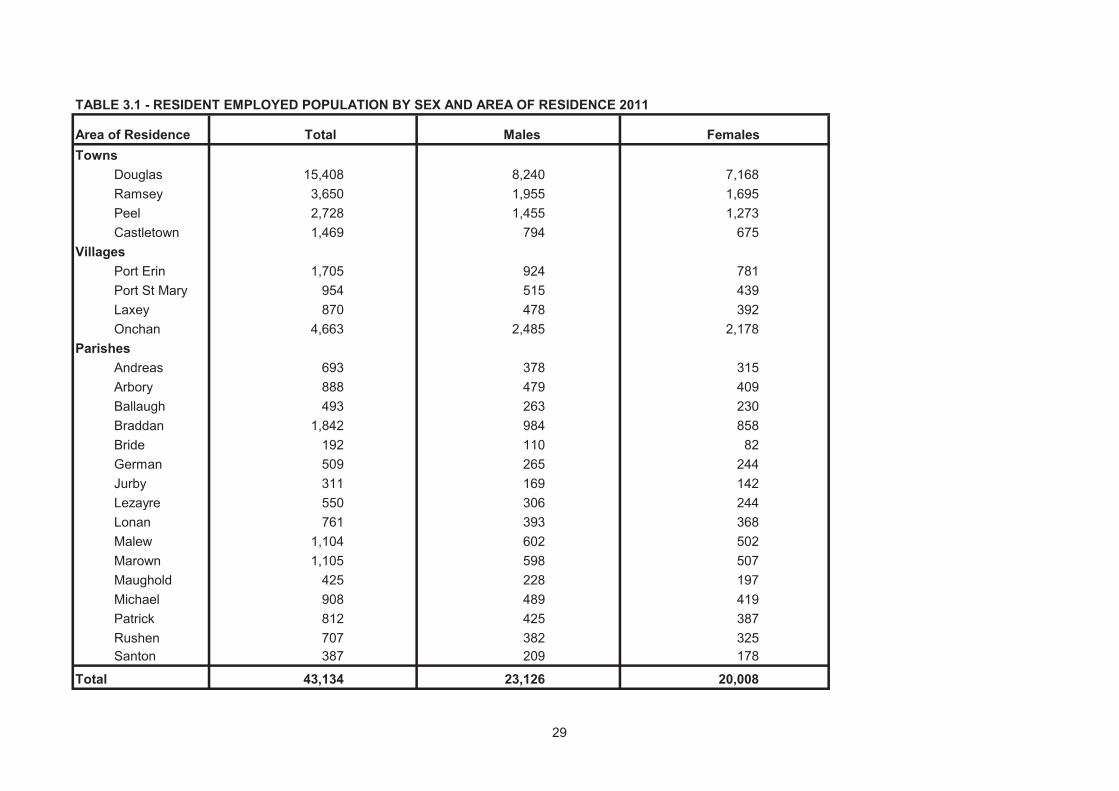
TABLE 3.1 - RESIDENT EMPLOYED POPULATION BY SEX AND AREA OF RESIDENCE 2011
Area of Residence Total Males FemalesTowns
Douglas 15,408 8,240 7,168Ramsey 3,650 1,955 1,695Peel 2,728 1,455 1,273Castletown 1,469 794 675
VillagesPort Erin 1,705 924 781Port St Mary 954 515 439Laxey 870 478 392Onchan 4,663 2,485 2,178
ParishesAndreas 693 378 315Arbory 888 479 409Ballaugh 493 263 230Braddan 1,842 984 858Bride 192 110 82German 509 265 244Jurby 311 169 142Lezayre 550 306 244Lonan 761 393 368Malew 1,104 602 502Marown 1,105 598 507Maughold 425 228 197Michael 908 489 419Patrick 812 425 387Rushen 707 382 325Santon 387 209 178
Total 43,134 23,126 20,008
29
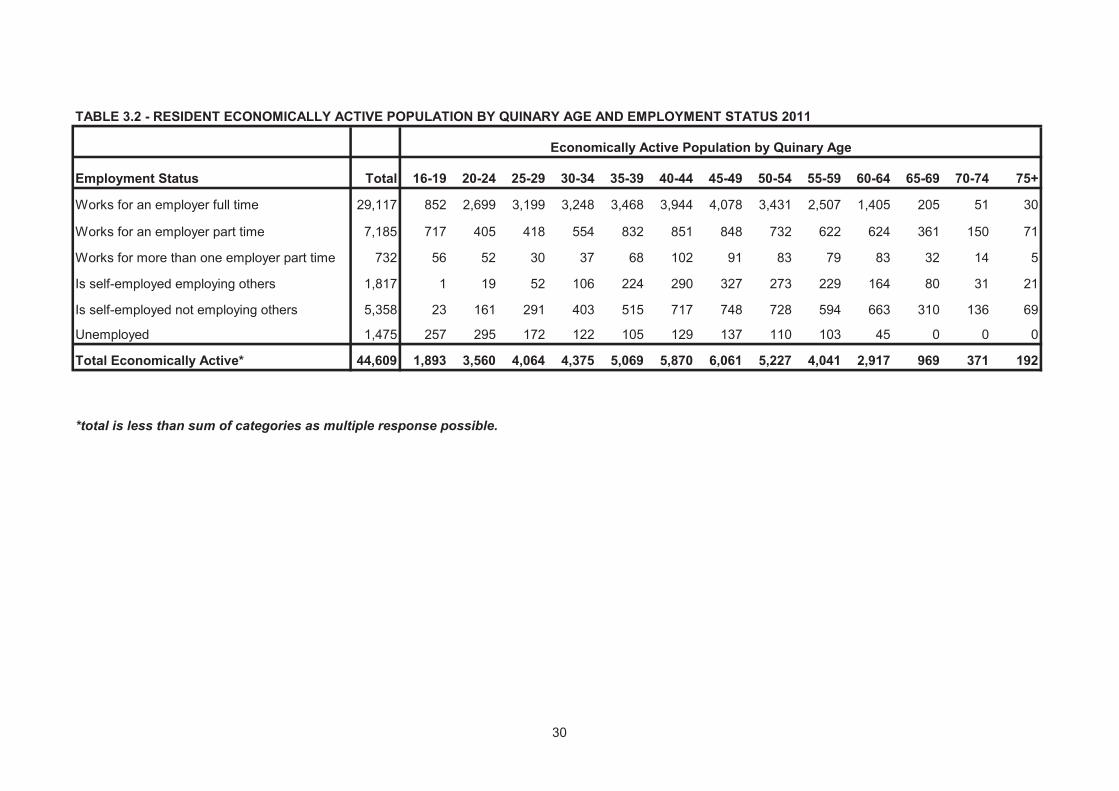
TABLE 3.2 - RESIDENT ECONOMICALLY ACTIVE POPULATION BY QUINARY AGE AND EMPLOYMENT STATUS 2011
Economically Active Population by Quinary Age
Employment Status Total 16-19 20-24 25-29 30-34 35-39 40-44 45-49 50-54 55-59 60-64 65-69 70-74 75+
Works for an employer full time 29,117 852 2,699 3,199 3,248 3,468 3,944 4,078 3,431 2,507 1,405 205 51 30
Works for an employer part time 7,185 717 405 418 554 832 851 848 732 622 624 361 150 71
Works for more than one employer part time 732 56 52 30 37 68 102 91 83 79 83 32 14 5
Is self-employed employing others 1,817 1 19 52 106 224 290 327 273 229 164 80 31 21
Is self-employed not employing others 5,358 23 161 291 403 515 717 748 728 594 663 310 136 69
Unemployed 1,475 257 295 172 122 105 129 137 110 103 45 0 0 0
Total Economically Active* 44,609 1,893 3,560 4,064 4,375 5,069 5,870 6,061 5,227 4,041 2,917 969 371 192
*total is less than sum of categories as multiple response possible.
30
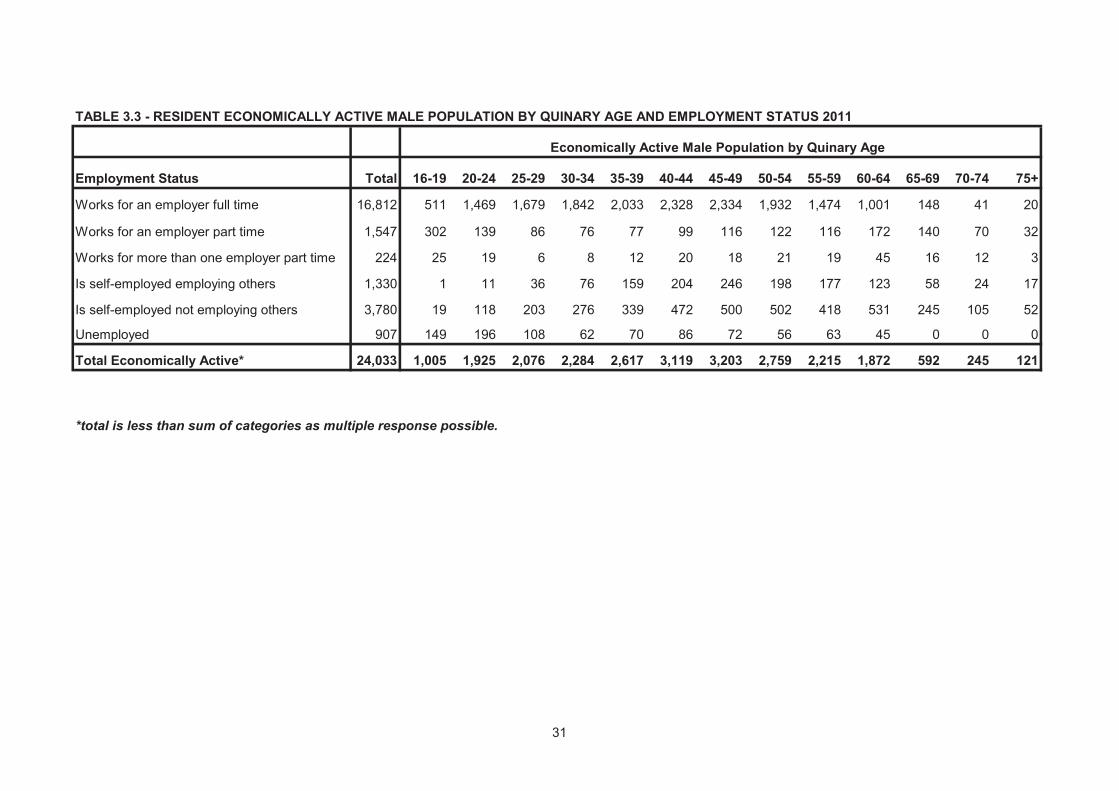
TABLE 3.3 - RESIDENT ECONOMICALLY ACTIVE MALE POPULATION BY QUINARY AGE AND EMPLOYMENT STATUS 2011
Economically Active Male Population by Quinary Age
Employment Status Total 16-19 20-24 25-29 30-34 35-39 40-44 45-49 50-54 55-59 60-64 65-69 70-74 75+
Works for an employer full time 16,812 511 1,469 1,679 1,842 2,033 2,328 2,334 1,932 1,474 1,001 148 41 20
Works for an employer part time 1,547 302 139 86 76 77 99 116 122 116 172 140 70 32
Works for more than one employer part time 224 25 19 6 8 12 20 18 21 19 45 16 12 3
Is self-employed employing others 1,330 1 11 36 76 159 204 246 198 177 123 58 24 17
Is self-employed not employing others 3,780 19 118 203 276 339 472 500 502 418 531 245 105 52
Unemployed 907 149 196 108 62 70 86 72 56 63 45 0 0 0
Total Economically Active* 24,033 1,005 1,925 2,076 2,284 2,617 3,119 3,203 2,759 2,215 1,872 592 245 121
*total is less than sum of categories as multiple response possible.
31
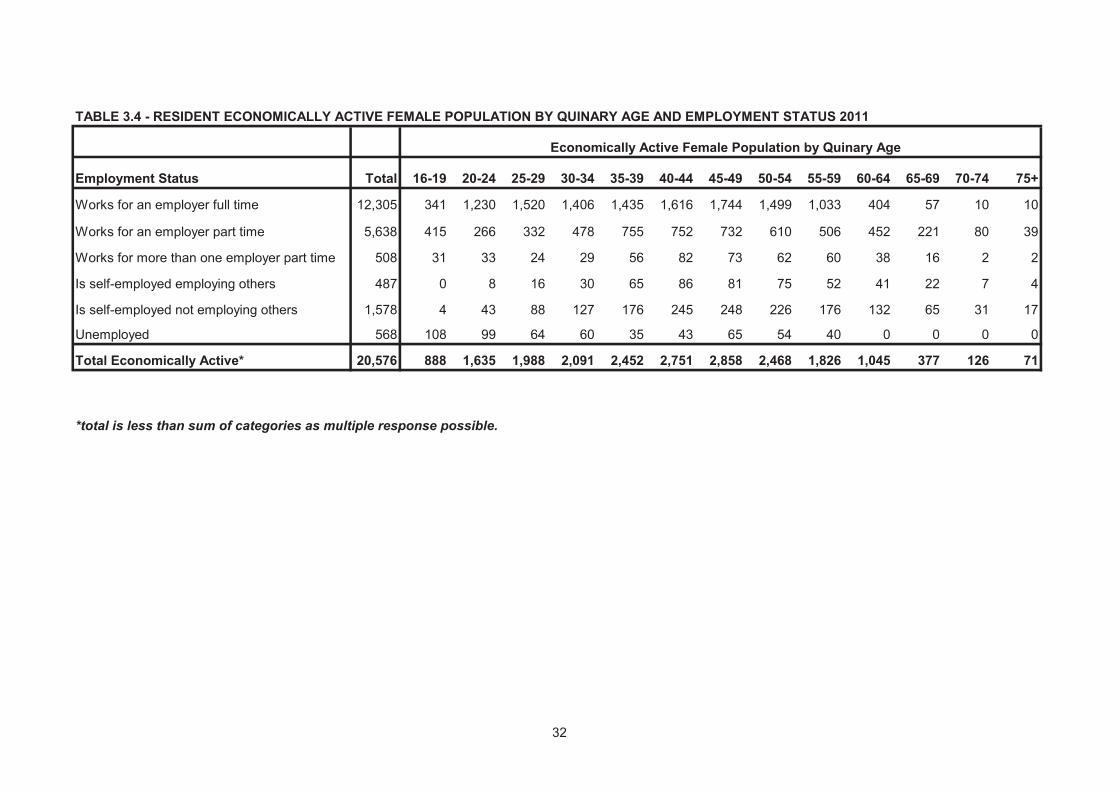
TABLE 3.4 - RESIDENT ECONOMICALLY ACTIVE FEMALE POPULATION BY QUINARY AGE AND EMPLOYMENT STATUS 2011
Economically Active Female Population by Quinary Age
Employment Status Total 16-19 20-24 25-29 30-34 35-39 40-44 45-49 50-54 55-59 60-64 65-69 70-74 75+
Works for an employer full time 12,305 341 1,230 1,520 1,406 1,435 1,616 1,744 1,499 1,033 404 57 10 10
Works for an employer part time 5,638 415 266 332 478 755 752 732 610 506 452 221 80 39
Works for more than one employer part time 508 31 33 24 29 56 82 73 62 60 38 16 2 2
Is self-employed employing others 487 0 8 16 30 65 86 81 75 52 41 22 7 4
Is self-employed not employing others 1,578 4 43 88 127 176 245 248 226 176 132 65 31 17
Unemployed 568 108 99 64 60 35 43 65 54 40 0 0 0 0
Total Economically Active* 20,576 888 1,635 1,988 2,091 2,452 2,751 2,858 2,468 1,826 1,045 377 126 71
*total is less than sum of categories as multiple response possible.
32
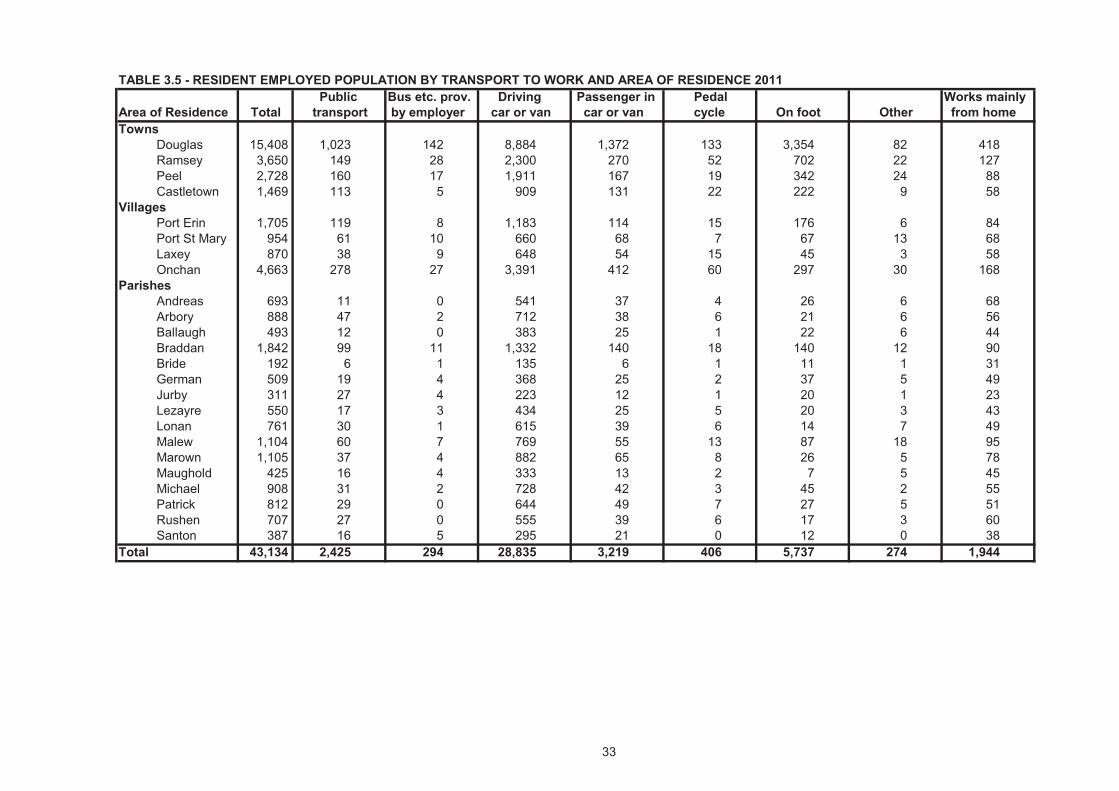
TABLE 3.5 - RESIDENT EMPLOYED POPULATION BY TRANSPORT TO WORK AND AREA OF RESIDENCE 2011 Public Bus etc. prov. Driving Passenger in Pedal Works mainly
Area of Residence Total transport by employer car or van car or van cycle On foot Other from homeTowns
Douglas 15,408 1,023 142 8,884 1,372 133 3,354 82 418Ramsey 3,650 149 28 2,300 270 52 702 22 127Peel 2,728 160 17 1,911 167 19 342 24 88Castletown 1,469 113 5 909 131 22 222 9 58
VillagesPort Erin 1,705 119 8 1,183 114 15 176 6 84Port St Mary 954 61 10 660 68 7 67 13 68Laxey 870 38 9 648 54 15 45 3 58Onchan 4,663 278 27 3,391 412 60 297 30 168
ParishesAndreas 693 11 0 541 37 4 26 6 68Arbory 888 47 2 712 38 6 21 6 56Ballaugh 493 12 0 383 25 1 22 6 44Braddan 1,842 99 11 1,332 140 18 140 12 90Bride 192 6 1 135 6 1 11 1 31German 509 19 4 368 25 2 37 5 49Jurby 311 27 4 223 12 1 20 1 23Lezayre 550 17 3 434 25 5 20 3 43Lonan 761 30 1 615 39 6 14 7 49Malew 1,104 60 7 769 55 13 87 18 95Marown 1,105 37 4 882 65 8 26 5 78Maughold 425 16 4 333 13 2 7 5 45Michael 908 31 2 728 42 3 45 2 55Patrick 812 29 0 644 49 7 27 5 51Rushen 707 27 0 555 39 6 17 3 60Santon 387 16 5 295 21 0 12 0 38
Total 43,134 2,425 294 28,835 3,219 406 5,737 274 1,944
33
34
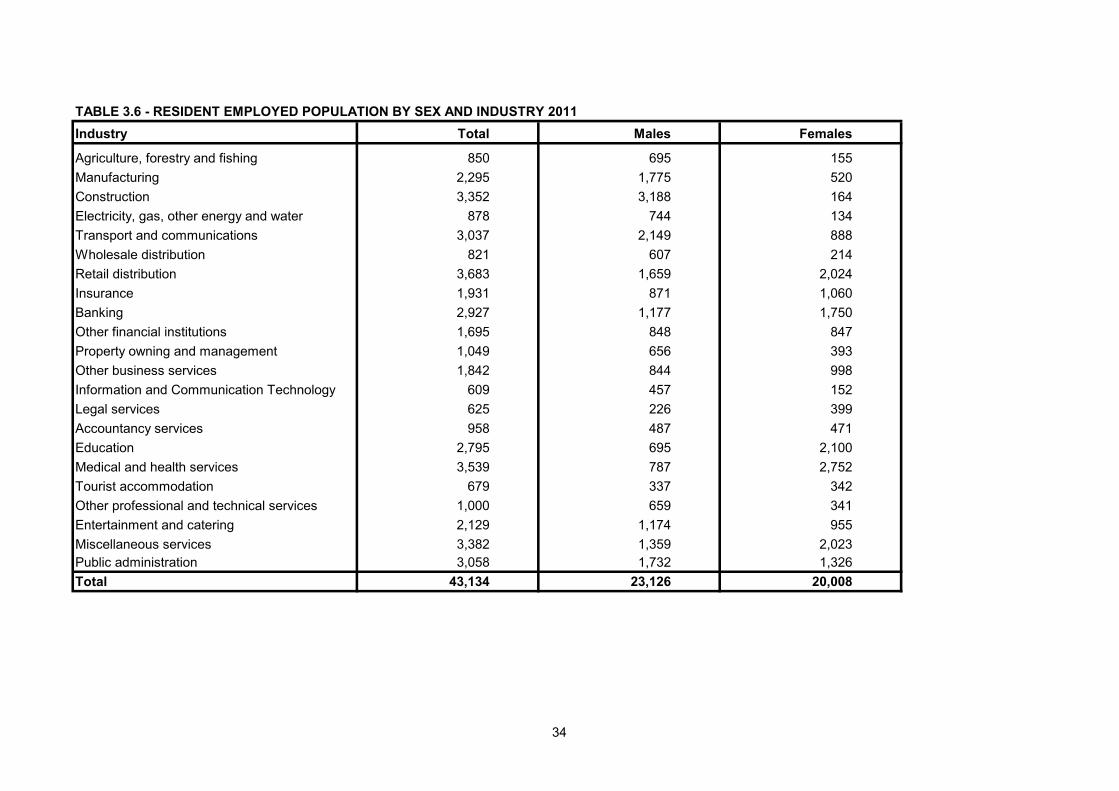
TABLE 3.6 - RESIDENT EMPLOYED POPULATION BY SEX AND INDUSTRY 2011Industry Total Males Females
Agriculture, forestry and fishing 850 695 155Manufacturing 2,295 1,775 520Construction 3,352 3,188 164Electricity, gas, other energy and water 878 744 134Transport and communications 3,037 2,149 888Wholesale distribution 821 607 214Retail distribution 3,683 1,659 2,024Insurance 1,931 871 1,060Banking 2,927 1,177 1,750Other financial institutions 1,695 848 847Property owning and management 1,049 656 393Other business services 1,842 844 998Information and Communication Technology 609 457 152Legal services 625 226 399Accountancy services 958 487 471Education 2,795 695 2,100Medical and health services 3,539 787 2,752Tourist accommodation 679 337 342Other professional and technical services 1,000 659 341Entertainment and catering 2,129 1,174 955Miscellaneous services 3,382 1,359 2,023Public administration 3,058 1,732 1,326Total 43,134 23,126 20,008
35
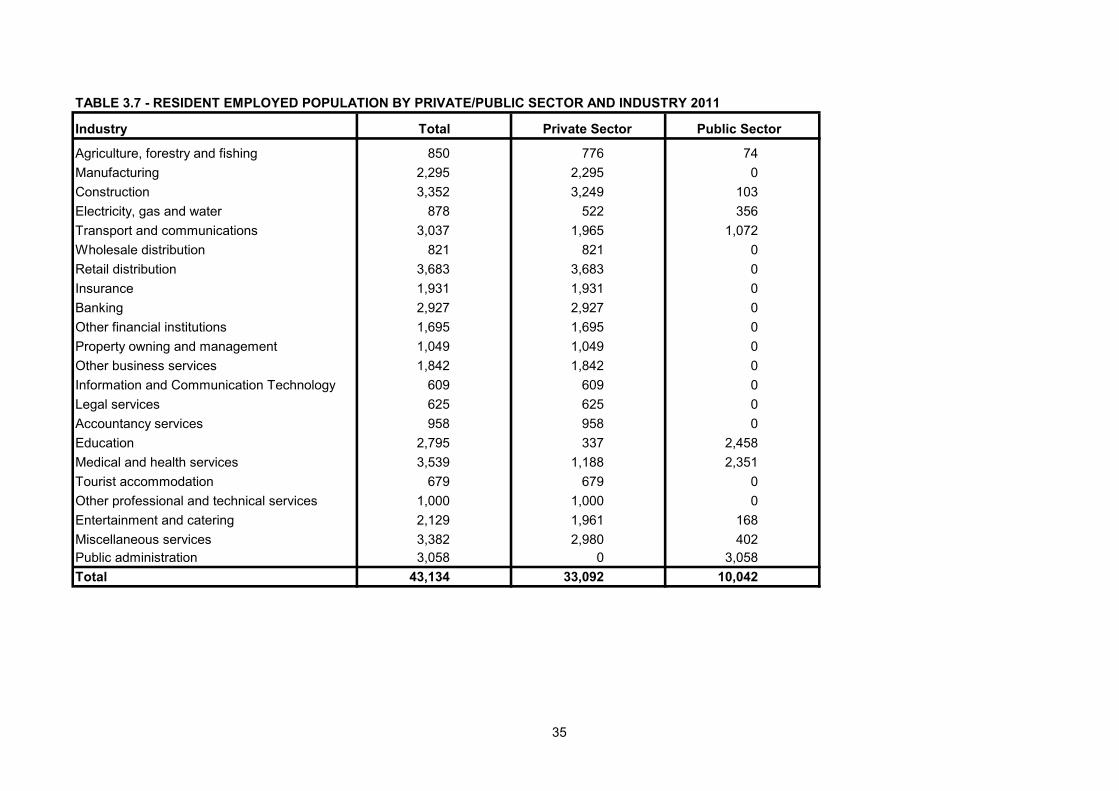
TABLE 3.7 - RESIDENT EMPLOYED POPULATION BY PRIVATE/PUBLIC SECTOR AND INDUSTRY 2011
Industry Total Private Sector Public Sector
Agriculture, forestry and fishing 850 776 74Manufacturing 2,295 2,295 0Construction 3,352 3,249 103Electricity, gas and water 878 522 356Transport and communications 3,037 1,965 1,072Wholesale distribution 821 821 0Retail distribution 3,683 3,683 0Insurance 1,931 1,931 0Banking 2,927 2,927 0Other financial institutions 1,695 1,695 0Property owning and management 1,049 1,049 0Other business services 1,842 1,842 0Information and Communication Technology 609 609 0Legal services 625 625 0Accountancy services 958 958 0Education 2,795 337 2,458Medical and health services 3,539 1,188 2,351Tourist accommodation 679 679 0Other professional and technical services 1,000 1,000 0Entertainment and catering 2,129 1,961 168Miscellaneous services 3,382 2,980 402Public administration 3,058 0 3,058Total 43,134 33,092 10,042
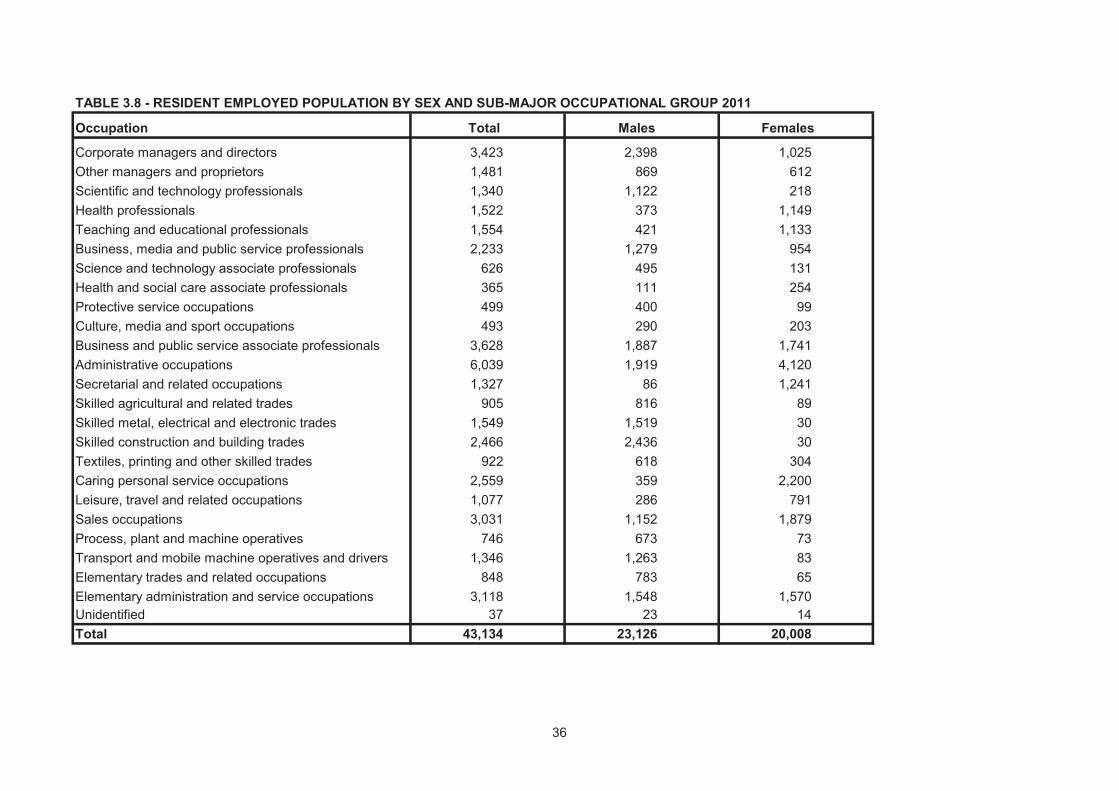
TABLE 3.8 - RESIDENT EMPLOYED POPULATION BY SEX AND SUB-MAJOR OCCUPATIONAL GROUP 2011
Occupation Total Males Females
Corporate managers and directors 3,423 2,398 1,025Other managers and proprietors 1,481 869 612Scientific and technology professionals 1,340 1,122 218Health professionals 1,522 373 1,149Teaching and educational professionals 1,554 421 1,133Business, media and public service professionals 2,233 1,279 954Science and technology associate professionals 626 495 131Health and social care associate professionals 365 111 254Protective service occupations 499 400 99Culture, media and sport occupations 493 290 203Business and public service associate professionals 3,628 1,887 1,741Administrative occupations 6,039 1,919 4,120Secretarial and related occupations 1,327 86 1,241Skilled agricultural and related trades 905 816 89Skilled metal, electrical and electronic trades 1,549 1,519 30Skilled construction and building trades 2,466 2,436 30Textiles, printing and other skilled trades 922 618 304Caring personal service occupations 2,559 359 2,200Leisure, travel and related occupations 1,077 286 791Sales occupations 3,031 1,152 1,879Process, plant and machine operatives 746 673 73Transport and mobile machine operatives and drivers 1,346 1,263 83Elementary trades and related occupations 848 783 65Elementary administration and service occupations 3,118 1,548 1,570Unidentified 37 23 14Total 43,134 23,126 20,008
36
37
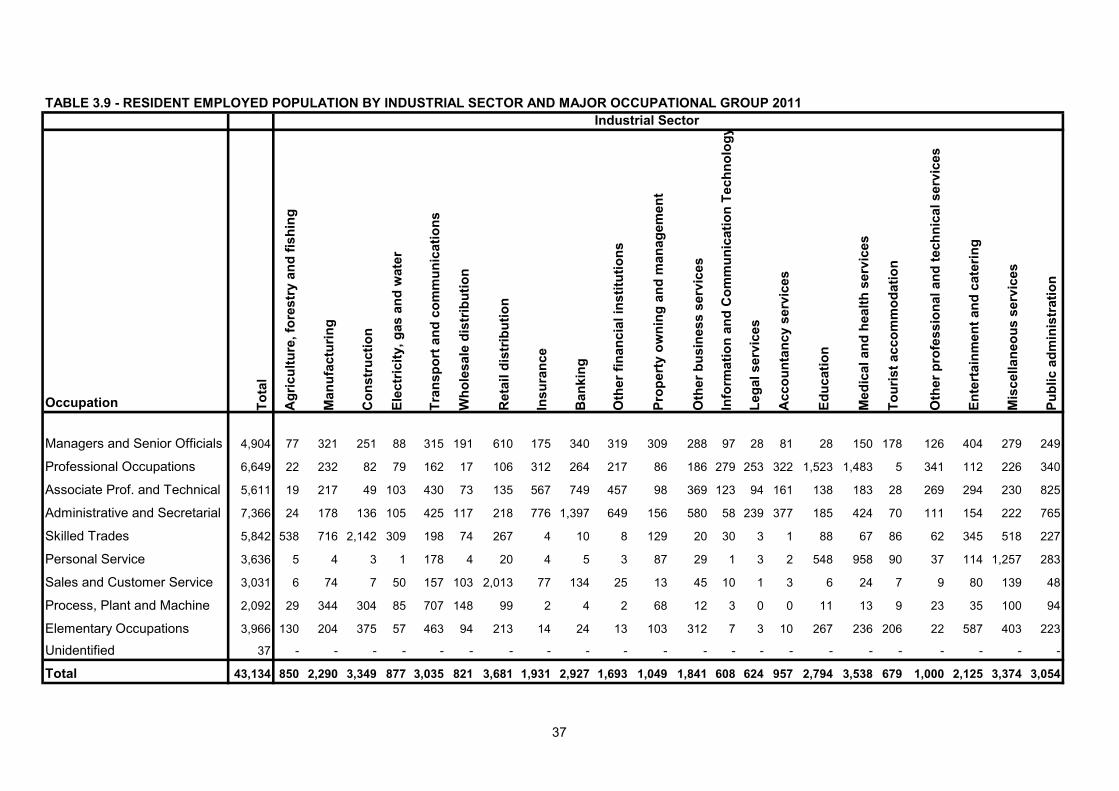
TABLE 3.9 - RESIDENT EMPLOYED POPULATION BY INDUSTRIAL SECTOR AND MAJOR OCCUPATIONAL GROUP 2011Industrial Sector
Occupation Tota
l
Agr
icul
ture
, for
estr
y an
d fis
hing
Man
ufac
turin
g
Con
stru
ctio
n
Elec
tric
ity, g
as a
nd w
ater
Tran
spor
t and
com
mun
icat
ions
Who
lesa
le d
istr
ibut
ion
Ret
ail d
istr
ibut
ion
Insu
ranc
e
Ban
king
Oth
er fi
nanc
ial i
nstit
utio
ns
Prop
erty
ow
ning
and
man
agem
ent
Oth
er b
usin
ess
serv
ices
Info
rmat
ion
and
Com
mun
icat
ion
Tech
nolo
gy
Lega
l ser
vice
s
Acc
ount
ancy
ser
vice
s
Educ
atio
n
Med
ical
and
hea
lth s
ervi
ces
Tour
ist a
ccom
mod
atio
n
Oth
er p
rofe
ssio
nal a
nd te
chni
cal s
ervi
ces
Ente
rtai
nmen
t and
cat
erin
g
Mis
cella
neou
s se
rvic
es
Publ
ic a
dmin
istr
atio
n
Managers and Senior Officials 4,904 77 321 251 88 315 191 610 175 340 319 309 288 97 28 81 28 150 178 126 404 279 249
Professional Occupations 6,649 22 232 82 79 162 17 106 312 264 217 86 186 279 253 322 1,523 1,483 5 341 112 226 340
Associate Prof. and Technical 5,611 19 217 49 103 430 73 135 567 749 457 98 369 123 94 161 138 183 28 269 294 230 825
Administrative and Secretarial 7,366 24 178 136 105 425 117 218 776 1,397 649 156 580 58 239 377 185 424 70 111 154 222 765
Skilled Trades 5,842 538 716 2,142 309 198 74 267 4 10 8 129 20 30 3 1 88 67 86 62 345 518 227
Personal Service 3,636 5 4 3 1 178 4 20 4 5 3 87 29 1 3 2 548 958 90 37 114 1,257 283
Sales and Customer Service 3,031 6 74 7 50 157 103 2,013 77 134 25 13 45 10 1 3 6 24 7 9 80 139 48
Process, Plant and Machine 2,092 29 344 304 85 707 148 99 2 4 2 68 12 3 0 0 11 13 9 23 35 100 94
Elementary Occupations 3,966 130 204 375 57 463 94 213 14 24 13 103 312 7 3 10 267 236 206 22 587 403 223
Unidentified 37 - - - - - - - - - - - - - - - - - - - - - -
Total 43,134 850 2,290 3,349 877 3,035 821 3,681 1,931 2,927 1,693 1,049 1,841 608 624 957 2,794 3,538 679 1,000 2,125 3,374 3,054
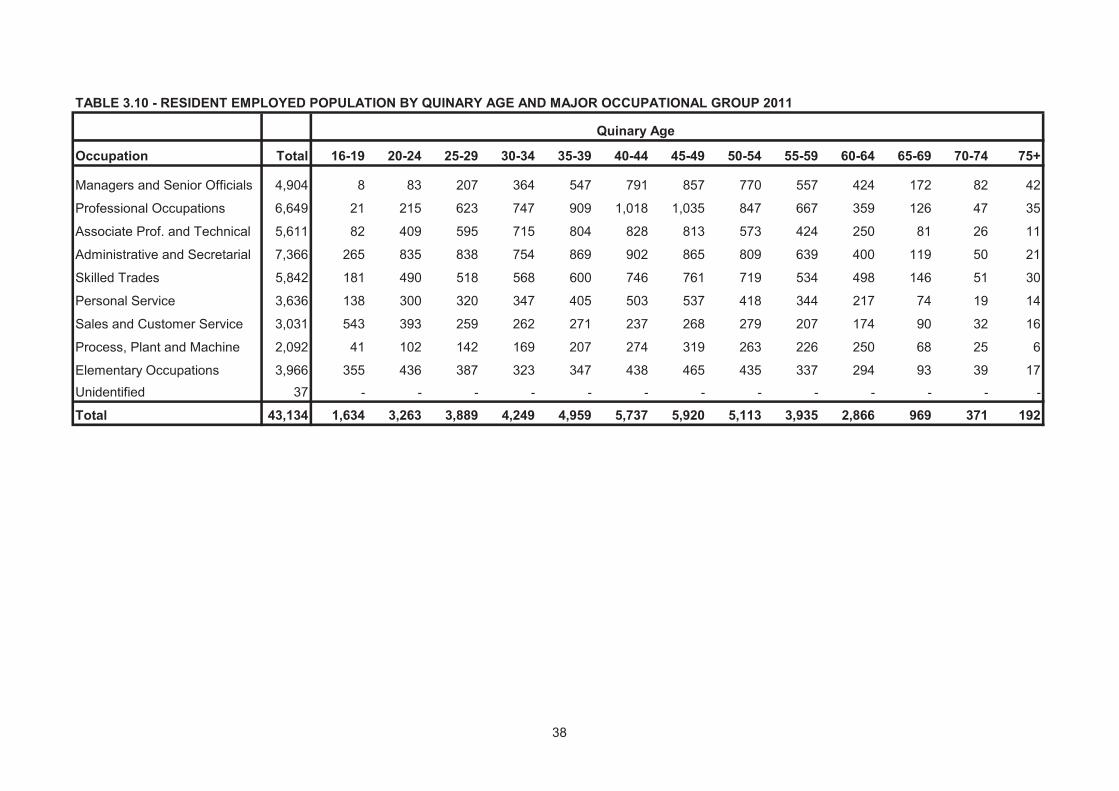
TABLE 3.10 - RESIDENT EMPLOYED POPULATION BY QUINARY AGE AND MAJOR OCCUPATIONAL GROUP 2011
Quinary Age
Occupation Total 16-19 20-24 25-29 30-34 35-39 40-44 45-49 50-54 55-59 60-64 65-69 70-74 75+
Managers and Senior Officials 4,904 8 83 207 364 547 791 857 770 557 424 172 82 42
Professional Occupations 6,649 21 215 623 747 909 1,018 1,035 847 667 359 126 47 35
Associate Prof. and Technical 5,611 82 409 595 715 804 828 813 573 424 250 81 26 11
Administrative and Secretarial 7,366 265 835 838 754 869 902 865 809 639 400 119 50 21
Skilled Trades 5,842 181 490 518 568 600 746 761 719 534 498 146 51 30
Personal Service 3,636 138 300 320 347 405 503 537 418 344 217 74 19 14
Sales and Customer Service 3,031 543 393 259 262 271 237 268 279 207 174 90 32 16
Process, Plant and Machine 2,092 41 102 142 169 207 274 319 263 226 250 68 25 6
Elementary Occupations 3,966 355 436 387 323 347 438 465 435 337 294 93 39 17Unidentified 37 - - - - - - - - - - - - -
Total 43,134 1,634 3,263 3,889 4,249 4,959 5,737 5,920 5,113 3,935 2,866 969 371 192
38
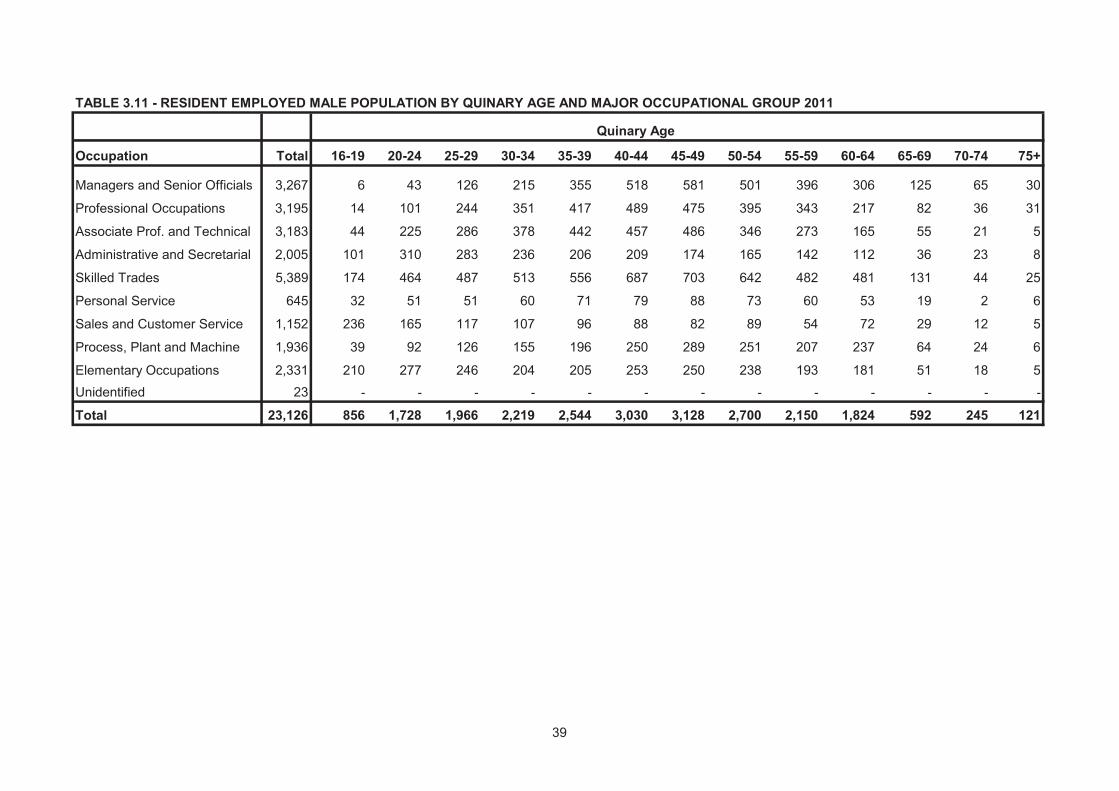
TABLE 3.11 - RESIDENT EMPLOYED MALE POPULATION BY QUINARY AGE AND MAJOR OCCUPATIONAL GROUP 2011
Quinary Age
Occupation Total 16-19 20-24 25-29 30-34 35-39 40-44 45-49 50-54 55-59 60-64 65-69 70-74 75+
Managers and Senior Officials 3,267 6 43 126 215 355 518 581 501 396 306 125 65 30
Professional Occupations 3,195 14 101 244 351 417 489 475 395 343 217 82 36 31
Associate Prof. and Technical 3,183 44 225 286 378 442 457 486 346 273 165 55 21 5
Administrative and Secretarial 2,005 101 310 283 236 206 209 174 165 142 112 36 23 8
Skilled Trades 5,389 174 464 487 513 556 687 703 642 482 481 131 44 25
Personal Service 645 32 51 51 60 71 79 88 73 60 53 19 2 6
Sales and Customer Service 1,152 236 165 117 107 96 88 82 89 54 72 29 12 5
Process, Plant and Machine 1,936 39 92 126 155 196 250 289 251 207 237 64 24 6
Elementary Occupations 2,331 210 277 246 204 205 253 250 238 193 181 51 18 5Unidentified 23 - - - - - - - - - - - - -
Total 23,126 856 1,728 1,966 2,219 2,544 3,030 3,128 2,700 2,150 1,824 592 245 121
39
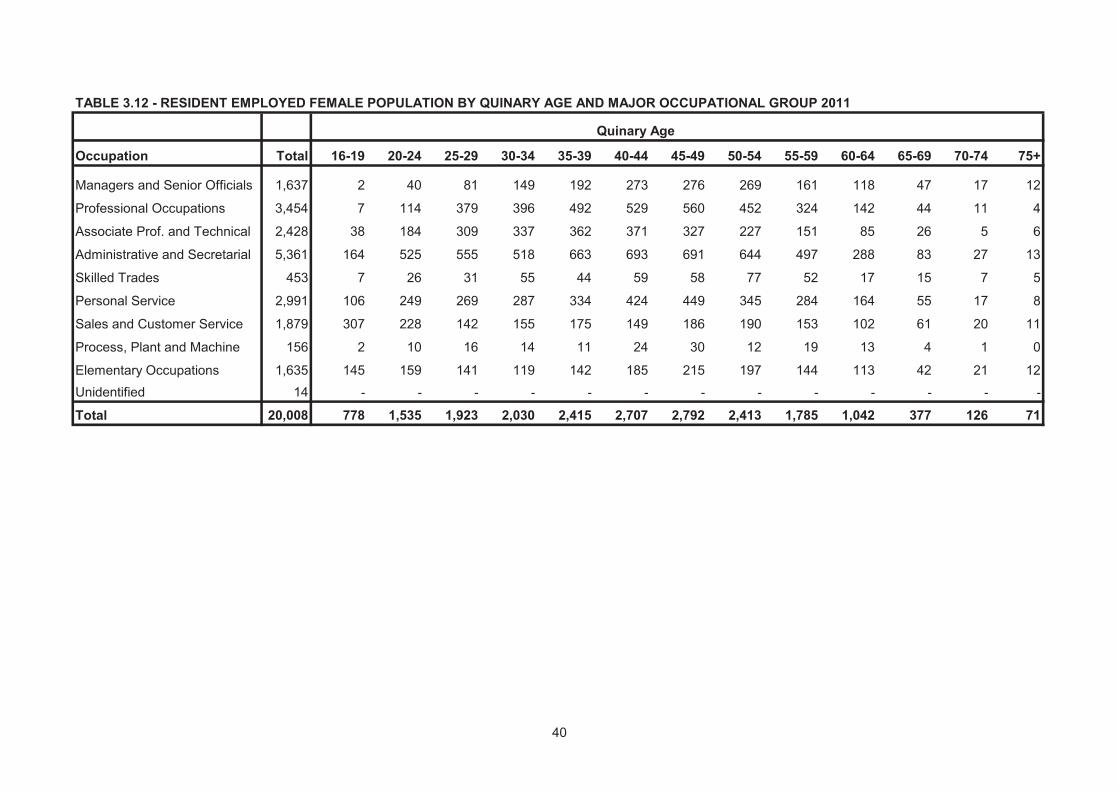
TABLE 3.12 - RESIDENT EMPLOYED FEMALE POPULATION BY QUINARY AGE AND MAJOR OCCUPATIONAL GROUP 2011
Quinary Age
Occupation Total 16-19 20-24 25-29 30-34 35-39 40-44 45-49 50-54 55-59 60-64 65-69 70-74 75+
Managers and Senior Officials 1,637 2 40 81 149 192 273 276 269 161 118 47 17 12
Professional Occupations 3,454 7 114 379 396 492 529 560 452 324 142 44 11 4
Associate Prof. and Technical 2,428 38 184 309 337 362 371 327 227 151 85 26 5 6
Administrative and Secretarial 5,361 164 525 555 518 663 693 691 644 497 288 83 27 13
Skilled Trades 453 7 26 31 55 44 59 58 77 52 17 15 7 5
Personal Service 2,991 106 249 269 287 334 424 449 345 284 164 55 17 8
Sales and Customer Service 1,879 307 228 142 155 175 149 186 190 153 102 61 20 11
Process, Plant and Machine 156 2 10 16 14 11 24 30 12 19 13 4 1 0
Elementary Occupations 1,635 145 159 141 119 142 185 215 197 144 113 42 21 12Unidentified 14 - - - - - - - - - - - - -
Total 20,008 778 1,535 1,923 2,030 2,415 2,707 2,792 2,413 1,785 1,042 377 126 71
40
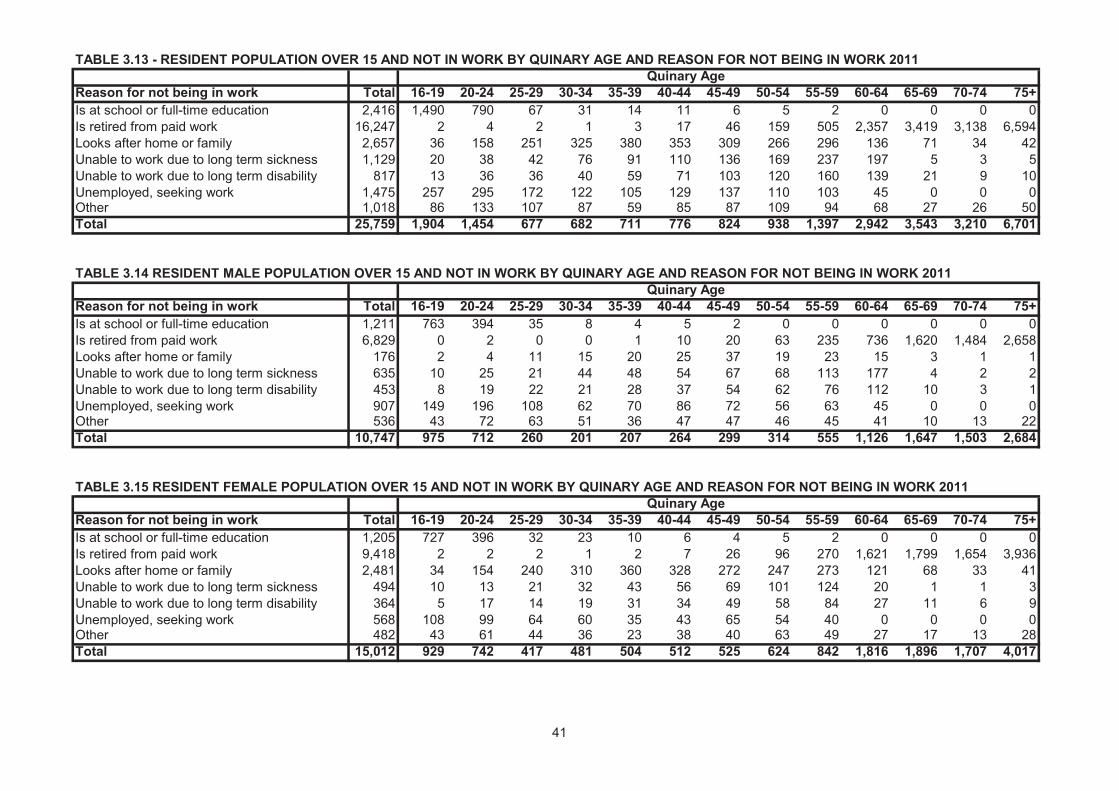
TABLE 3.13 - RESIDENT POPULATION OVER 15 AND NOT IN WORK BY QUINARY AGE AND REASON FOR NOT BEING IN WORK 2011Quinary Age
Reason for not being in work Total 16-19 20-24 25-29 30-34 35-39 40-44 45-49 50-54 55-59 60-64 65-69 70-74 75+Is at school or full-time education 2,416 1,490 790 67 31 14 11 6 5 2 0 0 0 0Is retired from paid work 16,247 2 4 2 1 3 17 46 159 505 2,357 3,419 3,138 6,594Looks after home or family 2,657 36 158 251 325 380 353 309 266 296 136 71 34 42Unable to work due to long term sickness 1,129 20 38 42 76 91 110 136 169 237 197 5 3 5Unable to work due to long term disability 817 13 36 36 40 59 71 103 120 160 139 21 9 10Unemployed, seeking work 1,475 257 295 172 122 105 129 137 110 103 45 0 0 0Other 1,018 86 133 107 87 59 85 87 109 94 68 27 26 50Total 25,759 1,904 1,454 677 682 711 776 824 938 1,397 2,942 3,543 3,210 6,701
TABLE 3.14 RESIDENT MALE POPULATION OVER 15 AND NOT IN WORK BY QUINARY AGE AND REASON FOR NOT BEING IN WORK 2011Quinary Age
Reason for not being in work Total 16-19 20-24 25-29 30-34 35-39 40-44 45-49 50-54 55-59 60-64 65-69 70-74 75+Is at school or full-time education 1,211 763 394 35 8 4 5 2 0 0 0 0 0 0Is retired from paid work 6,829 0 2 0 0 1 10 20 63 235 736 1,620 1,484 2,658Looks after home or family 176 2 4 11 15 20 25 37 19 23 15 3 1 1Unable to work due to long term sickness 635 10 25 21 44 48 54 67 68 113 177 4 2 2Unable to work due to long term disability 453 8 19 22 21 28 37 54 62 76 112 10 3 1Unemployed, seeking work 907 149 196 108 62 70 86 72 56 63 45 0 0 0Other 536 43 72 63 51 36 47 47 46 45 41 10 13 22Total 10,747 975 712 260 201 207 264 299 314 555 1,126 1,647 1,503 2,684
TABLE 3.15 RESIDENT FEMALE POPULATION OVER 15 AND NOT IN WORK BY QUINARY AGE AND REASON FOR NOT BEING IN WORK 2011Quinary Age
Reason for not being in work Total 16-19 20-24 25-29 30-34 35-39 40-44 45-49 50-54 55-59 60-64 65-69 70-74 75+Is at school or full-time education 1,205 727 396 32 23 10 6 4 5 2 0 0 0 0Is retired from paid work 9,418 2 2 2 1 2 7 26 96 270 1,621 1,799 1,654 3,936Looks after home or family 2,481 34 154 240 310 360 328 272 247 273 121 68 33 41Unable to work due to long term sickness 494 10 13 21 32 43 56 69 101 124 20 1 1 3Unable to work due to long term disability 364 5 17 14 19 31 34 49 58 84 27 11 6 9Unemployed, seeking work 568 108 99 64 60 35 43 65 54 40 0 0 0 0Other 482 43 61 44 36 23 38 40 63 49 27 17 13 28Total 15,012 929 742 417 481 504 512 525 624 842 1,816 1,896 1,707 4,017
41
HOUSEHOLD STATISTICS
42
TABLE 4.1 - RESIDENT HOUSEHOLDS BY AREA OF RESIDENCE 2011
Area of Residence Number of Private Households Residents in Private Households Average Household SizeTowns
Douglas 11,702 27,247 2.33Ramsey 3,530 7,592 2.15Peel 2,168 4,998 2.31Castletown 1,353 3,060 2.26
VillagesPort Erin 1,631 3,531 2.16Port St Mary 860 1,932 2.25Laxey 716 1,695 2.37Onchan 3,993 9,274 2.32
ParishesAndreas 595 1,428 2.40Arbory 758 1,750 2.31Ballaugh 438 1,042 2.38Braddan 1,350 3,443 2.55Bride 168 400 2.38German 433 1,024 2.36Jurby 264 686 2.60Lezayre 510 1,268 2.49Lonan 621 1,533 2.47Malew 977 2,330 2.38Marown 885 2,309 2.61Maughold 403 973 2.41Michael 682 1,723 2.53Patrick 604 1,531 2.53Rushen 675 1,568 2.32Santon 283 689 2.43
Total 35,599 83,026 2.33
43
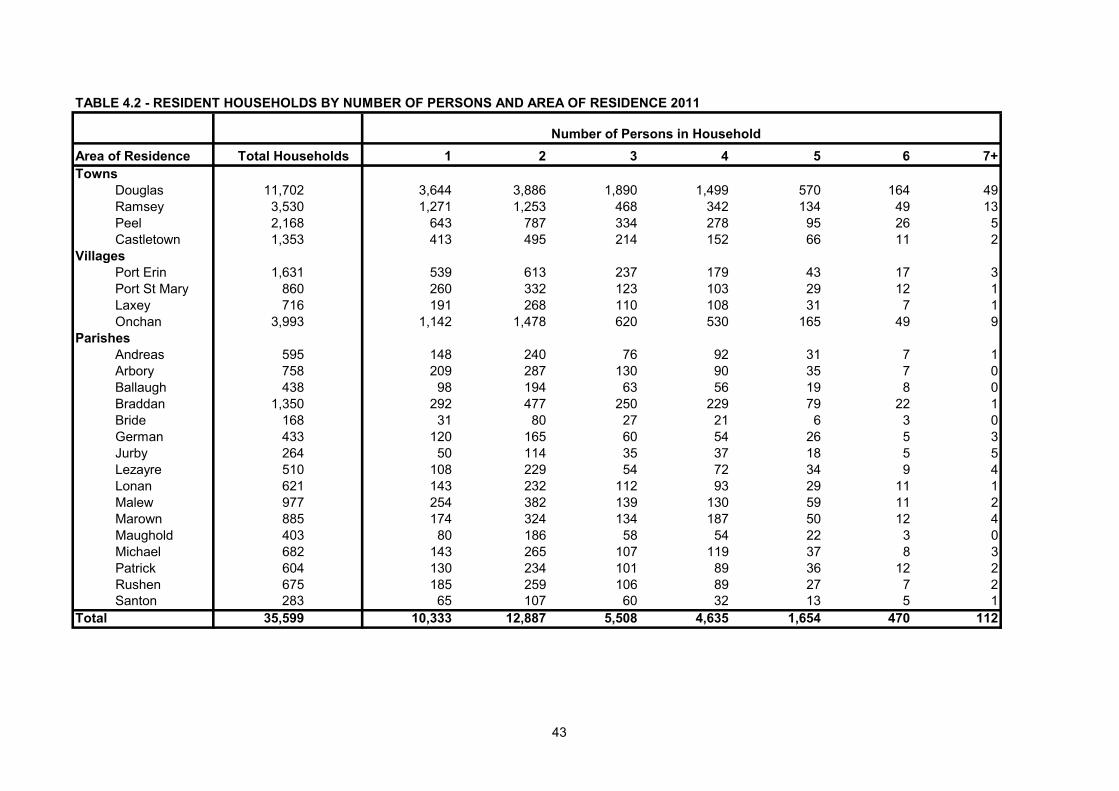
TABLE 4.2 - RESIDENT HOUSEHOLDS BY NUMBER OF PERSONS AND AREA OF RESIDENCE 2011
Number of Persons in HouseholdArea of Residence Total Households 1 2 3 4 5 6 7+Towns
Douglas 11,702 3,644 3,886 1,890 1,499 570 164 49Ramsey 3,530 1,271 1,253 468 342 134 49 13Peel 2,168 643 787 334 278 95 26 5Castletown 1,353 413 495 214 152 66 11 2
VillagesPort Erin 1,631 539 613 237 179 43 17 3Port St Mary 860 260 332 123 103 29 12 1Laxey 716 191 268 110 108 31 7 1Onchan 3,993 1,142 1,478 620 530 165 49 9
ParishesAndreas 595 148 240 76 92 31 7 1Arbory 758 209 287 130 90 35 7 0Ballaugh 438 98 194 63 56 19 8 0Braddan 1,350 292 477 250 229 79 22 1Bride 168 31 80 27 21 6 3 0German 433 120 165 60 54 26 5 3Jurby 264 50 114 35 37 18 5 5Lezayre 510 108 229 54 72 34 9 4Lonan 621 143 232 112 93 29 11 1Malew 977 254 382 139 130 59 11 2Marown 885 174 324 134 187 50 12 4Maughold 403 80 186 58 54 22 3 0Michael 682 143 265 107 119 37 8 3Patrick 604 130 234 101 89 36 12 2Rushen 675 185 259 106 89 27 7 2Santon 283 65 107 60 32 13 5 1
Total 35,599 10,333 12,887 5,508 4,635 1,654 470 112
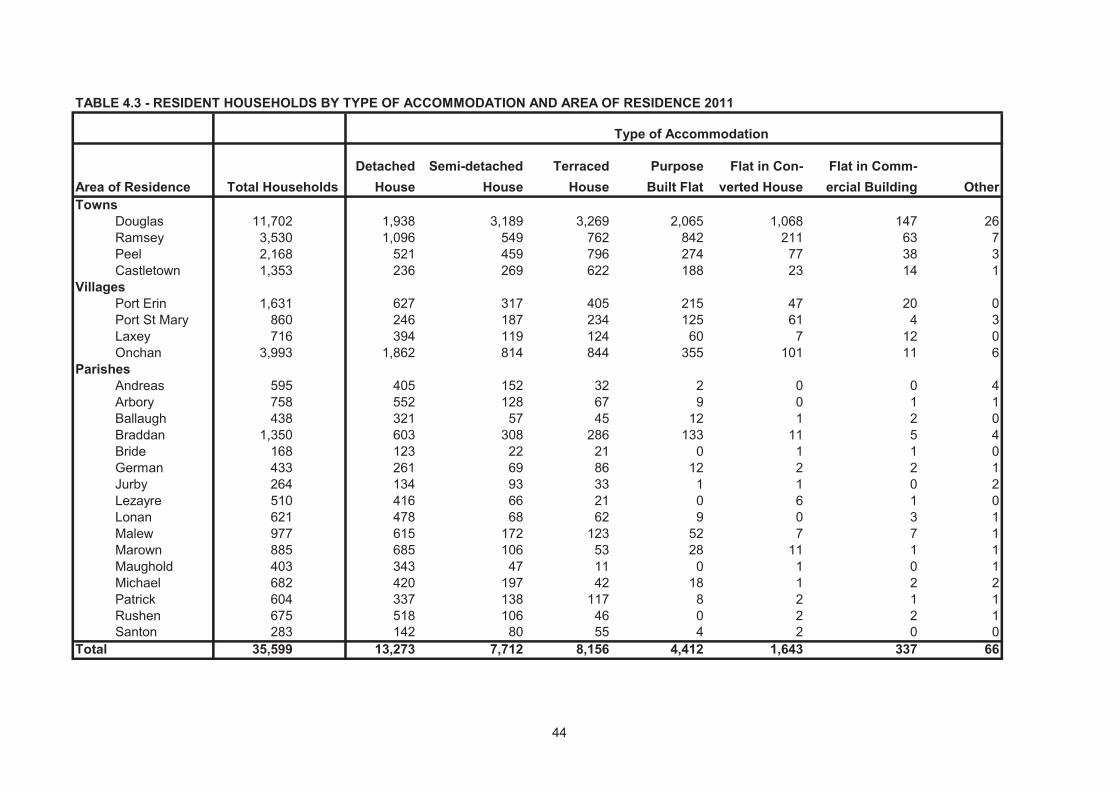
TABLE 4.3 - RESIDENT HOUSEHOLDS BY TYPE OF ACCOMMODATION AND AREA OF RESIDENCE 2011
Type of Accommodation
Detached Semi-detached Terraced Purpose Flat in Con- Flat in Comm-Area of Residence Total Households House House House Built Flat verted House ercial Building OtherTowns
Douglas 11,702 1,938 3,189 3,269 2,065 1,068 147 26Ramsey 3,530 1,096 549 762 842 211 63 7Peel 2,168 521 459 796 274 77 38 3Castletown 1,353 236 269 622 188 23 14 1
VillagesPort Erin 1,631 627 317 405 215 47 20 0Port St Mary 860 246 187 234 125 61 4 3Laxey 716 394 119 124 60 7 12 0Onchan 3,993 1,862 814 844 355 101 11 6
ParishesAndreas 595 405 152 32 2 0 0 4Arbory 758 552 128 67 9 0 1 1Ballaugh 438 321 57 45 12 1 2 0Braddan 1,350 603 308 286 133 11 5 4Bride 168 123 22 21 0 1 1 0German 433 261 69 86 12 2 2 1Jurby 264 134 93 33 1 1 0 2Lezayre 510 416 66 21 0 6 1 0Lonan 621 478 68 62 9 0 3 1Malew 977 615 172 123 52 7 7 1Marown 885 685 106 53 28 11 1 1Maughold 403 343 47 11 0 1 0 1Michael 682 420 197 42 18 1 2 2Patrick 604 337 138 117 8 2 1 1Rushen 675 518 106 46 0 2 2 1Santon 283 142 80 55 4 2 0 0
Total 35,599 13,273 7,712 8,156 4,412 1,643 337 66
44
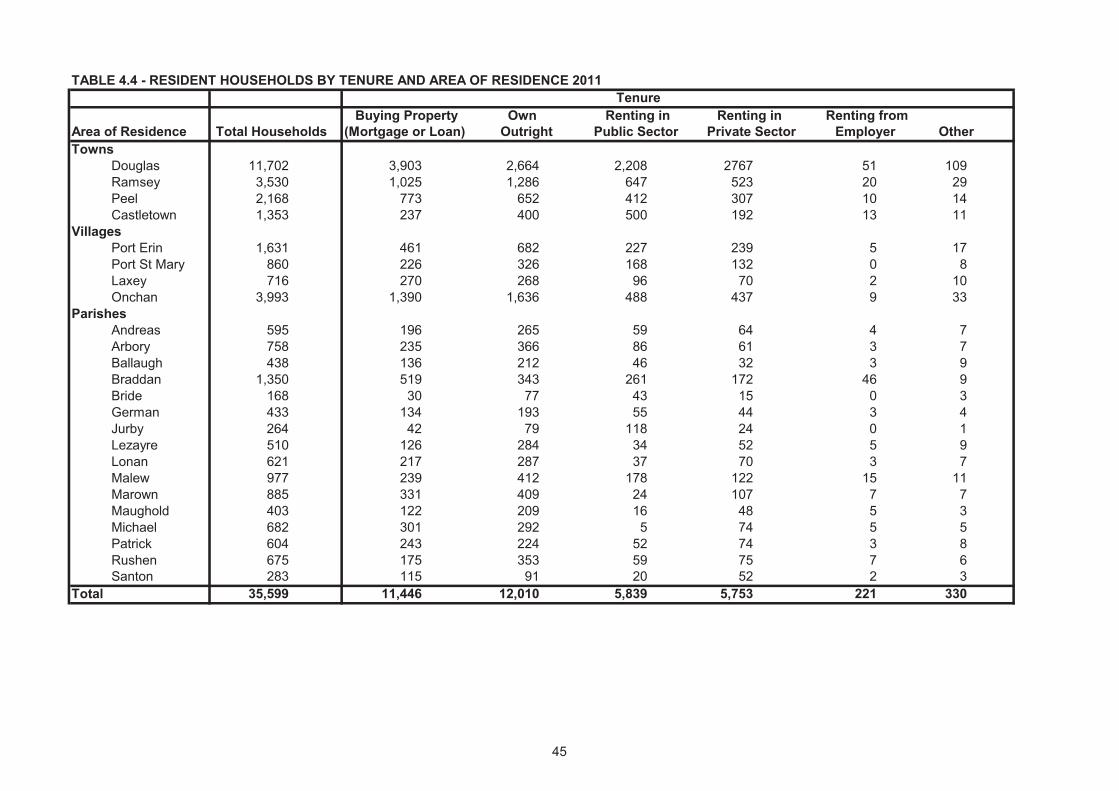
TABLE 4.4 - RESIDENT HOUSEHOLDS BY TENURE AND AREA OF RESIDENCE 2011 Tenure
Buying Property Own Renting in Renting in Renting fromArea of Residence Total Households (Mortgage or Loan) Outright Public Sector Private Sector Employer OtherTowns
Douglas 11,702 3,903 2,664 2,208 2767 51 109Ramsey 3,530 1,025 1,286 647 523 20 29Peel 2,168 773 652 412 307 10 14Castletown 1,353 237 400 500 192 13 11
VillagesPort Erin 1,631 461 682 227 239 5 17Port St Mary 860 226 326 168 132 0 8Laxey 716 270 268 96 70 2 10Onchan 3,993 1,390 1,636 488 437 9 33
ParishesAndreas 595 196 265 59 64 4 7Arbory 758 235 366 86 61 3 7Ballaugh 438 136 212 46 32 3 9Braddan 1,350 519 343 261 172 46 9Bride 168 30 77 43 15 0 3German 433 134 193 55 44 3 4Jurby 264 42 79 118 24 0 1Lezayre 510 126 284 34 52 5 9Lonan 621 217 287 37 70 3 7Malew 977 239 412 178 122 15 11Marown 885 331 409 24 107 7 7Maughold 403 122 209 16 48 5 3Michael 682 301 292 5 74 5 5Patrick 604 243 224 52 74 3 8Rushen 675 175 353 59 75 7 6Santon 283 115 91 20 52 2 3
Total 35,599 11,446 12,010 5,839 5,753 221 330
45
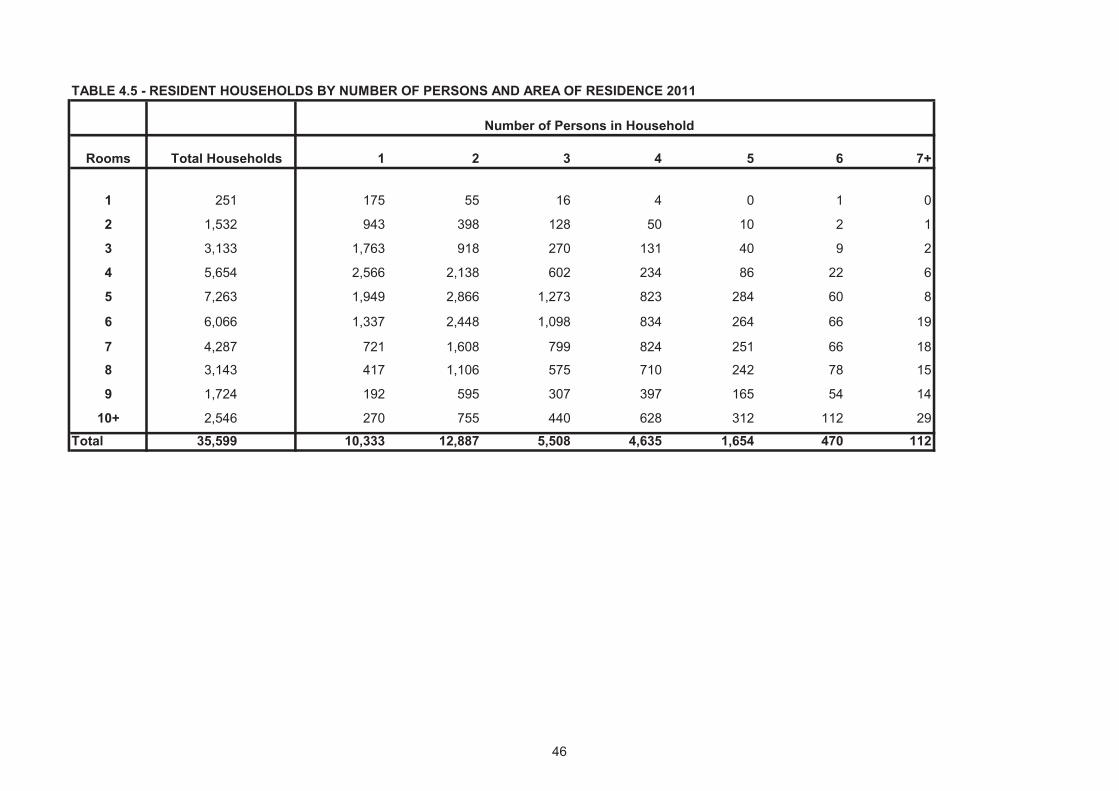
TABLE 4.5 - RESIDENT HOUSEHOLDS BY NUMBER OF PERSONS AND AREA OF RESIDENCE 2011
Number of Persons in Household
Rooms Total Households 1 2 3 4 5 6 7+
1 251 175 55 16 4 0 1 0
2 1,532 943 398 128 50 10 2 1
3 3,133 1,763 918 270 131 40 9 2
4 5,654 2,566 2,138 602 234 86 22 6
5 7,263 1,949 2,866 1,273 823 284 60 8
6 6,066 1,337 2,448 1,098 834 264 66 19
7 4,287 721 1,608 799 824 251 66 18
8 3,143 417 1,106 575 710 242 78 15
9 1,724 192 595 307 397 165 54 14
10+ 2,546 270 755 440 628 312 112 29
Total 35,599 10,333 12,887 5,508 4,635 1,654 470 112
46
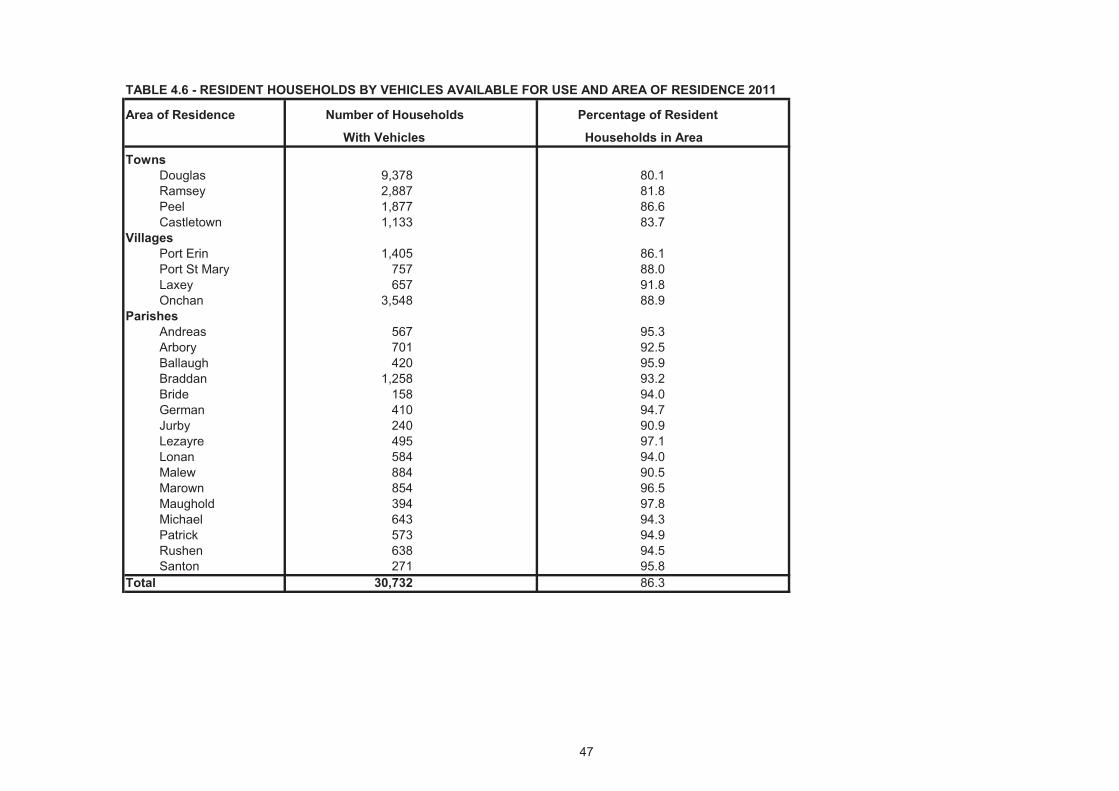
TABLE 4.6 - RESIDENT HOUSEHOLDS BY VEHICLES AVAILABLE FOR USE AND AREA OF RESIDENCE 2011
Area of Residence Number of Households Percentage of Resident
With Vehicles Households in Area
TownsDouglas 9,378 80.1Ramsey 2,887 81.8Peel 1,877 86.6Castletown 1,133 83.7
VillagesPort Erin 1,405 86.1Port St Mary 757 88.0Laxey 657 91.8Onchan 3,548 88.9
ParishesAndreas 567 95.3Arbory 701 92.5Ballaugh 420 95.9Braddan 1,258 93.2Bride 158 94.0German 410 94.7Jurby 240 90.9Lezayre 495 97.1Lonan 584 94.0Malew 884 90.5Marown 854 96.5Maughold 394 97.8Michael 643 94.3Patrick 573 94.9Rushen 638 94.5Santon 271 95.8
Total 30,732 86.3
47
48
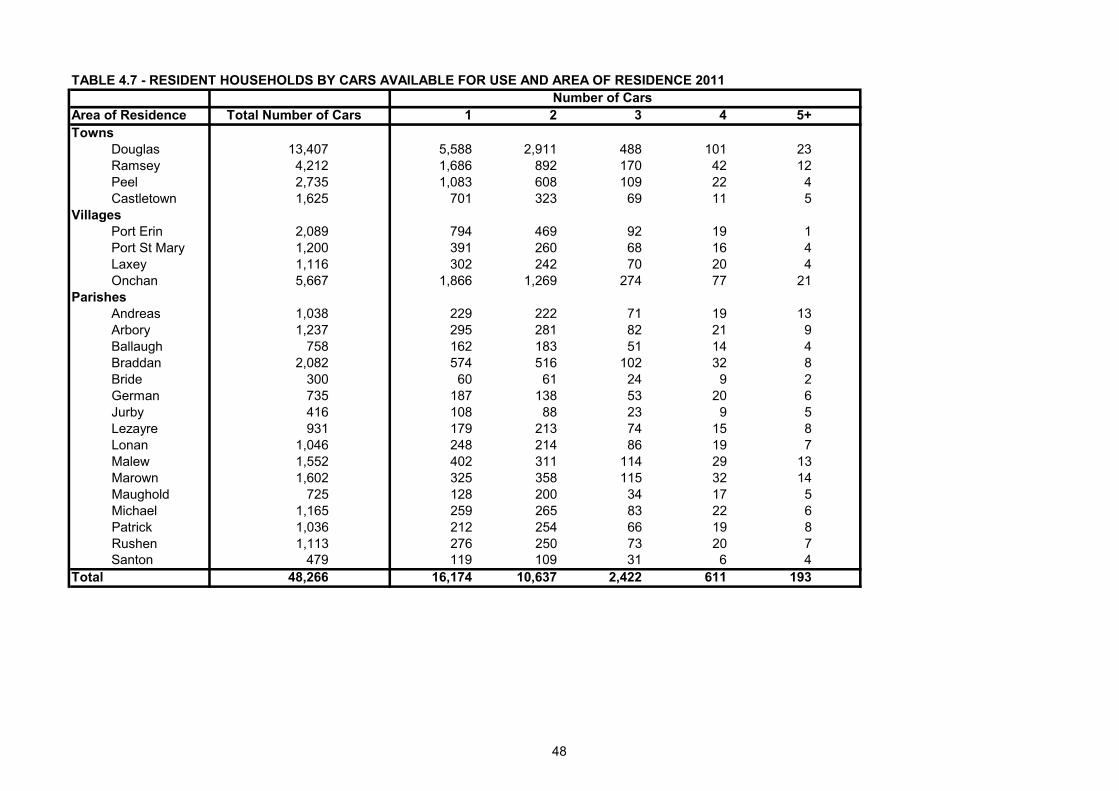
TABLE 4.7 - RESIDENT HOUSEHOLDS BY CARS AVAILABLE FOR USE AND AREA OF RESIDENCE 2011Number of Cars
Area of Residence Total Number of Cars 1 2 3 4 5+Towns
Douglas 13,407 5,588 2,911 488 101 23Ramsey 4,212 1,686 892 170 42 12Peel 2,735 1,083 608 109 22 4Castletown 1,625 701 323 69 11 5
VillagesPort Erin 2,089 794 469 92 19 1Port St Mary 1,200 391 260 68 16 4Laxey 1,116 302 242 70 20 4Onchan 5,667 1,866 1,269 274 77 21
ParishesAndreas 1,038 229 222 71 19 13Arbory 1,237 295 281 82 21 9Ballaugh 758 162 183 51 14 4Braddan 2,082 574 516 102 32 8Bride 300 60 61 24 9 2German 735 187 138 53 20 6Jurby 416 108 88 23 9 5Lezayre 931 179 213 74 15 8Lonan 1,046 248 214 86 19 7Malew 1,552 402 311 114 29 13Marown 1,602 325 358 115 32 14Maughold 725 128 200 34 17 5Michael 1,165 259 265 83 22 6Patrick 1,036 212 254 66 19 8Rushen 1,113 276 250 73 20 7Santon 479 119 109 31 6 4
Total 48,266 16,174 10,637 2,422 611 193
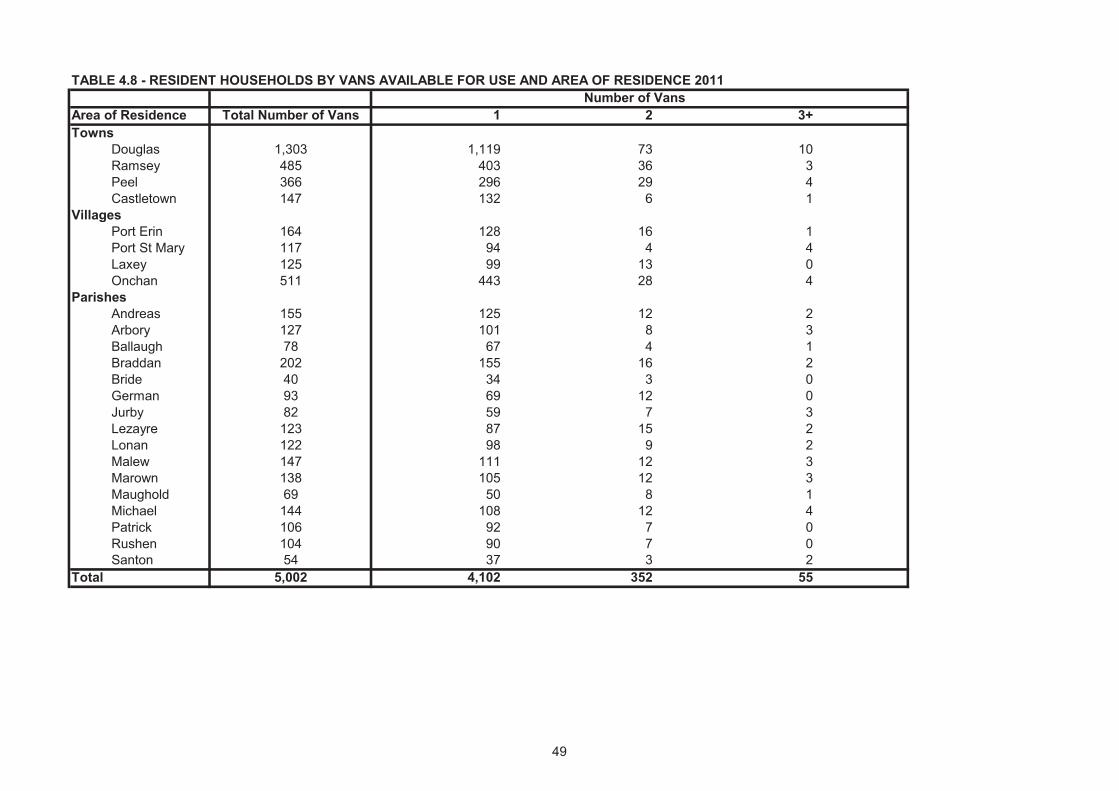
TABLE 4.8 - RESIDENT HOUSEHOLDS BY VANS AVAILABLE FOR USE AND AREA OF RESIDENCE 2011 Number of Vans
Area of Residence Total Number of Vans 1 2 3+Towns
Douglas 1,303 1,119 73 10Ramsey 485 403 36 3Peel 366 296 29 4Castletown 147 132 6 1
VillagesPort Erin 164 128 16 1Port St Mary 117 94 4 4Laxey 125 99 13 0Onchan 511 443 28 4
ParishesAndreas 155 125 12 2Arbory 127 101 8 3Ballaugh 78 67 4 1Braddan 202 155 16 2Bride 40 34 3 0German 93 69 12 0Jurby 82 59 7 3Lezayre 123 87 15 2Lonan 122 98 9 2Malew 147 111 12 3Marown 138 105 12 3Maughold 69 50 8 1Michael 144 108 12 4Patrick 106 92 7 0Rushen 104 90 7 0Santon 54 37 3 2
Total 5,002 4,102 352 55
49
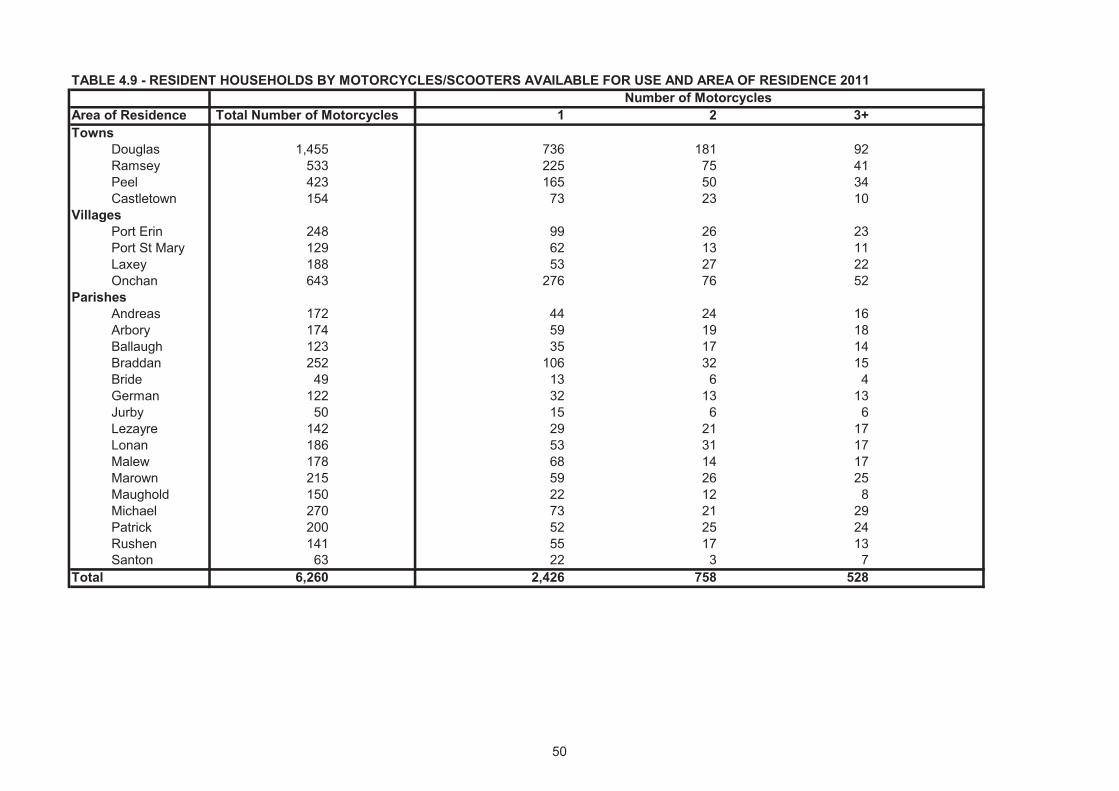
TABLE 4.9 - RESIDENT HOUSEHOLDS BY MOTORCYCLES/SCOOTERS AVAILABLE FOR USE AND AREA OF RESIDENCE 2011 Number of Motorcycles
Area of Residence Total Number of Motorcycles 1 2 3+Towns
Douglas 1,455 736 181 92Ramsey 533 225 75 41Peel 423 165 50 34Castletown 154 73 23 10
VillagesPort Erin 248 99 26 23Port St Mary 129 62 13 11Laxey 188 53 27 22Onchan 643 276 76 52
ParishesAndreas 172 44 24 16Arbory 174 59 19 18Ballaugh 123 35 17 14Braddan 252 106 32 15Bride 49 13 6 4German 122 32 13 13Jurby 50 15 6 6Lezayre 142 29 21 17Lonan 186 53 31 17Malew 178 68 14 17Marown 215 59 26 25Maughold 150 22 12 8Michael 270 73 21 29Patrick 200 52 25 24Rushen 141 55 17 13Santon 63 22 3 7
Total 6,260 2,426 758 528
50
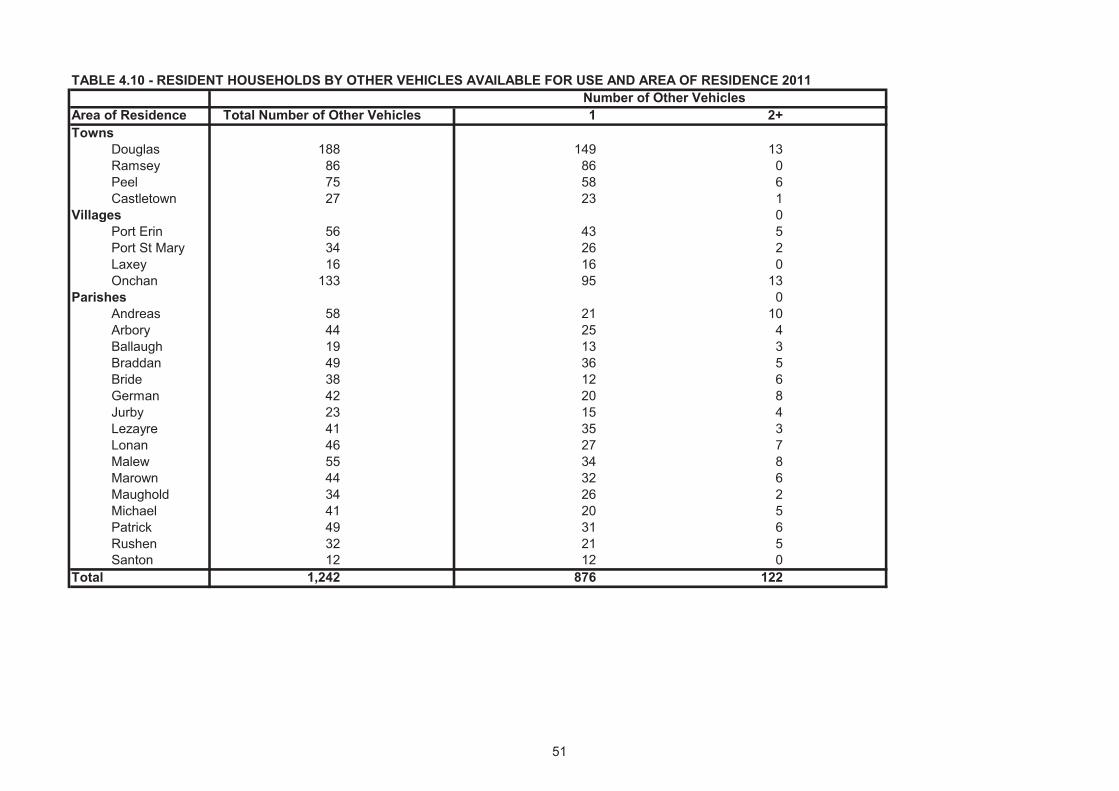
TABLE 4.10 - RESIDENT HOUSEHOLDS BY OTHER VEHICLES AVAILABLE FOR USE AND AREA OF RESIDENCE 2011 Number of Other Vehicles
Area of Residence Total Number of Other Vehicles 1 2+Towns
Douglas 188 149 13Ramsey 86 86 0Peel 75 58 6Castletown 27 23 1
Villages 0Port Erin 56 43 5Port St Mary 34 26 2Laxey 16 16 0Onchan 133 95 13
Parishes 0Andreas 58 21 10Arbory 44 25 4Ballaugh 19 13 3Braddan 49 36 5Bride 38 12 6German 42 20 8Jurby 23 15 4Lezayre 41 35 3Lonan 46 27 7Malew 55 34 8Marown 44 32 6Maughold 34 26 2Michael 41 20 5Patrick 49 31 6Rushen 32 21 5Santon 12 12 0
Total 1,242 876 122
51
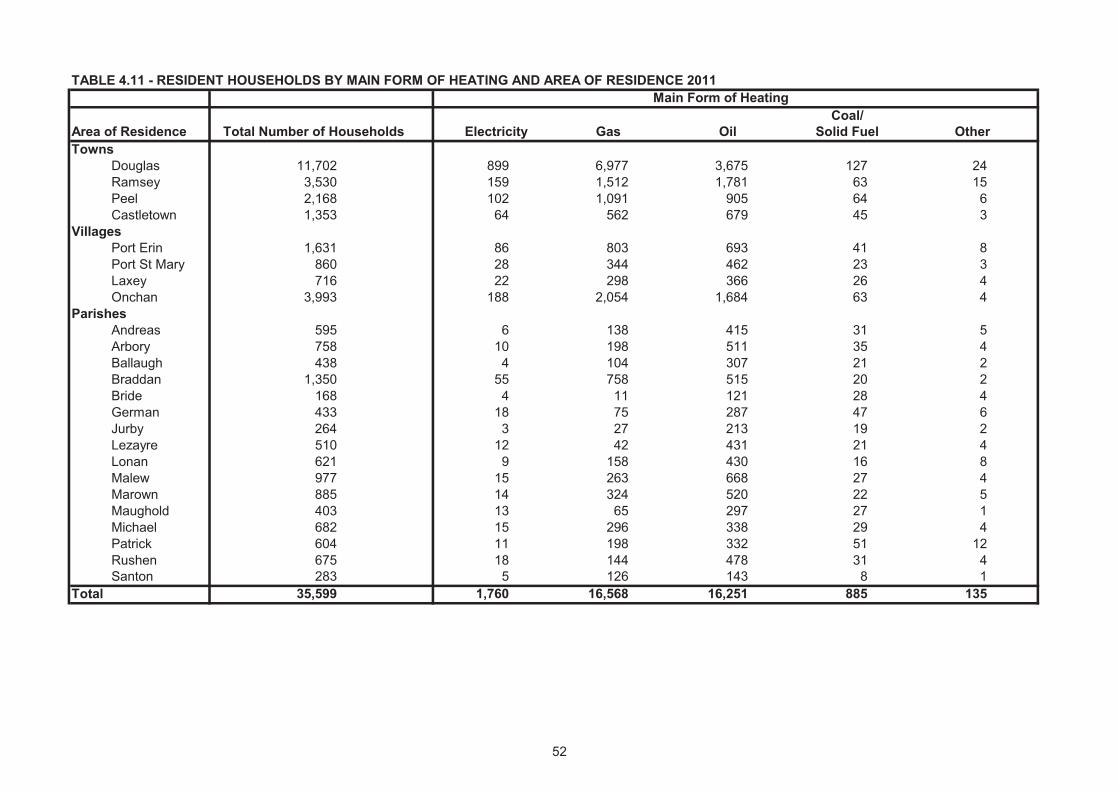
TABLE 4.11 - RESIDENT HOUSEHOLDS BY MAIN FORM OF HEATING AND AREA OF RESIDENCE 2011 Main Form of Heating
Coal/Area of Residence Total Number of Households Electricity Gas Oil Solid Fuel OtherTowns
Douglas 11,702 899 6,977 3,675 127 24Ramsey 3,530 159 1,512 1,781 63 15Peel 2,168 102 1,091 905 64 6Castletown 1,353 64 562 679 45 3
VillagesPort Erin 1,631 86 803 693 41 8Port St Mary 860 28 344 462 23 3Laxey 716 22 298 366 26 4Onchan 3,993 188 2,054 1,684 63 4
ParishesAndreas 595 6 138 415 31 5Arbory 758 10 198 511 35 4Ballaugh 438 4 104 307 21 2Braddan 1,350 55 758 515 20 2Bride 168 4 11 121 28 4German 433 18 75 287 47 6Jurby 264 3 27 213 19 2Lezayre 510 12 42 431 21 4Lonan 621 9 158 430 16 8Malew 977 15 263 668 27 4Marown 885 14 324 520 22 5Maughold 403 13 65 297 27 1Michael 682 15 296 338 29 4Patrick 604 11 198 332 51 12Rushen 675 18 144 478 31 4Santon 283 5 126 143 8 1
Total 35,599 1,760 16,568 16,251 885 135
52
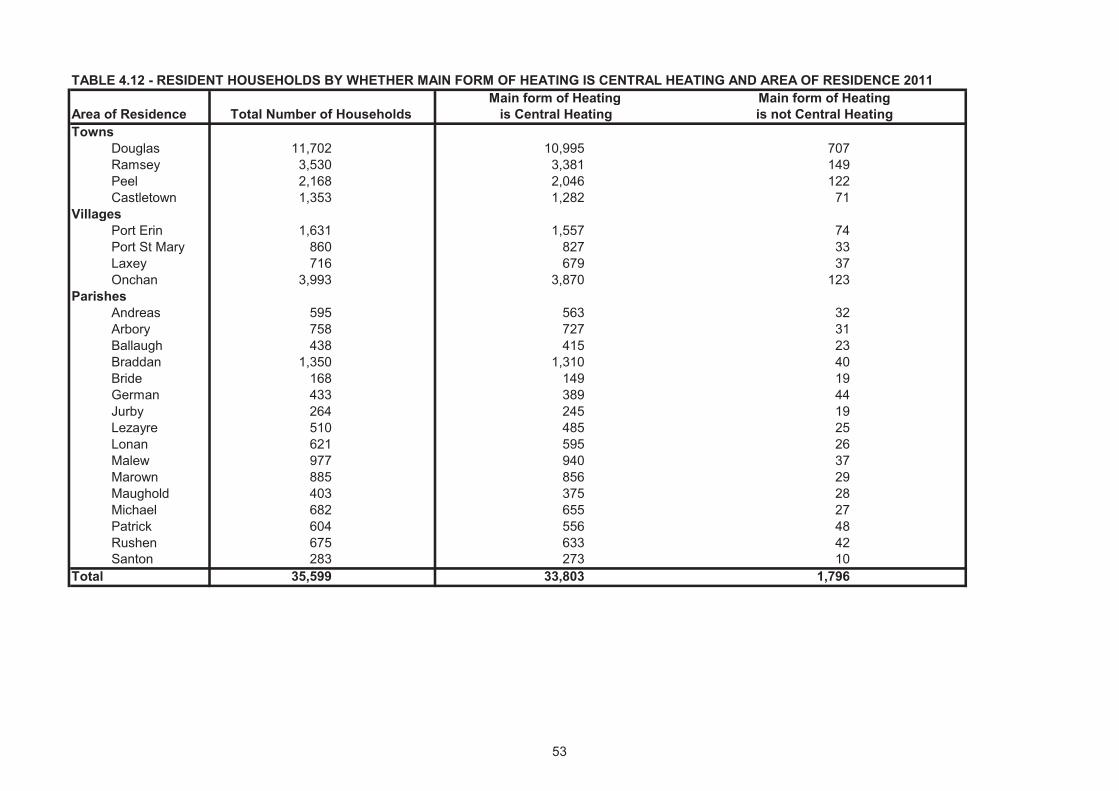
TABLE 4.12 - RESIDENT HOUSEHOLDS BY WHETHER MAIN FORM OF HEATING IS CENTRAL HEATING AND AREA OF RESIDENCE 2011 Main form of Heating Main form of Heating
Area of Residence Total Number of Households is Central Heating is not Central HeatingTowns
Douglas 11,702 10,995 707Ramsey 3,530 3,381 149Peel 2,168 2,046 122Castletown 1,353 1,282 71
VillagesPort Erin 1,631 1,557 74Port St Mary 860 827 33Laxey 716 679 37Onchan 3,993 3,870 123
ParishesAndreas 595 563 32Arbory 758 727 31Ballaugh 438 415 23Braddan 1,350 1,310 40Bride 168 149 19German 433 389 44Jurby 264 245 19Lezayre 510 485 25Lonan 621 595 26Malew 977 940 37Marown 885 856 29Maughold 403 375 28Michael 682 655 27Patrick 604 556 48Rushen 675 633 42Santon 283 273 10
Total 35,599 33,803 1,796
53
54
AD
DITIO
NA
L PU
BLIC
ATIO
NS
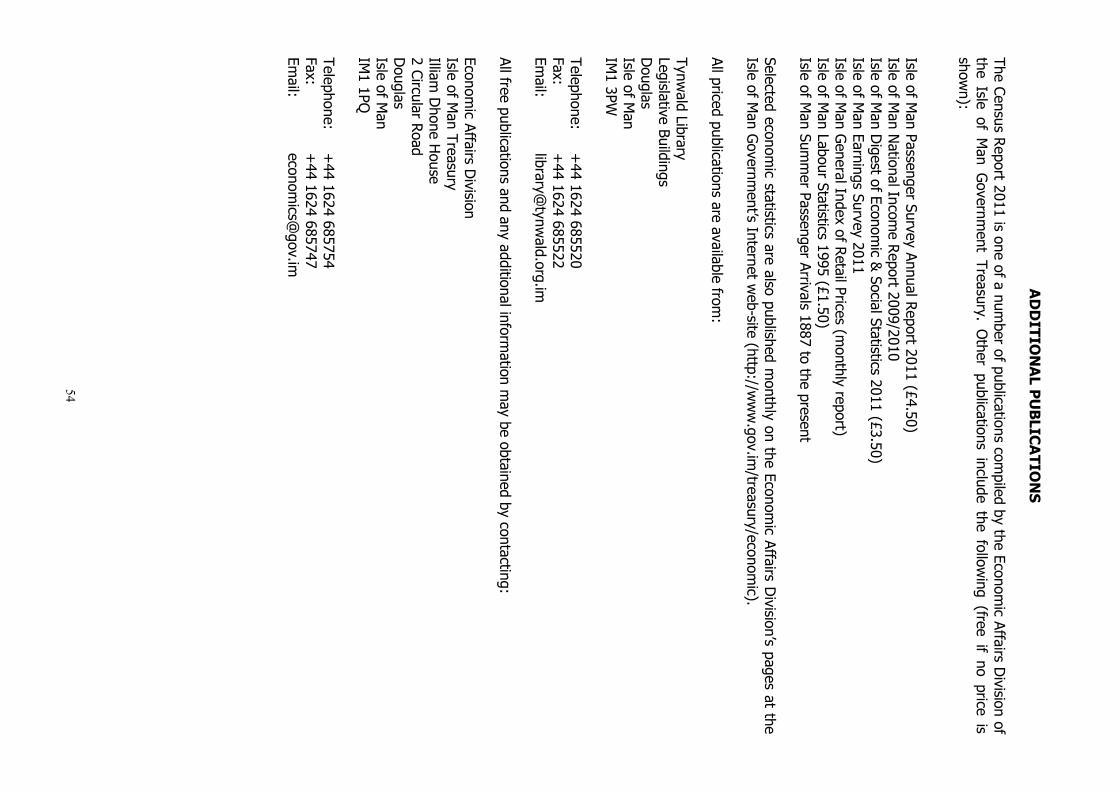
The Census Report 2011is one of a num
ber of publications compiled by the Econom
ic Affairs Division of
the Isle of Man
Governm
entTreasury. O
ther publications include the following (free if no price is
shown):
Isle of Man
Passenger SurveyAnnual Report 2011 (£4.50)
Isle of Man N
ational Income Report 2009/2010
Isle of Man D
igest of Economic &
Social Statistics 2011(£3.50)
Isle of Man Earnings Survey 2011
Isle of Man G
eneral Index of Retail Prices (monthly report)
Isle of Man Labour Statistics 1995 (£1.50)
Isle of Man Sum
mer Passenger Arrivals 1887 to the present
Selected economic statistics are also published m
onthly on the Economic Affairs D
ivision’s pages at the Isle of M
an Governm
ent’s Internet web-site (http://w
ww
.gov.im/treasury/econom
ic).
All priced publications are available from:
Tynwald Library
Legislative BuildingsD
ouglasIsle of M
anIM
1 3PW
Telephone:+
44 1624 685520Fax:
+
44 1624 685522Em
ail: library@
tynwald.org.im
All free publications and any additional information m
ay be obtained by contacting:
Economic Affairs D
ivisionIsle of M
anTreasury
Illiam D
hone House
2 Circular RoadD
ouglasIsle of M
anIM
1 1PQ
Telephone:+
44 1624 685754Fax:
+
44 1624 685747Em
ail: econom
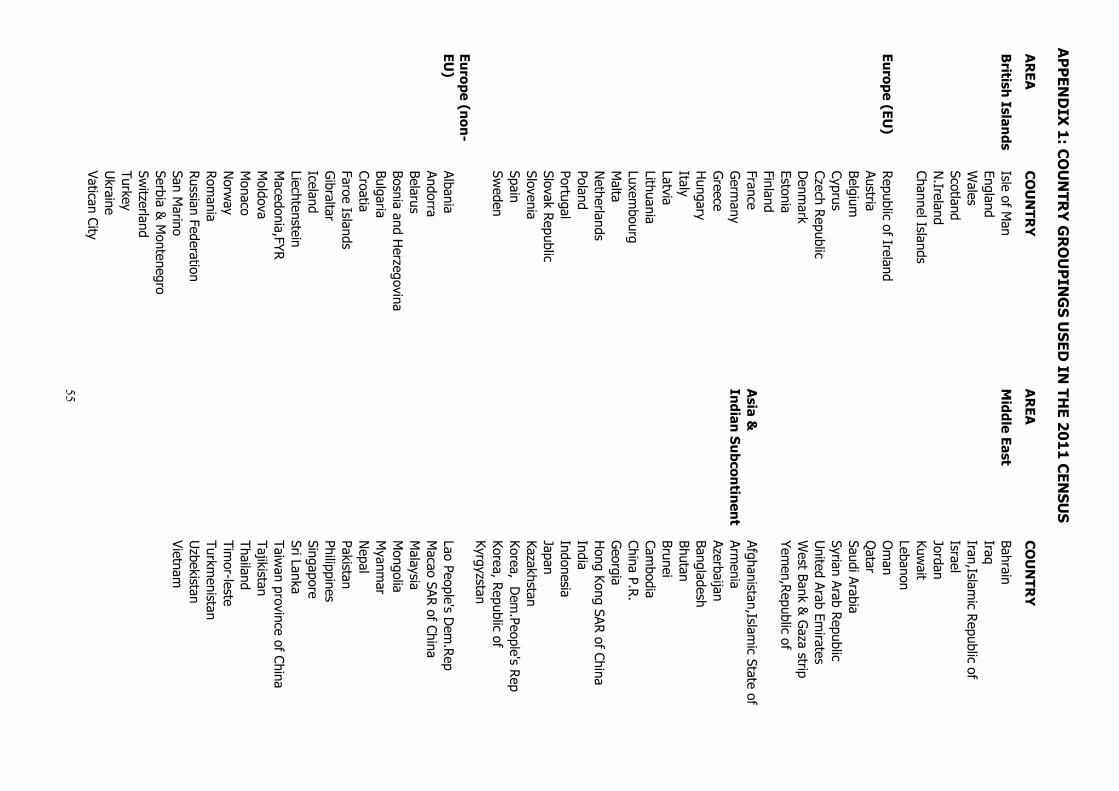
AP
PEN
DIX
1: C
OU
NTR
Y G
RO
UP
ING
S USED
IN TH
E 201
1 CEN
SUS
55
AR
EAC
OU
NTR
YA
REA
CO
UN
TRY
British
Islands
Isle of Man
Middle East
BahrainEngland
IraqW
alesIran,Islam
ic Republic ofScotland
IsraelN
.IrelandJordan
Channel IslandsKuw
aitLebanon
Europe (EU)
Republic of IrelandO
man
AustriaQ
atarBelgium
Saudi ArabiaCyprus
Syrian Arab RepublicCzech Republic
United Arab Em
iratesD
enmark
West Bank &
Gaza strip
EstoniaYem
en,Republic of
FinlandFrance
Asia &
Afghanistan,Islamic State of
Germ
anyIndian
Subcon
tinent
Armenia
Greece
AzerbaijanH
ungaryBangladesh
ItalyBhutan
LatviaBrunei
LithuaniaCam
bodiaLuxem
bourgChina P.R
.M
altaG
eorgiaN
etherlandsH
ong Kong SAR of China
PolandIndia
PortugalIndonesia
Slovak RepublicJapan
SloveniaKazakhstan
SpainKorea, D
em.People's R
epSw
edenKorea, Republic ofKyrgyzstan
Europe (non-EU
)Albania
Lao People's Dem
.RepAndorra
Macao SAR of China
BelarusM
alaysiaBosnia and H
erzegovinaM
ongoliaBulgaria
Myanm
arCroatia
Nepal
Faroe IslandsPakistan
Gibraltar
PhilippinesIceland
SingaporeLiechtenstein
Sri LankaM
acedonia,FYRTaiw
an province of ChinaM
oldovaTajikistan
Monaco
ThailandN
orway
Timor-leste
Rom
aniaTurkm
enistanRussian Federation
Uzbekistan
San Marino
VietnamSerbia &
Montenegro
Switzerland
TurkeyU
kraineVatican City
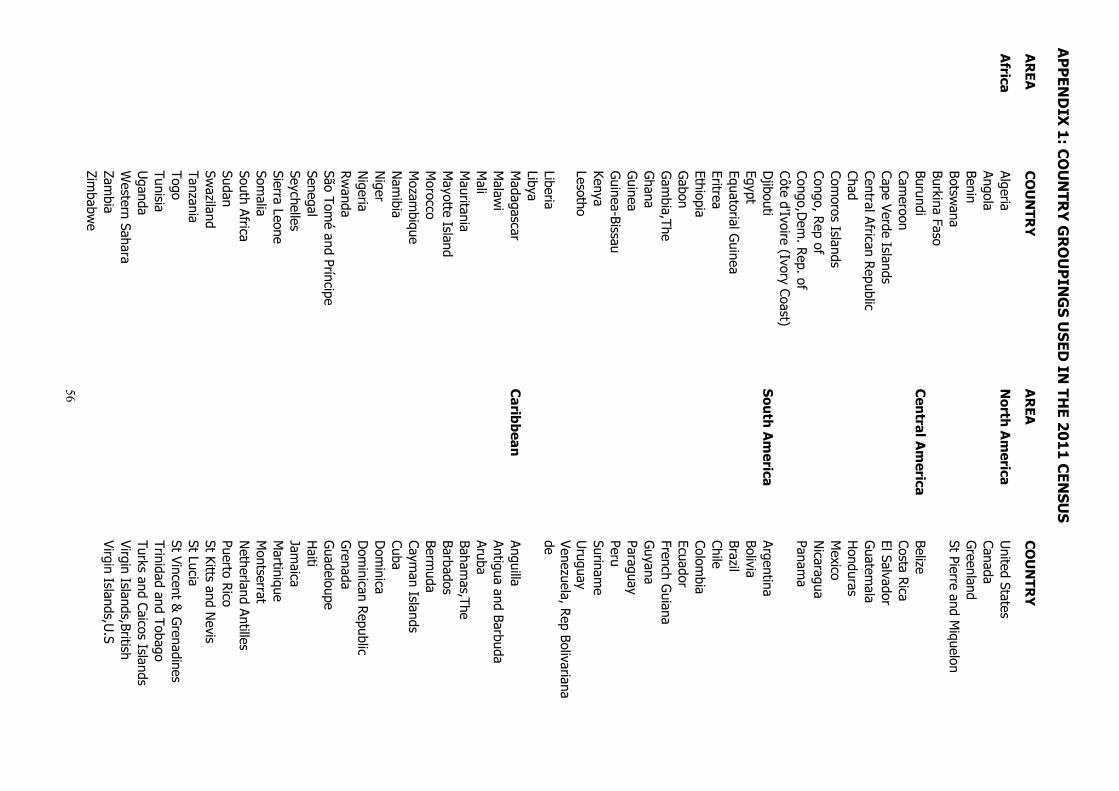
AP
PEN
DIX
1: C
OU
NTR
Y G
RO
UP
ING
S USED
IN TH
E 201
1 CEN
SUS
56
AR
EAC
OU
NTR
YA
REA
CO
UN
TRY
Africa
AlgeriaN
orth Am
ericaU
nited StatesAngola
CanadaBenin
Greenland
Botswana
St Pierre and Miquelon
Burkina FasoBurundi
Cen
tral Am
ericaBelize
Cameroon
Costa RicaCape Verde Islands
El SalvadorCentral African Republic
Guatem
alaChad
Honduras
Comoros Islands
Mexico
Congo, Rep of N
icaraguaCongo,D
em. Rep. of
Panama
Côte d'Ivoire (Ivory Coast)D
jiboutiSouth A
merica
Argentina Egypt
BoliviaEquatorial G
uineaBrazil
EritreaChile
EthiopiaColom
biaG
abonEcuador
Gam
bia,TheFrench G
uianaG
hanaG
uyanaG
uineaParaguay
Guinea-Bissau
PeruKenya
Suriname
LesothoU
ruguay
LiberiaVenezuela, Rep Bolivariana de
LibyaM
adagascarC
aribbeanAnguilla
Malaw
iAntigua and Barbuda
Mali
ArubaM
auritaniaBaham
as,TheM
ayotte IslandBarbados
Morocco
Bermuda
Mozam
biqueCaym
an IslandsN
amibia
CubaN
igerD
ominica
Nigeria
Dom
inican RepublicRw
andaG
renadaSão Tom
é and PríncipeG
uadeloupeSenegal
Haiti
SeychellesJam
aicaSierra Leone
Martinique
Somalia
Montserrat
South AfricaN
etherland AntillesSudan
Puerto RicoSw
azilandSt Kitts and N
evisTanzania
St LuciaTogo
St Vincent & G
renadinesTunisia
Trinidad and TobagoU
gandaTurks and Caicos Islands
Western Sahara
Virgin Islands,BritishZam
biaVirgin Islands,U
.SZim
babwe
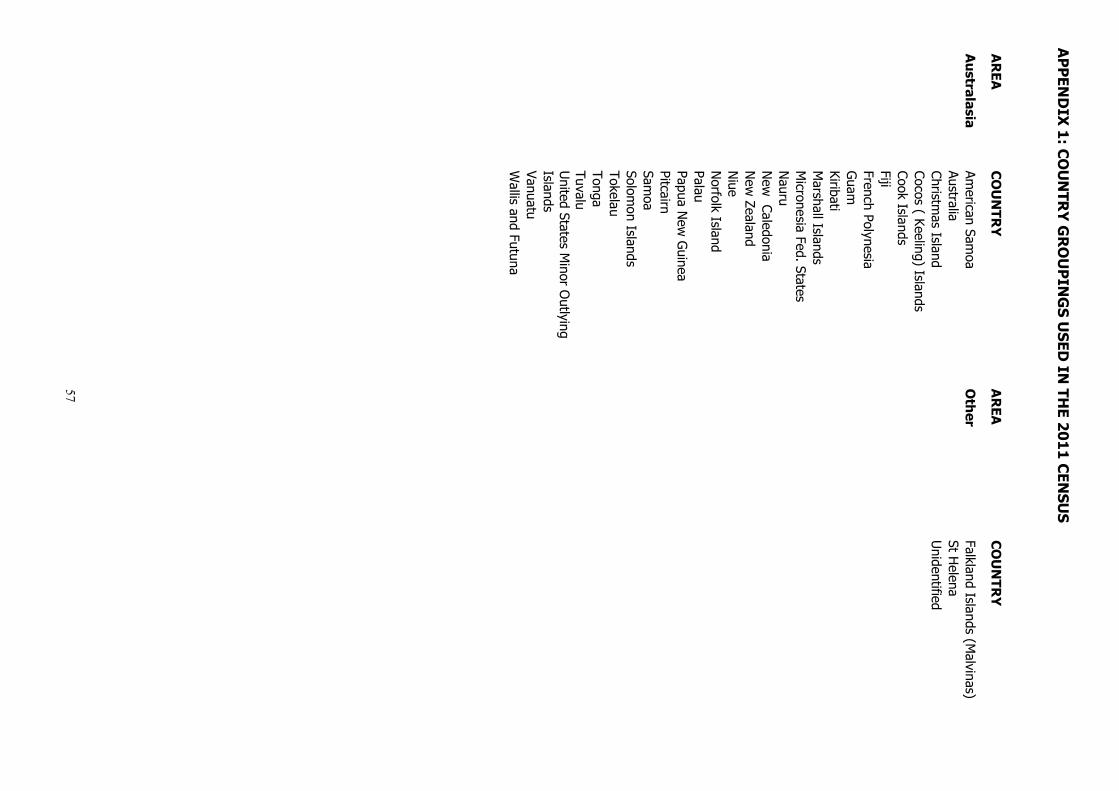
AP
PEN
DIX
1: C
OU
NTR
Y G
RO
UP
ING
S USED
IN TH
E 201
1 CEN
SUS
57
AR
EAC
OU
NTR
YA
REA
CO
UN
TRY
Au
stralasiaAm
erican Samoa
Oth
erFalkland Islands (M
alvinas)Australia
St Helena
Christmas Island
Unidentified
Cocos ( Keeling) IslandsCook IslandsFijiFrench PolynesiaG
uamKiribatiM
arshall IslandsM
icronesia Fed. States N
auruN
ew Caledonia
New
ZealandN
iueN
orfolk IslandPalauPapua N
ew G
uineaPitcairnSam
oaSolom
on IslandsTokelau TongaTuvaluU
nited States Minor O
utlying IslandsVanuatuW
allis and Futuna


This document can be provided in large print or audio tape on request
Printed by Isle of Man Government Printing Services
Copyright Isle of Man Government
ISBN 978-1-904869-32-0