Embed Size (px)
Citation preview
Ruiesh K. Shah - '
Company Secretary
Encl: a/a
The Corporate Relationship DepartmentBSE Limited1't Floor, New Tradi.g Ring, Rotunda Building,P.I" Towers, Dalal Street, Fort, Mumbai 400 001
Script Code: 590078
Works : Unit-l : P O. Kalyaneshwari - 713 369, Dist. Burdwan (West Bengal)Unit-ll : E.P.l.P., Byrnihat, Dist. Ri-bhoi-793101 (Meghataya)Unit-lll : Plot No, 42 & 43,APSEZ, PO. Atchutapuram, Dist. Msakhapatnam - 531 01i (A.P)
ISO 9001 : 2008 COMPANY
Registered Office : ldeal Centre, 4th Floor9, A.J C Bose Road, Kolkata - 700 017
T (0s3) 6450 2228 F (033) 22e0 0383E office@ma ithanalloys.com
W www. ma ithanalloys. comcrN - L271 01 WB1 985P1C039503
2lListing DepartmentNational Stock Exchange of India Ltd.Exchange Plaza, Bandra-Kurla Complex,Bandra (E), Mumbai - 400 051
Scrip code: MAITHANALL-EQ
19th Muy, 2018
UThe Secret aryThe Calcutta Stock Exchange Limited7, Lyons RangeKolkata 700 00Scrip code: 023915
Sub: lnvestor Presentation on Audited Financial Results for ear ended 31't March 2018
Dear Sir,
We are enclosing herewith the Investor Presentation on the Audited Financial Results for the year ended31,t March,20L8.
This information is submitted to you pursuant to Regulation 30 of the Securities and Exchange Board ofIndia (Listing Obligations and Disclosure Requirements) Regulations ,2015.
This is for your information and appropriate disseminafion.
Thanki.g you,
Yours faithfully,
MAITHAN ALLOYS LIMITED
Investor Presentation – May 2018
Safe Harbor
2
This presentation and the accompanying slides (the “Presentation”), which have been prepared byMaithan Alloys Limited (the “Company”), have been prepared solely for information purposes and do notconstitute any offer, recommendation or invitation to purchase or subscribe for any securities, and shallnot form the basis or be relied on in connection with any contract or binding commitment what so ever.No offering of securities of the Company will be made except by means of a statutory offering documentcontaining detailed information about the Company.
This Presentation has been prepared by the Company based on information and data which the Companyconsiders reliable, but the Company makes no representation or warranty, express or implied, whatsoever,and no reliance shall be placed on, the truth, accuracy, completeness, fairness and reasonableness of thecontents of this Presentation. This Presentation may not be all inclusive and may not contain all of theinformation that you may consider material. Any liability in respect of the contents of, or any omissionfrom, this Presentation is expressly excluded.
Certain matters discussed in this Presentation may contain statements regarding the Company’s marketopportunity and business prospects that are individually and collectively forward-looking statements. Suchforward-looking statements are not guarantees of future performance and are subject to known andunknown risks, uncertainties and assumptions that are difficult to predict. These risks and uncertaintiesinclude, but are not limited to, the performance of the Indian economy and of the economies of variousinternational markets, the performance of the industry in India and world-wide, competition, thecompany’s ability to successfully implement its strategy, the Company’s future levels of growth andexpansion, technological implementation, changes and advancements, changes in revenue, income orcash flows, the Company’s market preferences and its exposure to market risks, as well as other risks. TheCompany’s actual results, levels of activity, performance or achievements could differ materially andadversely from results expressed in or implied by this Presentation. The Company assumes no obligationto update any forward-looking information contained in this Presentation. Any forward-looking statementsand projections made by third parties included in this Presentation are not adopted by the Company andthe Company is not responsible for such third party statements and projections.
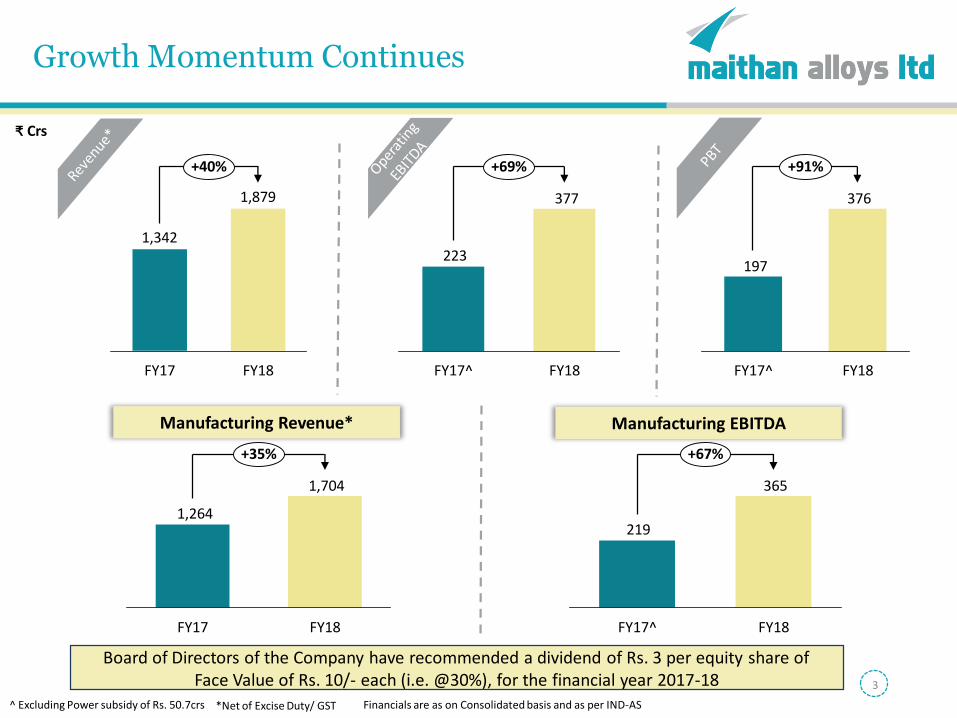
Growth Momentum Continues
FY17
1,879
1,342
FY18
+40%
377
223
+69%
FY18FY17^
376
197
FY18FY17^
+91%
₹ Crs
^ Excluding Power subsidy of Rs. 50.7crs *Net of Excise Duty/ GST
Manufacturing EBITDA
1,704
1,264
FY17
+35%
FY18
365
219
+67%
FY18FY17^
Manufacturing Revenue*
Board of Directors of the Company have recommended a dividend of Rs. 3 per equity share of Face Value of Rs. 10/- each (i.e. @30%), for the financial year 2017-18
Financials are as on Consolidated basis and as per IND-AS
3
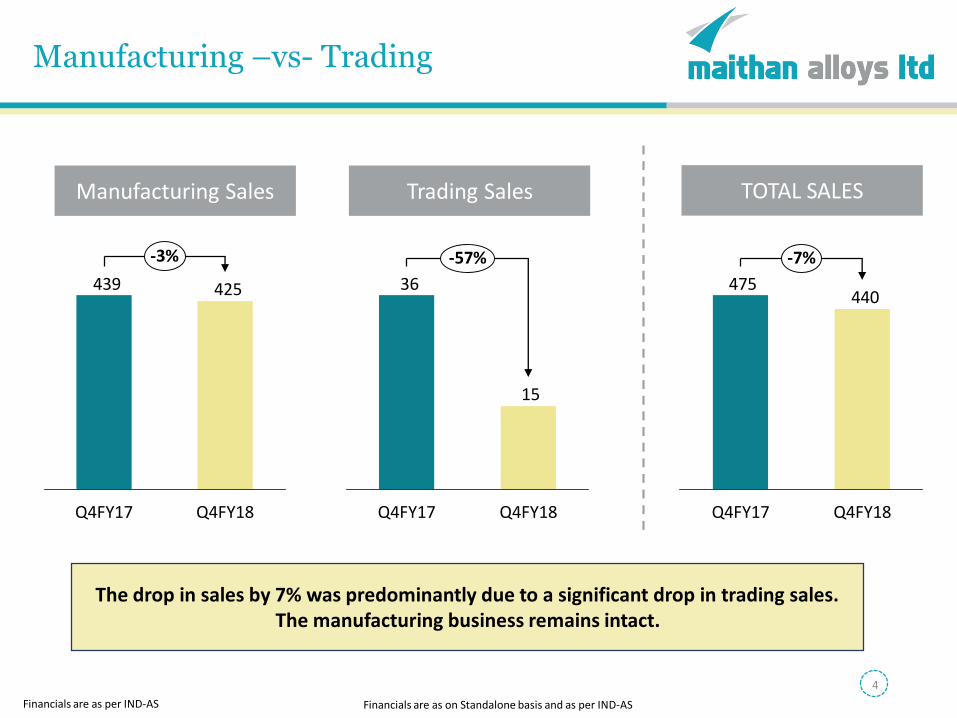
Manufacturing –vs- Trading
425439
Q4FY17 Q4FY18
-3%
Manufacturing Sales Trading Sales
The drop in sales by 7% was predominantly due to a significant drop in trading sales. The manufacturing business remains intact.
15
36
Q4FY17 Q4FY18
-57%
440475
Q4FY17 Q4FY18
-7%
TOTAL SALES
Financials are as per IND-AS Financials are as on Standalone basis and as per IND-AS
4
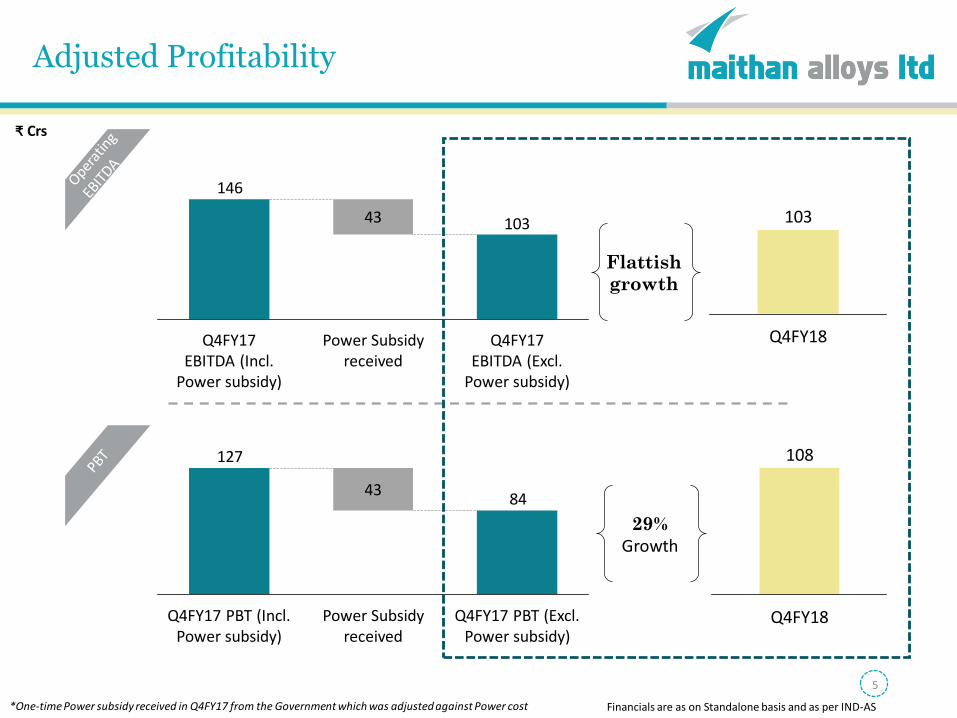
Adjusted Profitability
₹ Crs
43 103
146
Power Subsidy received
Q4FY17 EBITDA (Incl.
Power subsidy)
Q4FY17 EBITDA (Excl.
Power subsidy)
103
Q4FY18
Flattish
growth
4384
127
Power Subsidy received
Q4FY17 PBT (Incl. Power subsidy)
Q4FY17 PBT (Excl. Power subsidy)
108
Q4FY18
29%
Growth
*One-time Power subsidy received in Q4FY17 from the Government which was adjusted against Power cost Financials are as on Standalone basis and as per IND-AS
5
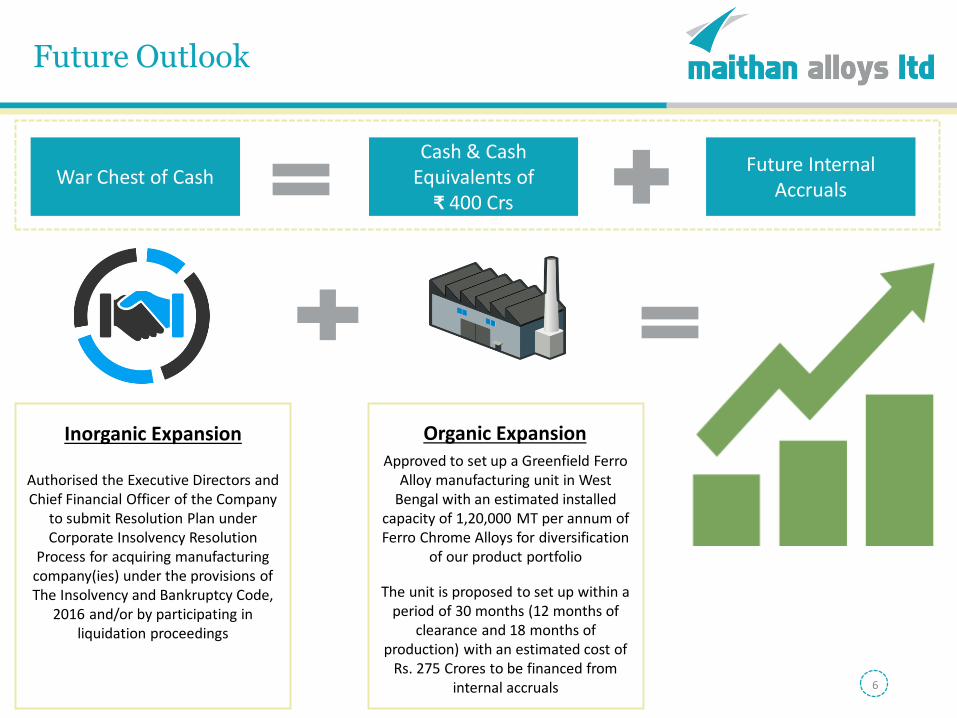
Future Outlook
Authorised the Executive Directors and Chief Financial Officer of the Company
to submit Resolution Plan under Corporate Insolvency Resolution
Process for acquiring manufacturing company(ies) under the provisions of The Insolvency and Bankruptcy Code,
2016 and/or by participating in liquidation proceedings
Approved to set up a Greenfield Ferro Alloy manufacturing unit in West
Bengal with an estimated installed capacity of 1,20,000 MT per annum of Ferro Chrome Alloys for diversification
of our product portfolio
The unit is proposed to set up within a period of 30 months (12 months of
clearance and 18 months of production) with an estimated cost of
Rs. 275 Crores to be financed from internal accruals
War Chest of Cash Cash & Cash
Equivalents of ₹ 400 Crs
Future Internal Accruals
Inorganic Expansion Organic Expansion
6
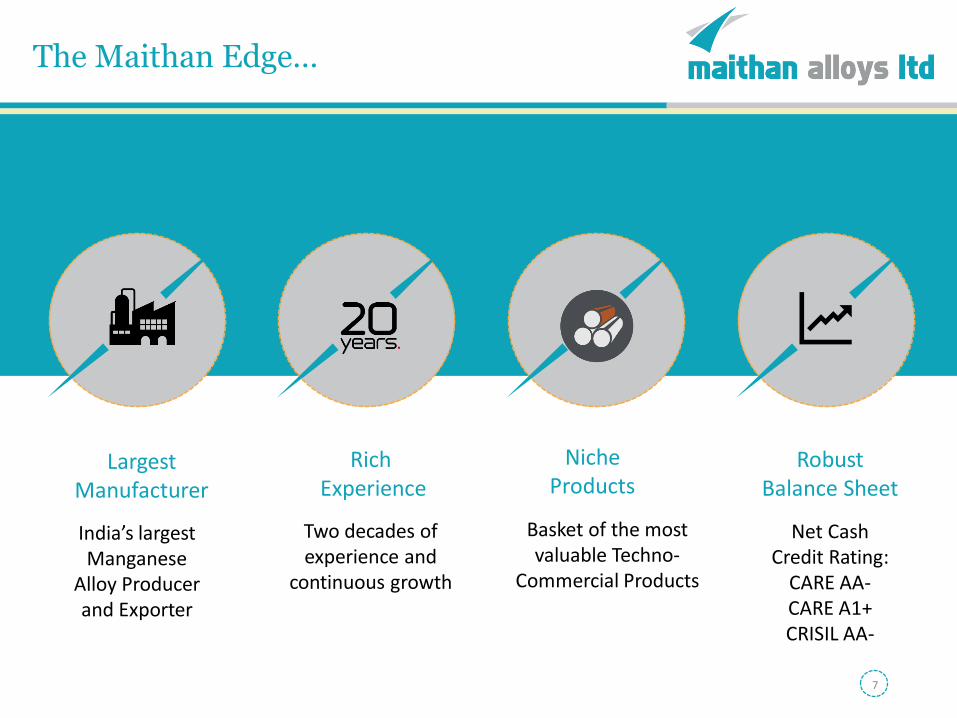
The Maithan Edge…
7
India’s largest Manganese
Alloy Producer and Exporter
Largest Manufacturer
Two decades of experience and
continuous growth
RichExperience
Basket of the most valuable Techno-
Commercial Products
Niche Products
Net CashCredit Rating:
CARE AA-CARE A1+CRISIL AA-
RobustBalance Sheet
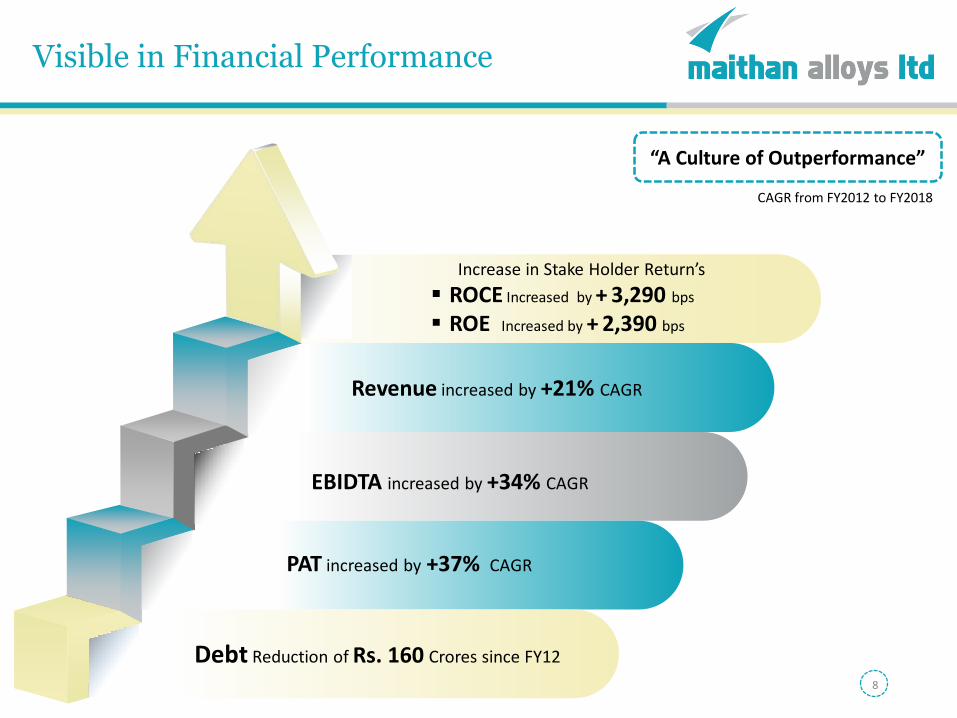
Visible in Financial Performance
Debt Reduction of Rs. 160 Crores since FY12
PAT increased by +37% CAGR
Revenue increased by +21% CAGR
EBIDTA increased by +34% CAGR
Increase in Stake Holder Return’s
▪ ROCE Increased by + 3,290 bps
▪ ROE Increased by + 2,390 bps
“A Culture of Outperformance”
CAGR from FY2012 to FY2018
8
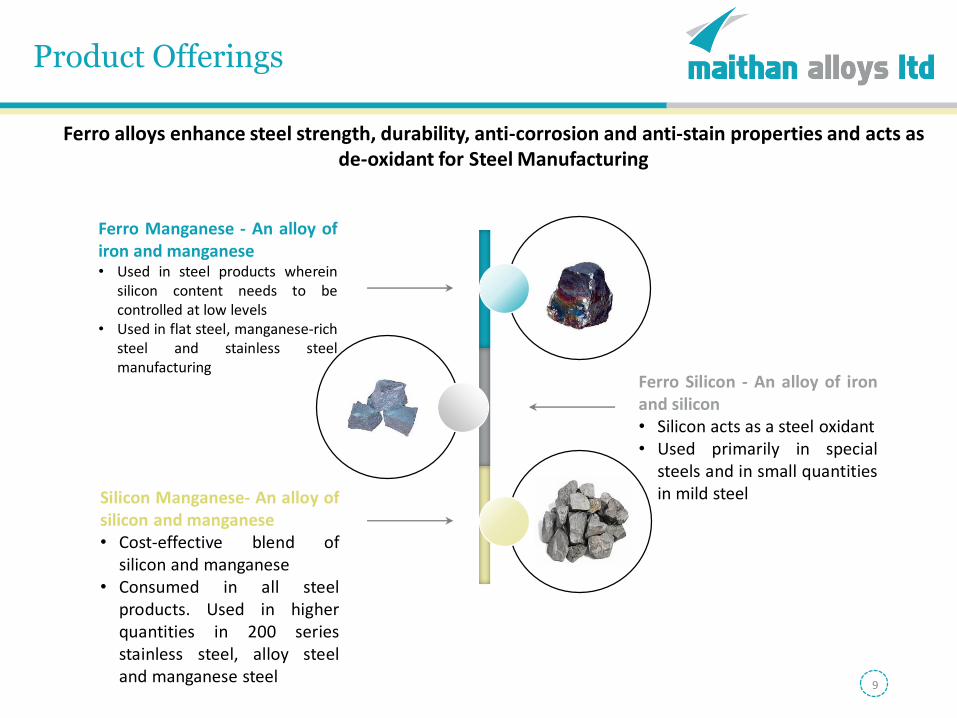
Product Offerings
Ferro Silicon - An alloy of ironand silicon• Silicon acts as a steel oxidant• Used primarily in special
steels and in small quantitiesin mild steel
Ferro Manganese - An alloy ofiron and manganese• Used in steel products wherein
silicon content needs to becontrolled at low levels
• Used in flat steel, manganese-richsteel and stainless steelmanufacturing
Silicon Manganese- An alloy ofsilicon and manganese• Cost-effective blend of
silicon and manganese• Consumed in all steel
products. Used in higherquantities in 200 seriesstainless steel, alloy steeland manganese steel
Ferro alloys enhance steel strength, durability, anti-corrosion and anti-stain properties and acts as de-oxidant for Steel Manufacturing
9
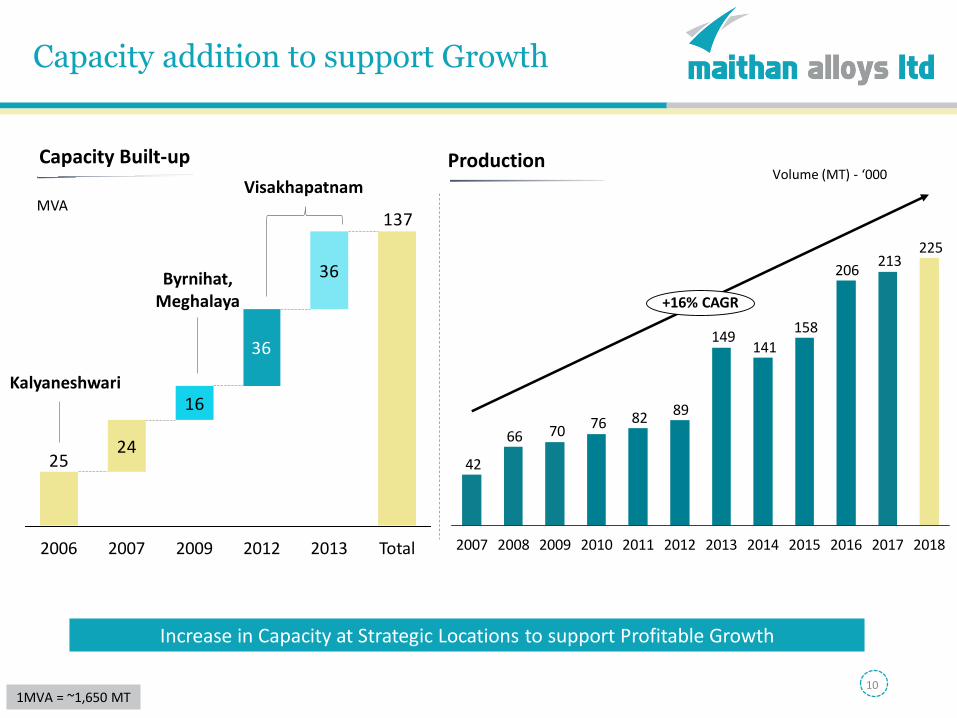
Capacity addition to support Growth
24
16
36
137
36
25
Total201220072006 20132009
Capacity Built-up
Visakhapatnam
Kalyaneshwari
Byrnihat,Meghalaya
Increase in Capacity at Strategic Locations to support Profitable Growth
MVA
225213
206
158141
149
8982767066
42
20182013 20162014 2015201220112010200920082007 2017
+16% CAGR
ProductionVolume (MT) - ‘000
1MVA = ~1,650 MT10
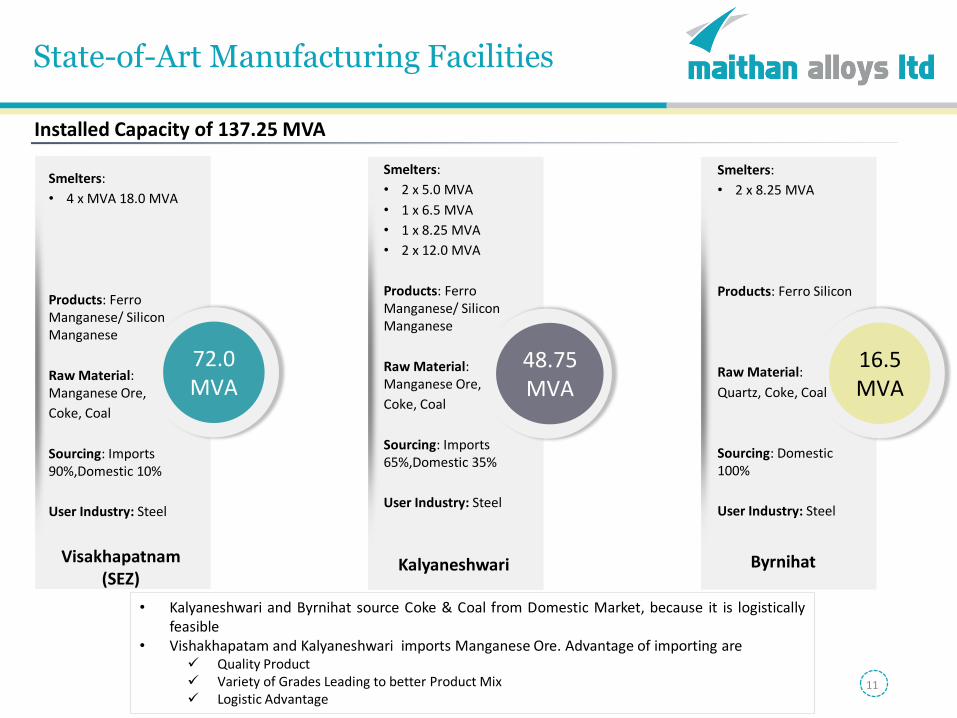
State-of-Art Manufacturing Facilities
72.0 MVA
Smelters:
• 4 x MVA 18.0 MVA
Products: Ferro Manganese/ Silicon Manganese
Raw Material: Manganese Ore,
Coke, Coal
Sourcing: Imports 90%,Domestic 10%
User Industry: Steel
Visakhapatnam(SEZ)
48.75MVA
16.5MVA
Smelters:
• 2 x 5.0 MVA
• 1 x 6.5 MVA
• 1 x 8.25 MVA
• 2 x 12.0 MVA
Products: Ferro Manganese/ Silicon Manganese
Raw Material: Manganese Ore,
Coke, Coal
Sourcing: Imports 65%,Domestic 35%
User Industry: Steel
Kalyaneshwari Byrnihat
Smelters:
• 2 x 8.25 MVA
Products: Ferro Silicon
Raw Material:
Quartz, Coke, Coal
Sourcing: Domestic 100%
User Industry: Steel
Installed Capacity of 137.25 MVA
• Kalyaneshwari and Byrnihat source Coke & Coal from Domestic Market, because it is logisticallyfeasible
• Vishakhapatam and Kalyaneshwari imports Manganese Ore. Advantage of importing are✓ Quality Product✓ Variety of Grades Leading to better Product Mix✓ Logistic Advantage
11
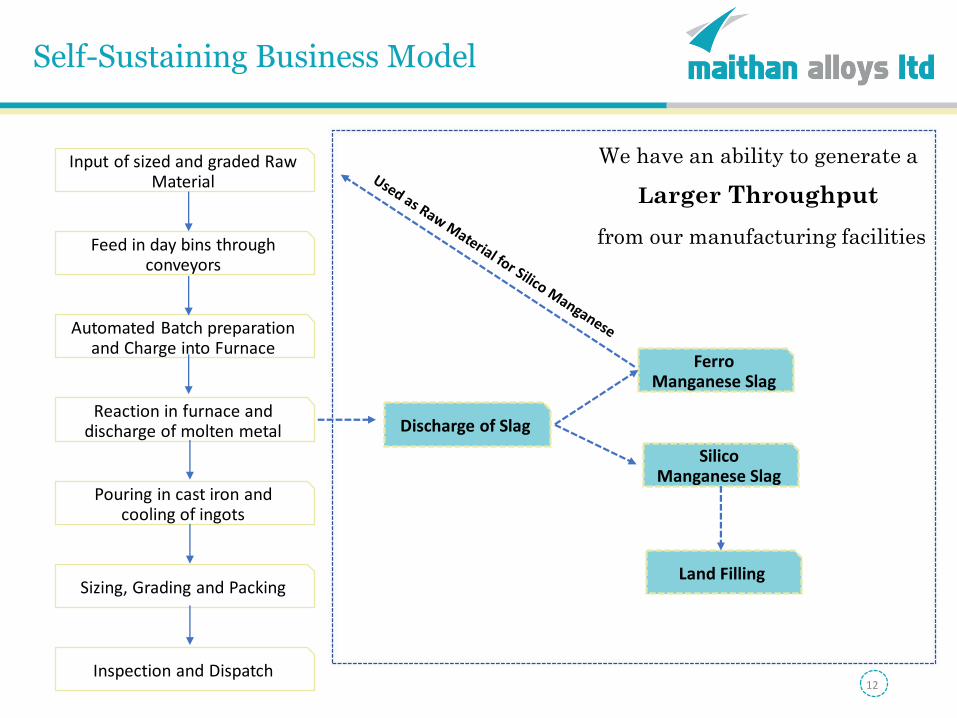
Self-Sustaining Business Model
Input of sized and graded Raw Material
Feed in day bins through conveyors
Automated Batch preparation and Charge into Furnace
Reaction in furnace and discharge of molten metal
Pouring in cast iron and cooling of ingots
Sizing, Grading and Packing
Inspection and Dispatch
Discharge of Slag
Ferro Manganese Slag
Silico Manganese Slag
Land Filling
We have an ability to generate a
Larger Throughput
from our manufacturing facilities
12
13
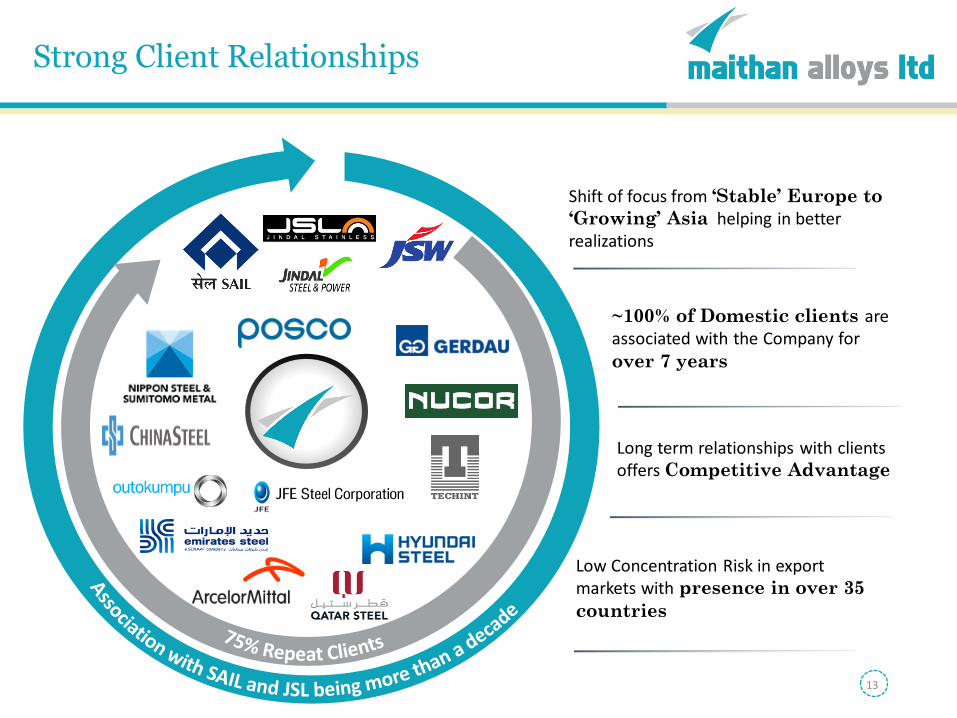
Strong Client Relationships
Shift of focus from ‘Stable’ Europe to
‘Growing’ Asia helping in better realizations
~100% of Domestic clients are associated with the Company for over 7 years
Low Concentration Risk in export markets with presence in over 35
countries
Long term relationships with clients offers Competitive Advantage
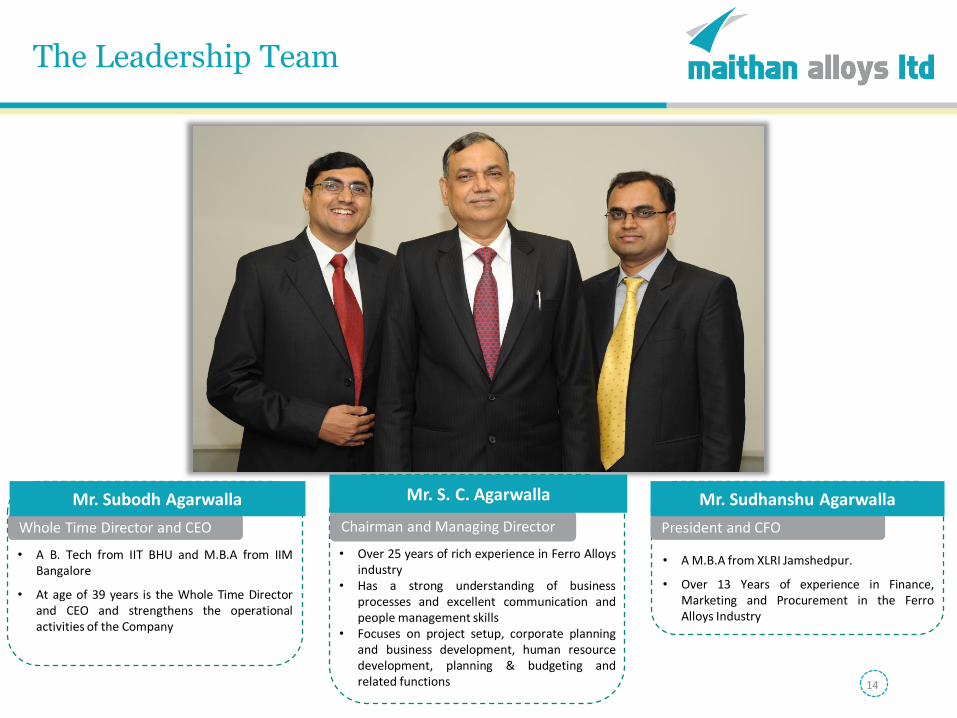
The Leadership Team
14
Whole Time Director and CEO
Mr. Subodh Agarwalla
• A B. Tech from IIT BHU and M.B.A from IIMBangalore
• At age of 39 years is the Whole Time Directorand CEO and strengthens the operationalactivities of the Company
Chairman and Managing Director
Mr. S. C. Agarwalla
• Over 25 years of rich experience in Ferro Alloysindustry
• Has a strong understanding of businessprocesses and excellent communication andpeople management skills
• Focuses on project setup, corporate planningand business development, human resourcedevelopment, planning & budgeting andrelated functions
President and CFO
Mr. Sudhanshu Agarwalla
• A M.B.A from XLRI Jamshedpur.
• Over 13 Years of experience in Finance,Marketing and Procurement in the FerroAlloys Industry
15
Experienced Board
Independent Director
Mr. Nand Kishore Agarwal
Experienced in the field of Accounts, Finance and Tax Laws
Independent Director
Mr. Biswajit Choudhuri
Experienced in the field of Engineering, Banking, Finance and Management
Independent Director
Mr. Vikash Kumar Jewrajka
Experienced in the field of Monolithic Ceramics, Promotionsof Residential Property & Fly Ash Bricks MachineManufacturer
Independent Director
Mr. Ashok Bhandari
Experienced in the field of Finance and Negotiation withBanks, Governments and Technology & Equipment suppliers
Independent Director
Mr. Palghat Krishnan Venkatramani
Experienced in the field of Banking with specialty in IndustrialFinance and staff training and Foreign Exchange andManagement Accountancy
Independent Director
Ms. Kalpana Biswas Kundu
Experienced in the field of Banking, Accounts and Finance

Vision, Mission and Values
16
VisionTo be India’s premiere Alloy Company that is built on the solid foundation of shareholder trust, customer commitment, employee satisfaction and sustainable communities. Consistently delivering on our promises backed by meticulous hard work is our motto for ensuring success always!
MissionTo be India’s premiere Alloy Company by:• Promising excellent shareholder value: Guarantee a high ROC
coupled with lower-than-market debt ratios• Nurturing our employees: Encourage employees to work hard
and add to their knowledge base. Ensuring employee growth by creating a secure and stress-free working environment.
• Utmost commitment to our customers: Irrespective of the market conditions, we will always strive for the highest product standards that will in turn ensure complete customer satisfaction.
• Care for our communities: A clean environment, education, housing, health and sustainability for our communities will always remain our mission.
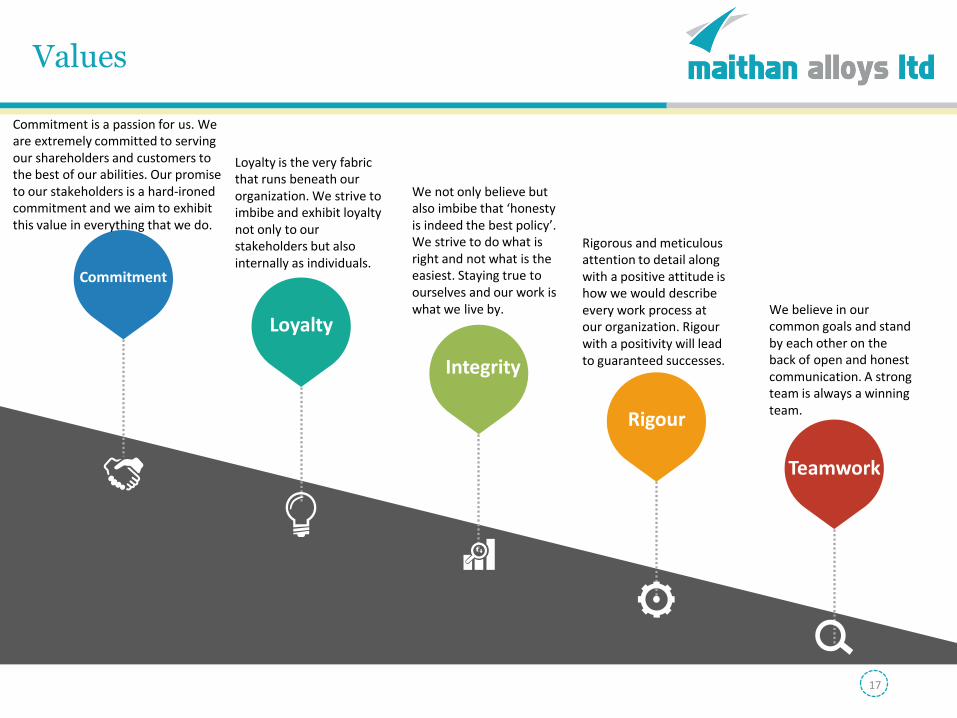
Values
Commitment
Loyalty
Rigour
Teamwork
17
Commitment is a passion for us. We are extremely committed to serving our shareholders and customers to the best of our abilities. Our promise to our stakeholders is a hard-ironed commitment and we aim to exhibit this value in everything that we do.
Loyalty is the very fabric that runs beneath our organization. We strive to imbibe and exhibit loyalty not only to our stakeholders but also internally as individuals.
Integrity
We not only believe but also imbibe that ‘honesty is indeed the best policy’. We strive to do what is right and not what is the easiest. Staying true to ourselves and our work is what we live by.
Rigorous and meticulous attention to detail along with a positive attitude is how we would describe every work process at our organization. Rigour with a positivity will lead to guaranteed successes.
We believe in our common goals and stand by each other on the back of open and honest communication. A strong team is always a winning team.
Maintaining the Maithan Edge
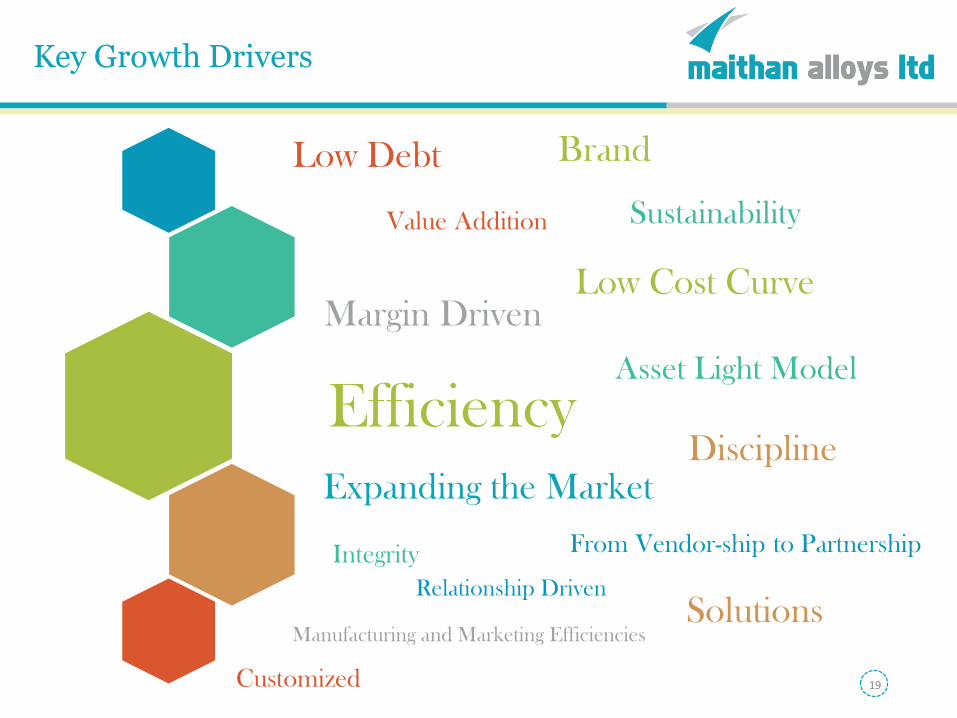
Key Growth Drivers
19
Efficiency
Sustainability
Relationship Driven
Value Addition
Low Cost Curve
From Vendor-ship to Partnership
Margin Driven
Expanding the Market
Low Debt
Asset Light Model
Discipline
Manufacturing and Marketing Efficiencies
Brand
Customized
Solutions
Integrity
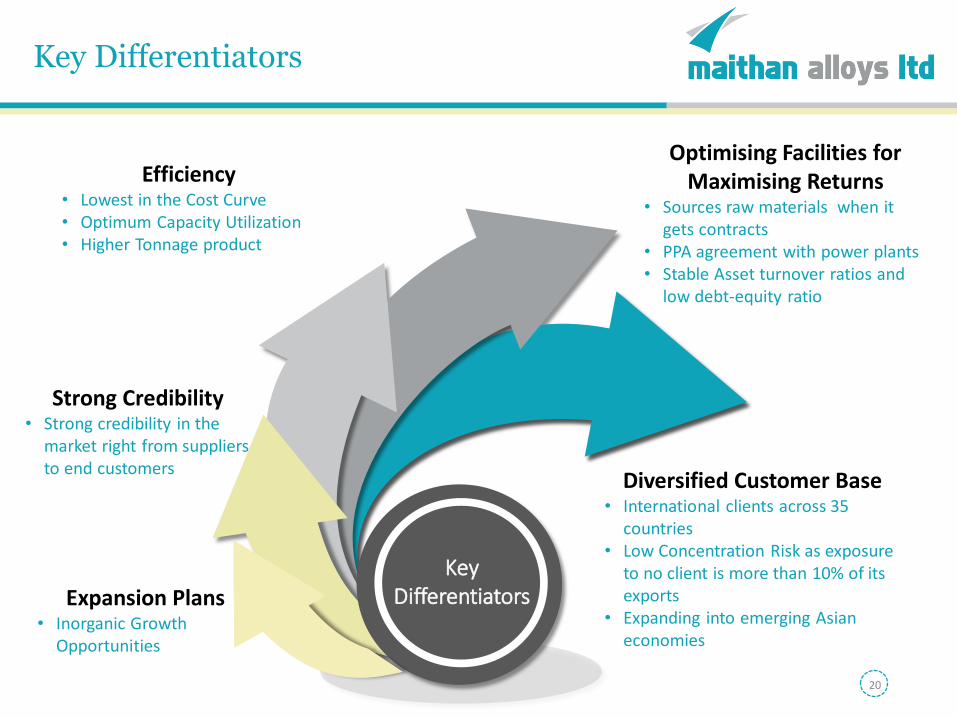
Key Differentiators
20
Key Differentiators
Strong Credibility• Strong credibility in the
market right from suppliers to end customers
Efficiency• Lowest in the Cost Curve• Optimum Capacity Utilization • Higher Tonnage product
Expansion Plans• Inorganic Growth
Opportunities
Diversified Customer Base• International clients across 35
countries• Low Concentration Risk as exposure
to no client is more than 10% of its exports
• Expanding into emerging Asian economies
Optimising Facilities for Maximising Returns
• Sources raw materials when it gets contracts
• PPA agreement with power plants• Stable Asset turnover ratios and
low debt-equity ratio
Industry Tailwinds
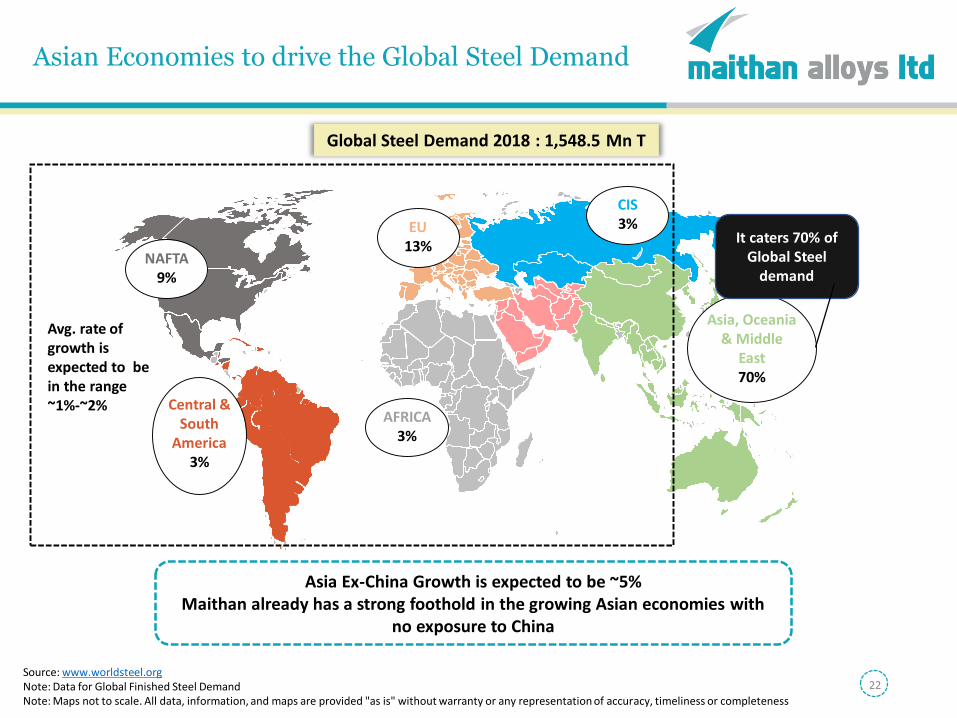
Asian Economies to drive the Global Steel Demand
Global Steel Demand 2018 : 1,548.5 Mn T
Asia Ex-China Growth is expected to be ~5%Maithan already has a strong foothold in the growing Asian economies with
no exposure to China
Source: www.worldsteel.orgNote: Data for Global Finished Steel DemandNote: Maps not to scale. All data, information, and maps are provided "as is" without warranty or any representation of accuracy, timeliness or completeness
Central & South
America3%
NAFTA9%
EU13%
CIS3%
Asia, Oceania & Middle
East70%
AFRICA3%
It caters 70% of Global Steel
demand
Avg. rate of growth is expected to be in the range ~1%-~2%
22
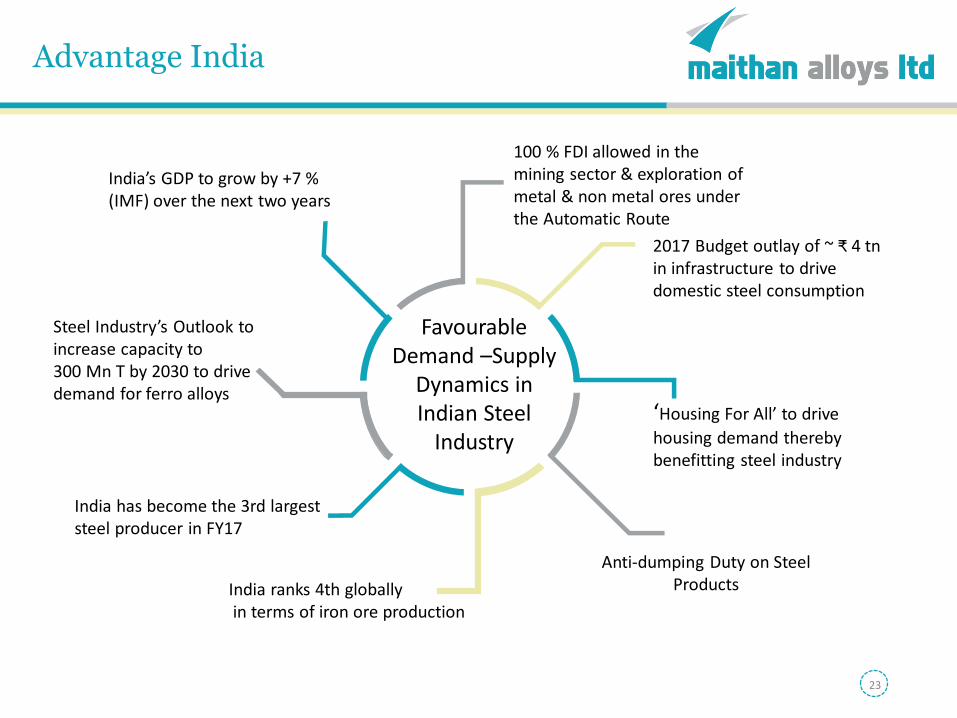
Advantage India
100 % FDI allowed in the mining sector & exploration of metal & non metal ores under the Automatic Route
‘Housing For All’ to drive
housing demand thereby benefitting steel industry
Steel Industry’s Outlook to increase capacity to 300 Mn T by 2030 to drive demand for ferro alloys
India ranks 4th globallyin terms of iron ore production
India has become the 3rd largest steel producer in FY17
India’s GDP to grow by +7 % (IMF) over the next two years
Favourable Demand –Supply
Dynamics in Indian Steel
Industry
2017 Budget outlay of ~ ₹ 4 tnin infrastructure to drive domestic steel consumption
Anti-dumping Duty on Steel Products
23
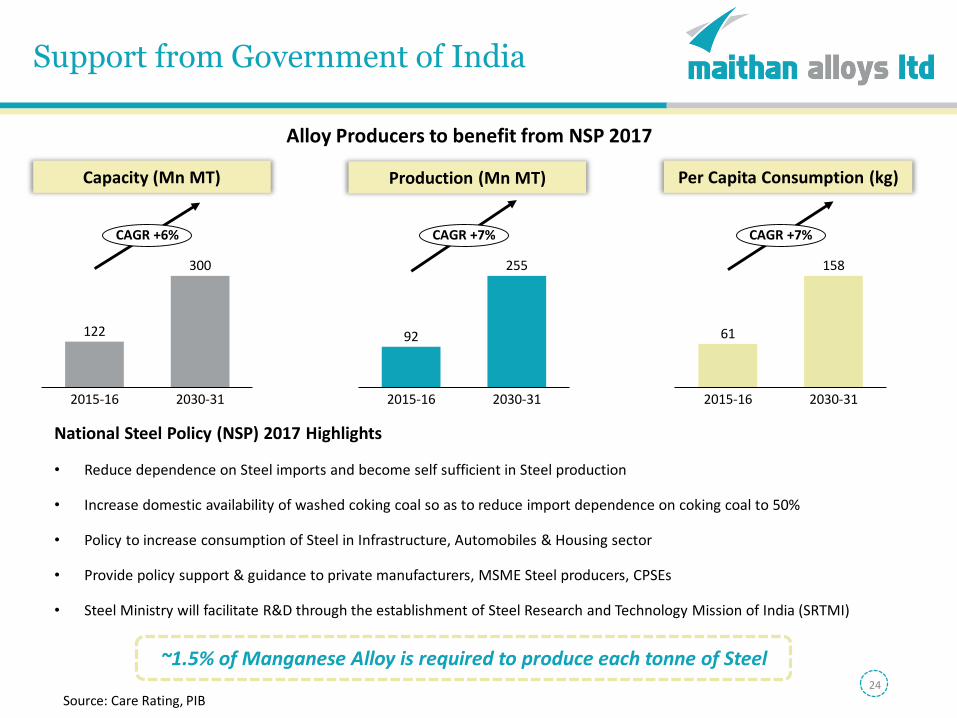
Support from Government of India
24
National Steel Policy (NSP) 2017 Highlights
• Reduce dependence on Steel imports and become self sufficient in Steel production
• Increase domestic availability of washed coking coal so as to reduce import dependence on coking coal to 50%
• Policy to increase consumption of Steel in Infrastructure, Automobiles & Housing sector
• Provide policy support & guidance to private manufacturers, MSME Steel producers, CPSEs
• Steel Ministry will facilitate R&D through the establishment of Steel Research and Technology Mission of India (SRTMI)
~1.5% of Manganese Alloy is required to produce each tonne of Steel
Source: Care Rating, PIB
Alloy Producers to benefit from NSP 2017
122
300
2015-16 2030-31
CAGR +6%
Capacity (Mn MT)
92
255
2015-16 2030-31
CAGR +7%
61
158
2030-312015-16
CAGR +7%
Production (Mn MT) Per Capita Consumption (kg)
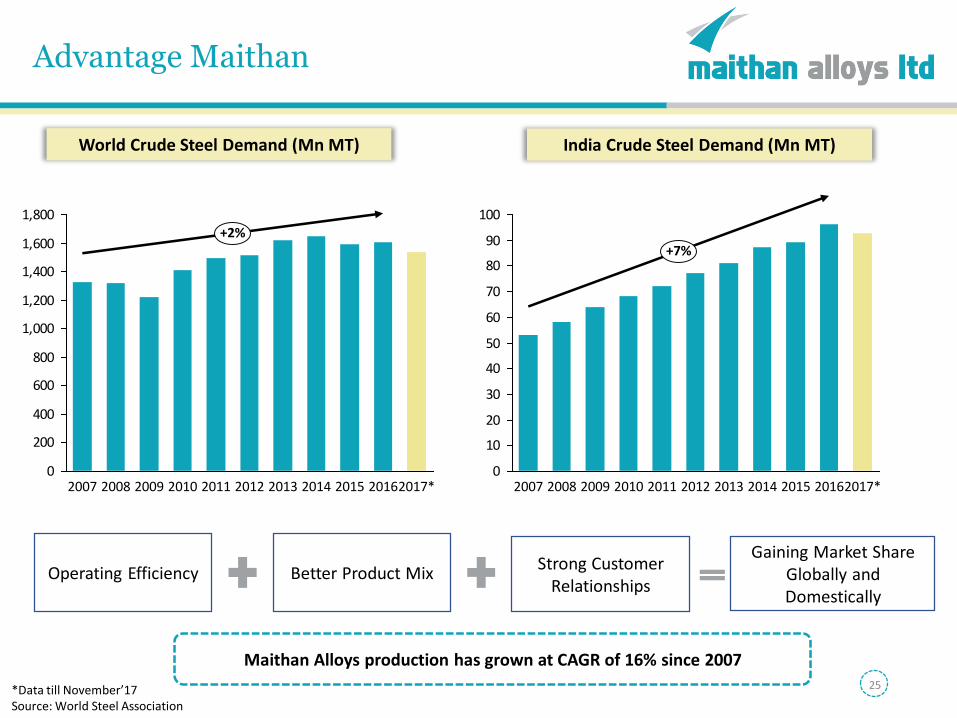
Advantage Maithan
25
0
200
400
600
800
1,000
1,200
1,400
1,600
1,800
2007 2009 2010 2011 2012 20162017*20152008 20142013
+2%
*Data till November’17Source: World Steel Association
Operating Efficiency Better Product MixStrong Customer
Relationships
World Crude Steel Demand (Mn MT) India Crude Steel Demand (Mn MT)
Gaining Market Share Globally and Domestically
0
10
20
30
40
50
60
70
80
90
100
2007 2009 2010 2011 2012 20162017*20152008 20142013
+7%
Maithan Alloys production has grown at CAGR of 16% since 2007
Financials
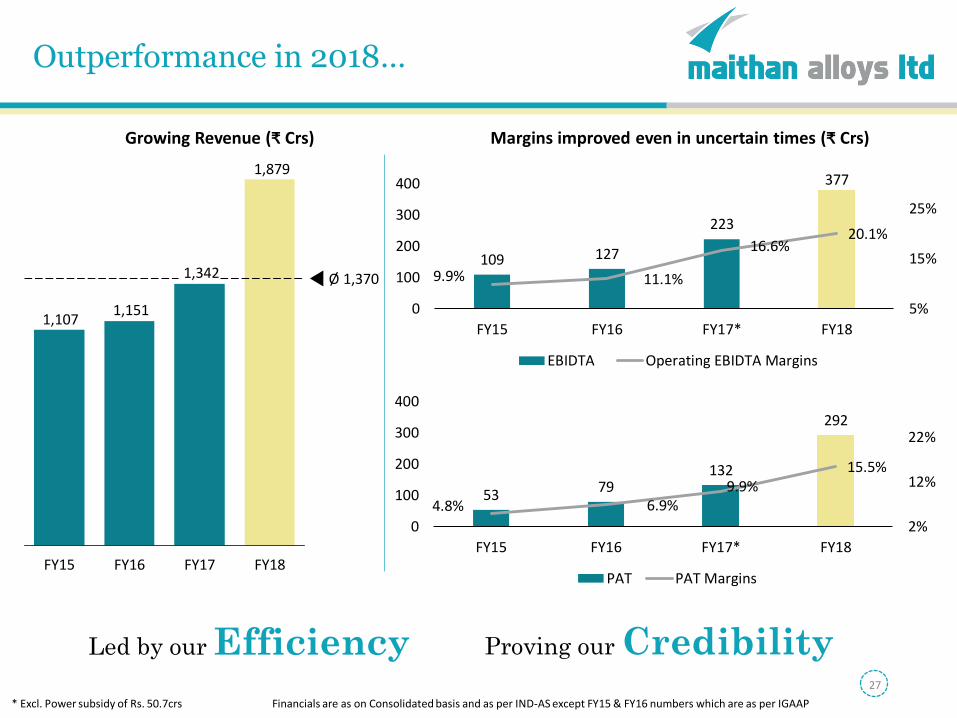
Outperformance in 2018…
Growing Revenue (₹ Crs) Margins improved even in uncertain times (₹ Crs)
1,879
1,342
1,1511,107
FY15 FY18FY17
Ø 1,370
FY16
109 127
223
377
9.9% 11.1%
16.6%20.1%
5%
15%
25%
0
100
200
300
400
FY15 FY16 FY17* FY18
EBIDTA Operating EBIDTA Margins
Led by our Efficiency
* Excl. Power subsidy of Rs. 50.7crs
Proving our Credibility
5379
132
292
4.8% 6.9%9.9%
15.5%
2%
12%
22%
0
100
200
300
400
FY15 FY16 FY17* FY18
PAT PAT Margins
Financials are as on Consolidated basis and as per IND-AS except FY15 & FY16 numbers which are as per IGAAP
27
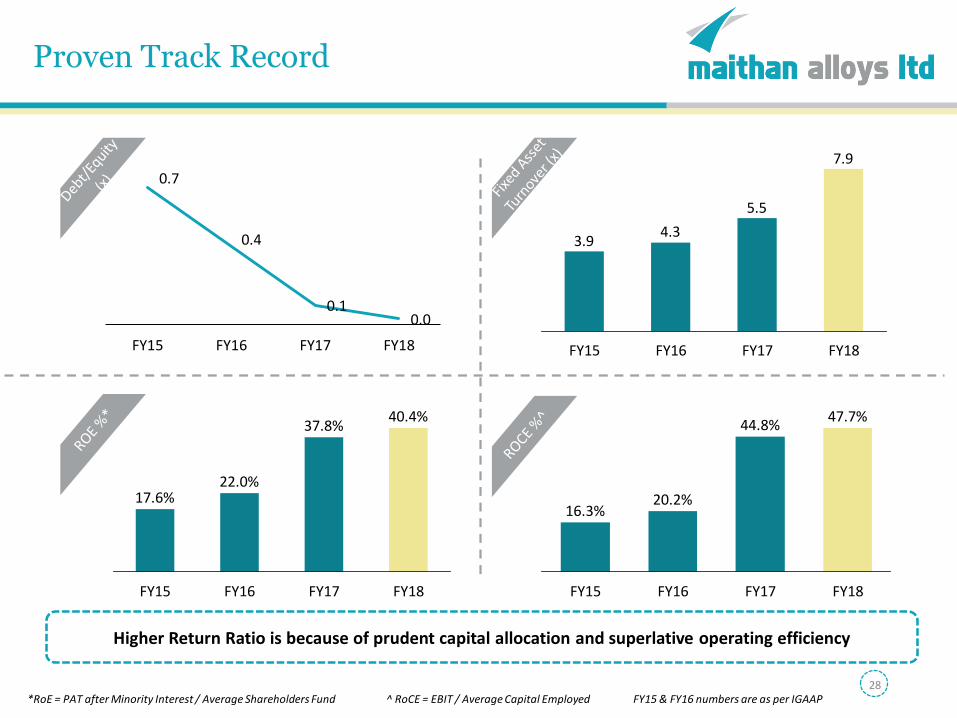
Proven Track Record
28
44.8%
FY16 FY18FY15
16.3%20.2%
47.7%
FY17
7.9
5.5
4.33.9
FY17FY15 FY16 FY18
40.4%
FY18
17.6%
FY17
37.8%
FY16
22.0%
FY15
*RoE = PAT after Minority Interest / Average Shareholders Fund ^ RoCE = EBIT / Average Capital Employed
0.7
0.4
0.10.0
FY15 FY16 FY17 FY18
Higher Return Ratio is because of prudent capital allocation and superlative operating efficiency
FY15 & FY16 numbers are as per IGAAP
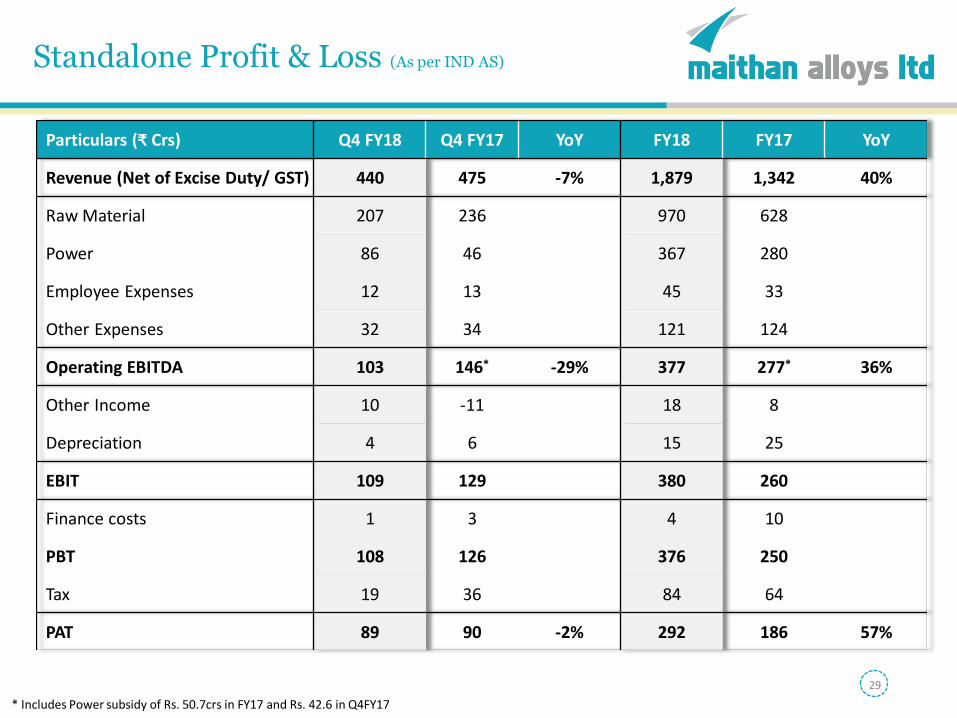
Standalone Profit & Loss (As per IND AS)
Particulars (₹ Crs) Q4 FY18 Q4 FY17 YoY FY18 FY17 YoY
Revenue (Net of Excise Duty/ GST) 440 475 -7% 1,879 1,342 40%
Raw Material 207 236 970 628
Power 86 46 367 280
Employee Expenses 12 13 45 33
Other Expenses 32 34 121 124
Operating EBITDA 103 146* -29% 377 277* 36%
Other Income 10 -11 18 8
Depreciation 4 6 15 25
EBIT 109 129 380 260
Finance costs 1 3 4 10
PBT 108 126 376 250
Tax 19 36 84 64
PAT 89 90 -2% 292 186 57%
29
* Includes Power subsidy of Rs. 50.7crs in FY17 and Rs. 42.6 in Q4FY17
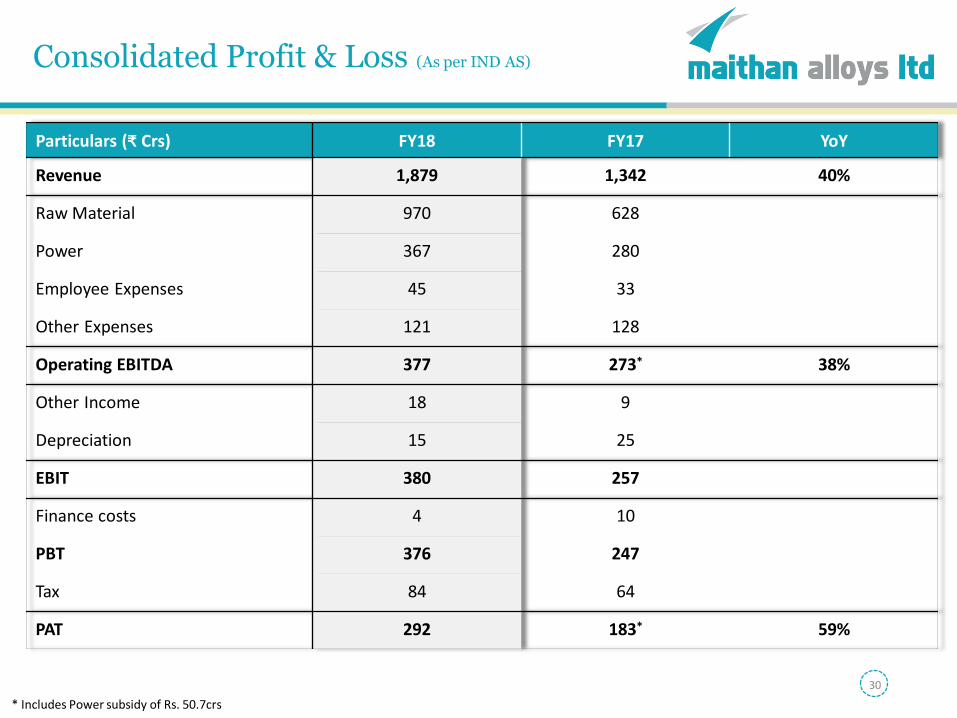
Consolidated Profit & Loss (As per IND AS)
Particulars (₹ Crs) FY18 FY17 YoY
Revenue 1,879 1,342 40%
Raw Material 970 628
Power 367 280
Employee Expenses 45 33
Other Expenses 121 128
Operating EBITDA 377 273* 38%
Other Income 18 9
Depreciation 15 25
EBIT 380 257
Finance costs 4 10
PBT 376 247
Tax 84 64
PAT 292 183* 59%
30
* Includes Power subsidy of Rs. 50.7crs
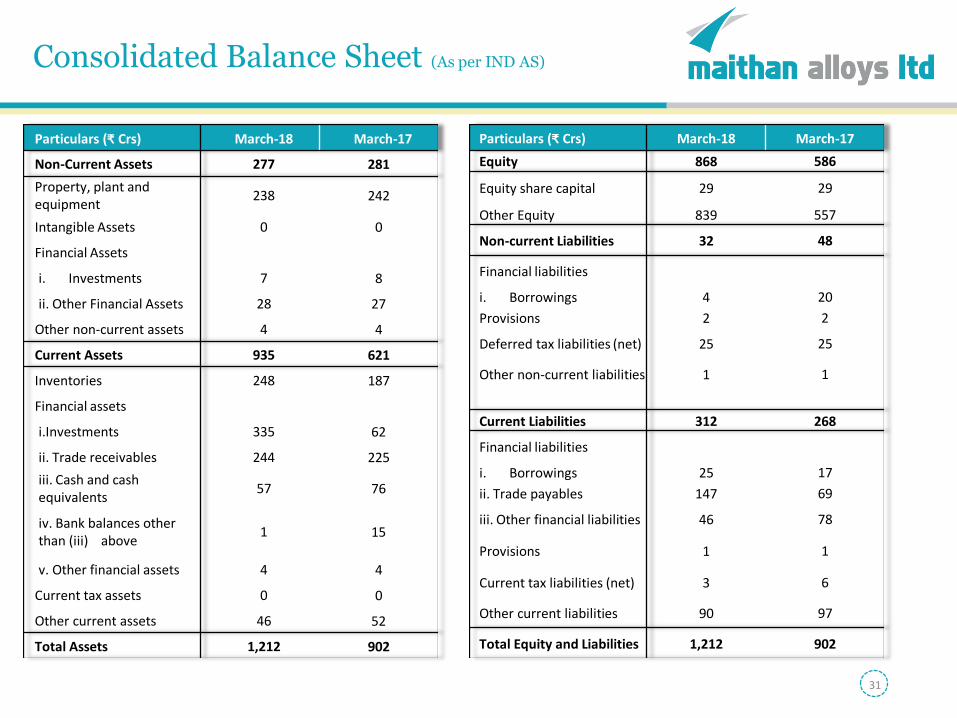
Consolidated Balance Sheet (As per IND AS)
31
Particulars (₹ Crs) March-18 March-17
Non-Current Assets 277 281
Property, plant and equipment
238 242
Intangible Assets 0 0
Financial Assets
i. Investments 7 8
ii. Other Financial Assets 28 27
Other non-current assets 4 4
Current Assets 935 621
Inventories 248 187
Financial assets
i.Investments 335 62
ii. Trade receivables 244 225
iii. Cash and cash equivalents
57 76
iv. Bank balances other than (iii) above
1 15
v. Other financial assets 4 4
Current tax assets 0 0
Other current assets 46 52
Total Assets 1,212 902
Particulars (₹ Crs) March-18 March-17
Equity 868 586
Equity share capital 29 29
Other Equity 839 557
Non-current Liabilities 32 48
Financial liabilities
i. Borrowings 4 20
Provisions 2 2
Deferred tax liabilities (net) 25 25
Other non-current liabilities 1 1
Current Liabilities 312 268
Financial liabilities
i. Borrowings 25 17
ii. Trade payables 147 69
iii. Other financial liabilities 46 78
Provisions 1 1
Current tax liabilities (net) 3 6
Other current liabilities 90 97
Total Equity and Liabilities 1,212 902
32
For further information, please contact:
Company Investor Relations Advisors:
Maithan Alloys Ltd. Strategic Growth Advisors Pvt. Ltd.
CIN: L27101WB1985PLC039503 CIN: U74140MH2010PTC204285
Mr. Rajesh K. [email protected]
Ms. Neha Shroff/ Mr. Deven [email protected] / [email protected]
www.maithanalloys.com
+91-7738073466 / +91-9833373300
www.sgapl.net