Embed Size (px)
Citation preview

Status : Final
Singapore_NTUC_FairPrice - Full report.docx
ISO Pilot Project on
Economic Benefits of Standards
NTUC FairPrice
Singapore
(30 March 2011)

Status : Final
30 March 2011
Singapore_NTUC_FairPrice - Full report.docx
Page 2 of 107
Contents
1. Objectives and Organization of the ISO Pilot Project ………………………………............5
1.1 Objective.……………………………………………………………………………………………………………………… 5
1.2 ISO Pilot Study Project Timeline ……………………………………………………………………….............. 5
1.3 ISO Pilot Study Industry Focus ……..……………………………………………………………………………..5
1.4 Methodology …………………………………………………………………………………………………………………6
2. Introduction of the Selected Company ………………………………………………………..7
3. Attitude of the Company towards Standardization …………………………………………..8
4. Analysis of the Value Chain ……………………………………………………………………9
4.1 Industry value chain ……………………………………………………………………………………………………. 9
4.2 Company value chain ……………………………………………………………………………………………….. 10
4.3 Key value drivers ……………………………………………………………………………………………………….. 12
5. Scope of the ISO Pilot Study …………………………………………………………………13
5.1 Key Business Functions of the Value Chain .…………………………………………………………………… 13
5.2 Product Types ..……………………………………………………………………………………………………………… 15
5.3 Retail Outlets ………………………………………………………………………………………………………………… 15
5.4 Warehousing/ Distribution .…………………………………………………………………………………………. 15
6. Standards used in the Company Value Chain …………………………………………….16
7. Selection of Operational Indicators to measure the Impacts of Standards …………..... 20
7.1 Impact on Procurement Business Function …………………………………………………………………… 23
7.2 Impact on Warehousing/Distribution Business Function ………………………………………………. 24
7.3 Impact on Retail Business Function ……………………………………………………………………………… 37
8. Impact by Standard ……………………………………………………………………………41
8.1 Cold Chain Management Standard for Milk and Dairy Products …………………………………… 41
8.2 Cold Chain Management Standard for Chilled Pork ……………………………………………………… 45
8.3 Standard Pallet and Carton Barcode Standards …………………………………………………………… 47
9. Calculation of the Economic Benefits of Standards..…………………………………........48
10. Qualitative and Semi-quantitative Considerations …………………………………………49
11. Evaluation of the Results ……………………………………………………………………..51
12. Conclusions ………………………………………………………………………………........51

Status : Final
30 March 2011
Singapore_NTUC_FairPrice - Full report.docx
Page 3 of 107
List of Figures
Figure 1: Supermarket Industry value chain and ISO Pilot Study Scope …….……………...10
Figure 2: NTUC FairPrice Key Value Chain Components …………………………………….11
Figure 3: Process Flow ……………………………………………………………………………12
Figure 4: Procurement Function Activities ………………………………………………………14
Figure 5: Warehousing/Distribution Function Activities ………………………………………..14
Figure 6 : Retail Function Activities ………………………………………………………………15
Figure 7: Business Functions and their Related Standards .…………………………………. 17
Figure 8: Flow of Cartons through GLS .…………………………………………………………27
Figure 9: Delivery Flow of Palletised Goods ……………………………………………….... ...30
Figure 10: Supply Chain for Milk and Dairy ……………………………………………………..37
List of Tables
Table 1: Consensus Standards and Impacted Business Functions …………………………18
Table 2: Operational Indicators………………………………………………………………….. 21
Table 3: Procurement Function Benefits - Implementation of Cold Chain Management Standards for Milk and Dairy and Chilled Pork ………………………………………23
Table 4: Warehousing/Distribution Function Benefits - Implementation of Carton Barcodes, Standard Pallet and Cold Chain Management Standard for Milk and Dairy .……. 35
Table 5: Retail Function Benefits - Implementation of Cold Chain Management Standard for Milk and Dairy and Chilled Pork ……………………………………………………38 Table 6: Implementation of Cold Chain Management Standard for Milk and Dairy.……......42 Table 7: Implementation of Cold Chain Management Standard for Chilled Pork ………......45 Table 8: Summary of Impact of Standards across Different Business Functions at NTUC FairPrice ………………………………………………………………………….48 Table 9: Cumulative Benefits for 1999 to 2009 .…………………………………………….....49

Status : Final
30 March 2011
Singapore_NTUC_FairPrice - Full report.docx
Page 4 of 107
Annex 1: ISO Pilot Study Project Team Composition ………………………………………….53 Annex 2: Value Chain Analysis - NTUC FairPrice (Attached) Annex 3: References……………………………………………………………………………… 55 Annex 4: Date of Meetings / Interviews …………………………………………………..……..56 Annex 5: Questionnaires Annex 5.1: Economic benefits of Standardization-Assessment Tool- Standard Pallet ……………………......................................................................... 58 Annex 5.2: Economic benefits of standardization-Assessment Tool- Carton Barcode …………..…………………… ……………………………………….69 Annex 5.3a: Economic benefits of standardization-Assessment Tool- Cold Chain for Chilled Pork ……………………………………………………………79 Annex 5.3b: Economic benefits of standardization-Assessment Tool- Cold Chain for Milk and Dairy..…………………………………………………………89 Annex 6: Glossary ………………………………………………………………………………..107

Status : Final
30 March 2011
Singapore_NTUC_FairPrice - Full report.docx
Page 5 of 107
ISO PILOT PROJECT REPORT ON ECONOMIC BENEFITS OF STANDARDS IMPLEMENTED BY NTUC FairPrice, SINGAPORE
1. OBJECTIVES AND ORGANIZATION OF THE PILOT PROJECT 1.1 Objective The key objective of the ISO Pilot Project is to determine in a quantitative manner the
benefits companies can derive from the use of standards in their business. Such knowledge is useful for the demonstration of the advantages of participating in standards development initiatives and/or the use of standards. While many organizations realize the importance of the use of standards, few have analyzed their impact on their companies‟ bottom line and their key role in an organization‟s strategy.
1.2 ISO Pilot Study Project Timeline The ISO Pilot project in Singapore was conducted from October 2010 till Jan 2011 with
the finalization of the report in February 2011. The pilot project was led by SPRING Singapore 1 with the guidance of ISO and support of MBA Interns from the Nanyang Business School2. Please refer Annex 1 for the names of the pilot study team members.
1.3 ISO Pilot Study Industry Focus
This study is focused on the impact of standards in the supermarket sector of the food retail business. The supermarket is the defining retail element of the food industry. Restaurants, cafes, bakeries, food courts and hawker centres are also ways consumers can purchase food. About 60% 33
of the food retail sales takes place in supermarkets, hyper marts and modern mini marts. The rest takes place in traditional provision stores, wet market stalls and convenience stores. Increasingly over the last 10 years or so, more households are going to supermarkets for their fresh produce, meats and fish
requirements.
The growth of the supermarket business has been particularly high in the last decade or so as more and more household are turning from wet markets and small provision
1 SPRING Singapore is the enterprise development agency responsible for helping Singapore enterprises grow. We work with partners to help enterprises in financing, capability and management development, technology and innovation, and accessing new markets. As the national standards and accreditation body, SPRING develops and promotes an internationally-recognised standards and quality assurance infrastructure that builds trust in Singapore enterprises, products and services, thereby enabling their global competitiveness and facilitating global trade. 2 The NANYANG MBA is recognized internationally for its prestige and lifelong learning experience.
Delivered by a top international faculty, The NANYANG MBA has consistently been recognized among the Top MBA programmes globally. Ranked amongst Asia’s best, it is the first in Singapore and among a select few in the world to attain both highly prestigious accreditation from higher education bodies, EQUIS (EU) and AACSB (US). A select group of high caliber individuals from more than twenty nationalities from diverse backgrounds attend The NANYANG MBA to prepare them to lead and manage organizations in a global business environment, with a strong Asian know-how that is beyond compare.
3 Food Export Association of the Midwest USA www.foodexport.org

Status : Final
30 March 2011
Singapore_NTUC_FairPrice - Full report.docx
Page 6 of 107
shops to supermarkets for their fresh produce, meats and fish requirements. Strong growth is expected for supermarket and hypermarket given the continuing growth in consumption with the good recovery from the 2009 crisis. The previous compounded annual growth rate was 6.7% between 2003 and 2008 for supermarkets, hypermarket and discounters with food and grocery market sales accounting for 83% of this share of retail outlets in 20084.
The two supermarket chains dominating the Singapore food retail industry are NTUC
FairPrice supermarkets and Dairy Farm. NTUC FairPrice targets the middle and lower income group and has successfully entered the higher income markets with NTUC Finest. The NTUC FairPrice supermarket chain is currently the largest supermarket chain in terms of number of supermarket outlets with competitive pricing being the main focus of procurement of goods for NTUC FairPrice stores which are located in almost every residential area.
1.4 Methodology The ISO methodology aims at assessing and quantifying the impacts of standards from
the perspective of the selected company. The methodology is organized around the following four key steps:
Step 1: Understand the Value Chain5: Desk research was undertaken on the food retail industry value chain. The value chain was researched and assessed for the industry and also for selected company. Step 2: Analyze Value Drivers: Value Drivers are crucial organizational capabilities for the success of each business function that forms the value chain. In this assessment, value drivers specific to the selected company are mapped for each point of the value chain. In doing so, the value chain represented by the various key business functions is analyzed with the help of key operational indicators. Step 3: Identify impact of standards: After the relevant value drivers and key operational indicators have been identified, the relevant standards are described and their impact on each of the activities of the business functions is mapped through a series of interviews with the company‟s senior management. In order to quantify the impact, an analysis was carried out to examine whether the impact on the financial performance of the company could be measured after the introduction of the standard. The quantification was done on an annual basis; however,
4 Hypermarket, Supermarket and Discounters in Singapore www.researchandmarkets.com/reports/1436870 5 Value Chain is a chain of activities. Products (or services) move through all the activities in a prescribed order, gaining value in some way at each stage of the chain. It was first described and popularized by Michael Porter in his 1985 best-seller, Competitive Advantage: Creating and Sustaining Superior Performance.
Status : Final
30 March 2011
Singapore_NTUC_FairPrice - Full report.docx
Page 7 of 107
the impact is projected to span a 5 year period from the introduction of standard after which, the improved operations become a part of normal operating procedures at the selected company.
Step 4: Assess and consolidate results: After quantifying the impact of different standards, the value creation of standards in each business function is aggregated. This is done on the basis of the effect on the total grocery business revenue of the selected company. Important qualitative impacts of the standards were also included.
It should be noted that the methodology limits the assessment of the impact of
standards to a period not exceeding the last five years to ensure that the impact of standards is not now just a "regular business practice". In the case of NTUC FairPrice, it was decided in consultation with ISO, that though a number of the key consensus standards identified have been introduced more than five years ago, the presence of several key staff who were there during the initial implementation of the standard, made this assessment possible. However, the estimation of the impact of these standards implemented more than five years ago would have their impact limited to 5 years after their implementation. Details of the introduction of the key consensus standards identified for the pilot can be found in section 6.
2. INTRODUCTION OF THE SELECTED COMPANY
NTUC FairPrice Co-operative Ltd was founded by the labor movement in Singapore in 1973, with a social mission to moderate the cost of living in Singapore. In 1983, NTUC Welcome merged with the Singapore Employees Co-operative to form NTUC FairPrice Co-operative Ltd, (FairPrice) selling groceries, household items, beverages, food items and other merchandise. NTUC FairPrice has grown to become Singapore‟s largest supermarket retailer, with a network of more than 240 outlets and a market share of over 50%, making it a household name and a highly trusted brand. The company achieved strong performance with revenues over SGD 2 billion in Y2010 and has witnessed a CAGR of over 8% over the past decade. Net profit of the company too has shown a steady increase to over SGD 120 million and it employs over 7,000 employees. Today, with its multiple retail formats, the social mission of NTUC FairPrice has evolved to make the dream of living well accessible to everyone by moderating the cost of living in Singapore. Its service motto “Service from the Heart” is a part of Fair Price‟s corporate vision - To Be Singapore's Leading World-Class Retailer with a Heart. The key value chain of NTUC FairPrice which is impacted by the consensus standards identified consists of three major business functions: Procurement, Warehousing/Distribution and Retail. The other business functions include Finance, Information Systems and Human Resources. While Procurement provides support functions to the core retail business, NTUC FairPrice‟s Warehousing and Distribution function facilitates the distribution system through its wholly owned Fresh Food Distribution Centre and a centralized warehousing and

Status : Final
30 March 2011
Singapore_NTUC_FairPrice - Full report.docx
Page 8 of 107
distribution company - Grocery Logistics of Singapore Pte Ltd. The Retail business function is the key profit centre comprising
FairPrice supermarkets which offers quality products at best value and services to
customers from all walks of life;
FairPrice Finest aims to bring a whole new experience of fine living to customers by
offers a wider product assortment, value-added services and better shopping
environment;
FairPrice Xtra is the name for FairPrice‟s hypermarkets, offers a wider variety of
products and services including, a wide range of electronic products and a good
selection of casual and basic wear, on top of their food fare. Products are available
in family-size packages so that consumers can enjoy greater savings.
FairPrice Xpress is the name of the small FairPrice outlets in petrol kiosks which
are opened 24 hours a day, seven days a week. FairPrice Xpress is the result of
FairPrice‟s tied ups with the oil company ExxonMobil to open minimarts in Esso
and Mobil stations in Singapore. These outlets stock mainly daily essentials such
as fresh produce, rice, juice, milk, cooking oil and toiletries; and
Cheers convenience stores
The scope of the assessment in the pilot project focuses on the three major business functions - Procurement, Warehousing/Distribution, and Retail (only FairPrice Hypermarkets, supermarkets and FairPrice Finest). A high percentage of the sales revenue are earned through sales from the FairPrice supermarkets, FairPrice Finest and FairPrice Xtra(Hypermarkets) and as these retail outlets contribute the bulk of the sales revenue to NTUC FairPrice Group, the ISO pilot study will focus on these retail outlets.
3. ATTITUDE OF THE COMPANY TOWARDS STANDARDIZATION
NTUC FairPrice is a believer and advocate of standards and hence is an ideal company for this project. Being the largest supermarket retailer, NTUC FairPrice not only uses standards to help increase its operation and cost efficiencies, it also helps to raise the standards of Singapore‟s retail industry by facilitating many local companies, namely its suppliers to also use standards. It was among the first supermarkets to introduce many standards - both mandatory and voluntary in its business operations. NTUC FairPrice was approached to participate in this pilot as its leaders and executives strongly believe in the key roles that both mandatory and voluntary standards play in its growth. NTUC FairPrice has led/participated in both the development and implementation of standards for more than ten years. Its brand promise is to ensure quality products and this is achieved through regular audits and compliance with regulations and standards. NTUC FairPrice is HACCP (Hazard Analysis and Critical Control Points) and ISO 9001:2008 certified. Some of the awards won in the last 3 years are:6
6 Source: http://www.FairPrice.com.sg/
Status : Final
30 March 2011
Singapore_NTUC_FairPrice - Full report.docx
Page 9 of 107
2008 NTUC FairPrice received the Food Safety Partner Award from the Agri-Food and
Veterinary Authority (AVA) Conferred the STAR award by Spring Singapore for participation in the Singapore
National Standardization Programme 2009 Topped the Supermarket category in the National Customer Satisfaction Index of
Singapore NTUC FairPrice received the Food Safety Partner Award from the Agri-Food and
Veterinary Authority (AVA) NTUC FairPrice's Fresh Food Distribution Centre (FFDC) received the Food Safety
Excellence Award - Bronze from the Agri-Food and Veterinary Authority (AVA) 2010 Voted by consumers in Reader's Digest survey as Trusted Brand (Platinum) for
Supermarket Chain category in Singapore NTUC FairPrice was ranked second in Singapore's Top 20 brands, in the Media
Top 1000 Asia Pacific Brands 2010 report Awarded the Manager of the Year Award and Green Retailer of the Year Award at
the Singapore Retailers Association (SRA) Awards Awarded the Singapore Service Class Certification in recognition of having
management systems and processes in place to achieve service standards 4. ANALYSIS OF THE VALUE CHAIN The supermarket industry is a complex, global collective of diverse businesses that
together supply much of the food consumed by the world population. A value chain for any product or service extends from research and development to raw materials supply and food production, delivery to international buyers and disposal/ recycling. A highly integrated supply chain helps to pull together the complex processes in this industry to ensure quality, safety and efficiency in its processes.
4.1 Industry value chain Wal-mart, Carrefour, Metro Group, Tesco, Schwarz and Kroger are the top 5 giants in
the global retail industry. Quality management and cost control are the key value drivers which increase their revenue and drive more benefits for their shareholders.
In Singapore, there is a rapid growth in the consumption of grocery products. 20% of our
annual household expenditure is on food & grocery. NTUC FairPrice7, Cold Storage8 under Dairy Farm International and Carrefour, are the three major supermarkets retailers in Singapore. NTUC FairPrice has been involved in the leadership of the Efficient Consumer Response (ECR) Singapore initiative since its launch in 1998 and focuses on the supply and demand management for the Fast Moving Consumer Goods industry,
7 Include FairPrice supermarket, FairPrice Finest 8 Cold storage supermarket only

Status : Final
30 March 2011
Singapore_NTUC_FairPrice - Full report.docx
Page 10 of 107
ECR Singapore is a chapter of ECR Asia, a trade and industry grouping for the fast moving consumer goods industry
9
. Figure 1 shows the typical supermarket industry value chain which in this case was
based on Wal Mart as indicated in the footnote 10. The DC and Retail functions are together in the case of Wal Mart.
Figure 1: Supermarket industry value chain and ISO Pilot Study Scope 10:
Supermarket life
cycle
Market
Planning
Procurement Warehouse (DC) /
Retail
Return
recycling
Key players
Manufacturers
Suppliers
Logistic Service
Technology
Service
Human Resource
Financia Service
The primary functions in the supermarket value chain are market planning, procurement,
Warehousing/Distribution, retail and return recycling. Supply chain management helps drive operational efficiency across the different functions. The key players in the value chain come from the internal support departments such as technology, human resource and finance and the external partners participating in the whole supply chain commencing from the manufacturer/supplier to procurement and retail.
The dotted line indicates the business functions which were identified as being key parts
of the value chain for this study. 4.2 Company value chain The value chain of NTUC FairPrice was confirmed with as being similar to that of other
major supermarket companies and the report provides an overview of the three major business functions - Procurement, Warehousing/Distribution, and Retail in NTUC FairPrice, which are directly involved in the processing and distribution of products and are impacted by the selected consensus standards.
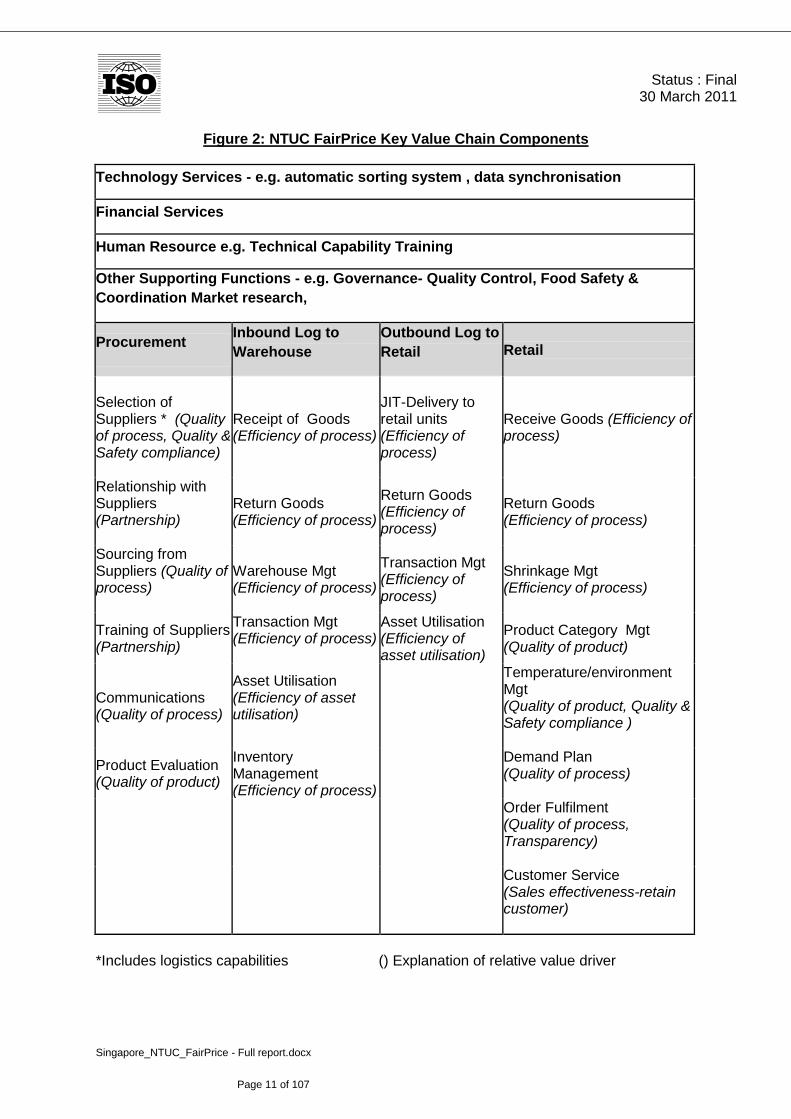
Figure 2 below shows the business functions that constitute the company value chain.
9 The ECR (“Efficient Consumer Response”) movement effectively began in the mid-nineties in the US and was characterised by the emergence of new principles of collaborative management along the supply chain. It was understood that companies can serve consumers better, faster and at less cost by working
together with trading partners. http: //ecr-all.org
10 http://www.slideshare.net/smehro/wal-mart-value-chain-analysis-by-sandro
Status : Final
30 March 2011
Singapore_NTUC_FairPrice - Full report.docx
Page 11 of 107
Figure 2: NTUC FairPrice Key Value Chain Components
Technology Services - e.g. automatic sorting system , data synchronisation
Financial Services
Human Resource e.g. Technical Capability Training
Other Supporting Functions - e.g. Governance- Quality Control, Food Safety &
Coordination Market research,
Procurement Inbound Log to
Warehouse
Outbound Log to
Retail Retail
Selection of Suppliers * (Quality of process, Quality & Safety compliance)
Receipt of Goods (Efficiency of process)
JIT-Delivery to retail units (Efficiency of process)
Receive Goods (Efficiency of process)
Relationship with Suppliers (Partnership)
Return Goods (Efficiency of process)
Return Goods (Efficiency of process)
Return Goods (Efficiency of process)
Sourcing from Suppliers (Quality of process)
Warehouse Mgt (Efficiency of process)
Transaction Mgt (Efficiency of process)
Shrinkage Mgt (Efficiency of process)
Training of Suppliers (Partnership)
Transaction Mgt (Efficiency of process)
Asset Utilisation (Efficiency of asset utilisation)
Product Category Mgt (Quality of product)
Communications (Quality of process)
Asset Utilisation (Efficiency of asset utilisation)
Temperature/environment Mgt (Quality of product, Quality & Safety compliance )
Product Evaluation (Quality of product)
Inventory Management (Efficiency of process)
Demand Plan (Quality of process)
Order Fulfilment (Quality of process, Transparency)
Customer Service (Sales effectiveness-retain customer)
*Includes logistics capabilities () Explanation of relative value driver

Status : Final
30 March 2011
Singapore_NTUC_FairPrice - Full report.docx
Page 12 of 107
Figure 3 : Process Flow Inbound Logistics Outbound Logistics Relationship Info Feedback Channel The process flow of the three key business functions is as follows:
1. Procurement refers to the management of sourcing and supplier relationship; 2. Warehousing/Distribution comprise inbound logistics and outbound logistics. Inbound
logistics refer to the delivery of products to the Distribution Centre(DC), whereas outbound logistics pertain to the delivery of products from the point of production or the DC to retail ;
3. Retail serves the daily demands of the consumers who also play a role in feeding back to NTUC Fairprice on its products and processes.
4.3 Key value drivers The key value drivers are the crucial capabilities that provide the competitive advantage
for the company. These capabilities are likely to reduce the risk associated with owning the business or enhancing the prospect that the business will grow significantly in the future. The key value drivers for NTUC FairPrice are its partnership with its suppliers, the quality and efficiency of its process and its relationship with its customers:
Partnership with suppliers The partnership between NTUC FairPrice and its suppliers is based on trust with standards being used to ensure quality and safety. The selected suppliers all comply with HACCP if they are food suppliers. The adoption of ISO 9001 is recommended to non food suppliers who may also demonstrate that they have similar quality systems as an alternative to ISO 9001. For house brands, HACCP certification is a must or suppliers must be at least ready for a HACCP certified process. The Cold Chain Management Standard for Milk and Dairy as well as for Chilled Pork and the Standard Pallet are the other standards which NTUC FairPrice‟s suppliers are required to comply with. The efficiency of delivery is also essential as this helps to keep the costs down for both the supplier and NTUC FairPrice.
Quality of products and processes NTUC FairPrice has increased the number of stores from 65 to 98 from 1999 to 2009, whilst the level of working capital per store has been reduced, and the number of staff who work in the Procurement Department and the DC (GLS) are maintained at the same level. Internally, systematic training programs has enlarged the knowledge of the operating processes and enabled NTUC FairPrice to maintain or enhance the quality and variety of its products and enabled its suppliers to deliver the products in good condition.
Procurement Distribution Centre Retail
Supplier Customer

Status : Final
30 March 2011
Singapore_NTUC_FairPrice - Full report.docx
Page 13 of 107
Safety compliance A temperature-controlled supply chain for critical perishable products like milk and dairy products and chilled pork to ensure that health and safety is not compromised along the supply chain has also helped for chilled pork to expand the number of sources of chilled pork and for both milk and dairy products and chilled pork, helped to extend their shelf life.
Efficiency of processes NTUC FairPrice is constantly looking at ways to improve their processes. The implementation of a warehouse management system and the introduction of an innovative automatic sortation system in the main distribution centre smoothly integrates the information and product flow in the warehouse. Furthermore, consistent and reliable data exchange enhances the communications across different departments and reduces the time to fulfil the retail stores‟ orders. This results in an increase in its operational accuracy and throughput. The enhanced processes have helped to reduce the operational costs in the warehouses and significantly increased the productivity of its existing resources. Efficient tracking of the goods within the DC using the centralized warehouse management system helps to reduces costs with an improved utilization of personnel time and the more efficient delivery and retrieval of goods.
Sales effectiveness retain customer: NTUC FairPrice, as a co-op organization, helps to stabilize the cost of living by providing reliable and efficient services that result in safe and cost efficient products for its customers. Customers who join its membership plan will receive rebates and dividends as part of the NTUC FairPrice‟s royalty programme.
5. SCOPE OF THE ISO PILOT STUDY
5.1 Key Business Functions of the Value Chain: The ISO pilot study looks into the three major business functions that are critical to the
value chain of NTUC FairPrice:
1) Procurement
2) Warehousing and distribution
3) Retail
1) Business Function: Procurement
Procurement refers to the management of sourcing and supplier relationship. The core activities involved in this business function are in Figure 4 below:

Status : Final
30 March 2011
Singapore_NTUC_FairPrice - Full report.docx
Page 14 of 107
Figure 4: Procurement Function Activities
The prime responsibility of Procurement is to ensure long lasting and smooth supplier relationship.
2) Business Function: Warehousing and distribution The business function of warehousing and distribution is done through the NTUC
FairPrice‟s two major centralized warehousing and distribution centres which comprise inbound logistics and outbound logistics. The key activities are shown in Figure 5 include:
Figure 5 : Warehousing/Distribution Function Activities
Throughout the process, the warehousing and distribution centres are expected to operate in a cost-efficient manner as the overheads directly affect the bottom line of NTUC FairPrice.
Finding suppliers and concluding
contracts / agreements
• Suppliers need to meet several product-specific quality requirements
• Limited number of suppliers for each product category depending on various market factors
Receiving stock requirement from
Retail stores
• IT enabled
• Stock requirement received from DC also on basis of their inventory management systems- when stocks reach re-order level
Placing Purchase Orders with suppliers
• IT enabled
• Use of SAP to track purchases and invoices and corresponding payments
Ensuring delivery at DC / Retail
• Perishable products such as chilled pork and milk and yoghurt delivered directly at stores
• Other products such as butter and cheese and non-perishables are delivered at DC
Processing non-conformance and customer returns
• Non conformance by suppliers
• Customer Returns at Retail stores
• Use of Goods Returned Note
• Only some of the incidences require Procurement‟s intervention
Receive supplies from suppliers
• 95% of supplies come on pallets in trucks
• About 1800 pallets (about 60000 cartons) per day are received at GLS
• Receiving is done on dedicated area called “receiving bays”
• In case of non-conformance of suppliers to the cold chain management standard,the case is resolved and reported to Procurement
Checking and arranging pallets
in warehouse
• Dedicated staff at DC check the quantity of pallets/ cartons
• Arrange pallets in the warehouse- dedicated space / location for each product category and brand
Inventory management and Storing of stocks
• At FFDC, several quality measures are put in place such as temperature control and humidity control to ensure quality, safety and freshness of food products
• At GLS, the DC is kept are normal room temperature as it deals with non-perishable goods
Prepare and ship orders to retail
stores
• Orders are received through IT system
• Orders are prepared and shipped on every day basis
• Use of trucks and roll cages to delivery orders to individual retail stores
Status : Final
30 March 2011
Singapore_NTUC_FairPrice - Full report.docx
Page 15 of 107
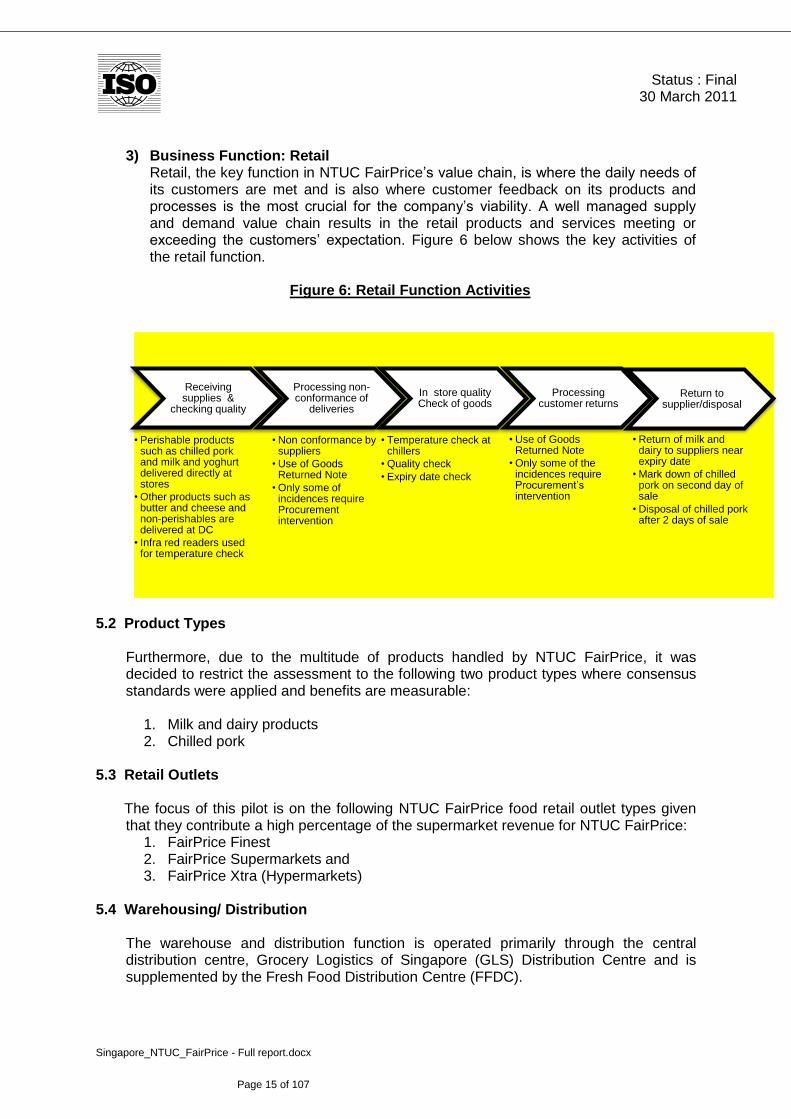
3) Business Function: Retail Retail, the key function in NTUC FairPrice‟s value chain, is where the daily needs of
its customers are met and is also where customer feedback on its products and processes is the most crucial for the company‟s viability. A well managed supply and demand value chain results in the retail products and services meeting or exceeding the customers‟ expectation. Figure 6 below shows the key activities of the retail function.
Figure 6: Retail Function Activities
5.2 Product Types Furthermore, due to the multitude of products handled by NTUC FairPrice, it was
decided to restrict the assessment to the following two product types where consensus standards were applied and benefits are measurable:
1. Milk and dairy products 2. Chilled pork
5.3 Retail Outlets The focus of this pilot is on the following NTUC FairPrice food retail outlet types given
that they contribute a high percentage of the supermarket revenue for NTUC FairPrice: 1. FairPrice Finest 2. FairPrice Supermarkets and 3. FairPrice Xtra (Hypermarkets)
5.4 Warehousing/ Distribution
The warehouse and distribution function is operated primarily through the central
distribution centre, Grocery Logistics of Singapore (GLS) Distribution Centre and is supplemented by the Fresh Food Distribution Centre (FFDC).
Receiving supplies &
checking quality
• Perishable products such as chilled pork and milk and yoghurt delivered directly at stores
• Other products such as butter and cheese and non-perishables are delivered at DC
• Infra red readers used for temperature check
Processing non- conformance of
deliveries
• Non conformance by suppliers
• Use of Goods Returned Note
• Only some of incidences require Procurement intervention
In store quality Check of goods
• Temperature check at chillers
• Quality check
• Expiry date check
Processing customer returns
• Use of Goods Returned Note
• Only some of the incidences require Procurement‟s intervention
Return to supplier/disposal
• Return of milk and dairy to suppliers near expiry date
• Mark down of chilled pork on second day of sale
• Disposal of chilled pork after 2 days of sale

Status : Final
30 March 2011
Singapore_NTUC_FairPrice - Full report.docx
Page 16 of 107
6. STANDARDS USED IN THE COMPANY VALUE CHAIN 6.1 As mentioned in section 3, the company is actively using standards, and is certified to
ISO 9001:2008 and HACCP. However, for the purpose of this study, we will focus on other consensus standards used by NTUC FairPrice in the three key business functions identified earlier.
6.2 The list of standards considered for this pilot study is as follows:
1. Cold Chain Management - Milk and Dairy Products (TR 2 : 2000 followed by SS CP 95:2002)
2. Cold Chain Management - Chilled Pork (TR 20 : 2005 followed by SS CP 552:2009)
3. Standards on Pallet: ISO 6780:2003 and SS 334: 2010 4. Standards on Barcode :
Primary barcodes
o EAN 1311
o ISO/IEC 1639012
: 2007 (or ITF i2of5)
o ITF-1413
Secondary barcodes
o ISO/IEC 15417:2007 14
(or EAN 128 or SS 362 Part 2: 2004)
o EAN 815
o ISO/IEC 16388: 200716 (or Code 39)
o Code 9317
o Codabar 18
o UPC A (XMIT12)19Carton Barcode
6.3 The more technical standards that are key to the company‟s primary purpose are the focus of this pilot.
The ISO 9001 Quality Management System standard, being a management standard,
was not included in this study. The ISO 9001 is used by NTUC FairPrice and is also
11 EAN 13 (European Article Number 13) is a barcode symbology defined by GS1 which encodes 13 characters 12 ISO/IEC 16390: 2007 Information technology – Automated identification and data capture techniques –
Interleaved 2 of 5 symbology specification 13 ITF-14 is GS1‟s implementation of on ITF i2of5 symbology but with 14 digits being used in the encoding 14 ISO/IEC 15417:2007 (or EAN 128 or SS 362 Part 2: 2004) Information technology – Automatic
identification and data capture techniques – Code 128 bar code symbology specification
15 EAN 8 is the short form of EAN-13. This code is only used if the article is too small for an EAN-13 code 16 ISO/IEC 16388: 2007 Information technology -- Automatic identification and data capture techniques --
Code 39 bar code symbology specification 17 Code 93 is a barcode symbology designed in 1982 by Intermec to provide a higher data security enhancement to Code 39. 18 Codabar is a linear barcode symbology developed in 1972 by Pitney Bowes Corp. 19 UPC A (XMIT 12) is Universal Product Code A barcode symbology
Status : Final
30 March 2011
Singapore_NTUC_FairPrice - Full report.docx
Page 17 of 107
recommended to its suppliers of non food products. Direct economic benefits would be difficult to derive given that it would not have direct attributable economic benefits as it is used more to assure customers that it has a proper quality management system in place.
The HACCP standard is required for all food suppliers to NTUC FairPrice and its
possible economic benefits were discussed with the company. However, after detailed discussions with the company, it was decided by all parties concerned that as the main outcome of HACCP for NTUC FairPrice was food safety and the economic benefits are indirect and not easily traceable, the HACCP standard would not be included in this study.
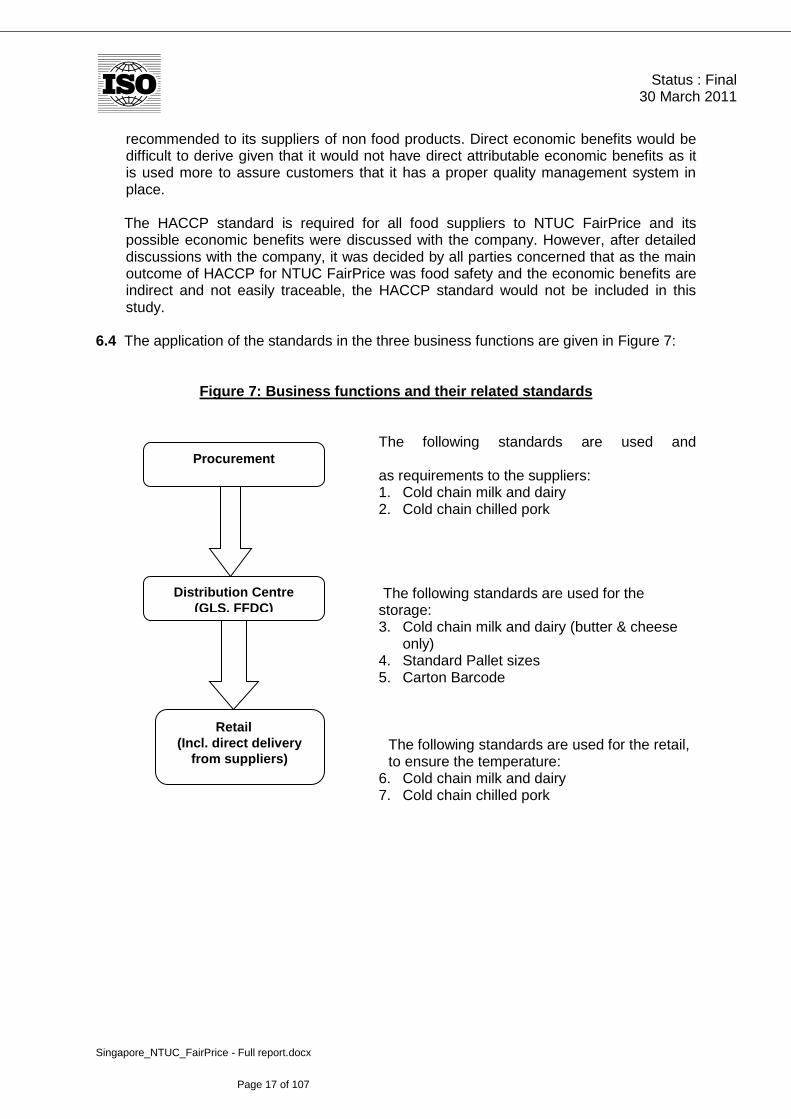
6.4 The application of the standards in the three business functions are given in Figure 7:
Figure 7: Business functions and their related standards
The following standards are used and communicated as requirements to the suppliers:
1. Cold chain milk and dairy 2. Cold chain chilled pork
The following standards are used for the
storage: 3. Cold chain milk and dairy (butter & cheese
only) 4. Standard Pallet sizes 5. Carton Barcode
The following standards are used for the retail, to ensure the temperature:
6. Cold chain milk and dairy 7. Cold chain chilled pork
Procurement
Distribution Centre
(GLS, FFDC)
Retail
(Incl. direct delivery
from suppliers)

Status : Final
30 March 2011
Singapore_NTUC_FairPrice - Full report.docx
Page 18 of 107
6. 5 The table below shows the year of introduction of the consensus standards assessed in
the ISO pilot study:
Table 1
Consensus standards and impacted business functions
Year of implementation
in FairPrice
Impacted Business Functions
Procurement Warehousing/Distribution
Retail
1999 Pallet sizes std
2000 Cold chain management std (Milk & Dairy)
Carton barcode standards Cold chain management std (Milk & Dairy) [for cheese and butter only]
Cold chain management std (Milk & Dairy)
2001
2002
2003
2004
2005 Cold chain management std (Chilled Pork)
Cold chain management std (Chilled Pork)
2006
2007
2008 Automated sortation system based on barcode standard
2009
The barcode standard was used for the identification of the carton in 2000 and in 2008, the functionality of the carton barcode was extended from just identification of the products for storage and retrieval purposes to the sorting of products for delivery purposes.
6.5.1Though the standards assessed, were implemented from 2 to 10 years ago, the stable
workforce has helped in the derivation of the benefits as many have been in the company for more than 10 years and were also actively involved in the implementation of the standards being assessed. The large numbers in efficiency gains indicate that the benefits derived would be significant even though 2009 costs and revenue were used in the evaluation. The benefits of the standards illustrate how much savings there would be today if these standards were not in place. Much iteration through different levels of very patient staff and frequent calibrations were done to ensure that the numbers derived for the different standards were linked

Status : Final
30 March 2011
Singapore_NTUC_FairPrice - Full report.docx
Page 19 of 107
6.6 Key functions and objectives of the standards assessed
1) Cold Chain Standard for Milk and Dairy
The objectives of this standard are to establish and provide benchmarks for the management of temperature profiles along the supply chain for milk and dairy products manufactured under hygienic and sanitary conditions. It also aims to uphold the quality of products and reduce unnecessary wastage. It sets out the guidelines for the proper management of milk and dairy during the production, storage, transportation, manufacturing, distribution, handling and treatment at point of sale.
The implementation of this standard at NTUC FairPrice in 2003 is being done for
products which include chilled milk, yoghurt, butter, cheese, ice creams, etc. The implementation of the Cold Chain management standard for milk and dairy impacts all three major Business Functions in NTUC FairPrice: Procurement, Distribution Centre (FFDC) and Retail.
The FFDC was built in 2002 in preparation for implementing the cold chain
program. Unlike the other milk and dairy products which are delivered directly to the retail stores, butter and cheese products are delivered by suppliers to FFDC which then delivers these products to retail. There are over a 100 varieties of butter and cheese procured by NTUC FairPrice. About 70% are palletized with some are packed loose as the quantities are not sufficient for palletisation. As the number of pallets used is much smaller at the FFDC, the impact of the pallet standard is determined only for the central warehouse and distribution centre, GLS.
2) Cold Chain Standard for Chilled Pork: The objectives of this standard are to establish and provide benchmarks for the
management of temperature profiles along the supply chain for chilled pork to ensure the meat is processed, stored, transported and handled under proper hygienic and sanitary conditions. It aims to set out best practices in cold chain management for chilled pork so as to uphold the safety, quality and wholesomeness of chilled pork, safeguard public health, provide protection for consumers and reduce unnecessary wastage. This was implemented in 2005
The implementation of this standard at NTUC FairPrice was done for chilled pork
packed in vacuum and non-vacuum packs supplied both by the local abattoir and accredited overseas abattoirs.
3) Pallet Standard:
The Pallet Standardization project was undertaken by SPRING Singapore in 1999 in collaboration with the industry-led initiative Efficient Consumer Response (ECR) Singapore. The objective was to improve operational efficiency and to rationalize the 13 sizes of pallets in use by the Fast Moving Consumer Goods (FMCG) industry in Singapore. The ECR Working Group (with NTUC FairPrice as a member) made its recommendation to adopt the 4-way 1000mm x 1200mm pallet as the standard for the FMCG industry.
A significant portion of the benefits came from increased labor productivity and
reduced cost of ownership of the pallets. Standardization has facilitated the

Status : Final
30 March 2011
Singapore_NTUC_FairPrice - Full report.docx
Page 20 of 107
movement and handling of goods, optimized the use of storage and warehouse space, reduced delivery costs and facilitated the automation of warehouse operations. More than 300,000 standard pallets are in use currently by the industry, resulting in savings of S$7.8m for the FMCG industry as a whole.
4) Carton Barcode Standards:
Before the use of carton barcodes, NTUC FairPrice manually recorded the information of products received by the distribution centres and delivered to their retail stores. This method was prone to errors. Carton barcodes were introduced in NTUC FairPrice in the year 2000 to improve the operational efficiency and the accuracy of information and delivery of products from their distribution centres.
NTUC FairPrice does not use one barcode standard but several barcode standards
to accommodate the variety of barcode standards adopted by its different suppliers.
The use of carton barcodes has enabled the distribution centres to: a. Increase the accuracy in the receipt and tracking of its products. Based on a
study at the Ohio University, depending on the type of barcodes, the accuracy and number of misreads of carton barcodes using a barcode scanner can be 1 error in 37 million, compared to 1 error in 300 keystrokes for a well-trained data entry operator.20
b. Move the products from receipt to storage to assembly as well as delivery to the
retail stores in the shortest possible time. It generally takes a few seconds to scan the carton barcodes compared to a few minutes to write down the product codes by hand. This has helped to increase its productivity and throughput significantly.
7. SELECTION OF OPERATIONAL INDICATORS TO MEASURE THE IMPACTS OF
STANDARDS
The objective of the study is to quantify the economic impact of standards. In order to do so, we apply a set of operational indicators to measure the impact before and after the introduction of the standards. These operational indicators have been carefully chosen on the basis of a series of interviews with FairPrice. Some of these indicators have originally not be designed to measure the economic impact of standards, but most have been used to measure the company‟s business performance in terms of non-economic indicators such as customer satisfaction, growth, operational excellence, etc.. In the discussions with the company, a number of the operational indicators were developed that were specific to measuring the impact of standards. The operational indicators derived and confirmed by the company leaders are also aligned to the company‟s KPIs.
20 ID Automation Barcode FAQ & Tutorial. http://www.idautomation.com/barcoding4beginners.html

Status : Final
30 March 2011
Singapore_NTUC_FairPrice - Full report.docx
Page 21 of 107
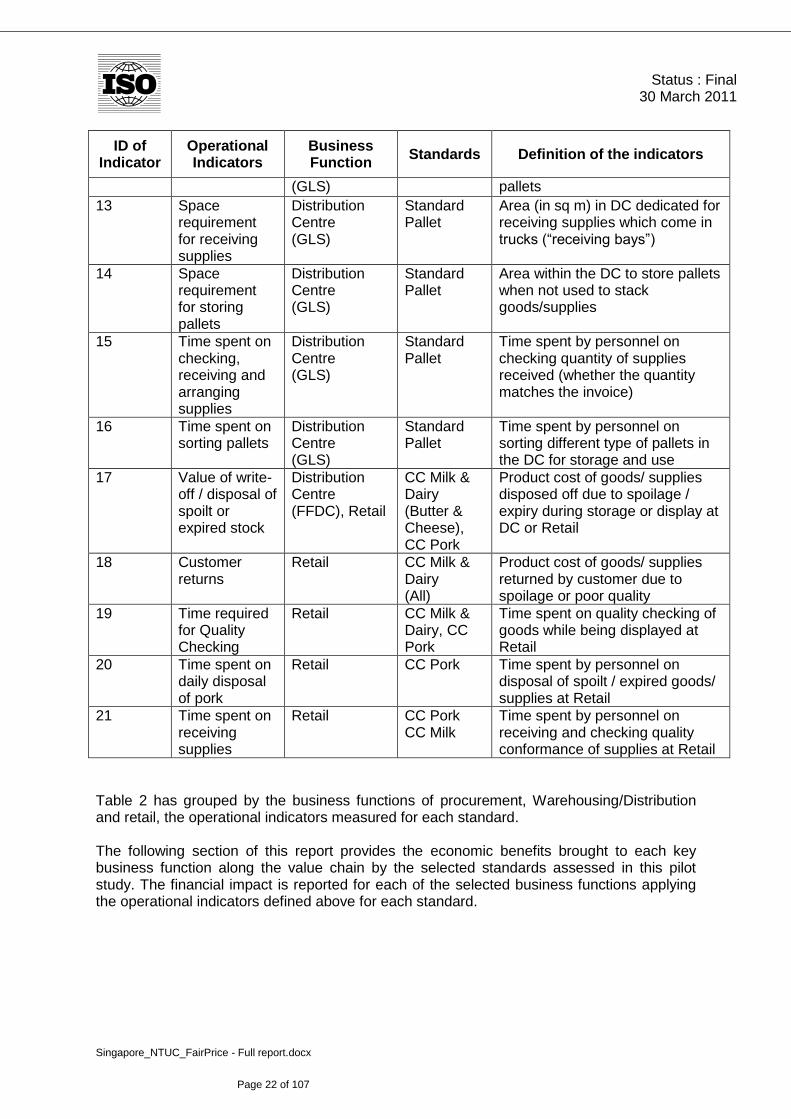
Table 2
Operational Indicators
ID of Indicator
Operational Indicators
Business Function
Standards Definition of the indicators
1 Time spent on communication with supplier
Procurement CC Milk & Dairy, CC Pork
Time spent on communicating product requirements - AVA requirements, standard compliance, package size, quality, etc while placing orders and general matters.
2 Contracting activities with suppliers
Procurement CC Pork Long term contracts are concluded with selected suppliers on basis of their quality and standards in factory / abattoir
3 Number of customer return cases
Procurement, Distribution Centre (FFDC), Retail
CC Milk & Dairy, CC Pork
Customer returns cases from retail store occur due to spoilt product after purchase
4 Number of non-conformance cases
Procurement, Distribution Centre (FFDC), Retail
CC Milk & Dairy, CC Pork
Cases of product supplied by suppliers not meeting quality / standard requirement (at receiving point at Distribution Centre (DC) and retail stores)
5 Space savings Distribution Centre (GLS)
Barcode Warehouse space savings with implementation of automated sortation system.
6 Order fulfillment
Distribution Centre (GLS)
Barcode Speed of fulfilling orders of retail stores, thereby freeing up space at DC
7 Reduction in amount of handling damage cases
Distribution Centre (GLS)
Barcode Costs associated with handling damages during goods movement in the DC
8 Reduction in amount of Stock-take
Distribution Centre (GLS)
Barcode Time spent on checking and tallying physical inventory in DC with book inventory
9 Reduction in amount of assets
Distribution Centre (GLS)
Barcode Machinery and equipments used in managing logistic operations at DC
10 Throughput rate
Distribution Centre (GLS)
Barcode Throughput rate (speed) in receiving, picking and packing of goods/supplies
11 Better information transfer about pallets
Distribution Centre (GLS)
Standard Pallet
Internal communication within employees on configuration and quantity of pallets and cartons
12 Expenditure on pallets
Distribution Centre
Standard Pallet
Annual cost on pallets- paid to external suppliers / leasors of
Status : Final
30 March 2011
Singapore_NTUC_FairPrice - Full report.docx
Page 22 of 107
ID of Indicator
Operational Indicators
Business Function
Standards Definition of the indicators
(GLS) pallets
13 Space requirement for receiving supplies
Distribution Centre (GLS)
Standard Pallet
Area (in sq m) in DC dedicated for receiving supplies which come in trucks (“receiving bays”)
14 Space requirement for storing pallets
Distribution Centre (GLS)
Standard Pallet
Area within the DC to store pallets when not used to stack goods/supplies
15 Time spent on checking, receiving and arranging supplies
Distribution Centre (GLS)
Standard Pallet
Time spent by personnel on checking quantity of supplies received (whether the quantity matches the invoice)
16 Time spent on sorting pallets
Distribution Centre (GLS)
Standard Pallet
Time spent by personnel on sorting different type of pallets in the DC for storage and use
17 Value of write-off / disposal of spoilt or expired stock
Distribution Centre (FFDC), Retail
CC Milk & Dairy (Butter & Cheese), CC Pork
Product cost of goods/ supplies disposed off due to spoilage / expiry during storage or display at DC or Retail
18 Customer returns
Retail CC Milk & Dairy (All)
Product cost of goods/ supplies returned by customer due to spoilage or poor quality
19 Time required for Quality Checking
Retail CC Milk & Dairy, CC Pork
Time spent on quality checking of goods while being displayed at Retail
20 Time spent on daily disposal of pork
Retail CC Pork Time spent by personnel on disposal of spoilt / expired goods/ supplies at Retail
21 Time spent on receiving supplies
Retail CC Pork CC Milk
Time spent by personnel on receiving and checking quality conformance of supplies at Retail
Table 2 has grouped by the business functions of procurement, Warehousing/Distribution and retail, the operational indicators measured for each standard. The following section of this report provides the economic benefits brought to each key business function along the value chain by the selected standards assessed in this pilot study. The financial impact is reported for each of the selected business functions applying the operational indicators defined above for each standard.

Status : Final
30 March 2011
Singapore_NTUC_FairPrice - Full report.docx
Page 23 of 107
7.1 Impact on Procurement Business Function
7.1.1 FairPrice‟s key performance indicators (KPIs) for the milk and dairy products as well
as for chilled pork are to increase sales by improving efficiency, customer satisfaction and ensuring quality and safety. The operational indicators used for each standard fall within one or more of these KPIs.
7.1.2 Table 3 below shows the impact on procurement of the implementation of the cold
chain standards for milk and dairy and chilled pork.
Table 3
Procurement Function Benefits
Implementation of Cold Chain Management Standards for Milk & Dairy and Chilled Pork
(Total Benefits : S$26,548)
ID
Selected Business Function
(BF)
Standard
Operational Indicator
(to measure
the impact of
standard)
Financial Impact of
Operational Indicator
Annual Efficiency Improvement
% Man-hours
1 Procurement a)CC Milk & Dairy
b)CC for
Chilled Pork
(ID 1) : Time spent on comms with supplier
Reduction in man-hours for comms with supplier
a)50% b)50%
a)211 b)211
2 Procurement CC Chilled Pork
(ID2): Contracting activities with suppliers
Reduction in man-hours for contracting with suppliers
92% 576
3 Procurement a)CC Milk & Dairy
b) CC
Chilled Pork
(ID3): Number of customer return cases
Reduction in man-hours for handling customer return cases
75% a)75 b)15
4 Procurement a)CC Milk & Dairy
b)CC
Chilled Pork
(ID4): Number of non-conformance cases
Reduction in man-hours for handling non-conformance cases by suppliers
a)75% b)85%
a)45 b)21

Status : Final
30 March 2011
Singapore_NTUC_FairPrice - Full report.docx
Page 24 of 107
7.1.2 NTUC FairPrice procures products only from those suppliers who meet the cold chain
management for chilled pork and milk and dairy standards‟ requirements. As this standard has the greatest positive effect on businesses revenue and, processes, it has helped NTUC FairPrice as well as its suppliers to gain a competitive advantage by offering quality products over an extended period of time to the increasingly demanding end customer.
7.1.3 Introduction of the standard has enhanced NTUC FairPrice‟s relationship with its
suppliers and has reduced procurement overheads between the 2 parties. Larger quantities of chilled pork can be procured for sale, resulting in fewer deliveries as the risk of wastage is much lesser. There is also increased mutual confidence between FairPrice and its selected pool of supplies in terms of quality and reliability. For milk and dairy, the extension of the shelf life will reduce the number of deliveries and returns thus reducing manpower costs.
7.1.4. The Cold Chain standard has acted as an enabler to the centralization of procurement
activities for milk and dairy as well as chilled pork, thus reducing the duplication of procurement functions at each retail store. With a standard set of requirements, there are fewer disputes and less numbers of persons needed to handle the differing requirements. .
7.1.5 Communication time was halved with the introduction of each of the cold chain
standards for milk and dairy and chilled pork. This allowed for the redeployment of manpower for the handling of other products, the expansion of the number of product types for milk and dairy and the support of procurement for an expanding number of NTUC FairPrice, NTUC Finest and NTUC Xtra without the need for more manpower or overheads for procurement since the standards were introduced in 2003 for milk and dairy and 2005 for chilled pork.
7.1.6 The largest savings came from the time taken for the contracting activities for chilled
pork. There was minimal effect on the time taken for the contracting activities for milk and dairy but for chilled pork there was a 92% reduction in the time taken for the contracting of chilled pork as suppliers were met only once a year instead of the usual weekly meetings, resulting in a savings of 576 hours each year.
7.1.7 There was also a 75% reduction in the handling of non conformance cases for both
CC milk and dairy and chilled pork from the supplier with higher savings from milk and dairy due to the higher number of non conformance cases before the introduction of the standard.
7.1.8 A similar 75% reduction was seen in the number of customer return cases for both
milk and dairy and also chilled pork. The savings for this operational indicator for milk and dairy is higher than for chilled pork as the number of non conformance and customer returns were higher for milk and dairy compared to chilled pork, This is most probably due to the greater difficulty in managing the many different temperatures for the large variety of milk and dairy products as compared to chilled pork which is just one product.
7.2 Impact on Warehousing/Distribution Business Function
7.2.1 FairPrice owns two major central warerhousing/distribution centres, namely the Grocery Logistics of Singapore (GLS) and the Fresh Food Distribution Centre
Status : Final
30 March 2011
Singapore_NTUC_FairPrice - Full report.docx
Page 25 of 107
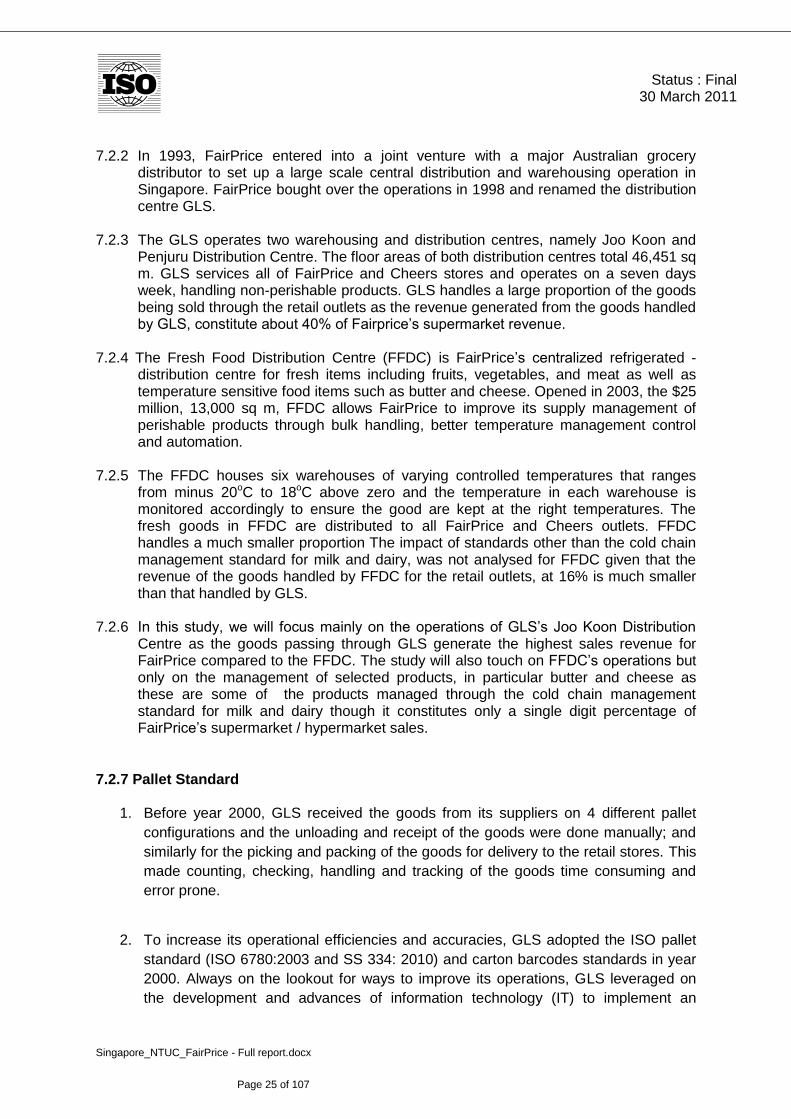
7.2.2 In 1993, FairPrice entered into a joint venture with a major Australian grocery
distributor to set up a large scale central distribution and warehousing operation in Singapore. FairPrice bought over the operations in 1998 and renamed the distribution centre GLS.
7.2.3 The GLS operates two warehousing and distribution centres, namely Joo Koon and
Penjuru Distribution Centre. The floor areas of both distribution centres total 46,451 sq m. GLS services all of FairPrice and Cheers stores and operates on a seven days week, handling non-perishable products. GLS handles a large proportion of the goods being sold through the retail outlets as the revenue generated from the goods handled by GLS, constitute about 40% of Fairprice‟s supermarket revenue.
7.2.4 The Fresh Food Distribution Centre (FFDC) is FairPrice‟s centralized refrigerated -
distribution centre for fresh items including fruits, vegetables, and meat as well as temperature sensitive food items such as butter and cheese. Opened in 2003, the $25 million, 13,000 sq m, FFDC allows FairPrice to improve its supply management of perishable products through bulk handling, better temperature management control and automation.
7.2.5 The FFDC houses six warehouses of varying controlled temperatures that ranges
from minus 20oC to 18oC above zero and the temperature in each warehouse is monitored accordingly to ensure the good are kept at the right temperatures. The fresh goods in FFDC are distributed to all FairPrice and Cheers outlets. FFDC handles a much smaller proportion The impact of standards other than the cold chain management standard for milk and dairy, was not analysed for FFDC given that the revenue of the goods handled by FFDC for the retail outlets, at 16% is much smaller than that handled by GLS.
7.2.6 In this study, we will focus mainly on the operations of GLS‟s Joo Koon Distribution
Centre as the goods passing through GLS generate the highest sales revenue for FairPrice compared to the FFDC. The study will also touch on FFDC‟s operations but only on the management of selected products, in particular butter and cheese as these are some of the products managed through the cold chain management standard for milk and dairy though it constitutes only a single digit percentage of FairPrice‟s supermarket / hypermarket sales.
7.2.7 Pallet Standard
1. Before year 2000, GLS received the goods from its suppliers on 4 different pallet
configurations and the unloading and receipt of the goods were done manually; and
similarly for the picking and packing of the goods for delivery to the retail stores. This
made counting, checking, handling and tracking of the goods time consuming and
error prone.
2. To increase its operational efficiencies and accuracies, GLS adopted the ISO pallet
standard (ISO 6780:2003 and SS 334: 2010) and carton barcodes standards in year
2000. Always on the lookout for ways to improve its operations, GLS leveraged on
the development and advances of information technology (IT) to implement an

Status : Final
30 March 2011
Singapore_NTUC_FairPrice - Full report.docx
Page 26 of 107
automated sortation system based on the carton barcode in 2008. This product
handling system enabled GLS to improve its cost efficiencies and better control their
inventory and manage their stockholding.
3. GLS‟s main key performance indicators are:
a) Increase productivity of staff b) Increase throughput c) Reduce lead-time for order fulfillment d) Increase accuracy
4. FairPrice was one of the early adopters of the pallet standard and made a decision to
implement it at its central warehouse and distribution centre. It started implementing
the standard as a result of its participation in a pallet standardization project which it
co-led with SPRING Singapore, under the Efficient Consumer Response Singapore.
This has resulted in increased operational efficiency at GLS and significantly
benefited the bottom line of FairPrice
5. Before the standardization, GLS received supplies from suppliers on 5 different pallet
configurations:
1.2m x 1.0m - 2 way entry
1.2m x 1.2m - 2 way entry
1.2m x 1.0m - 4 way entry
1.1m x 1.1m - 2 way entry
1.1m x 1.1m - 4 way entry
6. Further, the different carton configurations made counting, checking and handling of
goods time consuming and error prone. GLS also had to maintain their own pallets
and had to spend time sorting the different size pallets to return to the different
suppliers.
7. The standardization of pallet to the 4-way 1000mm x 1200mm pallet required the
cooperation of suppliers. Since 1998, 95% of GLS‟s local suppliers have
implemented the standard by sending shipments on the standardized ECR Pallets
and also standardizing their carton packages. Besides direct tangible benefits to GLS,
the standard acted as an enabler of other benefits. The standard enabled GLS to
benefit from switching from the ownership model to the current leasing model; the
cost of ownership of pallet has thus declined significantly. See Figure 8 below for
more information.

Status : Final
30 March 2011
Singapore_NTUC_FairPrice - Full report.docx
Page 27 of 107
Figure 8 : Delivery Flow of Palletised Goods
Before Standardization After Standardization - 5 different configurations - Just 1 standardised pallet - Higher manpower requirement - Lower manpower requirement - More space requirement - Lower space requirement - Higher manpower requirement - Lower manpower requirement - Different number of cartons - Standard number of cartons on different pallets sizes on one standardized pallet (difficulty in checking) (easy checking) - Ownership model - Leasing model - Maintenance and Repair cost - Lower leasing cost - Need to store unused pallets - No need to store pallets Impact of Pallets on the Distribution Centre:
8. Following the „time series analysis‟ methodology of calculating economic benefits of
the standard, following were the operational indicators and the corresponding
benefits:
Time spent on checking, receiving and arranging supplies: With just one standardized configuration of pallets, unloading of supplies from trucks is less time consuming. Also as the cartons of suppliers are standardized, counting, checking and arranging of supplies in the warehouse require lesser manpower. An 80% reduction in manpower needs for these purposes was achieved.
Space requirement for receiving supplies: Supplies arrive at the Distribution Centre in trucks of standardized capacity and as the time required for unloading and racking the pallets into the warehouse decreases by over 80%, the space required to receive multiple shipments at the same time also decreases by 80%.
Time spent on sorting pallets: Sorting the pallets in the warehouse alone requires dedicated manpower along with use of the forklift. With a standardized pallet, less time is spent on counting the pallets and sorting them since there there is no need to sort into the different configurations.
Receiving supplies
that arrive on pallets
Checking and
arranging supplies
Pallet storing and
movement

Status : Final
30 March 2011
Singapore_NTUC_FairPrice - Full report.docx
Page 28 of 107
Expenditure on pallets: Pallet standardization has played the role of an enabler to switch from ownership model to the leasing model. GLS saves 31% on the purchase, storage and repair cost of pallets while paying only the pallet rental to the pallet leasing company. Besides, the system helps in meeting fluctuation in demand better, especially during seasonal festive periods resulting in space savings annually equivalent to SGD18,194 per year.
Space requirement for storing pallets: Without the standard, GLS would have needed to purchase and store additional number of pallets required only during the seasonal period. The space thus saved by switching to the leasing model is now better utilized to store product inventory.
Better information transfer about pallets: On an estimation basis, a small percentage of time is saved in communication among the staff of GLS and retailers.
Impact on Outbound Logistics: Orders of individual retail stores are fulfilled at the DC and dispatched on standardized pallets and standardized roll cages (1000mm x 600mm). Hence, even this part of the outbound supply chain under the Distribution Centre benefits from pallet standardization. However, the benefits of this part of the supply chain are included in the impact of carton barcode standards and calculating the benefits under standard pallet would mean duplication.
7.2.8 Carton Barcodes
1. GLS has adopted several types of barcode standards in its operations due to the
different barcodes used by its suppliers. The primary barcode standards used in
GLS are:
EAN 1321 ISO/IEC 16390: 2007 (or ITF i2of5) Information technology – Automatic
identification and data capture techniques – Interleaved 2 of 5 bar code symbology specification
ITF-1422
Other barcode standards that are also used in GLS ISO/IEC 15417:2007 (or EAN 128 or SS 362 Part 2: 2004) Information
technology – Automatic identification and data capture techniques – Code 128 bar code symbology specification
EAN 8 ISO/IEC 16388: 2007 (or Code 39) Information technology – Automatic
identification and data capture techniques – Code 39 bar code symbology specification
Code 9323
21 EAN 13 (European Article Number 13) is a barcode symbology defined by GS1 which encodes 13 characters. 22 ITF-14 is GS1‟s implementation of on ITF i2of5 symbology but with 14 digits being used in the encoding 23 Code 93 is a barcode symbology designed in 1982 by Intermec to provide a higher data security enhancement to Code 39.
Status : Final
30 March 2011
Singapore_NTUC_FairPrice - Full report.docx
Page 29 of 107
Codabar24 UPC A (XMIT12)25
2. With the growing number of retail stores under NTUC FairPrice and the need to
expand its operations to meet the demands of the retail function, GLS
implemented in 2008, an innovative high-speed Automated Sortation System
based on the characteristics of different carton barcodes.
3. The Automated Sortation System which together with the building, costs about
$41m and is the first of its kind for the retail industry in ASEAN. The system built
upon the initial benefits of carton identification through carton barcode standards,
to help GLS automate some of its processes such as the consolidation of orders
by the individual retail stores into bulk batches, the conducting of the carton
picking operations in a totally paperless manner and the automation of the sorting
and tracking of product orders of each retail store.
4. Figure 8 is a pictorial overview of the business operations in GLS where carton
barcode standards are being used.
24 Codabar is a linear barcode symbology developed in 1972 by Pitney Bowes Corp. 25 UPC A (XMIT 12) is Universal Product Code A barcode symbology
Status : Final
30 March 2011
Singapore_NTUC_FairPrice - Full report.docx
Page 30 of 107
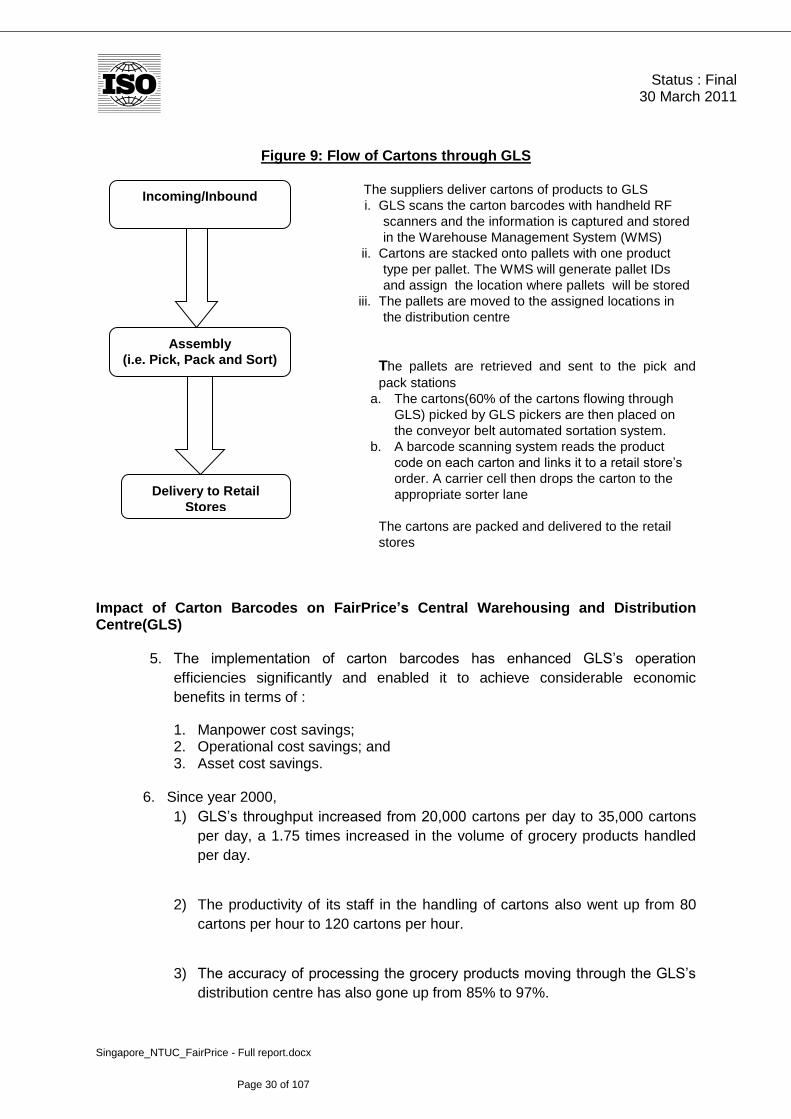
Figure 9: Flow of Cartons through GLS
The suppliers deliver cartons of products to GLS
i. GLS scans the carton barcodes with handheld RF
scanners and the information is captured and stored
in the Warehouse Management System (WMS)
ii. Cartons are stacked onto pallets with one product
type per pallet. The WMS will generate pallet IDs
and assign the location where pallets will be stored
iii. The pallets are moved to the assigned locations in
the distribution centre
The pallets are retrieved and sent to the pick and
pack stations
a. The cartons(60% of the cartons flowing through
GLS) picked by GLS pickers are then placed on
the conveyor belt automated sortation system.
b. A barcode scanning system reads the product
code on each carton and links it to a retail store‟s
order. A carrier cell then drops the carton to the
appropriate sorter lane
The cartons are packed and delivered to the retail
stores
Impact of Carton Barcodes on FairPrice’s Central Warehousing and Distribution Centre(GLS)
5. The implementation of carton barcodes has enhanced GLS‟s operation
efficiencies significantly and enabled it to achieve considerable economic
benefits in terms of :
1. Manpower cost savings; 2. Operational cost savings; and 3. Asset cost savings.
6. Since year 2000,
1) GLS‟s throughput increased from 20,000 cartons per day to 35,000 cartons
per day, a 1.75 times increased in the volume of grocery products handled
per day.
2) The productivity of its staff in the handling of cartons also went up from 80
cartons per hour to 120 cartons per hour.
3) The accuracy of processing the grocery products moving through the GLS‟s
distribution centre has also gone up from 85% to 97%.
Incoming/Inbound
Assembly
(i.e. Pick, Pack and Sort)
Delivery to Retail
Stores
Status : Final
30 March 2011
Singapore_NTUC_FairPrice - Full report.docx
Page 31 of 107
4) The number of stock-takes per year has decreased by from 3 to 4 times per
year to once every year due to the increased accuracies in the receipt and
tracking of grocery products moving through the distribution centre. This has
resulted in huge manpower savings for GLS in terms of man hours(4400
man hours) and manpower cost saved as every stock-taking exercise
involves all GLS staff and a down time of 1 working day.
7. The introduction of the Automated Sortation System later in 2008 further
enhanced GLS‟s operations by:
1) Increasing staff productivity to 300 cartons per hour whilst reducing the
number of man hours required to manually pick and pack the grocery
products for the stores and enabling others to be deployed higher value-
added tasks.
2) Before the Automation Sortation System was implemented, the order picking
process was labour intensive where pickers have to manually pick and pack
the cartons of products in accordance to the individual retail store orders.
This manual mode was prone to error and pilferage.
3) The use of the Automated Sortation System has decreased the error rate of
processing the grocery products in GLS to less than 0.3% over the past 2
years. The number of damage cases has also decreased from 100 incidents
per week to 20 incidents per week resulting in 87% reduction in the damage
rate per week. This invariably translates to the administrative and manpower
cost savings in handling the damage incidents
4) Increasing its throughput to 60,000 cartons per day, a 3 fold increase
compared to the time before carton barcodes were implemented.
5) Reducing the lead-time for order fulfilment from 24 hours to 15 hours though
the number of stores has increased from 65 to 98.
6) Other benefits that resulted from the use of carton barcodes through the
introduction of the Automated Sortation System are:
a. Saving of space in the distribution centre. Without the Automation
Sortation System, GLS would need an additional 5,070 sq m of space in
the distribution centre to store and process the grocery products needed
to meet the current demands (i.e. orders and order fulfillment lead time)
of its retail stores.

Status : Final
30 March 2011
Singapore_NTUC_FairPrice - Full report.docx
Page 32 of 107
b. Reduction of assets owned. The number of pallet end double (PED)26
and reach trucks owned by GLS has been reduced by 58% and 35%
respectively due to the improved operation efficiencies in storing,
tracking and retrieval of the cartons for pick, sort and pack.
7) GLS adopted a 2 phase approach in their implementations of carton
barcodes. The first was the use of carton barcodes with handheld barcode
scanners and the second phase was the introduction of the Automated
Sortation System developed to exploit the characteristics and benefits of
carton barcodes. This phase approach enabled to GLS to leverage on the
developments and innovative use of information technology (IT) to enhance
the operational and cost efficiencies of GLS to support NTUC FairPrice‟s
changing business needs.
7.2.9 The use of these standards has over the years enhanced FairPrice‟s operations significantly:
1. Increase in Staff Productivity
Before the use of standardized pallets and carton barcodes, much of GLS‟s operations were handed manually, such as the manual transfer of goods from the delivery truck to the distribution centre and the manual receipt, checking and tracking of the goods using paper and pens. The standardized pallets and carton barcodes have helped GLS to streamline its operations and boost the productivity of its staff. For example, GLS now unloads the goods from the delivery truck in a shorter time and with fewer staff, the accuracy of the receipt and tracking of deliveries, has improved from 85% to 99.7% and staff‟s productivity in the picking, sorting and packing the goods for delivery to the retail stores have tripled with the automation of the sorting process for each delivery.
2. Increased Throughput
GLS‟s throughput in the checking and receipt of the goods increased 4 fold with the use of standardised pallets whilst the assembly of the goods for the retail stores increased 3 fold with the use of the automated sortation system based on the carton barcode standard.
3. Reduction in Operational Costs
GLS has achieved impressive asset and operational cost savings through the
reduction of assets owned e.g. pallets(31%), pallet end double (PED)(58%) and
reach trucks(35%), optimization of warehouse space(18%) and a reduction in
51,286 man hours for the inbound and outbound activities.
The use of standardized pallets has enabled GLS to switch from owning the pallets to leasing them. This meant cost savings in owning and maintaining the
26 PED allows single or double pallet loads to be moved safely and quickly.
Status : Final
30 March 2011
Singapore_NTUC_FairPrice - Full report.docx
Page 33 of 107
pallets as well as setting aside warehouse space to store the pallets. An added benefit of this mode of operation is that GLS is now able to manage its need for pallets dynamically, increasing and reducing the number of pallets used in the distribution centre based on the business needs of GLS such as during Singapore‟s festive needs.
The introduction of carton barcodes has moved GLS from manual handling of the
goods to the automated recording, tracking, warehousing and assembly of the goods. In GLS‟s busy operation, this means significant time and manpower cost savings. The information capture electronically from the carton barcodes are stored in GLS‟s Warehouse Management System (WMS) which is integrated with FairPrice‟s procurement system. The interface of the two systems has enhanced the information transfer between the inbound and assembly activities in GLS as well as the FairPrice‟s procurement functions though this does not appear to be quantifiable. The efficiency of order fulfilment on a per order basis has increased by 38% despite the increase in the number of stores from 65 to 98 with the reduction from 24 hours to 15 hours per order.
7.2.10 Fresh Food Distribution Centre (FFDC)
1. FairPrice is committed to providing high quality food, especially temperature-
sensitive food products for its customers. For this reason, FairPrice implemented
an integrated cold chain management system standard for milk and dairy
products in 2003 for the storage, distribution, transport and retail of its fresh food
products at the appropriate temperature to ensure their freshness when
purchased by its customers. It went on to request that all its suppliers adhere to
the same standard.
2. At the FFDC, its key performance indicators for the cheeses and butter handled
by the FFDC include:
Low non-conformance by suppliers
Lower write-offs
Operational efficiency
Quality control
The operational indicators used to assess the impact of the cold chain management standard for these products are in line with the KPIs expected at the FFDC.
3. FairPrice‟s implementation of the cold chain management standard and its
mandate for all its suppliers to implement this same standard, has impacted its
business operations positively, enabling it to better manage their fresh food
products, ensuring their freshness and extending their shelf life which in turn led
to less spoilage and savings in product write offs. The number of non
conformance cases for the cheeses and butter delivered by their suppliers has
reduced by 88% and the number of customer return cases has reduced by 92%
resulting in savings of 129 man hours per year.
Status : Final
30 March 2011
Singapore_NTUC_FairPrice - Full report.docx
Page 34 of 107
4. Impact of Cold Chain Management Standard on FFDC
1. For this section, we shall focus on use of Cold Chain Management standard
for Milk and Dairy products in the management of butter and cheeses in
FFDC.
1) With the Cold Chain Management standard for Milk and Diary standard,
there has been a major reduction in the discussions of different
temperatures and the consequences with the suppliers. Temperature of
products is checked and temperature data loggers are placed in the
supplier trucks.
2) Time savings in dealing with non-compliance issues decreased from 1
hour per case to 45min per case and a total reduction of 60 cases after
the standard was implemented. On the other hand, the return cases from
retail have decreased from 48 cases to 4 cases with the better
temperature control through the cold chain management standard.
3) The Cold Chain Management standard defines clearly the requirements
for managing milk and dairy products and this information are easily
available to all parties in the supply chain thereby contributing to the
reduction in operational costs. There is a 5 figure savings in the product
write off cost.

Status : Final
30 March 2011
Singapore_NTUC_FairPrice - Full report.docx
Page 35 of 107
Table 4
Warehousing/Distribution Function Benefits
Implementation of Carton Barcodes, Standard Pallet and Cold Chain Management Standard for Milk and Dairy
(Total Benefits : S$3,809,763)
ID
Selected Business Function
(BF)
Standard
Operational Indicator
(to measure the impact
of standard)
Financial Impact of
Operational Indicator
Annual Efficiency Improvement
% Improvements
15 Distribution Centre (GLS)
Standard Pallet
Time spent on checking, receiving and arranging supplies
Reduction in personnel costs by way of reduced man-hour requirement
77% reduction in man hours
42,240 man-hours saved
13 Distribution Centre (GLS)
Standard Pallet
Space requirement for receiving supplies
Reduction in annual Rent & Leasing Expenses
77% reduction in number of receiving bays
NA
16 Distribution Centre (GLS)
Standard Pallet
Time spent on sorting pallets
Reduction in personnel costs by way of reduced head-count
50% decrease in man power
4,224 man hours saved
12 Distribution Centre (GLS)
Standard Pallet
Expenditure on pallets
Reduction in yearly spend on pallets by adopting renting model instead of ownership model
31% savings in pallet costs
Savings on the purchase, maintenance and repair of pallets
14 Distribution Centre (GLS)
Standard Pallet
Space requirement for storing pallets
Reduction in annual Rent & Leasing Expenses
NA Space saved with the switch to pallet leasing model
11 Distribution Centre (GLS)
Standard Pallet
Better information transfer about pallets
Reduction in personnel costs by way of reduced man hour requirement
50% 422 man hours saved

Status : Final
30 March 2011
Singapore_NTUC_FairPrice - Full report.docx
Page 36 of 107
ID
Selected Business Function
(BF)
Standard
Operational Indicator
(to measure the impact
of standard)
Financial Impact of
Operational Indicator
Annual Efficiency Improvement
% Improvements
4 Distribution Centre (FFDC)
CC Milk & Dairy (Butter & Cheese)
Number of non-conformance cases
Reduction in man-hours for handling non-conformance cases by suppliers
88% 63
3 Distribution Centre (FFDC)
CC Milk & Dairy (Butter & Cheese)
Number of customer return cases
Reduction in man-hours for handling customer return cases
92% 66
17 Distribution Centre (FFDC)
CC Milk & Dairy (Butter & Cheese)
Value of write-off / disposal of spoilt or expired stock
Reduction in product write-offs during storage
NA Reduced number of write-offs
10 Distribution Centre (GLS)
Carton Barcode Standards
Throughput rate
Throughput
rate in
receiving,
picking.
Sorting and
packing of
goods/
supplies
200% increase in throughput
Increase in accuracy
8 Distribution Centre (GLS)
Carton Barcode Standards
No. of stock take
Reduction in time and personnel costs
83% reduction in time taken
4,400 man hours saved
6 Distribution Centre (GLS)
Carton Barcode Standards
Order fulfillment lead time
Lead time reduced from 24 hours per store for 40 stores to average 15 hours per store for 98 stores
38% reduction in lead time
Reduction in order fulfillment to 15 hours
5 Distribution Centre (GLS)
Carton Barcode Standards
Cost in
warehouse
space
Saving of 5,070 sq m warehouse space
18% space savings
Space saved with automated sortation system

Status : Final
30 March 2011
Singapore_NTUC_FairPrice - Full report.docx
Page 37 of 107
ID
Selected Business Function
(BF)
Standard
Operational Indicator
(to measure the impact
of standard)
Financial Impact of
Operational Indicator
Annual Efficiency Improvement
% Improvements
9 Distribution Centre (GLS)
Carton Barcode Standards
No. assets owned
Asset savings on PEDs and Reach Trucks
Reduction of 58% of PEDs owned and 35% of Reach Trucks owned
Reductions in capital costs
7 Distribution Centre (GLS)
Carton Barcode Standards
No. of damage cases
Reduction in damage handling costs
87% reduction of damage rate
Reduction of 2 headcounts to handle damage cases
7.3 Impact on Retail Business Function
7.3.1 It is important to understand the impact of temperature on the supply chain of perishable products such as milk and dairy and chilled pork. While butter and cheese are stocked and delivered to retail stores via the FFDC, all other milk and dairy products as well as chilled pork are sent directly to retail stores by suppliers.
Figure 10: Supply Chain for Milk and Dairy
Supply Chain for Butter and Cheese: Supply Chain for all other milk and dairy products: 7.3.2 In the case of chilled pork, the pork is delivered by six selected suppliers to over
eighty retail stores directly, adhering to the cold chain standard throughout the supply chain and ensuring the freshness of pork.
Supplier Retail Stores
Supplier Fresh and Frozen Food Distribution Center (FFDC)
Retail Stores

Status : Final
30 March 2011
Singapore_NTUC_FairPrice - Full report.docx
Page 38 of 107
7.3.3 There are significant differences between the impact of the Cold Chain management standard for Milk & Dairy products and that for Chilled Pork. The differences are mainly in the benefits from the time spent on receiving supplies, product cost of write-offs and time spent on disposal of stock nearing the expiry date. In the case of Milk, the cartons which are nearing expiry are returned to the suppliers, while this is not the case in Chilled Pork where the loss is borne by FairPrice itself.
7.3.4 The operational indicators, financial impact of the operational indicators and annual
efficiency improvement are given in the table below for the retail business function.
Table 5
Retail Function Benefits
Implementation of Cold Chain Management Standards for Milk and Dairy and Chilled Pork
(Total Benefits: $725,156)
ID
Business Function
Standard
Operational Indicator (to measure the impact of standard)
Financial Impact of Operational Indicator
Annual Efficiency
improvement
% Man-hours
3 Retail a)CC Milk & Dairy (All)
b)CC Pork
Number of customer return cases
Reduction in man-hours for handling customer return cases
67% 67 %
33 7
4 Retail a)CC Milk & Dairy (Except butter & cheese) b)CC Pork
Number of non-conformance cases
Reduction in man-hours for handling non-conformance cases by suppliers
99% 78%
39 39

Status : Final
30 March 2011
Singapore_NTUC_FairPrice - Full report.docx
Page 39 of 107
ID
Business Function
Standard
Operational Indicator (to measure the impact of standard)
Financial Impact of Operational Indicator
Annual Efficiency
improvement
% Man-hours
18 Retail CC Milk & Dairy (All)
Customer returns
Reduction in cost of goods returned by customer
50%
NA
19 Retail a)CC Milk & Dairy (All) b)CC
Pork
Time required for Quality Checking
Reduction in man-hours for checking quality of products at store
33% 33%
33 28
17 Retail CC Pork Value of write-off / disposal of spoilt or expired stock
Reduction in value of write-off / disposal of pork
33% NA
20 Retail CC Pork Time spent on daily disposal of pork
Reduction in time required for disposing expired/spoilt pork
50% 15,065
21 Retail a)CC Milk and Dairy
b)CC
Pork
Time spent on receiving supplies
Reduction in personnel costs by way of reduced man-hour requirement
50% 50%
8,894 6,232
The total estimated benefits that the two cold chain management standards for milk and dairy and for chilled pork bring to the retail business function per year amounted to $725,156. 7.3.5 The number of stores selling milk and dairy products increased from 65 stores in Year
2000 to 75 stores in Year 2003. Figures are not available in 2000 on the volume of milk and dairy products sold. The volume of milk and dairy products sold in 2003 doubled in 2009. The number of stores selling milk and dairy also grew to 98 in 2009. The

Status : Final
30 March 2011
Singapore_NTUC_FairPrice - Full report.docx
Page 40 of 107
variety of cheeses has also grown to more than 100 types. Information on the variety of cheeses in 2000 and 2003 is not available.
7.3.6The number of stores selling chilled pork was 81 in 2005 when the Cold Chain
Management standard for chilled pork was implemented and the volume has since grown by 22% from 2005 to 2009. The number of stores selling chilled pork has increased from 81 in 2005 to 83 stores in 2009.
7.3.7 Implementing the Cold Chain Standards for Milk & Dairy Products and for Chilled Pork
has a positive impact on FairPrice in the following ways:
i) Increased Pool of Qualified Suppliers The Cold Chain management standard for chilled pork has helped to widen the
choice of suppliers who can now be sourced from countries located further away from Singapore. The temperature controlled process makes transportation of supplies over a longer distance possible. For chilled pork, the pool of qualified suppliers has increased from just one overseas supplier in Asia to 2 overseas suppliers with another overseas supplier from the Western hemisphere who can be readily qualified, in the pipeline.
ii) Increased Shelf Life Milk and Dairy The shelf life of milk and dairy products has been increased by 50% from 14 days to
21 days. Practically, this means the products are available for sale for 7 more days which results in lesser wastage due to the improved maintenance of the freshness of the products along the supply chain. Suppliers benefit particularly in this case as the disposal of milk and dairy products just before their expiry date, is done by the suppliers. Having a well managed cold chain management system for milk and dairy products has enabled FairPrice to grow its variety of dairy products to include the more temperature sensitive speciality cheeses with over 100 types of cheeses now available. The implementation of the cold chain standards has also helped to enable the start of NTUC Finest stores which are targeted at the higher income customers who tend to look for more specialty fresh foods which are temperature sensitive.
Chilled Pork Implementing the cold chain standard has increased the shelf life of chilled pork by
100% to 2 days with price mark downs on the 2nd day to encourage sales. The savings in product costs due to disposal of lower quantities of chilled pork by NTUC FairPrice which is 2009 is only a single digit percentage of sales of chilled pork, Larger quantities of chilled pork can also be ordered for sale given that their freshness can be better maintained along the supply chain. This results in higher sales of chilled pork as there would be less out of stock situations. Suppliers are also able to benefit as bringing in higher quantities would help to reduce their operational costs.

Status : Final
30 March 2011
Singapore_NTUC_FairPrice - Full report.docx
Page 41 of 107
iii) Increased Efficiency and Reduced Operational Costs Benefits are realized directly as the number of non conformance cases when the
product reaches the store, have decreased sharply with 99% reduction in the non conformance cases for milk and dairy(excluding cheese and butter) and a 78% reduction for non conformance cases for chilled pork. The dollar savings for manpower is not large but the large percentage reductions contribute towards improved operational efficiency.
The key operations at retail stores for chilled pork include the receiving of chilled
pork deliveries, storage and quality checking of the chilled pork in the chillers, disposal of pork past its expiry date and the handling of customer returns. The savings due to the significant 50% reduction of man hours spent in disposing of pork past its expiry date.
With standardized requirements and pre-selected suppliers who meet the Cold
Chain Standard requirement, time spent on receiving supplies is reduced by 50%. Instead of the usual check by look and feel for chilled pork deliveries, the temperature of the chilled pork deliveries from qualified suppliers is checked using hand held infrared temperature readers. Similarly for milk and dairy products, the time spent on receiving suppliers has decreased by 50% with the total time of 15,126 hours saved in receiving supplies at the retail store for milk and dairy and for chilled pork. Even during the storage in the chiller, the time spent on quality checking is reduced and standardized to four times a day. This has resulted in the reduction in manpower and overheads. The time spent in checking the quality of chilled pork as well as milk and dairy have also decreased significantly by 33% though the dollar savings is not large.
The number of customer return cases has been reduced significantly by 67% for both milk and dairy and chilled pork. Though the actual savings in product and manpower costs is not large, the reduction in returns has helped to boost customer confidence on the quality and safety of these products.
iv) Standardised Refrigerating Equipment and Optimised Retail Space
With the implementation of the cold chain management system, the number of types of refrigerating equipment has been much reduced. This has resulted in cost savings due to the possibility of bulk purchases of the equipment. A better store display of milk & dairy products and chilled pork is now possible with the reduced number of types of refrigerating equipment. It has also resulted in an optimization of retail space at the stores with fewer types of such equipment required.
8. IMPACT BY STANDARD
8.1 Cold Chain Management Standard for Milk and Dairy Products
8.1.1 The standard has helped in increasing the quality of products sold through NTUC FairPrice. The company executives attribute the revenue growth of dairy products to the Cold Chain standard; however they were not able to provide quantitative data to

Status : Final
30 March 2011
Singapore_NTUC_FairPrice - Full report.docx
Page 42 of 107
support the attribution. The key growth areas in terms of products are ice-creams and over 100 types of cheese.
8.1.2 It is important to understand the impact of perishability and temperature requirement
on the supply chain of products within this category. While butter and cheese are stocked and delivered to retail stores via the FFDC, all other milk and dairy products are sent directly to retail stores by suppliers.
Table 6
Implementation of Cold Chain Management Standards
for Milk and Dairy (Total Benefits: $141,677)
ID
Standard Selected Business Function (BF)
Operational Indicator (to measure the impact of standard)
Financial Impact of Operational Indicator
Annual Efficiency
Improvement
% Man-hours
1 CC Milk & Dairy
Procure-ment
Time spent on communication with supplier
Reduction in man-hours for communication with supplier
50% 211
2 CC Milk & Dairy
Procure-ment
Number of non-conformance cases
Reduction in man-hours for handling non-conformance cases by suppliers
75% 45
3 CC Milk & Dairy
Procure-ment
Number of customer return cases
Reduction in man-hours for handling customer return cases
75% 75
4 CC Milk & Dairy (Butter & Cheese)
Distribution Centre (FFDC)
Number of non-conformance cases
Reduction in man-hours for handling non-conformance cases by suppliers
88% 63
5 CC Milk & Dairy (Butter & Cheese)
Distribution Centre (FFDC)
Number of customer return cases
Reduction in man-hours for handling customer return cases
92% 66
6 CC Milk & Dairy (Butter & Cheese)
Distribution Centre (FFDC)
Value of write-off / disposal of spoilt or expired stock
Reduction in product write-offs during storage
NA NA
7 CC Milk & Dairy
Retail Number of non-
Reduction in man-hours for
99% 39

Status : Final
30 March 2011
Singapore_NTUC_FairPrice - Full report.docx
Page 43 of 107
ID
Standard Selected Business Function (BF)
Operational Indicator (to measure the impact of standard)
Financial Impact of Operational Indicator
Annual Efficiency
Improvement
% Man-hours
(Except butter & cheese)
conformance cases
handling non-conformance cases by suppliers
8 CC Milk & Dairy (All)
Retail Time spent on receiving supplies
Reduction in personnel costs by way of reduced man-hour requirement
50% 8,894
9 CC Milk & Dairy (All)
Retail Time required for Quality Checking
Reduction in man-hours for checking quality of products at store
33% 33
10 CC Milk & Dairy (All)
Retail Customer returns
Reduction in cost of goods returned by customer
50% NA
11 CC Milk & Dairy (All)
Retail Number of customer return cases
Reduction in man-hours for handling customer return cases
67% 33
Impact on Procurement Function 8.1.3 There has been a 50% decrease in the time spent on communication with the supplier
as a result of clearly stated specifications for the temperature and humidity of the environment as well as 75% less non conformance cases when the goods are delivered to the store. The number of customer return cases from retail that is handled by procurement has decreased by 75%.
Impact on Fresh Food Distribution Centre 8.1.4 The biggest impact of the standard in dollar terms is realized at the Distribution Centre
which provides inbound and outbound logistics for butter and cheese. Introduction of the cold chain management standard and adherence to it by suppliers ensures high quality and longer shelf life of butter/ cheese along the supply chain. Hence there is lesser spoilage during storage of butter and cheese at the FFDC, and FairPrice benefits with lower write-offs of these products. For butter and cheese, there has been a reduction of 92% in the customer return cases with the implementation of the standard.

Status : Final
30 March 2011
Singapore_NTUC_FairPrice - Full report.docx
Page 44 of 107
Impact on Retail Function 8.1.5 Adhering to the standard helped to increase the shelf life of milk and dairy products by
50% from 14 days to 21 days. Practically, this means the products are available for sale for 7 more days. Previously, with suppliers would pull the products off the shelf for disposal a week before the expiry date to ensure the freshness of the product. With a longer shelf life, this has resulted in lesser wastage. Suppliers can bring in greater quantities and hence reduce their operational costs. With the implementation of the cold chain management standard for milk and dairy, suppliers have also benefitted through the reduction in the number of products returned by the store due to non conformance.
8.1.6 Besides, the introduction of cold chain management standard for milk and dairy has
increased operational efficiency across the three business functions. The most significant man-hour savings is at the Retail function followed by the Fresh Food Distribution Centre and then Procurement. The reduction in time spent in receiving supplies at the retail store is very significant at 50% as this is delivered though once a day but to every one of the 98 stores. The use of hand held infra red readers at the FFDC and retail stores upon delivery of the supplies has helped to speed up the acceptance of the deliveries. For both milk and dairy and chilled pork, quality checks on these products have been made simpler with a 33% improvement in efficiency as checks need to be made only for a specified temperature at the chillers. Due to clearer and standardized product requirements, the buyer spends lesser time in communicating product requirements with suppliers and hence is able to spend more time on other product categories. A significant benefit is the fact that the number of head counts for procurement has remained constant through the years despite the increase in the diversity of products and the large increase in the number of stores.

Status : Final
30 March 2011
Singapore_NTUC_FairPrice - Full report.docx
Page 45 of 107
8.2 Cold Chain Management Standard for Chilled Pork
Table 7 Implementation of Cold Chain Management Standards
for Chilled Pork (Total Benefits: $641,639)
ID
Selected Business Function (BF)
Standard
Operational Indicator (to measure the impact of standard)
Financial Impact of Operational Indicator
Annual Efficiency Improvement
% Man-hours
1 Procurement CC Pork
Time spent on communication with supplier
Reduction in man-hours for communication with supplier
50% 211
2 Procurement CC Pork
Contracting activities with suppliers
Reduction in man-hours for contracting with suppliers
92% 576
3 Procurement CC Pork
Number of non-conformance cases
Reduction in man-hours for handling non-conformance cases by suppliers
85% 21
4
Procurement CC Pork
Number of customer return cases
Reduction in man-hours for handling customer return cases
75% 15
5 Retail CC Pork
Time spent on receiving supplies
Reduction in personnel costs by way of reduced man-hour requirement
50% 6,232
6 Retail CC Pork
Number of non-conformance cases
Reduction in man-hours for handling non-conformance cases by suppliers
70% 40
7 Retail CC Pork
Time spent on Quality Checking
Reduction in man-hours for checking quality of products at store
33% 28
8 Retail CC Pork
Value of write-off / disposal of spoilt or expired stock
Reduction in value of write-off / disposal of pork
33% NA
9 Retail CC Pork
Time spent on daily disposal of pork
Reduction in time required for disposing expired/spoilt pork
50% 15,065
10 Retail CC Pork
Number of customer return cases
Reduction in man-hours for handling customer return cases
67% 7

Status : Final
30 March 2011
Singapore_NTUC_FairPrice - Full report.docx
Page 46 of 107
Year of introduction: Y2005 8.2.1 At NTUC FairPrice, the chilled pork is delivered by six selected suppliers to over
eighty retail stores directly, adhering to the cold chain standard throughout the supply chain and ensuring the freshness of pork.
8.2.2 The most significant impacts of the standard on NTUC FairPrice are in the savings
due to the reduction in the value of the chilled pork being written off, followed by the time spent in the daily disposal of chilled pork and the time spent in receiving supplies.
8.2.3 An important benefit that the Cold Chain management standard for chilled pork has
brought about is the diversification of the sources of pork beyond the regional market. Long distance transportation of supplies is now possible with overseas suppliers now available from the southern hemispheres and in the near future, from the western hemisphere. This not only helps to secure the sources of pork but also helps to keep the prices low for consumers.
Impact on Procurement 8.2.4 The operational indicators used to measure the benefit include:
Time spent on communication with supplier: With clear and standardized requirements to be met by suppliers, the NTUC FairPrice buyer spends lesser time in communication with suppliers on matters such as temperature requirements, factory requirements, abattoir requirements, AVA requirements, etc. After the introduction of standard, the supplier just needs to provide a declaration of compliance with cold chain standard.
Number of non-conformance cases: The time spent by the buyer in dealing with non-conformance incidences by suppliers and customer return incidences has reduced along with the number of incidences per se. The administrative tasks, after introduction of standard have been simplified.
Number of customer return cases: Similarly, with better control of quality, the incidence of customer returns at Retail Stores has been reduced. Often, the buyer has to get involved to clarify the case with the suppliers. The cold chain standard has simplified the administrative tasks involved.
Contracting activities with suppliers: Even the time spent on ordering and contracting activities with suppliers has drastically reduced. The standard has enabled the procurement process to be centralized using a much smaller number of staff whereas previously, each retail store did their own procurement. The resulting contracting activities have been simplified saving significant manpower costs. NTUC FairPrice procures chilled pork only from 6 Grade A suppliers who are now assessed during a one day visit once a year. Prior to the implementation of the standard, weekly two hour meetings were conducted with the suppliers.

Status : Final
30 March 2011
Singapore_NTUC_FairPrice - Full report.docx
Page 47 of 107
Impact on Retail 8.2.5 The operations at Retail stores include receiving of deliveries of chilled pork, storage
and quality checking in the chillers, disposal of expired pork and handling customer returns.
8.2.6 With standardized requirements and pre-selected suppliers who meet the Cold Chain
Standard requirement, time spent on receiving supplies is reduced. Instead of the usual checks by look and feel of the chilled pork deliveries which comes with it the possibility of disputes with the supplier, the temperature is checked using handheld infrared detectors.
8.2.7 Even during the storage in the retail chiller, the time spent on quality checking is
reduced and standardized to four times a day. With better maintenance of the quality of pork, the chilled pork‟s shelf life is increased by a day and a standardized system for disposal of expired pork has been put in place. One day before the expiry date, the price is marked down to encourage sales. The savings in product costs due to the lower number of chilled pork disposals is very low at a single digit percentage of chilled pork sales per year. This has also resulted in a reduction in both manpower and overheads.
8.2.8 Implementation of the standard has therefore benefitted consumers who are also now
more confident of the quality of the chilled pork given the lower number of customer return cases. FairPrice also benefits with the reduction in product and manpower costs and manpower costs from the reduced number of customer returns.
Differences between impact of Cold Chain management standard for Milk & Dairy products and for Chilled Pork 8.2.9 There are significant differences between the impact of the Cold Chain management
standard for Milk & Dairy products and that for Chilled Pork in both the business functions of procurement and retail. The differences are mainly in the benefits from the reduction in the time spent on communicating with suppliers for procurement and the reduction in the high cost of and time required for chilled pork disposals for FairPrice. Weekly discussions with the chilled pork suppliers have been reduced to once a year supplier visit with the implementation of the standard. In the case of retail for milk and dairy, the cartons which are nearing expiry are returned to the suppliers, while this is not the case in chilled pork where the disposal is done directly by FairPrice itself to ensure that there is proper disposal of a highly perishable item that could potentially cause severe food poisoning effects.
8.3 Standard Pallet and Carton Barcode Standards
The impact of the standard pallet and the carton barcode standards on the warehouse and distribution centre are distinct for each standard though both are complementary. The analysis of the impact for each standard is not required as the assessment of the economic benefits for the warehouse and distribution centre already captures the impact of each of these standards.

Status : Final
30 March 2011
Singapore_NTUC_FairPrice - Full report.docx
Page 48 of 107
9. CALCULATION OF THE ECONOMIC BENEFITS OF STANDARDS 9.1 The total financial impact on an annual per-average basis from implementing the
standards for each of the 3 business functions is given in the table below:
Table 8
Summary of impact of Standards across different Business Functions at NTUC FairPrice
Standard
Procurement
Distribution Centre Retail
Total In SGD GLS FFDC
CC Milk and Dairy
7,613 - 31,613 102,451 141,677
CC Chilled Pork
18,935 - - 622,704 641,639
Standard Pallet
- 713,600 - - 713,600
Carton Barcode
- 3,064,551 - - 3,064,551
TOTAL 26,548 3,778,151 31,613 725,156 4,516,467
9.2 The economic impact from the implementation of the product related standards or
cold chain management of chilled pork is higher than for milk and dairy with the retail
function benefitting the most for both standards. The standards introduced into the
distribution centre bring with them very much higher economic benefits ranging from
manpower savings to asset utilisation to product write offs.
9.3 The savings from procurement of milk and dairy and chilled pork average about half
the cost of the staff involved in procurement of these products. Though the economic
benefits of the implementation of these standards is not large relative to the annual
sales of milk and dairy and of chilled pork sales, these standards are intended for
health and safety and any adverse customer feedback would impact their revenue.
9.4 The savings of $3,064,551 from the use of the automated sortation system on an
annual basis would amount to $15,332,755 over a 5 year period and about 37% of the
cost of the building of the automated sortation system and the warehouse, would be
recovered.
9.5 However, as stated in section 6, the standards have been introduced at different
points in time into the operations of FairPrice and the benefits did not occur
simultaneously but span a number of years. This is reflected in the next table below.
9.6 Table 9 below is based on the assumption that the impact of standards is absorbed
into "regular business practice" after a certain period (in the ISO methodology this

Status : Final
30 March 2011
Singapore_NTUC_FairPrice - Full report.docx
Page 49 of 107
period is considered as being around 5 years). We take the average annual impact of
the standards and spread each impact over a five-year period, using 2009 costs.
Table 9
Cumulative Benefits 1999 to 2009
Year of implementation
in FairPrice
Savings from standards over time (annual averages calculated over a 5-year period)
TOTAL
(per year) Procurement Distribution Centre Retail
1999 713,600 713,600
2000 7,613 713,600+31,613 102,451 855,277
2001 7,613 713,600+31,613 102,451 855,277
2002 7,613 713,600+31,613 102,451 855,277
2003 7,613 713,600+31,613 102,451 855,277
2004 7,613 31,613 102,451 141,677
2005 18,935 622,704 641,639
2006 18,935 622,704 641,639
2007 18,935 622,704 641,639
2008 18,935 3,064,551 622,704 3,706,190
2009 18,935 3,064,551 622,704 3,706,190
Total 132,740 9,855167 3,625,775 13,613,682
9.7 The largest impact has come from the Warehousing/Distribution function where the
estimated savings from the implementation of the automated sortation system has brought with it manpower savings that has allowed for the same number of staff to handle the significantly higher number of stores without an increase in staff.
9.8 The implementation of these 4 standards has brought FairPrice benefits totaling
$13.6m over the last 10 years from 1999.
10. QUALITATIVE AND SEMI-QUANTITATIVE CONSIDERATIONS Increase in revenue: 10.1 The impact of all the standards have been to increase consumer confidence and
therefore market share of NTUC FairPrice by providing higher quality of goods as
well as increase operational efficiency.
10.2 The use of technology has helped to reduce the need for additional manpower to
serve a more than double growth in the number of stores over the last 10 years and in
the handling the increasing demand for fresh foods which has more than doubled in
the past 7 years with fresh foods. This has helped NTUC FairPrice to reach the high
income market which has higher margins without sacrificing the needs of the middle
and lower income markets.

Status : Final
30 March 2011
Singapore_NTUC_FairPrice - Full report.docx
Page 50 of 107
10.3 While the impact of the cold chain standards in dollar terms would seem small, it is
important to understand the qualitative aspects behind each of these benefits. The
operational efficiency improvement has been very crucial in streamlining the
operations of NTUC FairPrice to meet the pace of sales growth as the number of stores has more than doubled over the last 10 years or so. For example: In the case of Cold Chain standards, the savings in the process of handling customer returns might not show a significant dollar benefit. However, the whole process has been streamlined and it has significantly improved inter-departmental communication and coordination. At an overall company level, such efficiency improvements have helped NTUC FairPrice move towards better TQM (Total Quality Management).
10.4 The greater availability of chilled pork and milk and dairy products on the shelves with
the extended shelf life, has helped to increase the revenue generated from these products.
10.5 In 2009, chilled pork sales increased by 22% from 2005 when the cold chain standard
for chilled pork was implemented. Improved throughput of good quality chilled pork has been made possible with the standard which has also brought with it, significant operational cost efficiencies. If we assume that the contribution of the standard to the establishment of a more efficient supply chain that would contribute to the increase in the sales of chilled pork over these 5 years, is 10% i.e.SGD 800,000, this would be significant to the revenue for the company.
10.6 In the case of milk and dairy, the cold chain standard for milk and dairy was
implemented in 2000. Sales revenue doubled between 2003 and 2009 with the number of stores increasing from 65 in 1999 to 98 stores in 2009. If we assume that the contribution of the standard to the establishment of more efficient supply chain that would contribute to the increase in the sales of milk and dairy over these 6 years is 10% i.e.SGD 5.5m, this would be a very significant contribution to the revenue of the company.
High quality products 10.7 The cold chain management standards have helped NTUC FairPrice in meeting its
brand mission of providing high quality products and ensuring consumer confidence. The introduction of the standards in the supply chain has significantly reduced non-conformance incidents by suppliers, wastage during storage and the incidence of customer returns. More specialty fresh foods are also possible with the better temperature control systems in place. The standards introduced into the FFDC have also contributed towards the greater availability of fresh and specialty foods. With better temperature control, a better choice of suppliers overseas is also obtained, bringing with it both more competitive pricing and access to more specialty foods.
Increased operational efficiencies 10.8 Significant efficiency improvements have been seen with the reduction in product
specifications for milk and dairy and chilled pork and the greater availability of training both in house and outside the company. All operational indicators for the retail function have shown an improvement of about 50% except for one operational indicator on quality checking which improved by 33 % for both milk and dairy and chilled pork. For the distribution function, all operational indicators show an increase of more or equal to 50% annual efficiency improvement. The focus on reducing distribution costs has also helped towards FairPrice‟s mission of lower cost and higher quality products.

Status : Final
30 March 2011
Singapore_NTUC_FairPrice - Full report.docx
Page 51 of 107
11. EVALUATION OF THE RESULTS Cost savings 11.1 Taking into consideration the impact of standards spanning over 5 years, the
reduction of about $13.6m to operational costs over the last 10 years or so with the use of these 4 standards show the importance of standards, a point that FairPrice leaders are prompt to acknowledge.
11.2 Lower prices for good quality products are a key component of FairPrice‟s service
philosophy. From the cold chain standards, FairPrice increased the number of overseas suppliers in the sourcing of chilled pork that would help to keep its prices lower.
Operational efficiencies 11.3 Operational efficiency gains for almost all operational indicators are above 50% with
several indicators above 75%. 11.4 The Distribution Centre (GLS) throughput increased by 200% with the automated
sortation system based on the carton barcode in place, enabling the servicing of the fast growing retail stores without the need for additional investment in additional shifts and the leasing of additional warehouse space. The savings over the last 10 years for the Distribution Centre (GLS) from the use of two standards is about 50% of the total savings from the estimated $13.6m gained through the use of 4 standards.
Streamlining of Procedures and Processes and partnership with suppliers 11.5 While the financial impact for the other 2 business functions - Procurement and Retail,
are not as significant, there are numerous qualitative and semi-qualitative benefits which are described in Section 10 above. For these functions, standards have helped reduce non conformance and customer returns and lowered the resulting costs for non-compliance issues. The standards looked at has also helped to reduce wastage, increased the number of suppliers and improved the relationships with and the benefits for their suppliers.
11.6 The implementation of the cold chain standards by the milk and dairy and chilled pork
suppliers as well as the standard pallet, have also brought benefits to them with less wastage and less time spent in contract negotiations and delivery.
12. CONCLUSIONS 12.1 The ISO Pilot Study has helped the company obtain a holistic view of the quantitative
and qualitative benefits of the 4 standards that they have implemented as well as the contribution of the standards to their mission of lower costs and higher quality. With an estimated $13.6m benefits derived over the last 10 years with the use of just 4 standards, it is likely the company who believes that standards contribute a significant portion to their revenue, will continue to use and be involved in the development of standards.

Status : Final
30 March 2011
Singapore_NTUC_FairPrice - Full report.docx
Page 52 of 107
12.2 The concerted effort by the company to lead in standards development and
implementation initiatives is justified through this pilot study which demonstrates the interconnectivity of the standards through their value chain and the contribution of these standards to their value drivers.
12.3 The ISO pilot has also shown that FaiPrice‟s partnership with their suppliers who have
committed to the use of the standard pallet and the cold chain management standard for chilled pork and milk and dairy products have also benefitted through less wastage and improved operational efficiencies.
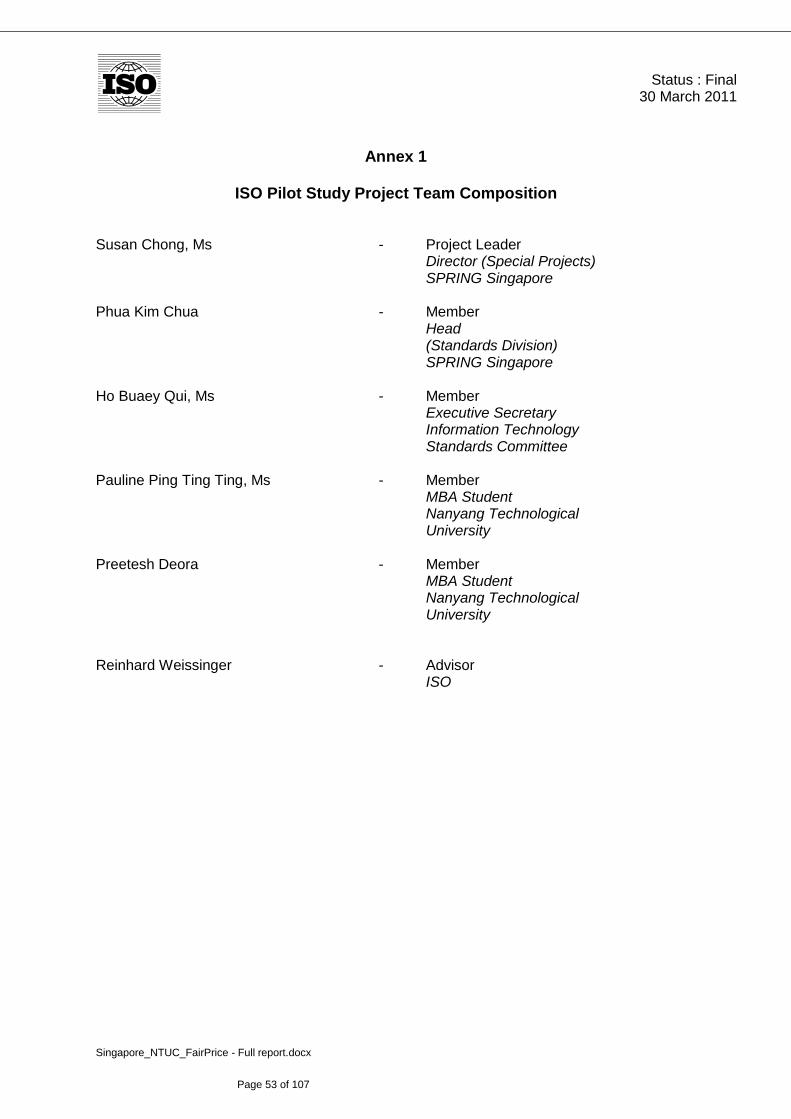
Status : Final
30 March 2011
Singapore_NTUC_FairPrice - Full report.docx
Page 53 of 107
Annex 1
ISO Pilot Study Project Team Composition Susan Chong, Ms - Project Leader Director (Special Projects) SPRING Singapore Phua Kim Chua - Member Head (Standards Division) SPRING Singapore Ho Buaey Qui, Ms - Member Executive Secretary Information Technology Standards Committee Pauline Ping Ting Ting, Ms - Member MBA Student Nanyang Technological University Preetesh Deora - Member MBA Student Nanyang Technological University Reinhard Weissinger - Advisor ISO

Status : Final
30 March 2011
Singapore_NTUC_FairPrice - Full report.docx
Page 54 of 107
Annex 2
Value Chain Analysis - NTUC FairPrice (Attached)

Status : Final
30 March 2011
Singapore_NTUC_FairPrice - Full report.docx
Page 55 of 107
Annex 3
References 1. A.T. Kearney, Inc. (2010), The 2010 A.T. Kearney Global Retail Development Index
AT.
2. Finne,S., & Sivonen, H. (2008).The Retail Value Chain. Kogan Page.
3. NTUC Fairprice Cooperative Ltd., Annual Report 2009/2010
4. NTUC Fairprice COoperative Ltd., Internal Company Documents and presentations
5. www.foodexport.org - Food Export Association of the Midwest USA
6. www.researchandmarkets.com/reports/1436870 - Hypermarket, Supermarket and
Discounters in Singapore
7. Michael Porter - Competitive Advantage: Creating and Sustaining Superior
Performance.
8. ecr-all.org
9. www.fairprice.com.sg/
10. www.slideshare.net/smehro/wal-mart-value-chain-analysis-by-sandro
11. www.idautomation.com/barcoding4beginners.html - ID Automation Barcode FAQ &
Tutorial.
12. www.datamonitor.com - Global Food Retail Industry
13. www.singstat.gov.sg/
14. www.euromonitor.com/Retailing_in_Singapore
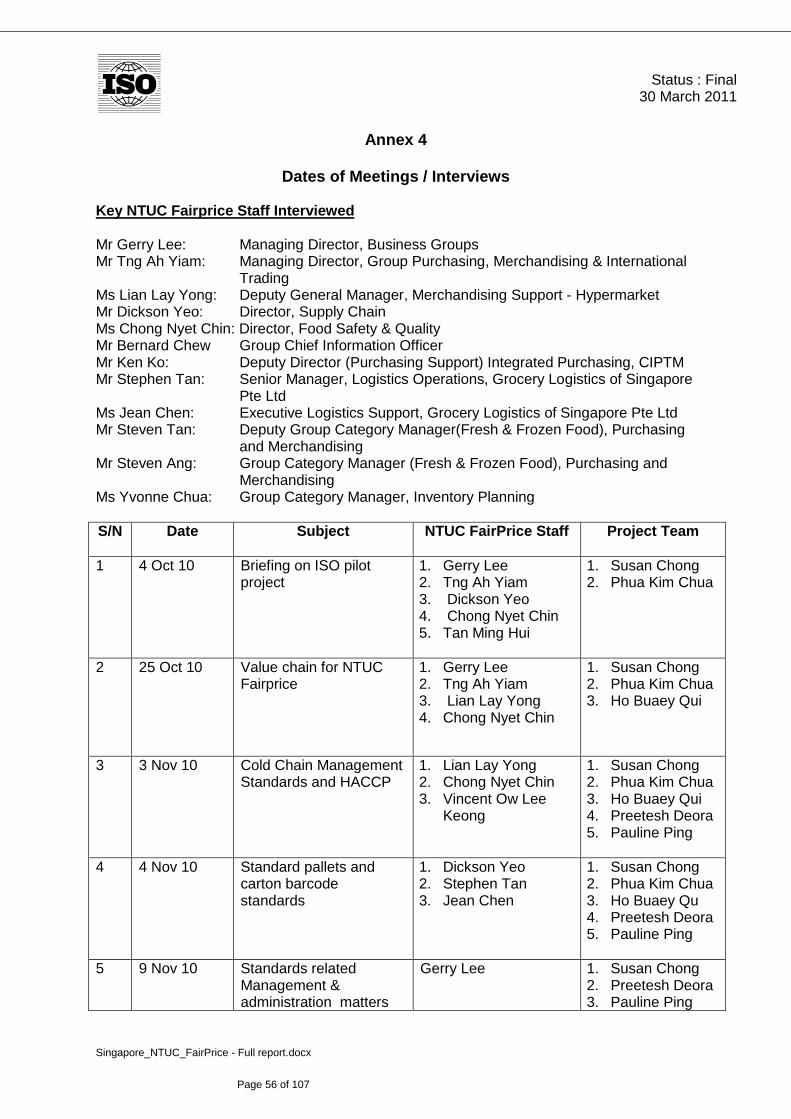
Status : Final
30 March 2011
Singapore_NTUC_FairPrice - Full report.docx
Page 56 of 107
Annex 4
Dates of Meetings / Interviews
Key NTUC Fairprice Staff Interviewed Mr Gerry Lee: Managing Director, Business Groups Mr Tng Ah Yiam: Managing Director, Group Purchasing, Merchandising & International
Trading Ms Lian Lay Yong: Deputy General Manager, Merchandising Support - Hypermarket Mr Dickson Yeo: Director, Supply Chain Ms Chong Nyet Chin: Director, Food Safety & Quality Mr Bernard Chew Group Chief Information Officer Mr Ken Ko: Deputy Director (Purchasing Support) Integrated Purchasing, CIPTM Mr Stephen Tan: Senior Manager, Logistics Operations, Grocery Logistics of Singapore
Pte Ltd Ms Jean Chen: Executive Logistics Support, Grocery Logistics of Singapore Pte Ltd Mr Steven Tan: Deputy Group Category Manager(Fresh & Frozen Food), Purchasing
and Merchandising Mr Steven Ang: Group Category Manager (Fresh & Frozen Food), Purchasing and
Merchandising Ms Yvonne Chua: Group Category Manager, Inventory Planning
S/N Date Subject NTUC FairPrice Staff
Project Team
1 4 Oct 10
Briefing on ISO pilot project
1. Gerry Lee 2. Tng Ah Yiam 3. Dickson Yeo 4. Chong Nyet Chin 5. Tan Ming Hui
1. Susan Chong 2. Phua Kim Chua
2 25 Oct 10
Value chain for NTUC Fairprice
1. Gerry Lee 2. Tng Ah Yiam 3. Lian Lay Yong 4. Chong Nyet Chin
1. Susan Chong 2. Phua Kim Chua 3. Ho Buaey Qui
3 3 Nov 10
Cold Chain Management Standards and HACCP
1. Lian Lay Yong 2. Chong Nyet Chin 3. Vincent Ow Lee
Keong
1. Susan Chong 2. Phua Kim Chua 3. Ho Buaey Qui 4. Preetesh Deora 5. Pauline Ping
4 4 Nov 10
Standard pallets and carton barcode standards
1. Dickson Yeo 2. Stephen Tan 3. Jean Chen
1. Susan Chong 2. Phua Kim Chua 3. Ho Buaey Qu 4. Preetesh Deora 5. Pauline Ping
5 9 Nov 10
Standards related Management & administration matters
Gerry Lee 1. Susan Chong 2. Preetesh Deora 3. Pauline Ping
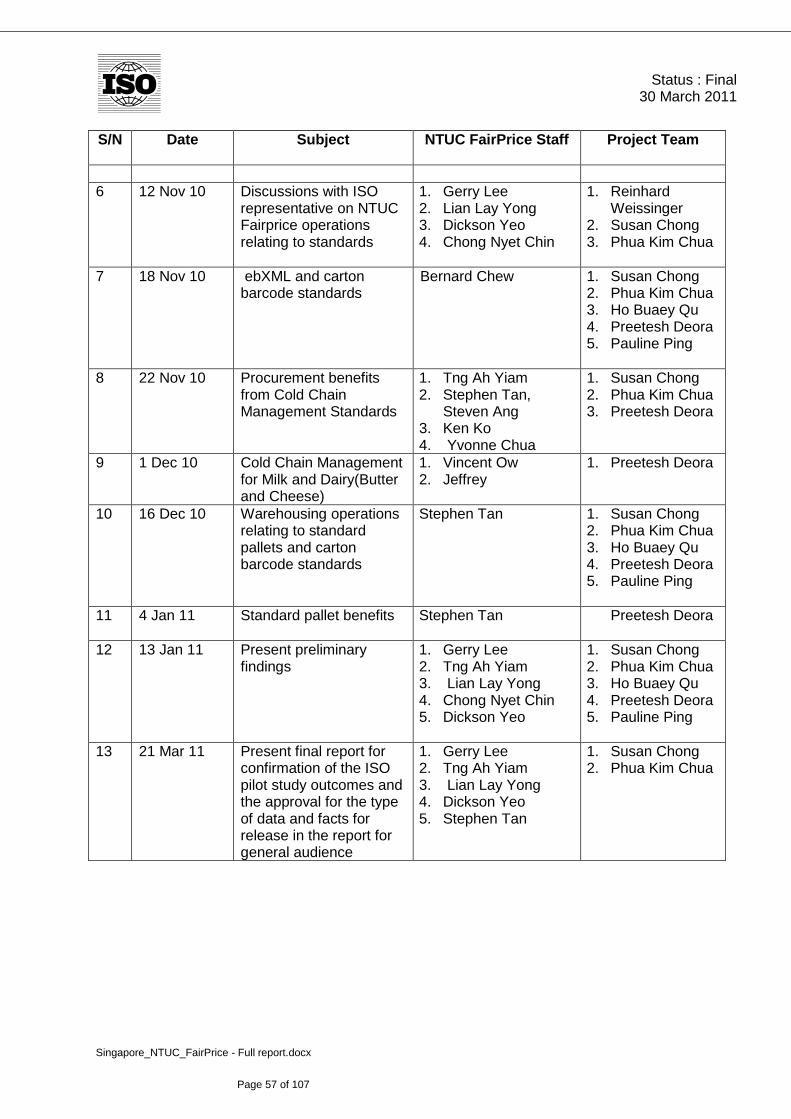
Status : Final
30 March 2011
Singapore_NTUC_FairPrice - Full report.docx
Page 57 of 107
S/N Date Subject NTUC FairPrice Staff
Project Team
6 12 Nov 10
Discussions with ISO representative on NTUC Fairprice operations relating to standards
1. Gerry Lee 2. Lian Lay Yong 3. Dickson Yeo 4. Chong Nyet Chin
1. Reinhard Weissinger
2. Susan Chong 3. Phua Kim Chua
7 18 Nov 10
ebXML and carton barcode standards
Bernard Chew 1. Susan Chong 2. Phua Kim Chua 3. Ho Buaey Qu 4. Preetesh Deora 5. Pauline Ping
8 22 Nov 10
Procurement benefits from Cold Chain Management Standards
1. Tng Ah Yiam 2. Stephen Tan,
Steven Ang 3. Ken Ko 4. Yvonne Chua
1. Susan Chong 2. Phua Kim Chua 3. Preetesh Deora
9 1 Dec 10
Cold Chain Management for Milk and Dairy(Butter and Cheese)
1. Vincent Ow 2. Jeffrey
1. Preetesh Deora
10 16 Dec 10
Warehousing operations relating to standard pallets and carton barcode standards
Stephen Tan 1. Susan Chong 2. Phua Kim Chua 3. Ho Buaey Qu 4. Preetesh Deora 5. Pauline Ping
11 4 Jan 11
Standard pallet benefits
Stephen Tan Preetesh Deora
12 13 Jan 11
Present preliminary findings
1. Gerry Lee 2. Tng Ah Yiam 3. Lian Lay Yong 4. Chong Nyet Chin 5. Dickson Yeo
1. Susan Chong 2. Phua Kim Chua 3. Ho Buaey Qu 4. Preetesh Deora 5. Pauline Ping
13 21 Mar 11
Present final report for confirmation of the ISO pilot study outcomes and the approval for the type of data and facts for release in the report for general audience
1. Gerry Lee 2. Tng Ah Yiam 3. Lian Lay Yong 4. Dickson Yeo 5. Stephen Tan
1. Susan Chong 2. Phua Kim Chua
Status : Final
30 March 2011
Singapore_NTUC_FairPrice - Full report.docx
Page 58 of 107
Annex 5.1 Economic benefits of standardization Assessment Tool- Standard Pallet- Inbound Logistics A. Introduction Participant
Name: ……………………………………………………………………………………………. Position: ………………………………………………………………………………………….. Company
Company: ………………………………………………………………………………….……. Country (Headquarters) ………………………………………………………………………. Financial data
Area of management responsibility: a) Entire company b) Business unit c) Product category d) Other Please specify: ………………………………………………………………………………. Please refer all following questions to your area of management responsibility. Sales (Year): Logistics costs (Year): B. Instructions The goal of the Assessment Tool is to assess the relevance of potential impacts from external standards on the Inbound Logistics function. The "standards" considered in this Assessment Tool are the voluntary consensus-based standards developed by international organizations (eg. ISO, IEC and ITU), regional organizations (eg. CEN, CENELEC and ETSI), national standards bodies (eg. ANSI, DIN and JISC). The following questions examine important indicators relevant for the Inbound Logistic business function. If there are indicators other than the ones given that are more relevant for your company, and for which you have better data available concerning the impact of standards, please provide information about them. For all questions, please consider the impacts from standards that have been introduced or modified in the past five years (5 years preferred but longer than 5 years is acceptable if significant) and please state all figures on an annual basis.

Status : Final
30 March 2011
Singapore_NTUC_FairPrice - Full report.docx
Page 59 of 107
Separating the impact of standards on particular business drivers from other related actions (e.g. good services, engineering or management practices, technology developments) can be difficult. Any comments clarifying this aspect would be most welcome. C. Questions
1. What is the standard “work week” for the operators / employees?
Impact 1: Reduced manpower requirement for receiving supplies
Standardized pallets for supplies make receiving more efficient. Lesser manpower is required to receive supplies. 1.1 What percentage of costs in Logistics are personnel costs? a) 0-20% b) 20-40% c) 40-60% d) 60-80% e) >80% 1.2 Do you use automated receiving of supplies through RFID? a) Yes b) No If the answer to 1.2 is Yes: 1.3 What are the total cost savings in Inbound Logistics due to the automated receiving of
supplies, taking into account the depreciation of the required systems? …….% If the answer to 1.2 is No: 1.3 What percentage of time is used for receiving supplies? 1.4 How much faster is the receiving of supplies due to the introduction of the standard
pallet in the past five years or more? Include savings for suppliers who deliver using the standard pallet.
1.5 How much less manpower is used in Inbound Logistics to receive supplies due to the
standard pallet being introduced in the past five years or more? 1.6 What was the total reduction in personnel costs within Inbound Logistics (including the
administration and management functions of the warehouse/distribution centre) resulting

Status : Final
30 March 2011
Singapore_NTUC_FairPrice - Full report.docx
Page 60 of 107
from the change from non standard pallets to standard pallets in the past five years or more?
Impact 2: Space Optimization while receiving supplies Supplies are received more efficiently with lesser space requirement at the warehouse due to the standard pallet size. 2.0 Has this impact had a significant effect on your function due to the standard pallet being
introduced in the past five years or more since it was introduced? a) Yes b) No 2.1 Has the use of the standard pallet improved your warehouse space utilization? a) Yes b) No 2.2 What was the total increase in warehouse utilization within Inbound Logistics due to the
lower number of pallet sizes resulting from the introduction of the standard pallet in the past five years or more?
2.3 What was the reduction in space required at the receiving area with suppliers using the
standard pallets? Comments: Impact 3: Reduced variety
Inbound Logistics can be conducted more efficiently due to the reduction in the number of different sized pallets and the reduction in warehouse space requirements and therefore better warehouse space utilization, with the standard pallet. Main savings are in form of reduced manpower requirement, space savings and capital savings. 3.0 Has this impact had a significant effect on your function due to the standard pallet being
introduced in the past five years or more? a) Yes b) No 3.1 How many different sized pallets were used in the past vs. current? 3.2 Has the use of the standard pallet improved your warehouse space requirements?
a) Yes b) No
Status : Final
30 March 2011
Singapore_NTUC_FairPrice - Full report.docx
Page 61 of 107
3.3 What was the reduction in manpower requirement to sort out the pallets after the standard pallets were introduced?
………..% 3.4 What was the total decrease in warehouse space requirements within Inbound Logistics
resulting from the reduction of the number of different sized pallets with the introduction of the standard pallet in the past five years or more?
…………… Comments: Impact 4: Better ability to meet seasonal demand
Due to the ease of sourcing of standard pallets, fewer pallets need to be stored in the warehouse. 4.0 Has this impact had a significant effect on your function due to the standard pallet being
introduced in the past five years or more? a) Yes b) No 4.1 What has been the savings in capital expenditure and maintenance costs with the
change from the ownership model for standard pallets? …………. 4.2 What is the resulting savings in space required to store the extra pallets required during
the peak seasons? ……....... 4.3 What has been the manhour savings in stock taking / counting especially during
seasonal peaks with the introduction of the carton barcode standards? Comments:
Impact 5: Better internal information transfer
Internal information about products and services is passed on more efficiently within Inbound Logistics using documentation of products on a per standard pallet basis. 5.0 Has this impact had a significant effect on your function due to the standard pallet being
introduced in the past five years or more since it was introduced?

Status : Final
30 March 2011
Singapore_NTUC_FairPrice - Full report.docx
Page 62 of 107
a) Yes b) No 5.1 What percentage of time within Inbound Logistics is used for communicating internal
documentation and specifications? ………% 5.2 How much did you reduce the time required to communicate information about products
and services due to the standard pallet being introduced in the past five years or more since it was introduced?
………% Comments:

Status : Final
30 March 2011
Singapore_NTUC_FairPrice - Full report.docx
Page 63 of 107
Economic benefits of standardization Assessment Tool - Outbound Logistics to Retail A. Introduction Participant
Name: ………………………………………………………………………………………….. Position: …………………………………………………………………………………………. Company
Company: ……………………………………………………………………………………... . Country (Headquarters): …………………………………………………………………….. Financial data
Area of management responsibility: a) Entire company b) Business unit c) Product category d) Other Please specify: ……………………………………………………………………………. Please refer all following questions to your area of management responsibility. Sales (Year): Logistics costs (Year): B. Instructions The goal of the Assessment Tool is to assess the relevance of potential impacts from external standards on the Outbound Logistic function. The "standards" considered in this Assessment Tool are the voluntary consensus-based standards developed by international organizations (eg. ISO, IEC and ITU), regional organizations (eg. CEN, CENELEC and ETSI), national standards bodies (eg. ANSI, DIN and JISC). The following questions examine important indicators relevant for the Outbound Logistic business function. If there are indicators other than the ones given that are more relevant for your company, and for which you have better data available concerning the impact of standards, please provide information about them. For all questions, please consider the impacts from standards that have been introduced or modified in the past five years (5 years preferred but longer than 5 years is acceptable if significant) and please state all figures on an annual basis.

Status : Final
30 March 2011
Singapore_NTUC_FairPrice - Full report.docx
Page 64 of 107
Separating the impact of standards on particular business drivers from other related actions (e.g. good service, engineering or management practices, technology developments) can be difficult. Any comments clarifying this aspect would be most welcome. C. Questions
Impact 1: More efficient packing & shipping: Reduced manpower requirement
Standardized documentation, packaging and labels make packing and shipping goods more efficient. 1.1 What percentage of costs in Outbound Logistics to Retail are personnel costs? a) 0-20% b) 20-40% c) 40-60% d) 60-80% e) >80% 1.2 What percentage of time in Outbound Logistics is used for preparing shipments? ………% 1.3 How much were you able to reduce the time required for preparing shipments due to the
standard pallet introduced in the past five years or more since it was introduced? ………… 1.4 What percentage of costs in Outbound Logistics is for shipments? …………% 1.5 How much were you able to reduce average shipment costs by implementing the
standard pallet? ………… 1.6 How much less manpower is used in Outbound Logistics to supply shipments due to the
new pallet standard introduced in the past five years or more since it was introduced? ………… 1.7 How much did reducing the number of products using non standard pallet sizes cut
personnel costs within Outbound Logistics? ………… Comments:

Status : Final
30 March 2011
Singapore_NTUC_FairPrice - Full report.docx
Page 65 of 107
Impact 2: Reduced variety
Outbound Logistics can be conducted more efficiently due to the reduced number of types of products using non standard pallets and decrease in warehouse space requirements resulting in better warehouse space utlisation, with the standard pallet 2.0 Has this impact had a significant effect on your function due to the standard pallet being
introduced in the past five years or more since it was introduced? a) Yes b) No 2.1 By how much were the types of products using non standardized pallets reduced after
the standard pallet was introduced in the past five years or more? …………% Comments:
Status : Final
30 March 2011
Singapore_NTUC_FairPrice - Full report.docx
Page 66 of 107
Economic benefits of standardization Assessment Tool - Retail --- NOT APPLICABLE A. Introduction Participant
Name: ……………………………………………………………………………………………… Position: ……………………………………………………………………………………………. Company
Company: …………………………………………………………………………………………. Country (Headquarters): ………………………………………………………………………… Financial data
Area of management responsibility: a) Entire company b) Business unit c) Product category d) Other Please specify: ……………………………………………………………………………………... Please refer all following questions to your area of management responsibility. Sales (Year): Retail costs (Year): B. Instructions The goal of the Assessment Tool is to assess the relevance of potential impacts from external standards on the Retail function. The "standards" considered in this Assessment Tool are the voluntary consensus-based standards developed by international organizations (eg. ISO, IEC and ITU), regional organizations (eg. CEN, CENELEC and ETSI), national standards bodies (eg. ANSI, DIN and JISC). The following questions examine important indicators relevant for the Procurement business function. If there are indicators other than the ones given that are more relevant for your company, and for which you have better data available concerning the impact of standards, please provide information about them. For all questions, please consider the impacts from standards that have been introduced or modified in the past five years ((5 years preferred but longer than 5 years is acceptable if significant ) and please state all figures on an annual basis.
Status : Final
30 March 2011
Singapore_NTUC_FairPrice - Full report.docx
Page 67 of 107
Separating the impact of standards on particular business drivers from other related actions (e.g. good services, engineering or management practices, technology developments) can be difficult. Any comments clarifying this aspect would be most welcome. C. Questions
Impact 1: Better internal information transfer
You can pass on internal information about products and services more efficiently in Retail and between Retail and inbound logistics/procurement/suppliers by using quantity of products per standard pallet 1.1 What percentage of costs in Retail are personnel costs? a) 0-20% b) 20-40% c) 40-60% d) 60-80% e) >80% 1.2 What percentage of time in Retail is used for communicating information about products
and services within the retail store and with inbound logistics/supplier/ procurement? ………% 1.3 How much did you reduce the time required to communicate information about products
and services within the retail store and from the retail store to inbound warehouse/ procurement/ supplier and vice versa due to the standard pallet being introduced in the past five years or more?
………% Comments:
Impact 2: Reduced variety
Fewer types of products using non-standardized pallets make Retail activities more efficient. 2.0 Has this impact had a significant effect on your retail function due to the standard pallet
being introduced in the past five years or more? a) Yes b) No 2.1 By how much were the types of products using non standardized pallets reduced? …….% 2.2 What was the total reduction in personnel costs within Retail due to the reduction in
number of types of products using non standard pallets resulting from the introduction of the standard pallet in the past five years or more?
…….% 2.3 Has the use of the standard pallet improved your storage space utilization?
a) Yes b) No

Status : Final
30 March 2011
Singapore_NTUC_FairPrice - Full report.docx
Page 68 of 107
2.4 What was the total increase in storage space utilization within Retail due to the lower number of products using non standard pallet types resulting from the introduction of the standard pallet in the past five years or more?
…………
Comments:

Status : Final
30 March 2011
Singapore_NTUC_FairPrice - Full report.docx
Page 69 of 107
Annex 5.2 Economic benefits of standardization Assessment Tool - Carton Barcode Standards - Inbound Logistics A. Introduction Participant
Name: …………………………………………………..………………………………………. Position: ………………………………………………………………………………………... Company:
Company: …………………………………………………………………………………..…. Country (Headquarters): …………………………………………………………………….. Financial data
Area of management responsibility: a) Entire company b) Business unit c) Product category d) Other Please specify: …………………………………………………………………………………. Please refer all following questions to your area of management responsibility. Sales (Year): Inbound Logistics costs (Year): B. Instructions The goal of the Assessment Tool is to assess the relevance of potential impacts from external standards on the Inbound Logistics function. The "standards" considered in this Assessment Tool are the voluntary consensus-based standards developed by international organizations (eg. ISO, IEC and ITU), regional organizations (eg. CEN, CENELEC and ETSI), national standards bodies (eg. ANSI, DIN and JISC). The following questions examine important indicators relevant for the Inbound Logistic business function. If there are indicators other than the ones given that are more relevant for your company, and for which you have better data available concerning the impact of standards, please provide information about them. For all questions, please consider the impacts from standards that have been introduced or modified in the past five years and please state all figures on an annual basis.

Status : Final
30 March 2011
Singapore_NTUC_FairPrice - Full report.docx
Page 70 of 107
Separating the impact of standards on particular business drivers from other related actions (e.g. good engineering or management practices, technology developments) can be difficult. Any comments clarifying this aspect would be most welcome. C. Questions
Impact 1: More efficient receiving of supplies
Standardized documentation, packaging, labels or tags of supplies makes receiving more efficient. 1.1 What was the average daily error rate in processing the retail stores‟ order by the
Outbound logistic function before the introduction of the carton barcode standards. ……..% 1.2 What are the benefits to Inbound Logistics due to the use of carton barcodes in the
receiving of supplies? ……… 1.3 What is the average daily error rate in processing the retail stores‟ order by the
Outbound logistic function after the introduction of the carton barcodes. ………… 1.4 What was the average daily number of cartons processed by the inbound logistic
function before the introduction of the automated Sortation System and Conveyor Belt System?
……… 1.5 What is the average daily number of cartons processed by the inbound logistic function
after the introduction of the automated Sortation System and Conveyor Belt System? ………… Comments:
Impact 2: Increased inventory flow
Inbound Logistics can be conducted more efficiently due to the reduced number of types of products using cartons that have no bar code. Warehouse space utilization is also maximized with the cartons that fit onto the standard pallet for products flowing through the warehouse.
Status : Final
30 March 2011
Singapore_NTUC_FairPrice - Full report.docx
Page 71 of 107
2.0 Has this impact had a significant effect on your inbound function due to barcode standards being introduced for cartons in the past five years or more?
a) Yes b) No 2.1 By moving to cartons to fit onto the standard pallet, how much faster has inventory
management become, given that no of products per pallet can now be counted by pallet (given that the number of cartons per product is now a standard for each product type as they fit onto the standard pallet and the no. of products per carton is known)?
…….% 2.2 Has the use of the carton barcode standards improved your warehouse space
utilization? a) Yes b) No
2.3 How much space was saved at the warehouse after bar coded cartons was introduced
in the past five years? ….….% 2.4 What was the total reduction in personnel costs within Inbound Logistics due to the
automated processing of supply resulting from the introduction of barcode standards for carton in the past five years?
…….% Comments: Impact 3: Better product availability
Due to suppliers adopting standardized barcoding for their cartons which speeds up their supply chain, fewer supplies need to be stored in the warehouse. 3.0 Has this impact had a significant effect on your function due to barcode standards
introduced for carton in the past five years? a) Yes b) No 3.1 How much was the average handling time been reduced for the supplies due to barcode
standards being introduced for carton in the past five years? …….%
Status : Final
30 March 2011
Singapore_NTUC_FairPrice - Full report.docx
Page 72 of 107
3.2 What was the total reduction in warehousing costs due to the increase in the use of standardized cartons barcodes with their introduction in the past five years or more?
…….% 3.3 What was the total reduction in personnel costs within Inbound Logistics due to the
automated inventory tracking of supplies by bar code resulting from the introduction of barcodes standards for cartons in the past five years?
…….% Comments:
Impact 4: Better internal information transfer
Internal information about products and services is passed on more efficiently within Inbound Logistics using standardized carton barcodes. 4.0 Has this impact had a significant effect on your inbound logistic function due to barcode
standards introduced or modified for carton in the past five years? a) Yes b) No 4.1 How much time was reduced in communicating the information about the products and
services due to barcode standards being introduced for cartons in the past five years or more?
…………% Comments:

Status : Final
30 March 2011
Singapore_NTUC_FairPrice - Full report.docx
Page 73 of 107
Economic benefits of standardization Assessment Tool- Carton Barcode - Outbound Logistics A. Introduction Participant
Name: ……………………………………………………………………………………………. Position: …………………………………………………………..……………………………. Company:
Company: ………………………………………………………………………………………. Country (Headquarters): ………………………………………………………………………. Financial data
Area of management responsibility: a) Entire company b) Business unit c) Product category d) Other Please specify: ……………………………………………..………………………………. Please refer all following questions to your area of management responsibility. Sales (2009): Outbound Logistics costs (2009): B. Instructions The goal of the Assessment Tool is to assess the relevance of potential impacts from external standards on the Outbound Logistic function. The "standards" considered in this Assessment Tool are the voluntary consensus-based standards developed by international organizations (eg. ISO, IEC and ITU), regional organizations (eg. CEN, CENELEC and ETSI), national standards bodies (eg. ANSI, DIN and JISC). The following questions examine important indicators relevant for the Outbound Logistic business function. If there are indicators other than the ones given that are more relevant for your company, and for which you have better data available concerning the impact of standards, please provide information about them. For all questions, please consider the impacts from standards that have been introduced or modified in the past five years and please state all figures on an annual basis.
Status : Final
30 March 2011
Singapore_NTUC_FairPrice - Full report.docx
Page 74 of 107
Separating the impact of standards on particular business drivers from other related actions (e.g. good engineering or management practices, technology developments) can be difficult. Any comments clarifying this aspect would be most welcome. C. Questions
Impact 1: More efficient sorting, packing and delivery
Standardized documentation, packaging and labels make packing and shipping goods more efficient. 1.1 By how much were you able to reduce the time required for picking, sorting and packing
due to carton barcode standards being introduced in the past five years or more? …..….% 1.2 By how much was the average picking, sorting and packing costs reduced with the
implementation of the carton barcode standards? ……… 1.3 What are the total cost savings in Outbound Logistics (including administration and
management functions of the warehousing/distribution centre) due to the automated picking, sorting and packing of supplies, taking into account the depreciation of the required systems?
……… 1.4 What was the average daily number of cartons processed by the outbound logistic
function before the introduction of the automated Sortation System and Conveyor Belt System?
………… 1.5 What is the increase in average daily number of cartons processed by the Outbound
logistic function resulting from the use of the automated Sortation System and Conveyor Belt System which uses the carton barcode for processing?
…………% 1.6 What was the total reduction in personnel costs within Outbound Logistics due to the
automated processing of orders to the retail stores resulting from the introduction of the automated Sortation System and Conveyor Belt System?
…………
Status : Final
30 March 2011
Singapore_NTUC_FairPrice - Full report.docx
Page 75 of 107
2.0 What was the average daily error rate in processing the retail stores‟ order by the Outbound logistic function before the introduction of the automated Sortation System and Conveyor Belt System?
….….% 2.1 What is the decrease in average daily error rate in processing the retail stores‟ orders by
the Outbound logistic function resulting from the use of carton barcode standards in the automated Sortation System and Conveyor Belt System?
…….% 2.2 What was the productivity of the pickers and packers in the handling of the cartons in
the Outbound logistic function before the introduction of the automated Sortation System and Conveyor Belt System?
…….
2.3 What is the productivity of the pickers, sorters and packers in handling the cartons in the
Outbound logistic function after the introduction of the automated Sortation System and Conveyor Belt System?
……… Comments:
Impact 3: Better internal information transfer
Standardized documentation and specifications make passing on internal information about products and services more efficient. 3.0 Has this impact had a significant effect on your function due to carton barcode
standards introduced in the past five years? a) Yes b) No 3.1 How much time was reduced in the communication of information about products and
services due to barcode standards being introduced for cartons in the past five years or more?
…………% Comments:

Status : Final
30 March 2011
Singapore_NTUC_FairPrice - Full report.docx
Page 76 of 107
Economic benefits of standardization Assessment Tool - Carton Barcode - Procurement A. Introduction Participant
Name: …………………………………………………………….……………………………. Position: .……………………………………………………………………………………….. Company: ………………………………………………………………………………………. Country (Headquarters): ………………………………………………………………………. Financial data
Area of management responsibility: a) Entire company b) Business unit c) Product category d) Other Please specify: ………………………………………………………………………………. Please refer all following questions to your area of management responsibility. Sales (2009): Procurement costs (2009): B. Instructions The goal of the Assessment Tool is to assess the relevance of potential impacts from external standards on the Procurement function. The "standards" considered in this Assessment Tool are the voluntary consensus-based standards developed by international organizations (eg. ISO, IEC and ITU), regional organizations (eg. CEN, CENELEC and ETSI), national standards bodies (eg. ANSI, DIN and JISC). The following questions examine important indicators relevant for the Procurement business function. If there are indicators other than the ones given that are more relevant for your company, and for which you have better data available concerning the impact of standards, please provide information about them. For all questions, please consider the impacts from standards that have been introduced or modified in the past five years and please state all figures on an annual basis. Separating the impact of standards on particular business drivers from other related actions (e.g. good engineering or management practices, technology developments) can be difficult. Any comments clarifying this aspect would be most welcome.

Status : Final
30 March 2011
Singapore_NTUC_FairPrice - Full report.docx
Page 77 of 107
C. Questions
Impact 1: Better internal information transfer
You can pass on internal information about products and services more efficiently in Procurement by using standardized carton barcodes. 1.1 By how much did you reduce the time required to communicate information about
products and services, eg. supplier information, supply batch, expiration dates, etc due to carton barcode standards being introduced in the past five years or more?
…………% Comments: Impact 2: Increased inventory flow
Procurement can be conducted more efficiently due to the use of standardized carton barcodes. 2.0 Has this impact had a significant effect on your procurement function due to carton
barcode standards being introduced in the past five years? a) Yes b) No 2.1 Has the use of the carton barcode standards improved your procurement process or
management? a) Yes b) No
2.2 Has the use of the carton barcode standards improved the tracking and tracing of the
procurement of your supplies? a) Yes b) No
2.3 By how much did you reduce the time required to track and trace including the receipt of supplies during the procurement cycle?
…….% 2.4 What was the total reduction in personnel costs within Procurement due to the
introduction of carton barcode standards in the past five years? ……% Comments:

Status : Final
30 March 2011
Singapore_NTUC_FairPrice - Full report.docx
Page 78 of 107
Impact 3: Clearer product specifications
Due to the standardized carton barcode specifications of the suppliers' products and the internal product requirements, it is easier to collect relevant product information. 3.0 Has this impact had a significant effect on your procurement function due to carton
barcode standards being introduced in the past five years? a) Yes b) No 3.1 What percentage of time in Procurement is used for collecting information about
suppliers' products and internal product requirements? …….% 3.2 How much did you reduce the time required to collect information about
products/services and internal product requirements due to carton barcode standards being introduced in the past five years?
…….% Comments:
Impact 4: More efficient contractual agreements
Defined specifications of suppliers' products using standardized carton barcodes make the concluding of agreements easier. 4.0 Has this impact had a significant effect on your procurement function due to carton
barcode standards being introduced in the past five years? a) Yes b) No 4.1 What percentage of time in Procurement is used for concluding agreements? …….% 4.2 How much time was saved in concluding agreements due to carton barcode standards
being introduced in the past five years or more? …….% 4.3 Has your communication with your suppliers improved due the introduction of
standardized carton barcodes introduced in the past five years or more? a) Yes b) No
Comments:

Status : Final
30 March 2011
Singapore_NTUC_FairPrice - Full report.docx
Page 79 of 107
Annex 5.3a
Economic benefits of standardization Assessment Tool - CC Chilled Pork - Inbound Logistics to Retail A. Introduction Participant
Name: ……………………………………………………………………………………. Position: ……………………………………………………………………………………. Company
Company: ……………………………………................................................................... Country (Headquarters): …………………………………………………………………….. Financial data
Area of management responsibility: a) Entire company b) Business unit c) Product category d) Other Please specify: ……………. Please refer all following questions to your area of management responsibility. Sales (Year): Inbound Logistics cost (Year): B. Instructions The goal of the Assessment Tool is to assess the relevance of potential impacts from external standards on the Inbound Logistics function. The "standards" considered in this Assessment Tool are the voluntary consensus-based standards developed by international organizations (eg. ISO, IEC and ITU), regional organizations (eg. CEN, CENELEC and ETSI), national standards bodies (eg. ANSI, DIN and JISC). The following questions examine important indicators relevant for the Inbound Logistic business function. If there are indicators other than the ones given that are more relevant for your company, and for which you have better data available concerning the impact of standards, please provide information about them.

Status : Final
30 March 2011
Singapore_NTUC_FairPrice - Full report.docx
Page 80 of 107
For all questions, please consider the impacts from standards that have been introduced or modified in the past five years (5 years preferred but longer than 5 years is acceptable if significant) and please state all figures on an annual basis. Separating the impact of standards on particular business drivers from other related actions (e.g. good services, engineering or management practices, technology developments) can be difficult. Any comments clarifying this aspect would be most welcome. C. Questions
Impact 1: More efficient receiving of supplies
Standardized documentation, packaging, labels or tags of supplies makes receiving more efficient. 1.1 What percentage of costs in Inbound Logistics are personnel costs? a) 0-20% b) 20-40% c) 40-60% d) 60-80% e) >80% 1.2 What percentage of time is used for receiving supplies? …………% 1.3 What was the reduction in the delivery of products not complying to the required product
quality after the introduction of the cold chain management of chilled pork standard in the past five years or more?
Before standard : After standard : 1.4 What was the reduction in the time spent in handling a non compliance case?
Before standard :
After standard : Comments: Impact 3: Better product quality
Freshness and quality of products are preserved and thus there is less spoilage with the introduction of standard 3.0 Has this impact had a significant effect on your function due to standard introduced in
the past five years or more since it was introduced?
a) Yes b) No

Status : Final
30 March 2011
Singapore_NTUC_FairPrice - Full report.docx
Page 81 of 107
3.1 With lower spoilage of stocks due to better management of the quality of chilled pork,
what is the reduction on the product write off cost after the introduction of the standard in the past five years or more?
Before standard : After standard : 3.2 Stocks that are spoilt need to be disposed properly after the product has been written
off. What percentage of the time is used to dispose of these stocks? …………% 3.3 What was the total reduction in time due to the reduced amount of stocks to be disposed
of, after the introduction of the cold chain management for chilled pork standard in the past five years or more?
……… Comments: Impact 4: Better training
Inbound Logistics staff can be trained better because relevant specifications for both products and services are standardized. 4.0 Has this impact had a significant effect on your function due to the standard being
introduced in the past five years or more since it was introduced? a) Yes b) No 4.1 What percentage of time in Inbound Logistics is used for training staff? 4.2 How much were you able to reduce in-house staff training time due to the standard
being introduced in the past five years or more? ……… 4.3 What percentage of time would have been used for in-house training of in bound
logistics staff in the retail function before the standard was introduced? ……… Comments:

Status : Final
30 March 2011
Singapore_NTUC_FairPrice - Full report.docx
Page 82 of 107
Economic benefits of standardization Assessment Tool - CC Chilled Pork - Procurement A. Introduction Participant
Name: …………………………………. Position: …………………………………. Company:
Company: ………………………………………………………………………………………. Country (Headquarters): ……………..……………………………………………………... Financial data
Area of management responsibility: a) Entire company b) Business unit c) Product category d) Other Please specify: ……………………. Please refer all following questions to your area of management responsibility. Sales (Year): Procurement costs (Year): B. Instructions The goal of the Assessment Tool is to assess the relevance of potential impacts from external standards on the Procurement function. The "standards" considered in this Assessment Tool are the voluntary consensus-based standards developed by international organizations (eg. ISO, IEC and ITU), regional organizations (eg. CEN, CENELEC and ETSI), national standards bodies (eg. ANSI, DIN and JISC). The following questions examine important indicators relevant for the Procurement business function. If there are indicators other than the ones given that are more relevant for your company, and for which you have better data available concerning the impact of standards, please provide information about them. For all questions, please consider the impacts from standards that have been introduced or modified in the past five years 5 years preferred but longer than 5 years is acceptable if significant )and please state all figures on an annual basis.

Status : Final
30 March 2011
Singapore_NTUC_FairPrice - Full report.docx
Page 83 of 107
Separating the impact of standards on particular business drivers from other related actions (e.g. good services, engineering or management practices, technology developments) can be difficult. Any comments clarifying this aspect would be most welcome. C. Questions
Impact 1: Better internal information transfer
You can pass on internal information about products and services more efficiently in Procurement by using standardized documentation and specifications. 1.1 Has this impact had a significant effect on your function due to the introduction of
standard? a) Yes b) No 1.2 What percentage of costs in Procurement are personnel costs? Before introduction of standard: a) 0-20% b) 20-40% c) 40-60% d) 60-80% e) >80% After introduction of standard: a) 10-20% b) 20-40% c) 40-60% d) 60-80% e) >80% 1.3 What percentage of time in Procurement is used for communicating information within
the company and with suppliers? Before introduction of standard: After introduction of standard: 1.4 How many cases of non-conformance occur in a year?
Before introduction of standard: After introduction of standard:
1.5 How much time is spent by Procurement personnel in dealing with one case of non-
conformance?
Before introduction of standard: After introduction of standard:
1.6 How many cases of customer returns/ complaints are there in a year? Before introduction of standard:

Status : Final
30 March 2011
Singapore_NTUC_FairPrice - Full report.docx
Page 84 of 107
After introduction of standard: 1.7 How much time is spent by Procurement personnel in dealing with one case of a return
or complaint from a customer? Before introduction of standard: After introduction of standard:
Comments: Impact 2: Clearer product specifications
Due to the standardized specifications of the suppliers' products and the internal product requirements, it is easier to collect relevant information 2.0 Has this impact had a significant effect on your function due to the standard being
introduced in the past five years or more? a) Yes b) No 2.1 How much time was saved in communicating the specifications to existing and new
suppliers after the standard was implemented? …….%
Impact 3: More efficient contractual agreements
Defined specifications make concluding agreements easier. 3.0 Has this impact had a significant effect on your function due to standard being
introduced in the past five years or more? a) Yes b) No 3.1 What percentage of time in Procurement is used for concluding agreements? …….% 3.2 How much time was saved in concluding agreements due to the standard for being
introduced in the past five years or more? ……. Comments:

Status : Final
30 March 2011
Singapore_NTUC_FairPrice - Full report.docx
Page 85 of 107
Impact 4: More competent suppliers
Suppliers are able to provide supplies with consistent quality. As a result, the delivery and acceptance by the retail store is faster. 4.0 Has this impact had a significant effect on your function due to standard being
introduced in the past five years or more? a) Yes b) No 4.1 What is the percentage of the Procurement costs compared to other expenses /
overheads? Before introduction of standard: a) 0-20% b) 20-40% c) 40-60% d) 60-80% e) >80% After introduction of standard: a) 10-20% b) 20-40% c) 40-60% d) 60-80% e) >80% 4.2 How many suppliers have undergone training since the introduction of the cold chain
management standard for chilled pork. ………….. 4.3 How much more chilled pork has been sold because of introduction of the standard? …………..% Comments: Impact 5: Larger number of sources of supplies
Costs are more stable after the introduction of the standard 5.0 Has this impact had a significant effect on your function due to standard being
introduced? a) Yes b) No 5.1 With the standard in place, the number of suppliers could be increased (thereby helping
to keep prices stable), by …………..% Comments:

Status : Final
30 March 2011
Singapore_NTUC_FairPrice - Full report.docx
Page 86 of 107
Economic benefits of standardization Assessment Tool - CC Chilled Pork - Retail A. Introduction Participant
Name: ……………………………………………………………………………………………. Position: ……………………………………………………………………………………….. Company :
Company: ………………………………………………………………………………………. Country (Headquarters): ……………………………………………………………………….. Financial data
Area of management responsibility: a) Entire company b) Business unit c) Product category d) Other Please specify: …………………………………………………………………………………. Please refer all following questions to your area of management responsibility. Sales (Year): Retail costs (Year): B. Instructions The goal of the Assessment Tool is to assess the relevance of potential impacts from external standards on the Retail function. The "standards" considered in this Assessment Tool are the voluntary consensus-based standards developed by international organizations (eg. ISO, IEC and ITU), regional organizations (eg. CEN, CENELEC and ETSI), national standards bodies (eg. ANSI, DIN and JISC). The following questions examine important indicators relevant for the Retail business function. If there are indicators other than the ones given that are more relevant for your company, and for which you have better data available concerning the impact of standards, please provide information about them.

Status : Final
30 March 2011
Singapore_NTUC_FairPrice - Full report.docx
Page 87 of 107
For all questions, please consider the impacts from standards that have been introduced or modified in the past five years ((5 years preferred but longer than 5 years is acceptable if significant and please state all figures on an annual basis. Separating the impact of standards on particular business drivers from other related actions (e.g. good services, engineering or management practices, and technology developments) can be difficult. Any comments clarifying this aspect would be most welcome. C. Questions
Impact 1: Better internal information transfer
You can pass on internal information about products and services more efficiently in Retail and between Retail and Inbound Logistics/Procurement/Suppliers and vice versa 1.1 What percentage of costs in Retail are personnel costs? ………..% 1.2 What is the likely write off if the standard is not used in the store: ……….% 1.3 What is the likely reduction in write off if the standard is not used in the store: ……….% Comments: Impact 2: Clearer product specifications
Due to the standardized specifications of the standard for supply, it is easier to collect relevant information of the supply
2.0 Has this impact had a significant effect on your retail function due to the standard for
being introduced?
a) Yes b) No 2.1 What percentage of time in Retail is used for collecting information about suppliers'
products and retail store requirements? ………….% 2.2 How much did you reduce the time required to collect information about products and
the retail store requirements due to standard being introduced? ………….%
Status : Final
30 March 2011
Singapore_NTUC_FairPrice - Full report.docx
Page 88 of 107
2.3 How much did you reduce the time required to deal with quality and safety issues for supply due to the standard being introduced?
1) Reduction in time spent in receiving supplies …………% 2) Reduction in no of non conformance cases on receipt of supplies
…………% 3) Reduction in no of customer return cases
…………%
4) Reduction in time spent in checking quality in the store …………%
2.3 What percentage of cost in Retail is due to disposal of unsold supplies that is past the sell by date?
…………% 2.4 What is the reduction in the percentage of administration cost in Retail due to disposal
of unsold supply after the introduction of the standard? …………% Comments:
Impact 3: Better training
You can train Procurement staff better if you have standardized specifications of products and services. 3.0 Has this impact had a significant effect on Retail due to the standard being introduced in
the past five years or more?
a) Yes b) No 3.1 What percentage of time in Retail is used for in-house training of staff? …..….% 3.2 By how much were you able to reduce in-house staff training time due to the standard
being introduced in the past five years or more? …..….% Comments:

Status : Final
30 March 2011
Singapore_NTUC_FairPrice - Full report.docx
Page 89 of 107
Annex 5.3b
Economic benefits of standardization Assessment Tool - CC Milk and Dairy (Butter and Cheese) - Inbound Logistics to Retail A. Introduction Participant
Name: …………………………………………………………………………………………….. Position: ……………………………………………………………………………………………. Company :
Company: ………………………………………………………………………………………… Country (Headquarters): ……………………………………………………………………….. Financial data
Area of management responsibility: a) Entire company b) Business unit c) Product category d) Other Please specify: …………….…………………………………………………..………………. Please refer all following questions to your area of management responsibility. Sales (2009) : Inbound Logistics costs (2009): B. Instructions The goal of the Assessment Tool is to assess the relevance of potential impacts from external standards on the Inbound Logistics function. The "standards" considered in this Assessment Tool are the voluntary consensus-based standards developed by international organizations (eg. ISO, IEC and ITU), regional organizations (eg. CEN, CENELEC and ETSI), national standards bodies (eg. ANSI, DIN and JISC). The following questions examine important indicators relevant for the Inbound Logistic business function. If there are indicators other than the ones given that are more relevant for your company, and for which you have better data available concerning the impact of standards, please provide information about them.
Status : Final
30 March 2011
Singapore_NTUC_FairPrice - Full report.docx
Page 90 of 107
For all questions, please consider the impacts from standards that have been introduced or modified in the past five years (5 years preferred but longer than 5 years is acceptable if significant) and please state all figures on an annual basis. Separating the impact of standards on particular business drivers from other related actions (e.g. good services, engineering or management practices, technology developments) can be difficult. Any comments clarifying this aspect would be most welcome. C. Questions
Impact 1: More efficient receiving of supplies
Standardized documentation, packaging, labels or tags of supplies makes receiving more efficient. 1.1 What percentage of costs in Inbound Logistics are personnel costs?
a) 0-20% b) 20-40% c) 40-60% d) 60-80% e) >80% 1.2 How much faster is the receiving of supplies due to the standard being introduced in the
past five years or more? 1.3 What is the reduction in number of cases of non compliance of products received from
suppliers at the Warehouse/ Distribution Centre after the introduction of standard?
Before standard : __ cases After standard : __ cases
1.4 What was the reduction in number of cases of non compliance of products returned by
the retail store and the customers to the Warehouse/ Distribution Centre after the introduction of standard?
Before standard : __ cases After standard : __ cases
1.5 What is the reduction in transaction costs as a percentage of the cost Inbound Logistics,
due to returns after the introduction of the standard in the past five years or more? ………….% 1.6 What is the decrease in write off of spoilt or expired stock at the Warehouse/
Distribution Centre after the standard was introduced in the past five years or more? ………….% Comments:
Status : Final
30 March 2011
Singapore_NTUC_FairPrice - Full report.docx
Page 91 of 107
Impact 2: Reduced variety
Inbound Logistics can be conducted more efficiently due to the reduced number of products - NOT APPLICABLE 2.0 Has this impact had a significant effect on your function due to the standard introduced
in the past five years or more? a) Yes b) No 2.1 By how many were the types of products reduced? ……. 2.2 What was the reduction in products inventory due to the fewer types of supplies of
products resulting from the introduction of standard for the supplies in the past five years or more?
…….% 2.3 What was the total reduction in time within Inbound Logistics due to the lower number of
types of supplies resulting from the introduction of the standard in the past five years or more?
…….% Comments:
Impact 3: Better product availability
Due to the high availability of standardized products, fewer supplies need to be stored in the warehouse 3.0 Has this impact had a significant effect on your function due to the standard being
introduced in the past five years or more? a) Yes b) No 3.1 What was the total reduction in warehouse/distribution costs (including manpower, loss
of energy costs due to returns, etc) due to the reduction of returns arising from the introduction of the standard being introduced in the past five years or more?
…….% Comments:
Status : Final
30 March 2011
Singapore_NTUC_FairPrice - Full report.docx
Page 92 of 107
Impact 4: Better internal information transfer
Internal information about products and services is passed on more efficiently within Inbound Logistics using standardized documentation and specifications.
- NOT APPLICABLE 4.0 Has this impact had a significant effect on your function due to the standard being
introduced in the past five years or more? a) Yes b) No 4.1 What percentage of time within Inbound Logistics is used for communicating internal
documentation and specifications? …….% 4.2 How much did you reduce the time required to communicate information about products
and services due to the standard being introduced in the past five years or more? …….% Comments: Impact 5: Better training
Inbound Logistics staff can be trained better because relevant specifications for both products and services are standardized. 5.0 Has this impact had a significant effect on your function due to the standard being
introduced in the past five years or more? a) Yes b) No 5.1 What percentage of time in Inbound Logistics in retail is used for training staff? …..….% 5.2 How much were you able to reduce in-house staff training time due to the standard
being introduced in the past five years or more? …..….% Comments:
Status : Final
30 March 2011
Singapore_NTUC_FairPrice - Full report.docx
Page 93 of 107
Economic benefits of standardization Assessment Tool - CC Milk and Dairy - Procurement A. Introduction Participant
Name: …………………………………………………………………………………………….. Position: ………………………………………………………………………………………….. Company:
Company: ……………………………………………………………………………………… Country (Headquarters): ……………………………………………………………………….. Financial data
Area of management responsibility: a) Entire company b) Business unit c) Product category d) Other Please specify: ………………………………………………………………………………….. Please refer all following questions to your area of management responsibility. Sales (Year): Procurement costs (Year): B. Instructions The goal of the Assessment Tool is to assess the relevance of potential impacts from external standards on the Procurement function. The "standards" considered in this Assessment Tool are the voluntary consensus-based standards developed by international organizations (eg. ISO, IEC and ITU), regional organizations (eg. CEN, CENELEC and ETSI), national standards bodies (eg. ANSI, DIN and JISC). The following questions examine important indicators relevant for the Procurement business function. If there are indicators other than the ones given that are more relevant for your company, and for which you have better data available concerning the impact of standards, please provide information about them. For all questions, please consider the impacts from standards that have been introduced or modified in the past five years 5 years preferred but longer than 5 years is acceptable if significant )and please state all figures on an annual basis.

Status : Final
30 March 2011
Singapore_NTUC_FairPrice - Full report.docx
Page 94 of 107
Separating the impact of standards on particular business drivers from other related actions (e.g. good services, engineering or management practices, technology developments) can be difficult. Any comments clarifying this aspect would be most welcome. C. Questions
Impact 1: Better internal information transfer
You can pass on internal information about products and services more efficiently in Procurement by using standardized documentation and specifications. 1.1 Has this impact had a significant effect on your function due to the standard being
introduced in the past five years or more? a) Yes b) No 1.2 What percentage of costs in Procurement are personnel costs before introduction of
standard? a) 0-20% b) 20-40% c) 40-60% d) 60-80% e) >80% 1.3 What percentage of the procurement personnel cost can be assigned to Procurement
on basis of time spent after the standard was introduced? a) 0-20% b) 20-40% c) 40-60% d) 60-80% e) >80% 1.4 What percentage of time in Procurement is used for communicating information about
products and services within the company? …………% 1.5 How much did you reduce the time required to communicate information about the
products after the standard was introduced? …………% Comments: Impact 2: Clearer product specifications
Due to the standardized specifications of the suppliers' products and the internal requirements, it is easier to collect relevant information 2.0 Has this impact had a significant effect on your function due to the standard being
introduced in Y2003? a) Yes b) No

Status : Final
30 March 2011
Singapore_NTUC_FairPrice - Full report.docx
Page 95 of 107
2.1 What percentage of time in Procurement is used for collecting information about suppliers' products and internal requirements?
…...….% 2.2 How much did you reduce the time required to collect information about products/
services and internal requirements due to the standard being introduced in the past five years or more?
………% Comments:
Impact 3: More efficient contractual agreements
Defined specifications of supplies make concluding agreements easier. 3.0 Has this impact had a significant effect on your function due to standard being
introduced in the past five years or more since it was introduced? a) Yes b) No 3.1 What percentage of time in Procurement is used for concluding agreements? ….….% 3.2 How much time was saved in concluding agreements due to the standard being
introduced in the past five years or more? ….…..% Comments: Impact 4: More competent suppliers
Suppliers are able to provide products with consistent quality. As a result, the delivery and receipt of goods are faster. 4.0 Has this impact had a significant effect on your function due to standard being
introduced in the past five years or more? a) Yes b) No 4.1 Has competition in the market increased so that the price of products is more
competitive with greater number of suppliers? a) Yes b) No?

Status : Final
30 March 2011
Singapore_NTUC_FairPrice - Full report.docx
Page 96 of 107
4.2 What percentage of the overall Procurement costs is for the product? a) 0-20% b) 20-40% c) 40-60% d) 60-80% e) >80% 4.3 In what form has the introduction of standards affected the relationship with the
suppliers? …………% 4.4 What was the reduction in time spent on non conformance cases of products delivered
to the store and returned by customers? …………% products returned to supplier upon delivery to store …………% products returned by customers to store Comments:
Impact 5: Larger quantities
Costs of supplies are lower because larger quantities of the same type can be purchased. - NOT APPLICABLE 5.0 Has this impact had a significant effect on your function due to the standard being
introduced in the past five years or more since it was introduced? a) Yes b) No 5.1 What percentage of the overall Procurement costs is for milk and dairy products? a) 0-20% b) 20-40% c) 40-60% d) 60-80% e) >80% 5.2 What was the reduction in the costs of supplies due to larger quantities of products in
the past five years or more since it was introduced? ……….% Comments:
Impact 6: Increased variety
Increased types of supplies of milk and dairy products make Retail activities more competitive
- NOT APPLICABLE
Status : Final
30 March 2011
Singapore_NTUC_FairPrice - Full report.docx
Page 97 of 107
6.0 Has this impact had a significant effect on your procurement function due to the standard being introduced in the past five years or more?
a) Yes b) No 6.1 By how much were the types of supplies increased? ……..% 6.2 What was the total increase in personnel costs within Procurement due to the increase
in number of types of supplies resulting from the introduction of the standard in the past five years or more?
….….% 6.3 What was the total increase in retail stock room utilization within Retail due to the lower
number of types of supplies resulting from the introduction of the standard in the past five years or more since it was introduced?
……..% Comments:
Impact 7: Better training
You can train Procurement staff better if you have standardized specifications of products and services.
- NOT APPLICABLE 6.0 Has this impact had a significant effect on your function due to the standard being
introduced in the past five years or more since it was introduced? a) Yes b) No 7.1 What percentage of time in Procurement is used for in-house training staff? ………% 7.2 By how much were you able to reduce in-house staff training time due to standard that
was introduced in the past five years? ……...% Comments:

Status : Final
30 March 2011
Singapore_NTUC_FairPrice - Full report.docx
Page 98 of 107
Economic benefits of standardization Assessment Tool - CC Milk and Dairy (Butter and Cheese) - Inbound Logistics to Warehousing A. Introduction Participant
Name: …………………………………………………………………………………………….. Position: …………………………………………………………………………………………… Company:
Company: ……………………………………………………………………………………….. Country (Headquarters): …………………………………………………………………………. Financial data
Area of management responsibility: a) Entire company b) Business unit c) Product category d) Other Please specify: …………………………..…………………………..…………….……………. Please refer all following questions to your area of management responsibility. Sales (Year): Total warehouse Logistics Cost (Year): B. Instructions The goal of the Assessment Tool is to assess the relevance of potential impacts from external standards on the Inbound Logistics function. The "standards" considered in this Assessment Tool are the voluntary consensus-based standards developed by international organizations (eg. ISO, IEC and ITU), regional organizations (eg. CEN, CENELEC and ETSI), national standards bodies (eg. ANSI, DIN and JISC). The following questions examine important indicators relevant for the Inbound Logistic business function. If there are indicators other than the ones given that are more relevant for your company, and for which you have better data available concerning the impact of standards, please provide information about them. For all questions, please consider the impacts from standards that have been introduced or modified in the past five years (5 years preferred but longer than 5 years is acceptable if significant) and please state all figures on an annual basis.

Status : Final
30 March 2011
Singapore_NTUC_FairPrice - Full report.docx
Page 99 of 107
Separating the impact of standards on particular business drivers from other related actions (e.g. good services, engineering or management practices, technology developments) can be difficult. Any comments clarifying this aspect would be most welcome. C. Questions
Impact 1: More efficient receiving of supplies
Standardized documentation, packaging, labels or tags of supplies makes receiving more efficient. 1.1 What percentage of costs in total warehouse Logistics costs are receiving personnel
costs? a) 0-20% b) 20-40% c) 40-60% d) 60-80% e) >80% 1.2 What percentage of time is used for receiving supplies? …………% 1.3 What was the reduction in non conformance cases of products delivered by suppliers
after the introduction of the standard in the past five years or more? …………% 1.4 With less rejection of supplier stocks, how much time has been saved in receiving
stocks after the introduction of the standard in the past five years or more? …………% 1.5 How much less stocks are disposed off after the introduction of the standard in the past
five years or more? …………% Comments: Impact 2: Not applicable Impact 3: Better product quality
Freshness and quality of products are preserved and thus there is less spoilage with the introduction of standard 3.0 Has this impact had a significant effect on your function due to standard being
introduced in the past five years or more? a) Yes b) No

Status : Final
30 March 2011
Singapore_NTUC_FairPrice - Full report.docx
Page 100 of 107
3.1 With less stocks spoilage due to quality problems, what is the reduction on the product write off cost after the introduction of standard in the past five years or more?
…………% 3.2 Stocks that are spoilt need to be disposed properly after their write off. How many man
hours are needed to perform disposal? ………… 3.3 What was the total reduction in time required for the disposal of stocks within the
warehouse after the introduction of standard in the past five years? …………% Comments: Impact 4: Better internal information transfer
Internal information about products and services is passed on more efficiently by using standardized documentation and specifications.
- NOT APPPLICABLE 4.0 Has this impact had a significant effect on your function due to the standard being
introduced in the past five years or more? a) Yes b) No 4.1 What percentage of time is used for communicating compliance with the standard? ……...% 4.2 How much did you reduce the time required to communicate information about product
compliance due to the standard being introduced in the past five years or more? ….….% Comments: Impact 5: Better training
Inbound Logistics staff can be trained better because relevant specifications for both products and services are standardized. 5.0 Has this impact had a significant effect on your function due to the standard introduced
in the past five years or more? a) Yes b) No
Status : Final
30 March 2011
Singapore_NTUC_FairPrice - Full report.docx
Page 101 of 107
5.1 What percentage of time in Inbound Logistics in retail is used for in-house training of
staff? ………..% 5.2 How much were you able to reduce in-house staff training time due to the standard
being introduced in the past five years or more? ………% 5.3 What percentage of time in inbound logistics in retail would have been used for in-house
training of staff in case the standard was not introduced? ………% Comments:
Status : Final
30 March 2011
Singapore_NTUC_FairPrice - Full report.docx
Page 102 of 107
Economic benefits of standardization Assessment Tool - CC Milk and Dairy - Retail A. Introduction Participant
Name: ……………………………………………………………………………………………. Position: …………………………………………………………………………………………. Company:
Company: ……………………………………………………………………………………….. Country (Headquarters): ………………………………………………………………………. Financial data
Area of management responsibility: a) Entire company b) Business unit c) Product category d) Other Please specify: ……………………………………………………………………………… Please refer all following questions to your area of management responsibility. Sales (Year): Procurement costs (Year): B. Instructions The goal of the Assessment Tool is to assess the relevance of potential impacts from external standards on the Retail function. The "standards" considered in this Assessment Tool are the voluntary consensus-based standards developed by international organizations (eg. ISO, IEC and ITU), regional organizations (eg. CEN, CENELEC and ETSI), national standards bodies (eg. ANSI, DIN and JISC). The following questions examine important indicators relevant for the Procurement business function. If there are indicators other than the ones given that are more relevant for your company, and for which you have better data available concerning the impact of standards, please provide information about them. For all questions, please consider the impacts from standards that have been introduced or modified in the past five years ((5 years preferred but longer than 5 years is acceptable if significant ) and please state all figures on an annual basis.
Status : Final
30 March 2011
Singapore_NTUC_FairPrice - Full report.docx
Page 103 of 107
Separating the impact of standards on particular business drivers from other related actions (e.g. good services, engineering or management practices, technology developments) can be difficult. Any comments clarifying this aspect would be most welcome. C. Questions
Impact 1: Better internal information transfer
You can pass on internal information about products and services more efficiently in Retail and between Retail and Inbound Logistics/Procurement/Suppliers and vice versa. 1.1 What percentage of costs in Fresh Food Retail are personnel costs? a) 0-20% b) 20-40% c) 40-60% d) 60-80% e) >80% 1.2 What is the likely write off if the standard is not used in the store: …….% Comments:
Impact 2: Increased variety
Increased types of supplies products make Retail activities more efficient 2.0 Has this impact had a significant effect on your retail function due to the standard being
introduced in the past five years or more? a) Yes b) No 2.1 By how much was the number of types of supplies increased? …….% 2.2 What was the total reduction in receiving time for supplies delivered to Retail after the
introduction of the standard in the past five years or more? …….% 2.3 Has the use of the standard improved your retail space utilization?
a) Yes b) No 2.4 What was the total increase in retail space utilization due to the lower number of types
of refrigeration equipment resulting from the introduction of the standard in the past five years or more since it was introduced?
…….%

Status : Final
30 March 2011
Singapore_NTUC_FairPrice - Full report.docx
Page 104 of 107
Comments:
Impact 3: Clearer product specifications
Due to the standardized specifications of the standard, it is easier to collect relevant information of the products 3.0 Has this impact had a significant effect on your retail function due to the standard being
introduced in the past five years or more? a) Yes b) No 3.1 What percentage of time in Retail is used for collecting information about suppliers'
products and retail store requirements? ……….% 3.2 By how much did you reduce the time required to collect information about products and
the retail store requirements after the standard was introduced in the past five years ago or more?
……….% 3.3 By how much was the time reduced for dealing with non conforming quality and safety
issues for products after the standard was introduced in the past five years ago or more?
……..% 3.4 By how much was the time reduced for dealing with product returns from customers
after the standard was introduced in the past five years ago or more? ……..% 3.5 By how much was the cost of the product returns from customers reduced after the
standard was introduced in the past five years ago or more? ……..% 3.6 What is the time required for raising one goods return note? …… … 3.7 With an increase in shelf life, what is the reduction in the number of goods return notes
by the retail stores and what is the resulting reduction in time? ………… 3.8 What percentage of cost in Retail are transaction costs due to returns resulting from the
introduction of the standard in the past five years or more

Status : Final
30 March 2011
Singapore_NTUC_FairPrice - Full report.docx
Page 105 of 107
…………% 3.9 What was the reduction in time spent in Retail to check the quality of the products on
the shelves after the introduction of the standard in the past five years or more …………% Comments:
Impact 4: Industry competition
More competition in the market drives down the price of products 4.0 Has this impact had a significant effect on your retail function due to the standard being
introduced in the past five years or more? a) Yes b) No 4.1 What percentage of the overall Retail costs are for supplies? a) 0-20% b) 20-40% c) 40-60% d) 60-80% e) >80% 4.2 What was the reduction in supply costs across the retail stores due to the lower cost of
products due to the standard being introduced in the past five years or more? …….% 4.3 Has the number of suppliers that Retail stores liaised directly with increased significantly
due to the standard being introduced in the past five years or more? a) Yes b) No Comments:
Impact 5: Better training
You can train retail staff better if you have standardized specifications of products and services. 5.0 Has this impact had a significant effect on Retail due to the standard being introduced in
the past five years or more? a) Yes b) No 5.1 What percentage of time in Retail is used for in-house training staff? …….%
Status : Final
30 March 2011
Singapore_NTUC_FairPrice - Full report.docx
Page 106 of 107
5.2 By how much were you able to reduce in-house staff training time due to the standard
that was introduced in the past five years or more? …….% Comments:
Status : Final
30 March 2011
Singapore_NTUC_FairPrice - Full report.docx
Page 107 of 107
Annex 6 Glossary
AVA Agri-Food & Veterinary Authority (of Singapore) CC Cold Chain CGAR Compound Annual Growth Rate DC Distribution Centre ECR Efficient Consumer Response FFDC Fresh and Frozen Food Distribution Centre GLS Grocery Logistics of Singapore HACCP Hazard Analysis and Critical Control Points NTUC National Trades Union Congress PED Pallet End Double TQM Total Quality Management