Embed Size (px)
Citation preview
Isolation and Characterization of Cancer-Derived Exosomes
Galina Dimitrova Pavlova
Master’s thesis at the Department of Biosciences
Faculty of Mathematics and Natural Sciences
UNIVERSITY OF OSLO
September 2016

II
III
Isolation and Characterization of
Cancer-Derived Exosomes
Galina Dimitrova Pavlova
Master’s Thesis at the Department of Biosciences
Faculty of Mathematics and Natural Sciences
University of Oslo
September 2016
IV
© Galina Dimitrova Pavlova
2016
Isolation and Characterization of Cancer-Derived Exosomes
Galina Dimitrova Pavlova
http://www.duo.uio.no/
Print: Reprosentralen, Universitetet i Oslo
V
Abstract
Exosomes are membrane-enclosed vesicles, 30 to 150 nm in diameter, formed into the lumen
of cellular structures called multivesicular bodies. They are released into the extracellular
environment upon fusion of multivesicular bodies with the plasma membrane. Exosomes
carry proteins, lipids and nucleic acids. Mounting evidence shows that exosomes function as
intercellular signaling organelles, which can transfer their cargo to target cells and induce
phenotypic changes in the recipients.
Exosomes can be isolated from several, easily accessible body fluids such as serum, plasma
and urine. In cancer patients, they represent a potential source of non-invasive biomarkers, as
the cancer-derived exosomes carry proteins or other biomolecules originating from the tumor.
Several exosome-isolation methods are currently available, but there is no consensus on the
best protocol to use. The most preferred method is differential centrifugation, consisting of a
series of centrifugations using increasing force of gravity to deplete the liquid of cell debris
and larger vesicles, before saving the last pallet with the lightest vesicles.
In this study, we investigated the effect of force reduction on the purity and the yield of
isolated exosomal material. We found that reduction in the applied forces in step two of the
protocol is directly proportional to purity and inversely proportional to yield. We also showed
that the exosome markers CD63 and Flotillin-1 are not specific to exosomes and that CD9
expression in exosomes is cell type specific.
We further performed protein analysis of cancer exosomes derived from cell culture media of
metastatic melanoma and colorectal cancer cell lines, as well as of exosomes isolated from
plasma of patients with rectal cancer. We found that several proteins were selectively
enriched in exosomes from these cell lines. We further found evidence of different protein
modifications in cells and exosomes. No specific protein signatures were identified in the
small cohort of the patient extracted exosomes we analyzed.
Finally, we demonstrated that melanoma-derived exosomes are internalized by melanoma
cells and fibroblasts. Fibroblasts that have been co-cultured with melanoma exosomes did not
show changes in metabolic activity.

VI
VII
Acknowledgements
The work presented in this thesis was performed at the Department of Tumor Biology,
Institute for Cancer Research, Oslo University Hospital, Radium Hospital, in the period from
January 2015 to September 2016.
First and for most, I would like to express my deepest gratitude to my supervisor Siri Tveito
for introducing me to cancer research. Thank you for guiding me through every step of this
project and for sharing your vast knowledge with me. Your advice and support during the
writing of this master thesis are greatly appreciated.
Second, I would like to thank prof. Gunhild M. Mælandsmo and prof. Kjersti Flatmark for
welcoming me to their groups and letting me be part of the inspiring research environment of
this department.
Special thanks to my fellow office mates, the PhD students, Kotryna Seip and Karianne Giller
Fleten, for providing interesting discussions, valuable advice and taking the time to go
through parts of this thesis and make some helpful comments. Also thanks to my former
fellow master student and current PhD student, Anna Barkovskaya, for the many refreshing
lunch and coffee breaks.
And last but not least, I would like to thank my family for their great support, patience and
understanding. Your love and compassion was invaluable to me during the period of writing.
Thanks to my husband for his love and to my son for being the great boy he is and for never
complaining that mommy’s not home. I love you guys! Special thanks to my mom for her
devotion and special motherly support and encouragement.
September 2016
Galina Dimitrova Pavlova

VIII
IX
List of Abrreviations
ADAM10 A disintegrin and metalloproteinase domain-binding protein 10
APC Adenomatous polyposis coli
APCs Antigen presenting cells
ATCC American type culture collection
ATP Adenosine triphosphate
BCA Bicinchoninic acid
BMDCs Bone marrow-derived progenitor cells
BRAF Rapidly accelerated fibrosarcoma protein kinase B
BSA Bovine serum albumin
CAFs Cancer-associated fibroblasts
CANX Calnexin
CD147 Cluster of differentiation 147
CD63 Cluster of differentiation 63
CD73 Cluster of differentiation 73
CD81 Cluster of differentiation 81
CD9 Cluster of differentiation 9
CDKN2A Cyclin-dependent kinase inhibitor 2A
CLL Chronic lymphocytic leukaemia
CRC Colorectal cancer
CTFs C-terminal fragments
CYC1 Cytochorme c
DMSO Dimethyl sulfoxide
DNA Deoxyribonucleic acid
DTT Dithiothreitol
ECAR Extracellular Acidification Rate
EDTA Ethylenediaminetetraacetic acid
EM Electron microscopy
EMEM Eagle's Minimum Essential Medium
EMT Epithelial-to-mesencymal transition
ESCRT Endosomal sorting complex required for transport
EVs Extracellular vesicles
FAP Familial adenomatous polyposis
FBS Fetal bovine serum
FLOT1 Flotillin-1
GM130 Golgin
GTP Guanosine triphosphate
HRP Horseradish peroxidase
HSPG Heparan sulphate proteoglycan
IBAQ Intensity based absolute quantification
ILVs Intraluminal vesicles
ISEV International Society for Extracellular Vesicles
KRAS Kirsten rat sarcoma viral oncogene homolog
X
LARC Locally advanced rectal cancer
MAPK Mitogen-activated protein kinase
MMP Matrix metalloproteinase
MS Mass spectrometry
MVB Multivesicular body
NRAS Neuroblastoma RAS viral oncogene homolog
NT5E Ecto-5’nucleotidase
NTA Nanoparticle tracking analysis
OCR Oxygen consumption rate
OUS Oslo University Hospital
PARK7 Protein deglycase DJ-1
PBS Phosphate-buffered saline
PCF Proteomics Core Facility
PDCD6IP Programmed cell death 6-interacting protein (ALIX)
PM Plasma membrane
PPI Protein-protein interaction
PTEN Phosphatase and tensin homolog
PVDF Polyvinylidene difluoride membrane
RPMI Roswell Park Memorial Institute medium
SDS Sodium dodecyle sulfate
SERPINE1 Plasminogen activator inhibitor-1 (PAI-1)
SMAD Mothers against decapentaplegic homolog
SR1 Sorcin
TEM Transmission electron microscopy
TfR Transferrin receptor
TGF-β Transforming growth factor β
TSG101 Tumor susceptibility gene 101
uPa Urokinase-type plasminogen activator
WR Working reagent
YWHAZ 14.3.3 protein zeta/delta
XI
Table of Contents 1 Introduction ...................................................................................................................... 1
1.1 Cancer ............................................................................................................................... 1
1.1.1 Metastasis and the tumor microenvironment ............................................................ 1
1.1.2 Metabolism ................................................................................................................ 2
1.1.3 Melanoma .................................................................................................................. 3
1.1.4 Colorectal cancer ....................................................................................................... 5
1.2 Exosomes ......................................................................................................................... 7
1.2.1 What are exosomes? .................................................................................................. 7
1.2.2 Biogenesis and secretion ........................................................................................... 7
1.2.3 Molecular composition of exosomes ......................................................................... 9
1.2.4 Interactions of exosomes with recipient cells ......................................................... 11
1.2.5 Importance in normal physiology ........................................................................... 12
1.2.6 Importance in cancer ............................................................................................... 12
1.2.6.1 Local effects of tumor-derived exosomes ........................................................ 13
1.2.6.2 Systemic effects of tumor-derived exosomes ................................................... 14
1.2.6.3 Tumor-derived exosomes and therapy ............................................................. 15
1.3 Exosomes as circulating biomarkers .............................................................................. 15
1.4 Isolation and characterization of exosomes in a potential clinical setting ..................... 15
1.4.1 Isolation of exosomes .............................................................................................. 16
1.4.2 Characterization of exosomes ................................................................................. 17
1.4.2.1 Nanoparticle Tracking Analysis (NTA) ........................................................... 17
1.4.2.2 Transmission Electron Microscopy .................................................................. 18
1.4.2.3 Mass spectrometry (MS) .................................................................................. 18
1.4.2.4 Western blot ..................................................................................................... 19
1.4.2.5 Simple Western protein analysis with Peggy Sue™ ........................................ 20
1.5 Aims of the study ........................................................................................................... 22
2 Materials and Methods .................................................................................................. 23
2.1 Cell lines ......................................................................................................................... 23
2.1.1 Cell culturing ........................................................................................................... 23
2.1.2 Subculturing ............................................................................................................ 24
XII
2.1.3 Freezing ................................................................................................................... 24
2.1.4 Thawing ................................................................................................................... 24
2.1.5 Cell lysates .............................................................................................................. 24
2.2 Blood plasma from LARC patients ................................................................................ 25
2.3 Exosome purification by differential centrifugation ...................................................... 25
2.4 Nanoparticle Tracking Analysis (NTA) ......................................................................... 26
2.5 Electron Microscopy ...................................................................................................... 27
2.6 BCA assay for estimation of protein concentrations ...................................................... 27
2.7 Western blotting and immunodetection ......................................................................... 27
2.7.1 Gel electrophoresis .................................................................................................. 27
2.7.2 Blotting .................................................................................................................... 28
2.7.3 Antibody incubation and detection ......................................................................... 28
2.8 Simple Western system .................................................................................................. 29
2.9 Fluorescent staining of exosomes and internalization studies ....................................... 31
2.9.1 Staining of exosomes .............................................................................................. 32
2.9.2 Co-culturing of stained exosomes with cells ........................................................... 32
2.10 Metabolic assay ............................................................................................................ 33
2.10.1 XF Cell Mito Stress Test Assay ............................................................................ 33
2.11 Mass spectrometry (MS) .............................................................................................. 34
2.12 Inhibition analysis ........................................................................................................ 34
3 Results ............................................................................................................................. 37
3.1 Characterization of exosomes from melanoma cell lines with regard to methodological
evaluation ............................................................................................................................. 37
3.1.1 Protein analysis of pelleted material ....................................................................... 38
3.1.2 Morphology and size distribution analysis .............................................................. 42
3.2 Simple Western analysis of proteins in melanoma-derived vesicles ............................. 44
3.2.1 B7-H3 ...................................................................................................................... 45
3.2.2 N-cadherin ............................................................................................................... 45
3.2.3 CD73 ....................................................................................................................... 48
3.2.4 N-cadherin in brain metastasis cell lines ................................................................. 49
3.3 Characterization of exosomes from colorectal cell lines ............................................... 50
3.3.1 Protein expression profiling of RKO cells and exosomes ....................................... 51
3.3.2 Validation of the exosomal identity of the RKO isolated vesicles ......................... 52
XIII
3.3.3 Validation of selected proteins in RKO-derived exosomes by Simple Western
analysis ............................................................................................................................. 53
3.4 Characterization of exosomes from plasma of LARC patients ...................................... 57
3.4.1 Size distribution and protein analysis of exosomes from plasma ........................... 57
3.4.2 Validation of the markers detected in RKO exosomes ........................................... 59
3.5 Melmet5 exosomes are internalized by Melmet1 and Wi38 cells in vitro ..................... 60
3.6 Metabolic analysis of fibroblasts co-cultured with Melmet5 exosomes ........................ 61
4 Discussion ........................................................................................................................ 63
4.1 Exploring protocol adjustments ..................................................................................... 63
4.1.1 The tetraspanins and Flotillin-1 are not specific to exosomes ................................ 63
4.1.2 G-force reduction influences yield and purity ......................................................... 64
4.2 Expression of proteins in melanoma cells and cell-derived vesicles ............................. 66
4.3 Proteomic characterization of RKO exosomes .............................................................. 69
4.3.1 Validation of selected proteins detected by mass spectrometry .............................. 70
4.4 Characterization of plasma-derived exosomes ............................................................... 71
4.5 Functional studies of melanoma exosomes .................................................................... 72
4.5.1 Melmet5 exosomes are internalized by melanoma cells and fibroblasts ................ 72
4.5.2 Metabolic activity of stroma cells remains unchanged after uptake of cancer-
derived exosomes ............................................................................................................. 73
5 Concluding remarks ....................................................................................................... 75
Appendix A: Materials and Equipment .................................................................................... 76
Appendix B: Reagent recipes ................................................................................................... 80
Supplementary figures .............................................................................................................. 81
References ................................................................................................................................ 83

XIV
1
1 Introduction
1.1 Cancer
Cancer is a collective term for a group of diseases where abnormally dividing cells form a
tumor. The tumor is called malignant if it has the capacity to invade adjacent tissues and
spread to distant organs. This is in contrast to a benign tumor, which expands within the limits
of the original tissue. Malignant tumors modify numerous cellular mechanisms which
collectively fuel unrestrained growth and block death signals. These are complex events that
Hanahan and Weinberg have proposed grouping into eight distinct categories referred to as
the “Hallmarks of cancer” [1].
One cancer hallmark is genome instability, which enables cancer cells to accumulate
mutations at an abnormal rate. In cancer, two groups of genes, proto-oncogenes and tumor-
suppressor genes, are frequently mutated. The former regulate the flow of growth-stimulatory
signals, while the latter constrain cell proliferation. In normal cells, these cancer critical genes
maintain the balance between cell survival and cell death. In tumor cells, mutations transform
the proto-oncogenes into their abnormal counterparts called oncogenes, which become
translated into hyper activated proteins. Such mutations are called gain-of-function mutations.
Conversely, loss-of-function mutations in tumor-suppressor genes lead to silenced proteins.
Most often, to transform normal cells into malignant ones, mutations in several genes are
required.
1.1.1 Metastasis and the tumor microenvironment
In the course of cancer progression, malignant cells accumulate more mutations and may
become metastatic i.e. acquire the ability to form secondary tumors at distant locations.
Metastasis occurs when malignant cells dissociate from the primary tumor and travel through
the bloodstream or through the lymphatic system. As they arrive at distant organs, cancer cells
may implant and proliferate, forming a secondary tumor called a metastasis. Metastatic
disease is difficult to treat as complete surgical removal of metastases is often clinically
impossible, and as patients frequently develop resistance to existing therapies. Metastasis is,
therefore, the leading cause of cancer mortality.
2
Although genetic changes in cancer cells enable metastasis, it is also important to recognize
the role of the tumor microenvironment in this process. The tumor microenvironment
encompasses the heterogeneous bulk of malignant cells intertwined with non-malignant
stromal cells and extracellular matrix [2]. In this complex structure, both malignant and non-
malignant cells produce and release an array of molecular signals that enhance the growth of
the primary tumor.
According to one hypothesis, tumor-derived signals are able to modulate the local
microenvironment at metastatic sites prior to the arrival of cancer cells. This leads to the
formation of a “premetastatic niche” [3]. This conceptual framework was established after
evidence emerged, showing changes in the tissue environment at distant sites before the influx
of cancer cells [3]. Supposedly, after its formation, the premetastatic niche promotes
attachment, survival, and growth of wandering cancer cells.
1.1.2 Metabolism
Metabolism is responsible for the energy homeostasis in cells. Metabolism includes the
conversion of glucose to pyruvate through a series of biochemical reactions termed
glycolysis. Pyruvate is furthered to mitochondria where it is oxidized completely as O2 is
consumed in this process. The energy released in this degradation cycle is used for the
production of adenosine triphosphate (ATP) - the energy currency of the cell.
In anaerobic conditions, drop in O2 levels forces cells to convert pyruvate into lactate.
Importantly, many cancer cells have shown preference towards glycolysis and lactate
formation even under sufficient O2 supplies. This is termed aerobic glycolysis or the
“Warburg effect”, named after Otto Warburg who first described it. Such altered energy
metabolism has been recognized as a hallmark of cancer [1].
To prevent intracellular acidification, cells secrete the lactate produced through aerobic
glycolysis, into the extracellular environment. Interestingly, studies have shown that cancer
activated fibroblasts in the microenvironment of the tumor may utilize aerobic glycolysis and
secrete lactate into their surroundings. This lactate is then picked up by some cancer cells and
used as a main energy source, a phenomenon termed “reverse Warburg effect” [4].
3
1.1.3 Melanoma
Malignant melanoma is the most aggressive type of skin cancer, prone to rapid propagation. It
arises from cells resident in the epidermal layer of the skin, called melanocytes, which
produce the dark pigment called melanin. Melanin protects the skin against the harmful
effects of ultra-violet radiation, as it causes increased pigmentation of the skin.
Norway has experienced a nearly ten-fold increase in the occurrence of malignant melanoma
over the past 60 years. It is the fifth most frequent cancer form in the country accounting for
86% of the skin cancer-related deaths [5]. Among young adults in Norway, malignant
melanoma is the second most widespread cancer [5, 6].
The malignant transformation of normal melanocytes is described as a multistep process
(Figure 1.1) [7]. In the beginning, due to one or several mutations, melanocytes increase their
proliferation, forming a nevus on the skin. Additional mutations enable the nevus to progress
further towards a premalignant lesion. This is followed by a phase of radial-growth where
neval melanocytes further increase their proliferation and survival capacity. Advancing into a
vertical-growth phase, the cells acquire the ability to breach the basement membrane and to
invade the inner layers of the skin. In the final phase of melanoma progression, the malignant
cells reach the circulation and metastasize to other tissues.
Numerous molecular changes are associated with the malignant transformation of
melanocytes. The majority of melanomas harbor a mutation in the BRAF (~50%) or NRAS
(~15%) oncogenes [7]. These mutations lead to abnormal activation of the mitogen-activated
protein kinase (MAPK) pathway (Figure 1.2). Active MAPK pathway is associated with
increased proliferation of melanocytes during the early onset of nevi formation. Additional
mutations are needed to stimulate the progression of a benign nevus towards melanoma. The
inactivation of tumor suppressor genes, such as PTEN and CDKN2A, helps melanocytes to
overcome mechanisms controlling cell cycle and cell survival, and to become malignant [7,
8].
The progress towards melanoma invasion and metastasis involves changes in cell to cell
adhesion. Upon transition from the radial to the vertical growth phase, melanoma cells alter
their expression of cadherins, cell surface molecules that mediate cell to cell contacts [7, 9].
The cadherins have multiple isoforms. Isoform switching is characteristic in normal
development and it is recapitulated in tumor progression [10]. The switch from E-cadherin to
4
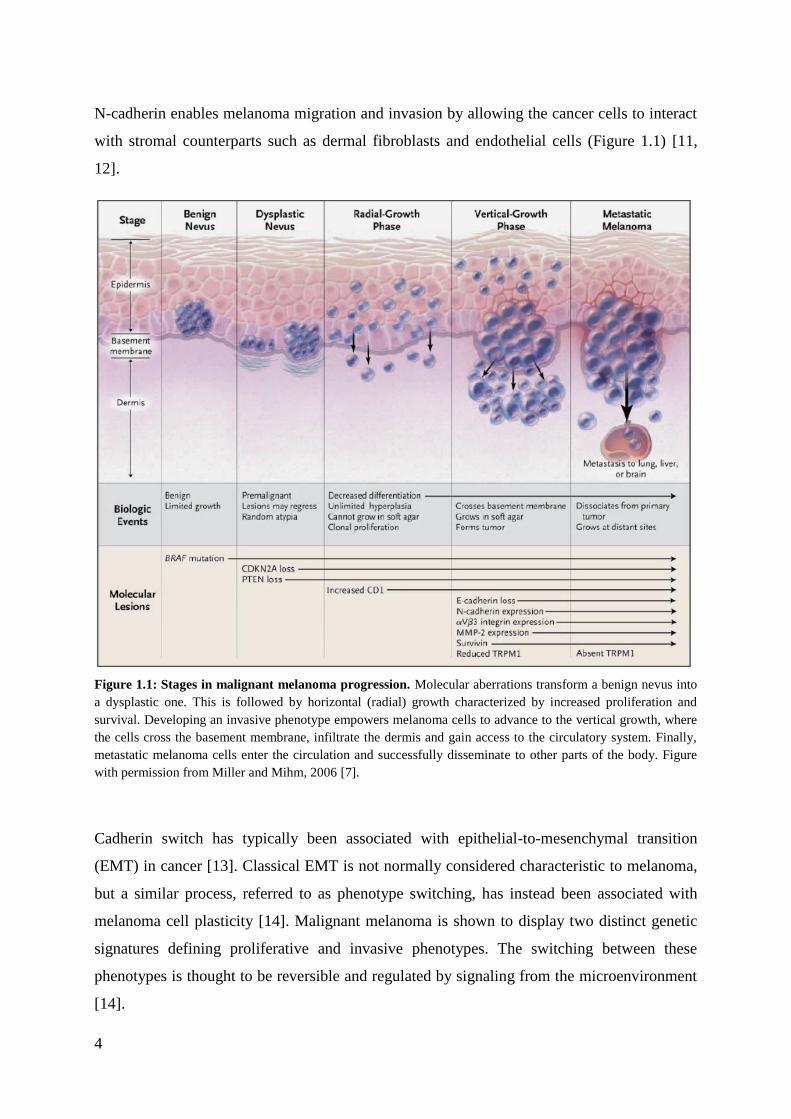
N-cadherin enables melanoma migration and invasion by allowing the cancer cells to interact
with stromal counterparts such as dermal fibroblasts and endothelial cells (Figure 1.1) [11,
12].
Figure 1.1: Stages in malignant melanoma progression. Molecular aberrations transform a benign nevus into
a dysplastic one. This is followed by horizontal (radial) growth characterized by increased proliferation and
survival. Developing an invasive phenotype empowers melanoma cells to advance to the vertical growth, where
the cells cross the basement membrane, infiltrate the dermis and gain access to the circulatory system. Finally,
metastatic melanoma cells enter the circulation and successfully disseminate to other parts of the body. Figure
with permission from Miller and Mihm, 2006 [7].
Cadherin switch has typically been associated with epithelial-to-mesenchymal transition
(EMT) in cancer [13]. Classical EMT is not normally considered characteristic to melanoma,
but a similar process, referred to as phenotype switching, has instead been associated with
melanoma cell plasticity [14]. Malignant melanoma is shown to display two distinct genetic
signatures defining proliferative and invasive phenotypes. The switching between these
phenotypes is thought to be reversible and regulated by signaling from the microenvironment
[14].
5
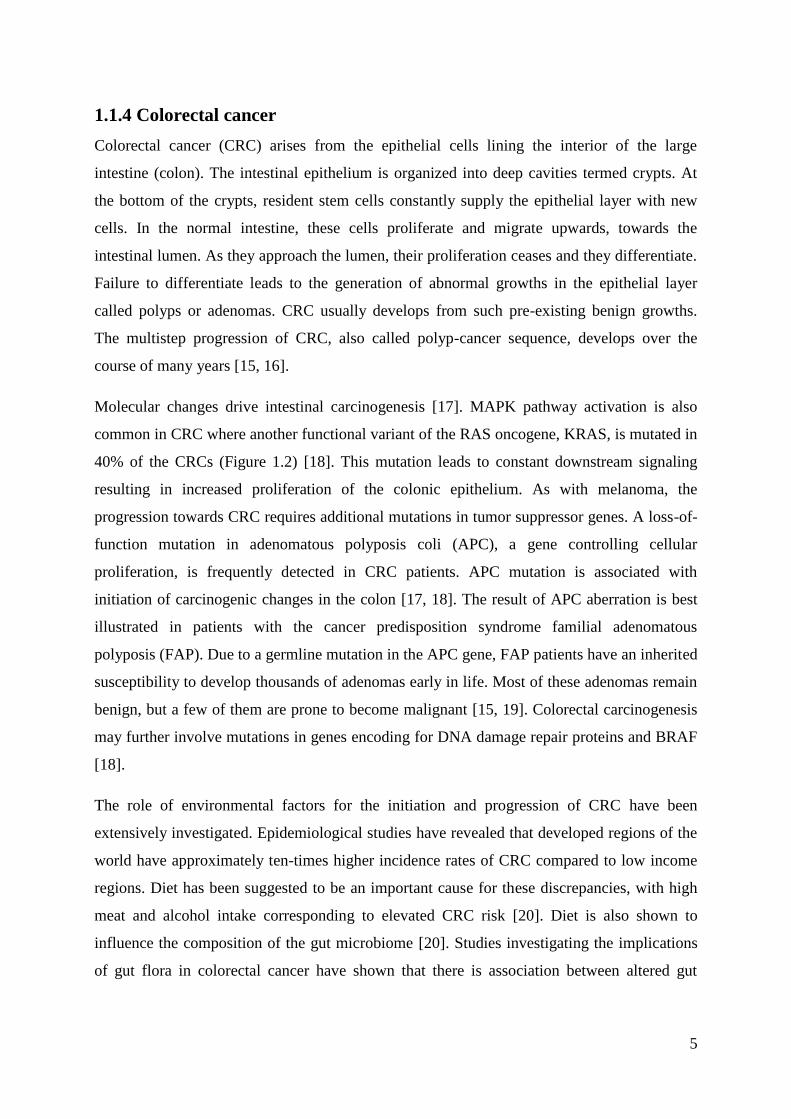
1.1.4 Colorectal cancer
Colorectal cancer (CRC) arises from the epithelial cells lining the interior of the large
intestine (colon). The intestinal epithelium is organized into deep cavities termed crypts. At
the bottom of the crypts, resident stem cells constantly supply the epithelial layer with new
cells. In the normal intestine, these cells proliferate and migrate upwards, towards the
intestinal lumen. As they approach the lumen, their proliferation ceases and they differentiate.
Failure to differentiate leads to the generation of abnormal growths in the epithelial layer
called polyps or adenomas. CRC usually develops from such pre-existing benign growths.
The multistep progression of CRC, also called polyp-cancer sequence, develops over the
course of many years [15, 16].
Molecular changes drive intestinal carcinogenesis [17]. MAPK pathway activation is also
common in CRC where another functional variant of the RAS oncogene, KRAS, is mutated in
40% of the CRCs (Figure 1.2) [18]. This mutation leads to constant downstream signaling
resulting in increased proliferation of the colonic epithelium. As with melanoma, the
progression towards CRC requires additional mutations in tumor suppressor genes. A loss-of-
function mutation in adenomatous polyposis coli (APC), a gene controlling cellular
proliferation, is frequently detected in CRC patients. APC mutation is associated with
initiation of carcinogenic changes in the colon [17, 18]. The result of APC aberration is best
illustrated in patients with the cancer predisposition syndrome familial adenomatous
polyposis (FAP). Due to a germline mutation in the APC gene, FAP patients have an inherited
susceptibility to develop thousands of adenomas early in life. Most of these adenomas remain
benign, but a few of them are prone to become malignant [15, 19]. Colorectal carcinogenesis
may further involve mutations in genes encoding for DNA damage repair proteins and BRAF
[18].
The role of environmental factors for the initiation and progression of CRC have been
extensively investigated. Epidemiological studies have revealed that developed regions of the
world have approximately ten-times higher incidence rates of CRC compared to low income
regions. Diet has been suggested to be an important cause for these discrepancies, with high
meat and alcohol intake corresponding to elevated CRC risk [20]. Diet is also shown to
influence the composition of the gut microbiome [20]. Studies investigating the implications
of gut flora in colorectal cancer have shown that there is association between altered gut
6
microbiota and the risk of colorectal cancer [21]. Whether the microbiome has the potential to
directly induce carcinogenesis, however, still remains to be clarified [22].
In 2014, combined 4166 new cases of cancer of the colon and the rectum were registered in
Norway. This makes this cancer the second most common malignancy in the country [5].
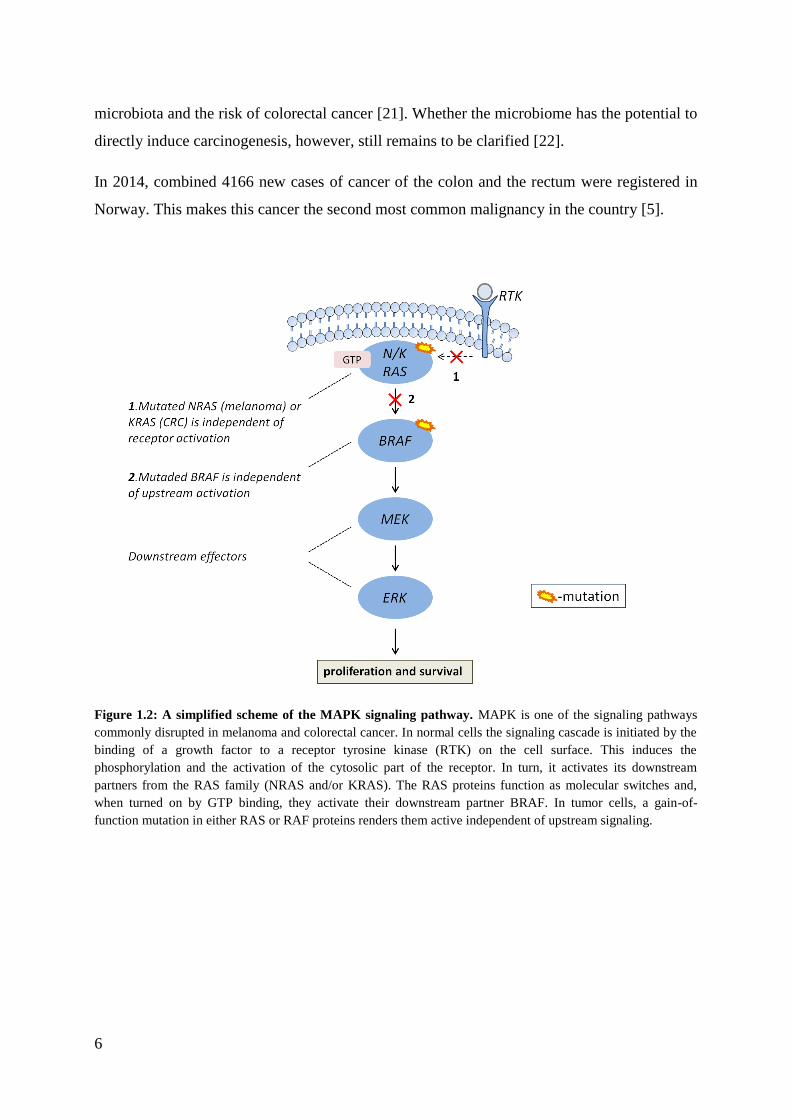
Figure 1.2: A simplified scheme of the MAPK signaling pathway. MAPK is one of the signaling pathways
commonly disrupted in melanoma and colorectal cancer. In normal cells the signaling cascade is initiated by the
binding of a growth factor to a receptor tyrosine kinase (RTK) on the cell surface. This induces the
phosphorylation and the activation of the cytosolic part of the receptor. In turn, it activates its downstream
partners from the RAS family (NRAS and/or KRAS). The RAS proteins function as molecular switches and,
when turned on by GTP binding, they activate their downstream partner BRAF. In tumor cells, a gain-of-
function mutation in either RAS or RAF proteins renders them active independent of upstream signaling.
7
1.2 Exosomes
Exosomes are membrane-bound containers filled with bimolecular cargo. They are produced
by most, if not all eukaryotic cells, and secreted into the extracellular space as vesicles.
Exosomes are stable structures that are capable of passaging into biological fluids such as
blood and urine. They facilitate intercellular communication by transferring their contents to
recipient cells. Their biological activity and structural strength suggest involvement in
physiological and pathological processes. Exosomes have attracted a lot of attention recently
due to their potential clinical application as non invasive biomarkers.
1.2.1 What are exosomes?
In the 1980s, exosomes were considered “cellular garbage collectors” exploited by cells to
externalize waste products. This view was established after several investigations
demonstrated that, during their maturation, the hematopoietic precursor cells called
reticulocytes use exosomes to remove their membrane receptor transferrin (TfR) [23-25].
Later, it was shown that antigen-presenting cells (APCs) can induce T cell responses through
the secretion of antigen-presenting exosomes [26, 27]. Thus exosomes were identified as
mediators of intercellular communication. This idea was further reinforced after it was
demonstrated that, besides proteins, exosomes carry functional mRNA- and microRNAs
which they are able to transfer between cells [28]. Subsequent investigations on this RNA
shuttling mechanism confirmed that exosomes are biologically functional entities that can
influence the phenotype and the behavior of recipient cells [29, 30]. All together, these studies
contributed to establish the concept that, beyond cellular contacts and soluble factors, there is
another mode of cell to cell communication which involves exosomes.
1.2.2 Biogenesis and secretion
Exosomes are only one type of a wider group of heterogeneous vesicles called extracellular
vesicles (EVs), which are produced and released by cells [31]. EVs are distinct in terms of
size and biogenesis and, in addition to exosomes, they include apoptotic bodies and
microvesicles (Figure 1.3). Apoptotic bodies, 1000-5000 nm in diameter, are produced and
released by dying cells which undergo apoptosis. Microvesicles are 150-1000 nm, formed by
“pinching off” from the plasma membrane. Exosomes are 30 to 150 nm in diameter and
originate in multivesicular bodies (MVBs), which are organelles involved in the intracellular
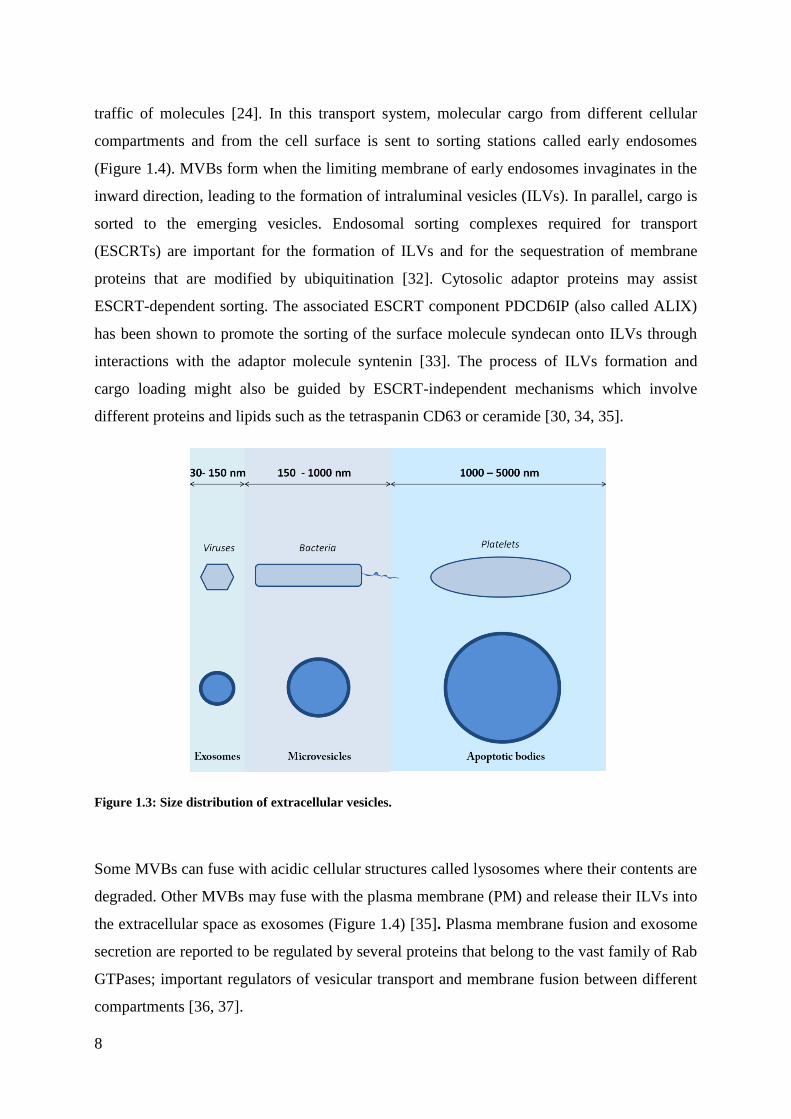
8
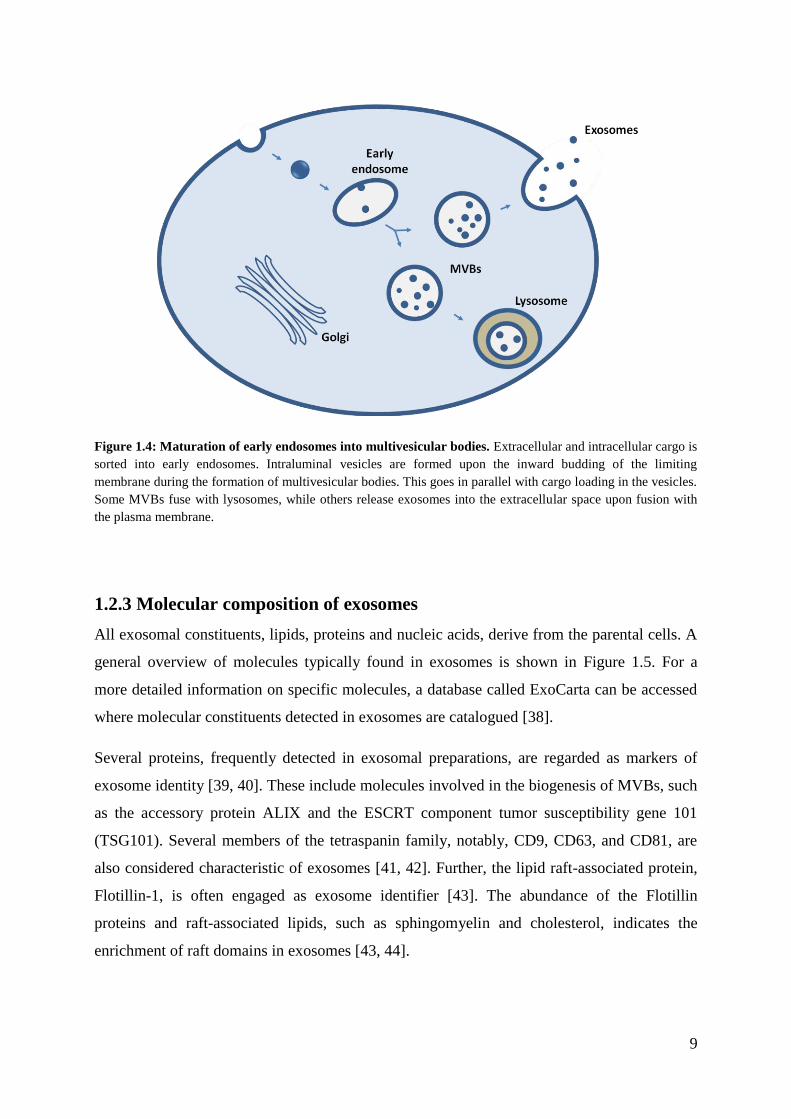
traffic of molecules [24]. In this transport system, molecular cargo from different cellular
compartments and from the cell surface is sent to sorting stations called early endosomes
(Figure 1.4). MVBs form when the limiting membrane of early endosomes invaginates in the
inward direction, leading to the formation of intraluminal vesicles (ILVs). In parallel, cargo is
sorted to the emerging vesicles. Endosomal sorting complexes required for transport
(ESCRTs) are important for the formation of ILVs and for the sequestration of membrane
proteins that are modified by ubiquitination [32]. Cytosolic adaptor proteins may assist
ESCRT-dependent sorting. The associated ESCRT component PDCD6IP (also called ALIX)
has been shown to promote the sorting of the surface molecule syndecan onto ILVs through
interactions with the adaptor molecule syntenin [33]. The process of ILVs formation and
cargo loading might also be guided by ESCRT-independent mechanisms which involve
different proteins and lipids such as the tetraspanin CD63 or ceramide [30, 34, 35].
Figure 1.3: Size distribution of extracellular vesicles.
Some MVBs can fuse with acidic cellular structures called lysosomes where their contents are
degraded. Other MVBs may fuse with the plasma membrane (PM) and release their ILVs into
the extracellular space as exosomes (Figure 1.4) [35]. Plasma membrane fusion and exosome
secretion are reported to be regulated by several proteins that belong to the vast family of Rab
GTPases; important regulators of vesicular transport and membrane fusion between different
compartments [36, 37].
9
Figure 1.4: Maturation of early endosomes into multivesicular bodies. Extracellular and intracellular cargo is
sorted into early endosomes. Intraluminal vesicles are formed upon the inward budding of the limiting
membrane during the formation of multivesicular bodies. This goes in parallel with cargo loading in the vesicles.
Some MVBs fuse with lysosomes, while others release exosomes into the extracellular space upon fusion with
the plasma membrane.
1.2.3 Molecular composition of exosomes
All exosomal constituents, lipids, proteins and nucleic acids, derive from the parental cells. A
general overview of molecules typically found in exosomes is shown in Figure 1.5. For a
more detailed information on specific molecules, a database called ExoCarta can be accessed
where molecular constituents detected in exosomes are catalogued [38].
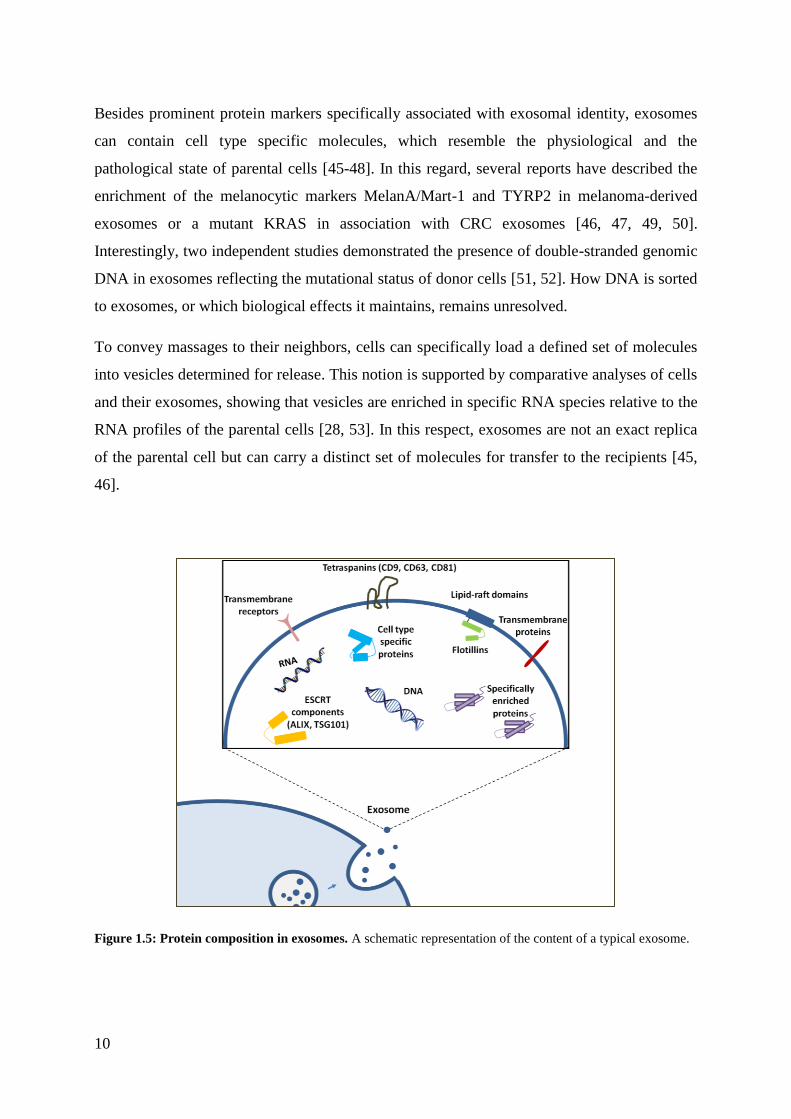
Several proteins, frequently detected in exosomal preparations, are regarded as markers of
exosome identity [39, 40]. These include molecules involved in the biogenesis of MVBs, such
as the accessory protein ALIX and the ESCRT component tumor susceptibility gene 101
(TSG101). Several members of the tetraspanin family, notably, CD9, CD63, and CD81, are
also considered characteristic of exosomes [41, 42]. Further, the lipid raft-associated protein,
Flotillin-1, is often engaged as exosome identifier [43]. The abundance of the Flotillin
proteins and raft-associated lipids, such as sphingomyelin and cholesterol, indicates the
enrichment of raft domains in exosomes [43, 44].
10
Besides prominent protein markers specifically associated with exosomal identity, exosomes
can contain cell type specific molecules, which resemble the physiological and the
pathological state of parental cells [45-48]. In this regard, several reports have described the
enrichment of the melanocytic markers MelanA/Mart-1 and TYRP2 in melanoma-derived
exosomes or a mutant KRAS in association with CRC exosomes [46, 47, 49, 50].
Interestingly, two independent studies demonstrated the presence of double-stranded genomic
DNA in exosomes reflecting the mutational status of donor cells [51, 52]. How DNA is sorted
to exosomes, or which biological effects it maintains, remains unresolved.
To convey massages to their neighbors, cells can specifically load a defined set of molecules
into vesicles determined for release. This notion is supported by comparative analyses of cells
and their exosomes, showing that vesicles are enriched in specific RNA species relative to the
RNA profiles of the parental cells [28, 53]. In this respect, exosomes are not an exact replica
of the parental cell but can carry a distinct set of molecules for transfer to the recipients [45,
46].
Figure 1.5: Protein composition in exosomes. A schematic representation of the content of a typical exosome.
11
1.2.4 Interactions of exosomes with recipient cells
Exosomes can deliver their cargo to recipient cells through direct interactions between the
exosomes and the cell membrane. Cargo delivery was demonstrated by independent studies
focusing on the exosomal shuttle of cell type specific or species specific proteins and RNAs
[28-30, 54]. Direct visualization of stained exosomes by fluorescent microscopy has further
provided evidence for exosome-cell interactions [46, 55].
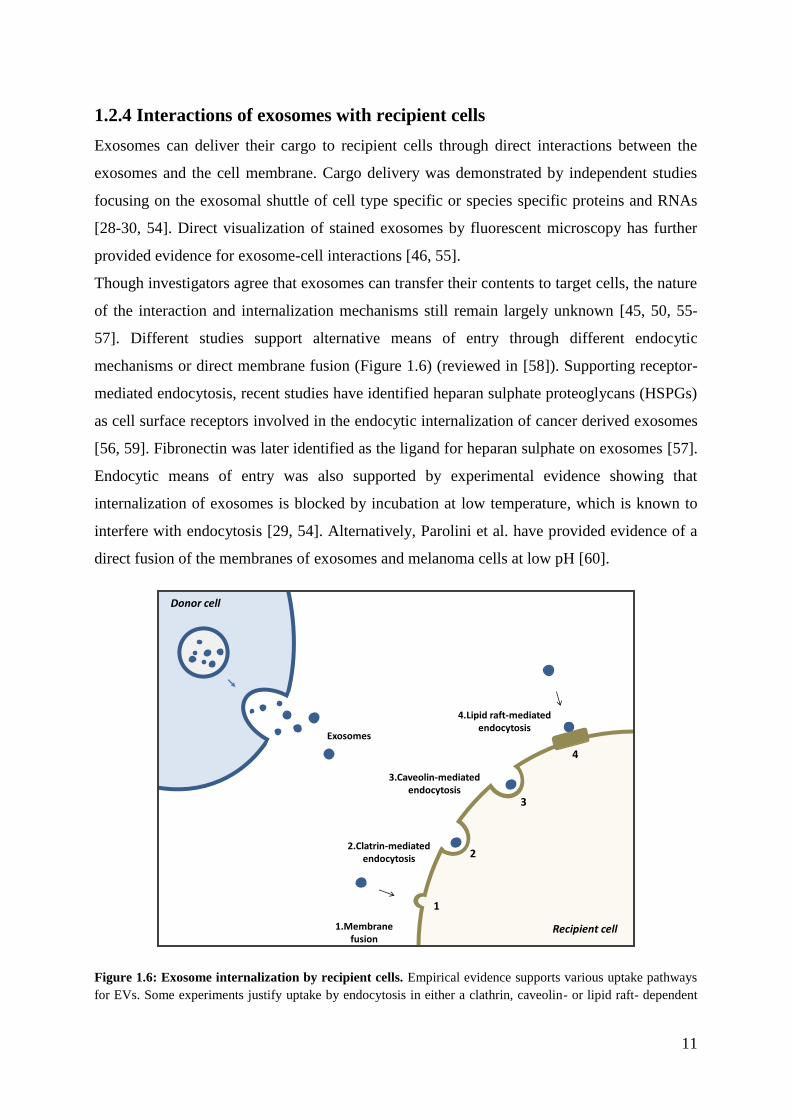
Though investigators agree that exosomes can transfer their contents to target cells, the nature
of the interaction and internalization mechanisms still remain largely unknown [45, 50, 55-
57]. Different studies support alternative means of entry through different endocytic
mechanisms or direct membrane fusion (Figure 1.6) (reviewed in [58]). Supporting receptor-
mediated endocytosis, recent studies have identified heparan sulphate proteoglycans (HSPGs)
as cell surface receptors involved in the endocytic internalization of cancer derived exosomes
[56, 59]. Fibronectin was later identified as the ligand for heparan sulphate on exosomes [57].
Endocytic means of entry was also supported by experimental evidence showing that
internalization of exosomes is blocked by incubation at low temperature, which is known to
interfere with endocytosis [29, 54]. Alternatively, Parolini et al. have provided evidence of a
direct fusion of the membranes of exosomes and melanoma cells at low pH [60].
1.Membrane fusion
2.Clatrin-mediated endocytosis
3.Caveolin-mediated endocytosis
4.Lipid raft-mediated endocytosis
Recipient cell
Donor cell
Exosomes
1
4
3
2
Figure 1.6: Exosome internalization by recipient cells. Empirical evidence supports various uptake pathways
for EVs. Some experiments justify uptake by endocytosis in either a clathrin, caveolin- or lipid raft- dependent
12
manner. Yet some evidence support membrane fusion as a delivery mechanism for vesicular cargo to the cell
interior.
1.2.5 Importance in normal physiology
The presence of exosomes in normal biological fluids indicates that they are involved in
physiological processes. Of these, the role of exosomes in the immune system has been the
most extensively studied [61].
The maternal-fetal tolerance, which is vital during pregnancy, has been shown to involve the
placental release of exosomes that carry immunoactive molecules. These placenta-derived
exosomes modulate the immunity of the mother by suppressing the activation of maternal T
cells, hence establishing a fertile environment for a successful pregnancy [62]. The immune
regulatory capacity of exosomes is also implicated in autoimmune diseases. It has been shown
that exosomes released by cells in the thymus induce the maturation of naïve T cells into Fox3
positive T regulatory (Treg) cells, which, in turn, suppress their autoreactive counterparts
[48].
Exosomes are also implicated in non-immunological processes. As initially described by
Johnstone and Harding, exosomes are important during cellular differentiation, with exosomal
secretion assisting the membrane remodeling of reticulocytes [23, 24]. Maintenance of tissue
homeostasis also involves exosomes. One study showed that normal epithelial prostate cells
inhibit aberrant growth of prostate cancer cells, in vitro and in vivo, through the secretion of
exosomes that bear tumor-suppressive miRNA molecules [63].
1.2.6 Importance in cancer
Alterations in tumor microenvironment such as immune evasion, extracellular matrix
remodeling and angiogenesis are essential factors for tumor growth and invasion. The
establishment of favorable environmental conditions involves the communication between
cancer cells and their surroundings through secreted exosomes (Figure 1.7) (reviewed in
[61]).
13
Figure 1.7: A schematic overview showing possible targets of tumor-derived exosomes in the tumor
microenvironment.
1.2.6.1 Local effects of tumor-derived exosomes
It has been speculated that cancer cells produce and release more exosomes than normal cells
[64]. These tumor-derived exosomes can promote phenotypic changes in normal cells by
facilitating the horizontal transfer of oncogenic molecules. This was demonstrated in an in
vitro study in which the transfer of the miRNA modulator, Let-7i, by melanoma exosomes
induced phenotype switching and MAPK pathway activation in normal melanocytes [65].
Similarly, exosomes from a mutant KRAS-expressing colon cancer cell line were shown to
enhance the growth of wild type cells, by transmitting the mutation to them [47]. Also in
colon cancer exosomes, the transfer of the tumorigenic protein 14.3.3 ζ/δ fostered malignant
phenotype in non-malignant stromal cells [66]. Moreover, previous analyses have revealed
that cancer exosomes can trigger the differentiation of normal fibroblasts and mesenchymal
stem cells into cancer-associated stromal cells called myofibroblasts, through TGF-β activated
SMAD signaling [67, 68]. Independent studies have further shown that the extracellular
matrix metalloproteinase (MMP) inducer, CD147, is associated with vesicles shed by tumor
cells. CD147-positive vesicles stimulate the production of MMPs in fibroblasts and
endothelial cells in vitro, leading to matrix remodeling and proangiogenic activity [69, 70].
Tumor-derived exosomes exert a proangiogenic effect also by inducing the proliferation of
endothelial cells through the exosome transfer of cell cycle-related mRNAs [71].
Cancer-secreted exosomes may modulate the immune system rendering it permissive to
cancer development. It has been demonstrated that tumor exosomes decreased the
proliferation and the cytotoxic activity of NK cells [72]. Likewise, cancer-derived exosomes
might disturb T cell-mediated immune regulation. They can accomplish that by increasing the
populations of the regulatory T cells (Tregs.) [73]. At the same time, cancer exosomes
14
expressing CD39, CD73 or a Fas ligand are able to inhibit T cell activation and to induce
apoptosis in already activated T cells [74, 75].
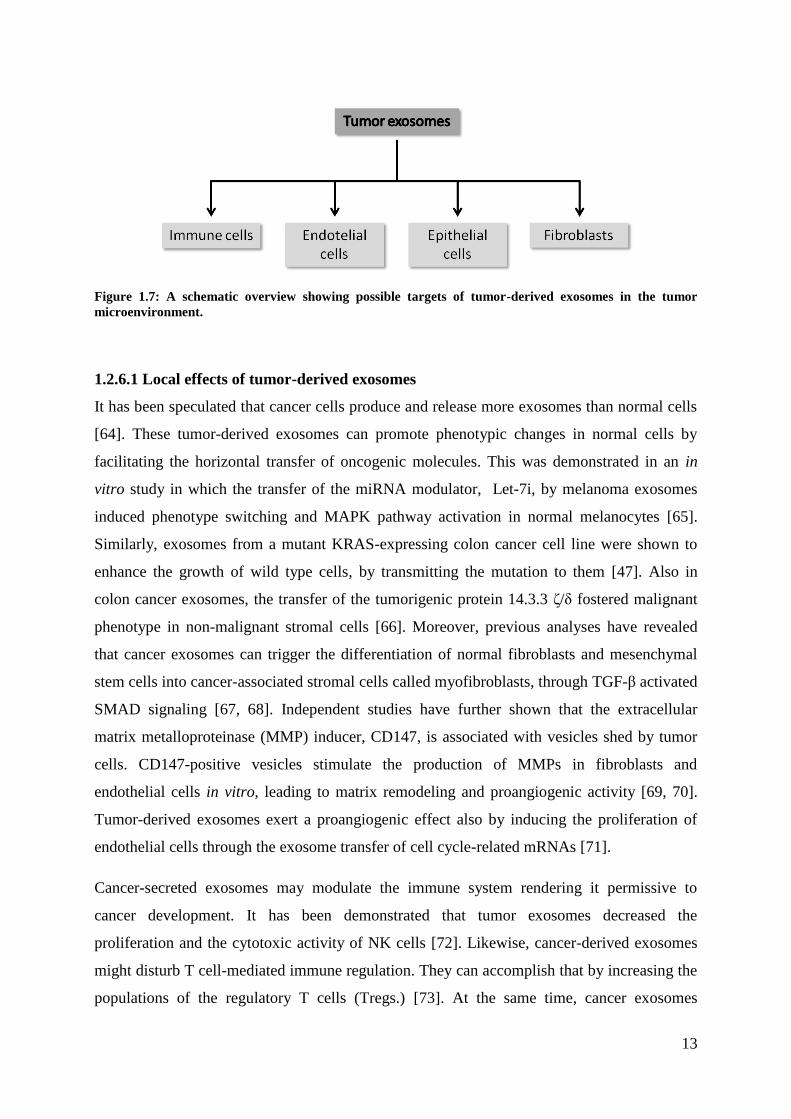
1.2.6.2 Systemic effects of tumor-derived exosomes
Communication between the primary tumor, immune system and stromal constituents at
selected metastatic sites is also considered as vital for the formation of a premetastatic niche
[2]. Exosomes mediate the cellular communication utilized by tumor cells in premetastatic
niche formation (Figure 1.8). Peinado et al. reported that melanoma-derived exosomes are
able to reprogram the bone marrow-derived progenitor cells (BMDCs) to support metastasis
[50]. It has also been demonstrated that exosomes may dictate organotropism. Exosomes from
liver-and brain-tropic tumors were shown to preferentially interact with cells at their favored
metastatic organ sites, as these interactions are dependent on integrin expression patterns [76].
Figure 1.8: The role of exosomes in the evolvement of the metastatic niche. As the cancer niche evolves into
the tumor microenvironment, tumor-released factors and exosomes are able to initiate the establishment of new
microenvironments at distant sites through recruitment of BMDCs and activation of fibroblasts in the local
stroma. Picture modified from Barcellos-Hoff, M. H. et al, 2013 [2].
15
1.2.6.3 Tumor-derived exosomes and therapy
Tumor exosomes may be involved in therapy resistance by providing protection against
cancer drugs. Analysis of exosomes isolated from chronic lymphocytic leukemia (CLL)
showed the presence of the B cell-molecular marker CD20 on the exosomal surface. CD20 is
the molecular target for the therapeutic drug rituximab. CLL cells treated with rituximab and
CLL exosomes in combination, showed a substantial decrease in rituximab binding compared
to cells treated with the drug alone [54]. Bioinformatical analysis highlighted the correlation
between overexpression of genes implicated in vesicle shedding and anticancer drug
resistance. This suggested that vesicles sequestered and exported chemotherapeutic drugs out
of cells. Fluorescent labeling and tracking of doxorubicin further confirmed this view [77].
1.3 Exosomes as circulating biomarkers
Tumor-derived exosomes, as carriers of tumor specific antigens which are readily available
from body fluids, have received a lot of attention as a source of novel biomarkers [78]. Cancer
biomarkers are molecules that are indicators of a pathological state. They are usually used to
evaluate, monitor and predict disease progression. A quality biomarker has high sensitivity for
identifying disease and high specificity towards excluding healthy individuals.
Various molecular constituents of tumor-derived exosomes have been suggested as potential
cancer biomarkers. In this regard, Llorente et al. proposed glycosphingolipids on the outer
leaflet of exosomal membranes as a biomarker for prostate cancer [44]. Alternatively,
elevated levels of the proteins CD63, Caveolin-1, MDA-9 and GRP78 in melanoma
exosomes have been shown to correlate with aggressive disease and lymph node metastasis
[79, 80].
1.4 Isolation and characterization of exosomes in a potential
clinical setting
The identification of relevant and specific exosome markers in a consistent way involves the
establishment of a robust method for vesicle separation and purification. Clinical
implementation further requires that the isolation and identification method is rapid,
reproducible and inexpensive. One of the major difficulties in exosome research is the
challenge to improve and standardize exosome purification and analysis [81].
16
1.4.1 Isolation of exosomes
Differential centrifugation is the most widely applied method for isolation of exosomes [82].
The method achieves a size separation of different EV populations present in a growth
medium or a biological fluid. It is based on a series of centrifugation steps with sequentially
increasing centrifugal forces aimed at precipitating particles with different weights. First, one
or more lower speed centrifugations (1000-2000 x g) are used to precipitate cells, platelets,
and larger apoptotic bodies from the solution. Second, forces usually between 10,000-20,000
x g are employed to pellet microvesicles, smaller apoptotic bodies, and cell debris. Finally,
smaller extracellular vesicles (EV), including exosomes, are pelleted at forces in the 100,000-
120,000 x g range [83]. Besides speed variations, several other parameters can be adjusted in
the centrifugation protocol such as centrifugation time and/or rotor type [82].
A major drawback of this technique is the issue of achieving a complete separation between
microvesicles and exosome which are similar in size and/or weight. In physical terms, size
and weight of exosomes define particle density. In this regard, the force-based precipitation is
highly dependent on vesicular density. This parameter is, however, difficult to predicted in
the case of EVs and limits the efficiency of the technique, leading to the co-precipitation of
different types of EVs [81].
To add strength to the method, gradient based techniques may be used in combination with
centrifugation to improve the separation of different vesicular populations. However, the
prolonged centrifugation time that might be required for reaching equilibrium density,
perhaps would make this technique less attractive in a diagnostic setting [83, 84].
An alternative to centrifugation is immunoaffinity isolation [81]. This method is based on the
use of magnetic beads coated with specific antibodies targeting surface antigens present on
exosomes. The drawback of this techniques lies within the lack of universal and specific
exosomal markers to ensure the complete and pure capture of all exosomes.
Another attempt to circumvent the limitations of centrifugation and marker specificity is the
development of commercial kits based on polymeric precipitation solutions [84]. One such kit
called ExoQuick-TC™ (System Biosciences) claims to effectively precipitate exosomes from
small sample volumes. However, independent studies have showed that ExoQuick-TC™
alone, or in combination with centrifugation, does not provide efficient purification of
exosomes from conditioned medium and bovine milk [84, 85].
17
1.4.2 Characterization of exosomes
Only techniques with relevance to this master thesis would be introduced and discussed in this
section.
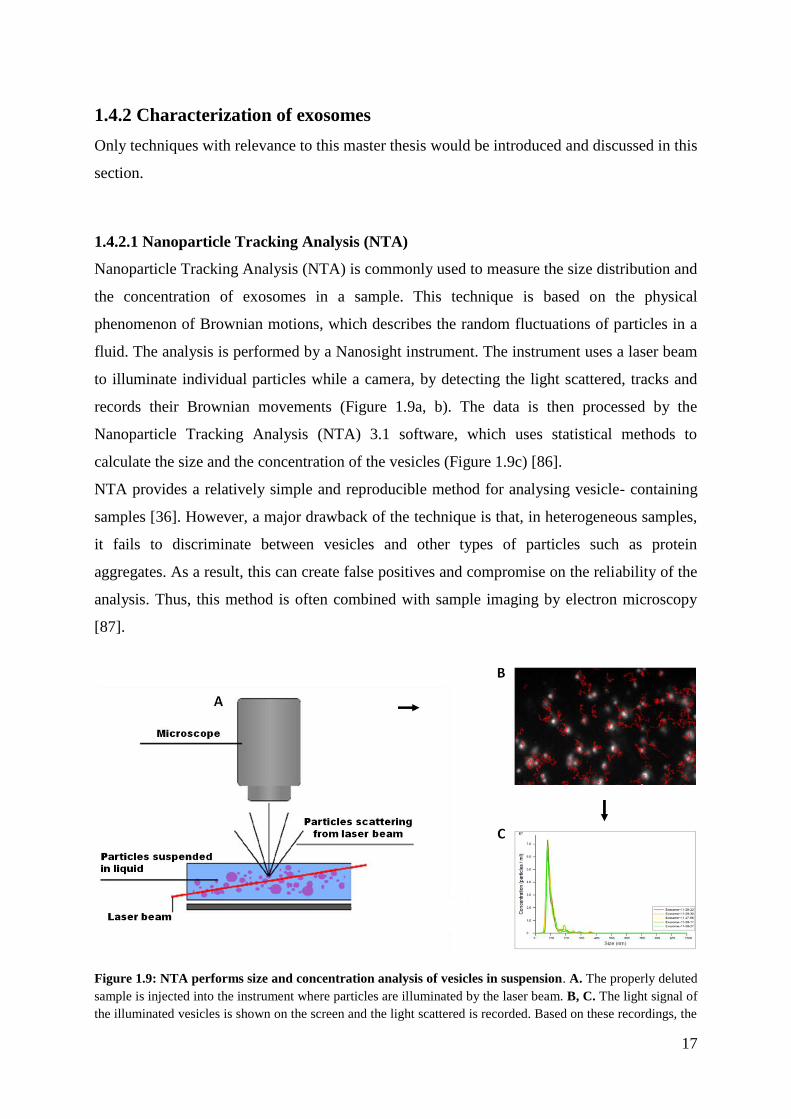
1.4.2.1 Nanoparticle Tracking Analysis (NTA)
Nanoparticle Tracking Analysis (NTA) is commonly used to measure the size distribution and
the concentration of exosomes in a sample. This technique is based on the physical
phenomenon of Brownian motions, which describes the random fluctuations of particles in a
fluid. The analysis is performed by a Nanosight instrument. The instrument uses a laser beam
to illuminate individual particles while a camera, by detecting the light scattered, tracks and
records their Brownian movements (Figure 1.9a, b). The data is then processed by the
Nanoparticle Tracking Analysis (NTA) 3.1 software, which uses statistical methods to
calculate the size and the concentration of the vesicles (Figure 1.9c) [86].
NTA provides a relatively simple and reproducible method for analysing vesicle- containing
samples [36]. However, a major drawback of the technique is that, in heterogeneous samples,
it fails to discriminate between vesicles and other types of particles such as protein
aggregates. As a result, this can create false positives and compromise on the reliability of the
analysis. Thus, this method is often combined with sample imaging by electron microscopy
[87].
Figure 1.9: NTA performs size and concentration analysis of vesicles in suspension. A. The properly deluted
sample is injected into the instrument where particles are illuminated by the laser beam. B, C. The light signal of
the illuminated vesicles is shown on the screen and the light scattered is recorded. Based on these recordings, the
18
NTA 3.1 software measures particle concentration and size. In this study, we performed five parallel
measurements of each sample. Picture A modified from (http://www.microscopy-analysis.com/blog/blog-
articles/particle-sizing-try-using-nanosight).
1.4.2.2 Transmission Electron Microscopy
The small size of exosomes requires the use of very high resolution microscopy for their
visualization. Transmission electron microscopy (TEM) is a powerful imaging technique that
enables the investigation of biological structures at a nanoscale. This is achieved by using
electron beams, instead of rays of light, to illuminate the samples, thus obtaining a very high
magnification. A number of sample processing steps, such as fixation and dehydration, are
required prior to the analysis.
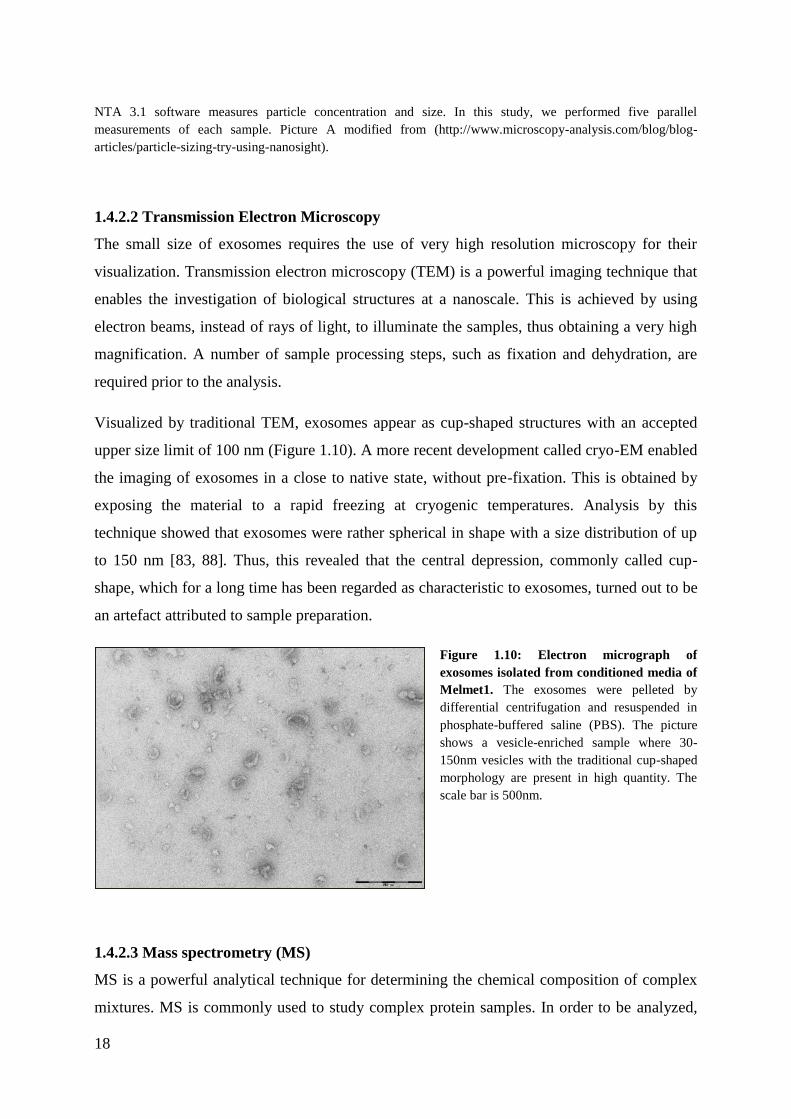
Visualized by traditional TEM, exosomes appear as cup-shaped structures with an accepted
upper size limit of 100 nm (Figure 1.10). A more recent development called cryo-EM enabled
the imaging of exosomes in a close to native state, without pre-fixation. This is obtained by
exposing the material to a rapid freezing at cryogenic temperatures. Analysis by this
technique showed that exosomes were rather spherical in shape with a size distribution of up
to 150 nm [83, 88]. Thus, this revealed that the central depression, commonly called cup-
shape, which for a long time has been regarded as characteristic to exosomes, turned out to be
an artefact attributed to sample preparation.
Figure 1.10: Electron micrograph of
exosomes isolated from conditioned media of
Melmet1. The exosomes were pelleted by
differential centrifugation and resuspended in
phosphate-buffered saline (PBS). The picture
shows a vesicle-enriched sample where 30-
150nm vesicles with the traditional cup-shaped
morphology are present in high quantity. The
scale bar is 500nm.
1.4.2.3 Mass spectrometry (MS)
MS is a powerful analytical technique for determining the chemical composition of complex
mixtures. MS is commonly used to study complex protein samples. In order to be analyzed,
19
the proteins in the sample are normally enzymatically digested into smaller peptides prior to
being introduced into the mass spectrometer and analyzed according to their mass-to-charge
ratios. MS is commonly used for the identification and characterization of proteins in
exosomal extracts [46, 89, 90].
1.4.2.4 Western blot
The presence of proteins in exosomes has traditionally been studied by western blot. This
technique is also known as immunoblotting, because antibodies are used for the detection of
specific proteins in complex protein samples. The method is semi quantitative in that it
depends on measurements of protein concentrations of both target proteins and selected
reference proteins for the loading and quantification of the investigated material. The
procedure is a combination of several techniques that include the size separation of the
proteins on a gel, their transfer to a solid surface, and the detection of the proteins of interest.
The proteins are first chemically denatured, usually by addition of sodium dodecyl sulfate
(SDS). In addition, the samples are heated to assist protein denaturation and to allow for the
SDS to bind to the open polypeptide chains, thus applying an overall negative charge to the
proteins proportional to their mass. The denatured protein samples are then loaded on a gel
containing polyacrylamide, a polymer which forms pores of distinct sizes. The gel is placed
into a chamber filled with electrophoresis buffer and an electrical current is applied to the
system. All proteins migrate towards the anode as smaller proteins travel faster than the big
ones, which are retained by the gel pores. After separation, the proteins are electrotransferred
from the gel to a membrane, a process called blotting. The proteins of interest are then
targeted with specific primary antibodies while secondary antibodies are used for
visualization. For more details see the protocol description in “Material and Methods” and
Figure 2.2.
One complication for the analysis of exosomes by western blot is posed by the lack of
marker(s) exclusive to exosomes. Although several markers have been reported as enriched in
exosomes and are frequently used as “exosome specific”, optimal exosome identifiers are still
missing. This necessitates the use of a combination of markers in western blot analysis, to
both confirm the presence of exosomes and the proportion of contaminating EV vesicles in
the isolated material. Additionally, when it comes to comparative analysis of protein contents
20
derived from different cellular compartments, the investigation is further complicated by the
absence of reliable reference proteins which should be similarly distributed across these parts.
In comparison to cellular lysates, the concentrations of exosomal lysates are often very low.
This is due to the tiny amount of material obtained after exosome purification. Together,
small sample volumes and low protein concentrations make western blot challenging.
1.4.2.5 Simple Western protein analysis with Peggy Sue™
The scarcity of exosome proteins makes less material-demanding techniques, such as Simple
Western, more attractive. Simple Western is a recently developed technology for automated
protein analysis. It is based on traditional Western blot technology, but aims at achieving
faster and more accurate results by substituting for a range of time consuming and error prone
manually performed steps. Instead of using a gel, as the traditional western immunoassay,
Simple Western performs the separation and detection of proteins in small capillaries. The
results are provided by software called Compass. The method requires between 1 and 4 µg of
protein to run the analysis. For detection, antibody dilutions (50 to 100 times) are used. A
schematic layout of the method can be found in Figure 2.3.

21
22
1.5 Aims of the study
The general focus of this master thesis will be to isolate and characterize exosomes derived
from melanoma and colorectal cancer cell lines as well as exosomes from patient plasma
samples. In the absence of an effective method that ensures purification of exosomes from
complex mixtures, vesicle research relays on enrichment techniques, form which, the most
widely applied one is differential centrifugation. As this is the main technique for exosome
purification used in our lab, methodological considerations regarding adjustments to the
isolation protocol would be addressed in the first part of this work. An attempt to optimize the
protocol, improving its purification capacity, is the motivation.
Previous studies carried out by our group have outlined the protein profile of melanoma-
derived exosomes isolated from the conditioned media of two melanoma cell lines, Melmet1
and Melmet5. We aim at validating some of these results in this thesis, in addition, to testing
the exosomal distribution of proteins, known from literature, to be present in melanoma cells.
Further, proteomic characterization of exosomes isolated from colorectal cancer cell lines
would be carried out. Some of the proteins detected in the analysis will further be validated
using antibody-based techniques. This part of the project seeks to explore the biomarker
potential of some selected protein candidates from the proteomic studies. In this regard,
selected proteins of interest can be further investigated in plasma-derived exosomes from
patients with rectal cancer.
To study the functional capacity of melanoma-derived exosomes, we would investigate
exosome uptake by other cells as well as the effect of these cancer-derived vesicles on the
recipients’ metabolism.
23
2 Materials and Methods
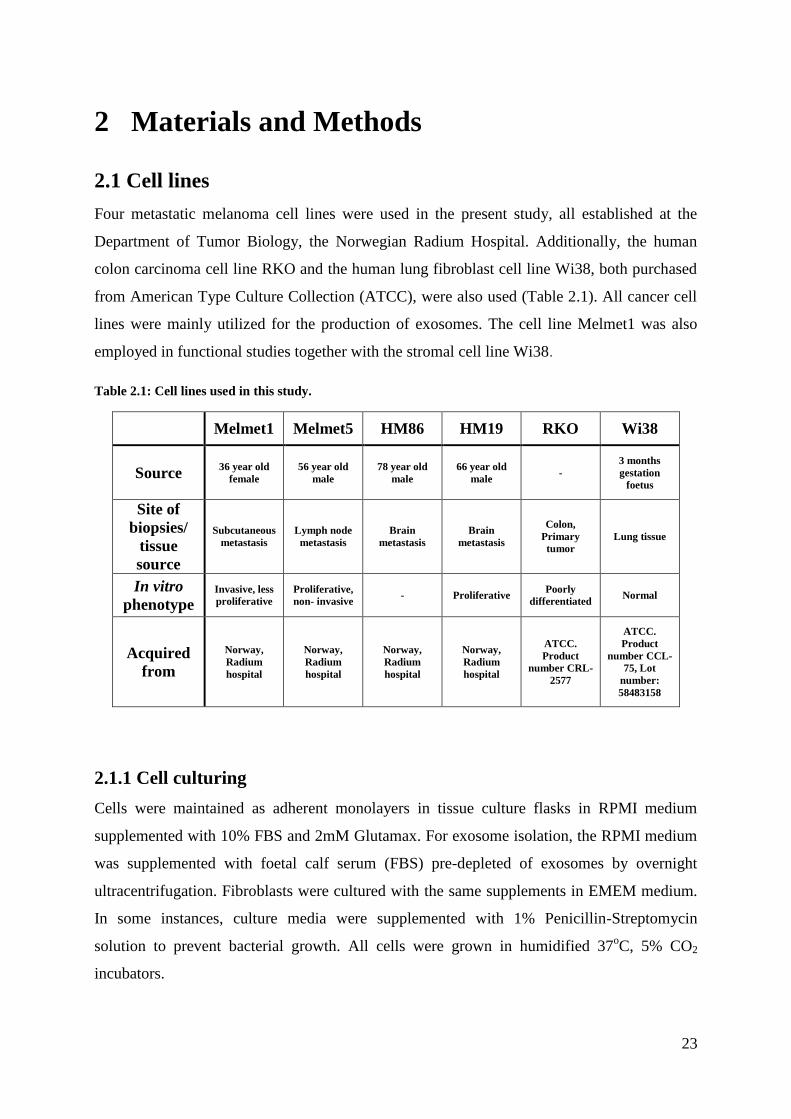
2.1 Cell lines
Four metastatic melanoma cell lines were used in the present study, all established at the
Department of Tumor Biology, the Norwegian Radium Hospital. Additionally, the human
colon carcinoma cell line RKO and the human lung fibroblast cell line Wi38, both purchased
from American Type Culture Collection (ATCC), were also used (Table 2.1). All cancer cell
lines were mainly utilized for the production of exosomes. The cell line Melmet1 was also
employed in functional studies together with the stromal cell line Wi38.
Table 2.1: Cell lines used in this study.
Melmet1 Melmet5 HM86 HM19 RKO Wi38
Source 36 year old
female
56 year old
male
78 year old
male
66 year old
male -
3 months
gestation
foetus
Site of
biopsies/
tissue
source
Subcutaneous
metastasis
Lymph node
metastasis
Brain
metastasis
Brain
metastasis
Colon,
Primary
tumor
Lung tissue
In vitro
phenotype Invasive, less
proliferative
Proliferative,
non- invasive - Proliferative
Poorly
differentiated Normal
Acquired
from
Norway,
Radium
hospital
Norway,
Radium
hospital
Norway,
Radium
hospital
Norway,
Radium
hospital
ATCC.
Product
number CRL-
2577
ATCC.
Product
number CCL-
75, Lot
number:
58483158
2.1.1 Cell culturing
Cells were maintained as adherent monolayers in tissue culture flasks in RPMI medium
supplemented with 10% FBS and 2mM Glutamax. For exosome isolation, the RPMI medium
was supplemented with foetal calf serum (FBS) pre-depleted of exosomes by overnight
ultracentrifugation. Fibroblasts were cultured with the same supplements in EMEM medium.
In some instances, culture media were supplemented with 1% Penicillin-Streptomycin
solution to prevent bacterial growth. All cells were grown in humidified 37oC, 5% CO2
incubators.
24
2.1.2 Subculturing
Cells were regularly propagated whenever they reached 80-90% confluence. In brief, the
spent cell culture media from the culture vessel was discarded and cells were washed to
remove residual media that can potentially render the dissociation agent inactive. To detach
the cells, 0,02% ethylenediaminetetraacetic acid (EDTA) was added and the flask was
incubated for 3-8 min at room temperature. RKO cells and fibroblasts were detached with a
mixture of Trypsin/EDTA and incubated for ca. 3 min at 37oC. The cell suspension was then
transferred to a tube and centrifuged at 1000 × g for 5 min after which pellets were
resuspended in growth medium. 10 µL of trypan blue dye, an agent able to penetrate through
the compromised membranes of dead cells, was mixed with an equal volume of cell
suspension, and the cell number and viability was determined using CountessTM
Automated
Cell Counter. Defined numbers of cells were then seeded out into new cell culture vessels and
placed in the incubator.
2.1.3 Freezing
Cells were handled as described above as, after counting, cells resuspended in culture media
with 10% DMSO were partitioned into tubes containing one million cells each. To avoid
fracturing of the cell membrane due to rapid freezing, the tubes were placed in a CoolCell
freezing module which allows for the slow drop of temperature. The module was then placed
in the -80oC freezer. The frozen tubes were transferred to liquid nitrogen tanks for long term
storage.
2.1.4 Thawing
Cells were thawed rapidly in a 37oC water bath for 1min and transferred to culture vessels
with pre-warmed culture medium. After given time to attach to the surface of the flasks (6-10
h), the culture media was changed in order to remove remaining DMSO.
2.1.5 Cell lysates
Confluent cells were washed with cold PBS and scraped from the culture flask. The cell
suspension was collected in a tube and centrifuged at 1000RPM for 5 min. The PBS was
removed and Ripa buffer (see Appendix B for recipe) with protease and phosphatase
25
inhibitors (Thermo Scientific) was added to the cell pellet. The sample was incubated on ice
for 1h and vortexed every 15min. Finally, samples were sonicated and stored at -80oC.
2.2 Blood plasma from LARC patients
The locally advanced rectal cancer (LARC) study is an ongoing trial focused on harvesting
exfoliated tumor cells present in the peritoneal cavity of patients with locally advanced rectal
cancer following surgical intervention. The study aims to explore the contribution of such
cells to patient outcome. The patient cohort studied has routinely been blood sampled in the
period from September 2012 to September 2014.
In the present thesis, 4-6 mL of plasma collected from 101 LARC patients was used for the
isolation of exosomes. Vesicles were purified by differential centrifugation, as described next.
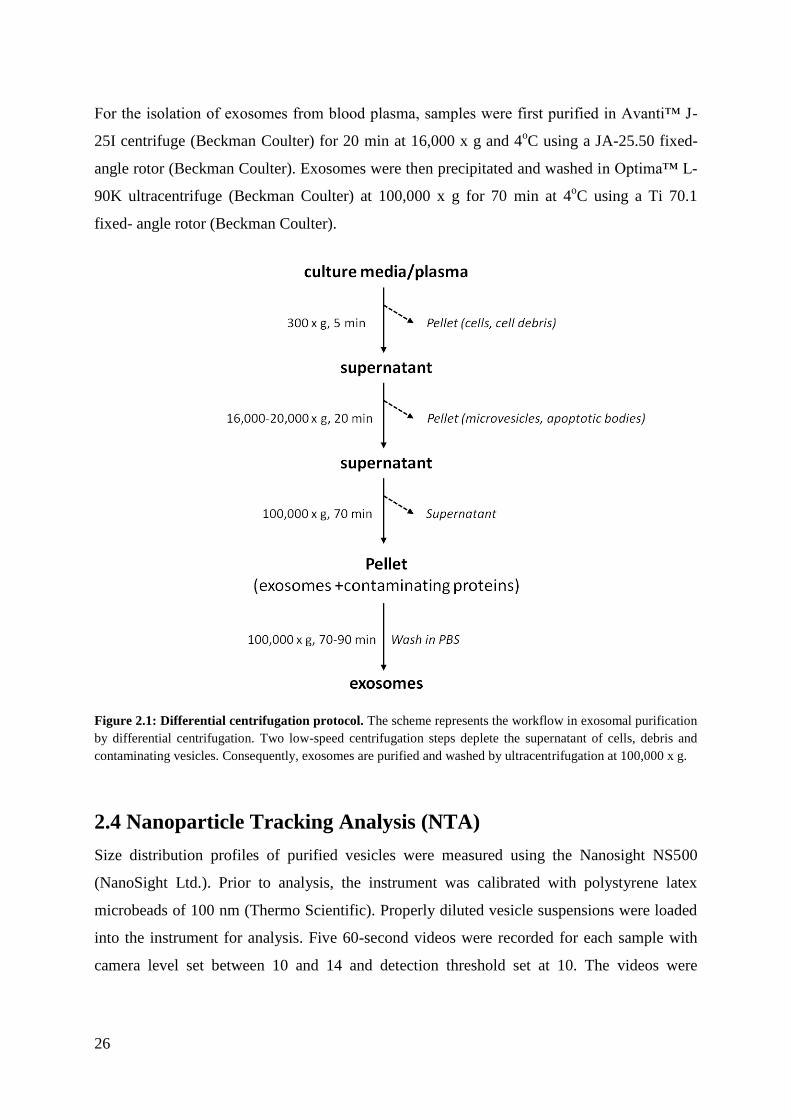
2.3 Exosome purification by differential centrifugation
Exosomes were purified from cell culture media following a protocol consisting of four
successive rounds of centrifugation (Figure 2.1). First, the medium collected from cell
cultures after 72 h of incubation was submitted to 5 min low speed centrifugation at 300 x g.
The supernatant was transferred to 30 mL polypropylene tubes (Sarstedt) and centrifuged for
20 min at 4oC in an Avanti™ J-25I centrifuge (Beckman Coulter). The applied speed was
either 20,000 or 16,000 x g using a JA-25.50 fixed-angle rotor (Beckman Coulter). To
generate the exosome pellet, the supernatant was transferred to ultracentrifuge tubes
(Beckman Coulter) and spun down at 100,000 x g for 70 min at 4oC using an Optima™ L-
90K ultracentrifuge (Beckman Coulter) with a Ti 70 fixed-angle rotor (Beckman Coulter).
The resulting exosome pellet was resuspended in 16 ml PBS and washed in the
ultracentrifuge. During every transfer of supernatant, the final 1-2 mL was left on the bottom
of the previous tube in order to prevent transfer of contaminating particles.
For making exosome suspensions, the washed pellets were dissolved in proper amount of
PBS. Alternatively, precipitated exosomes were directly lysed in Ripa buffer with added
protease and phosphatise inhibitors (Thermo Scientific), and samples were incubated on ice
for 1 h with vortexing followed by a brief sonication.
26
For the isolation of exosomes from blood plasma, samples were first purified in Avanti™ J-
25I centrifuge (Beckman Coulter) for 20 min at 16,000 x g and 4oC using a JA-25.50 fixed-
angle rotor (Beckman Coulter). Exosomes were then precipitated and washed in Optima™ L-
90K ultracentrifuge (Beckman Coulter) at 100,000 x g for 70 min at 4oC using a Ti 70.1
fixed- angle rotor (Beckman Coulter).
Figure 2.1: Differential centrifugation protocol. The scheme represents the workflow in exosomal purification
by differential centrifugation. Two low-speed centrifugation steps deplete the supernatant of cells, debris and
contaminating vesicles. Consequently, exosomes are purified and washed by ultracentrifugation at 100,000 x g.
2.4 Nanoparticle Tracking Analysis (NTA)
Size distribution profiles of purified vesicles were measured using the Nanosight NS500
(NanoSight Ltd.). Prior to analysis, the instrument was calibrated with polystyrene latex
microbeads of 100 nm (Thermo Scientific). Properly diluted vesicle suspensions were loaded
into the instrument for analysis. Five 60-second videos were recorded for each sample with
camera level set between 10 and 14 and detection threshold set at 10. The videos were
27
subsequently analysed with the NTA 3.1 software which calculates the size and concentration
of the particles with corresponding standard error. Auto settings were used for the analysis.
2.5 Electron Microscopy
To further assess size distributions and vesicular morphology, purified exosome were
resuspended in PBS and fixed in solution containing 8% paraformaldehyde and 0,2%
glutaraldehyde in 0,2M Phem buffer (2X fix) and delivered for electron microscopy analysis.
All images were captured using a Jeol 1230 microscope (JEOL, USA).
2.6 BCA assay for estimation of protein concentrations
Pierce BCA Protein Assay Kit (Thermo Scientific) was used for measuring the protein
concentration of the samples. This kit provides colorimetric detection and quantification of
proteins in a sample. The method is based on the biuret reaction where a color is produced in
an alkaline solution when Cu+2
is reduced to Cu+1
after interacting with nitrogen atoms in the
polypeptide bonds of proteins. In the BCA assay, the color is intensified by bicinchoninic acid
(BCA) which interacts with Cu+1
and produce a water-soluble complex exhibiting strong
absorbance which is nearly linear with the increasing protein concentrations at 562 nm [91].
For standards ranging between 0-2000 µg/mL, serum albumin supplied from the producer was
diluted following the recipe. Working reagent (WR) was prepared by mixing 50 parts of BCA
reagent A with 1 part of BCA reagent B. Following that, 25 µL of standards and diluted
samples were pipetted out on a 96- well plate and 200 µL of WR was added to each. The plate
was incubated at 37oC for 30min after which the absorbance was measured at 540 nm,
1s/well, on a Wallac Victor2 plate reader.
2.7 Western blotting and immunodetection
2.7.1 Gel electrophoresis
Based on the BCA estimate of protein concentrations, between 10 and 17 µg of protein was
loaded on a gel. Prior to loading, the protein samples, if necessary, were diluted with proper
amounts of lysis buffer. Loading buffer containing the chemical detergent sodium dodecyle
sulfate (SDS) was added and samples were heated at 75oC. The denatured samples and
28
SeeBlue® Plus2 Prestained Standard (Invitrogen) were loaded on a 4-12% Bis-Tris gel
(Invitrogen™
). The gel was inserted into an electrophoresis chamber which was filled with 1 x
MES SDS running buffer (Thermo Fisher). The proteins were fractionated by size at 150V for
approximately 90 min. After separation, the gel was forwarded to the blotting device (Figure
2.2 step 1-3).
2.7.2 Blotting
A semi-dry blotting technique was used for the transfer of the proteins from the gel to a
polyvinylidene difluoride (PVDF) membrane. The iBlot™ Gel Transfer Stacks (Invitrogen)
were assembled into the Gel Transfer Device (Invitrogen) together with the pre-run gel which
was placed on the PVDF membrane of the anode stack and covered with water-soaked
iBlot™ Filter Paper and the cathode stack. During the assembly, any trapped air bubbles were
removed using a blotting roller. The device performed the transfer in a closed circuit
according to the programmed parameters. After the transfer, the membrane was removed from
the stack and stained with amido black to confirm that the transfer has been successful (Figure
2.2 steps 4 and 5).
2.7.3 Antibody incubation and detection
Antibodies were used to detect the proteins of interest. To prevent unspecific antibody
binding the membrane was blocked for 1h with 5% dry milk or bovine serum albumin (BSA)
dissolved in R&D buffer (see Appendix). After blocking, the membrane was incubated with
the primary antibody (1:1000) diluted in 2,5% dry milk or 2,5% BSA with R&D buffer over
night at 4oC. During the incubation, the membrane was subjected to gentle agitation. Excess
antibody solution was removed by three subsequent 10min washing steps using R&D buffer.
The membrane was then probed with a secondary antibody (1:3000) for 1 h at room
temperature and subsequently washed three times for 10 min (Figure 2.2 steps 6-9).
Detection was aided by the reporter enzyme horseradish peroxidase (HRP), which is
conjugated to the secondary antibody. In the presence of hydrogen peroxide, HRP oxidizes
the compound luminol in a chemical reaction that emits light (chemiluminesce).The detection
of a chemiluminescent signal obtained after adding the luminol containing SuperSignal®
West Dura Extended Duration Substrate kit (Thermo Scientific) to the membranes was
29
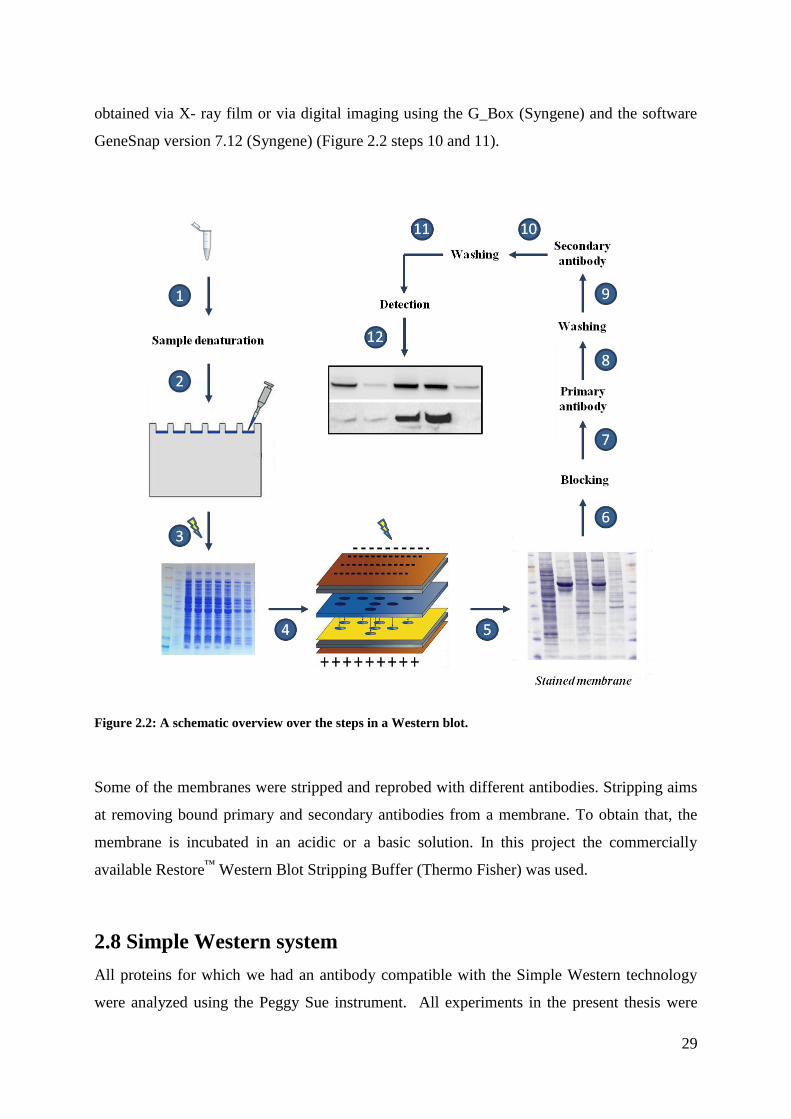
obtained via X- ray film or via digital imaging using the G_Box (Syngene) and the software
GeneSnap version 7.12 (Syngene) (Figure 2.2 steps 10 and 11).
Figure 2.2: A schematic overview over the steps in a Western blot.
Some of the membranes were stripped and reprobed with different antibodies. Stripping aims
at removing bound primary and secondary antibodies from a membrane. To obtain that, the
membrane is incubated in an acidic or a basic solution. In this project the commercially
available Restore™
Western Blot Stripping Buffer (Thermo Fisher) was used.
2.8 Simple Western system
All proteins for which we had an antibody compatible with the Simple Western technology
were analyzed using the Peggy Sue instrument. All experiments in the present thesis were
30
performed under reducing conditions using the 12-230 kDa separation system (Protein
Simple, Biotech). Reagents were prepared according to the manufacturer’s protocol as
described below.
Ready-to-use reagents provided by the producer:
Antibody Diluent II
Sample Buffer (10X)
Streptavidin-HRP
Secondary Antibody
Separation Matrix II
Stacking Matrix II
Preparation of standard and reagents
Biotinylated Ladder was prepared by adding 16 µL deionized water, 2 µL 10X Sample
Buffer and 2 µL 400 mM DTT solution to the lyophilized ladder provided by the
producer.
To prepare Fluoerescent 5X Master Mix 20 µL of 400mM DTT solution and 20 µL
10X Sample buffer were mixed with the lyophilized material provided by the
producer.
Detection solution was prepared by combining 100 µL Lumino-S and 100 µL
Peroxide.
Primary antibody preparation
Between 1:50 to 1:100 solutions of primary antibodies were prepared by mixing
proper volumes of antibody stocks and Antibody Diluent II.
Sample preparation
To prepare samples with working concentrations ranging between 0,2-0,8 µg/µL, the sample
stocks were, if necessary, diluted with 0,1X Sample Buffer before they were mixed with
appropriate volumes of Simple Western loading buffer (Fluorescent5X Master Mix). The
samples (and ladder) were then denatured at 95oC for 5min after which they were vortexed
and briefly centrifuged before being loaded on an assay plate.
After loading the samples, the reagents, the properly diluted primary antibodies and the
corresponding secondary antibodies, the plate was centrifuged at 2000RPM for 5min before
being submitted to the Peggy Sue device for analysis. Detection was obtained by
31
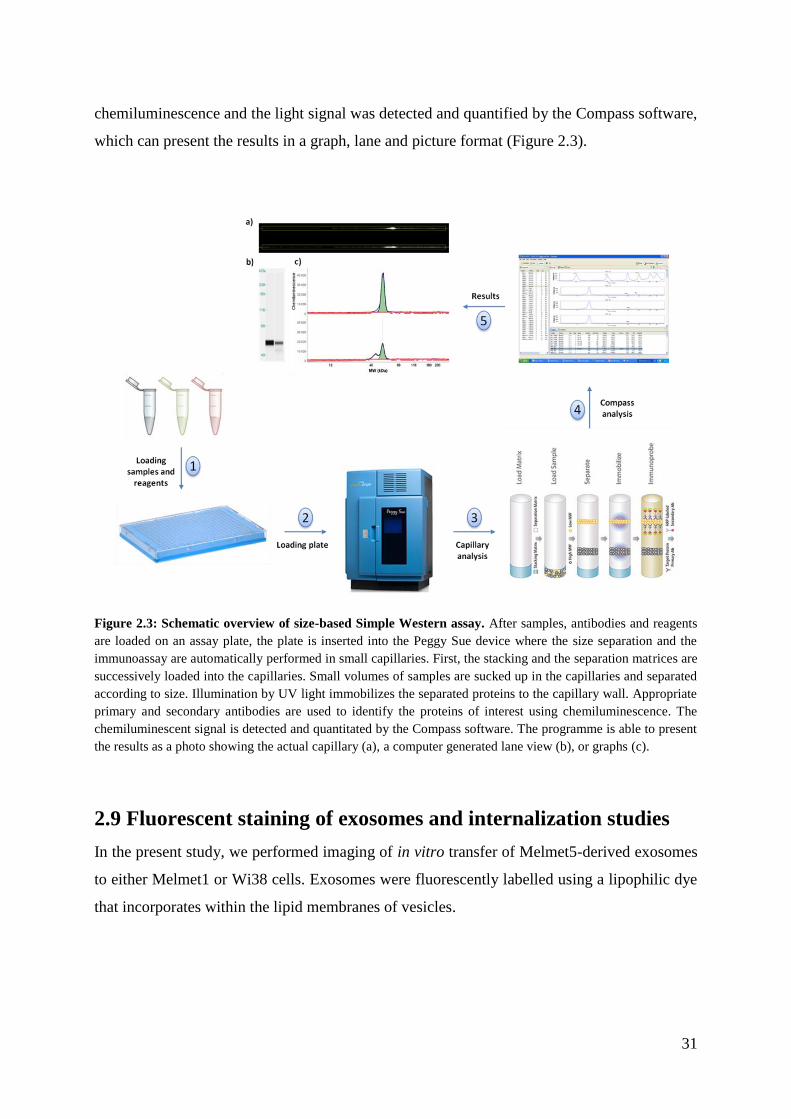
chemiluminescence and the light signal was detected and quantified by the Compass software,
which can present the results in a graph, lane and picture format (Figure 2.3).
Figure 2.3: Schematic overview of size-based Simple Western assay. After samples, antibodies and reagents
are loaded on an assay plate, the plate is inserted into the Peggy Sue device where the size separation and the
immunoassay are automatically performed in small capillaries. First, the stacking and the separation matrices are
successively loaded into the capillaries. Small volumes of samples are sucked up in the capillaries and separated
according to size. Illumination by UV light immobilizes the separated proteins to the capillary wall. Appropriate
primary and secondary antibodies are used to identify the proteins of interest using chemiluminescence. The
chemiluminescent signal is detected and quantitated by the Compass software. The programme is able to present
the results as a photo showing the actual capillary (a), a computer generated lane view (b), or graphs (c).
2.9 Fluorescent staining of exosomes and internalization studies
In the present study, we performed imaging of in vitro transfer of Melmet5-derived exosomes
to either Melmet1 or Wi38 cells. Exosomes were fluorescently labelled using a lipophilic dye
that incorporates within the lipid membranes of vesicles.
32
2.9.1 Staining of exosomes
Exosomes derived from the Melmet5 cell line were isolated from eight T-175 culture flasks,
as described previously, and labelled using the lipophilic dye PKH67 Fluorescent Cell Linker
Kit (SIGMA-ALDRICH®), according to the manufacturer’s recommendations. In brief, 1mL
of diluent C was added to the washed exosomal pellet resuspended in 25 µl PBS.
Subsequently, 1 mL of a 2X dye solution, prepared by combining 4 µl of the PKH67 dye
stock with 1 mL of diluents C, was mixed with the exosome suspension. The mixture was
transferred to a glass tube covered with foil to keep from light and incubated for 5 min with
periodic mixing. To stop the staining, 2 mL of 1% BSA was added to the mixture and
incubated for 1 min. The suspension was transferred to centrifugation tubes and washed twice
with 12 mL PBS using the Ti 70 (FA) rotor at 100,000 x g for 70 min at 4oC. A control was
prepared by adding 1 mL of Diluent C to 25 µL of PBS. This suspension was mixed with 1
mL of the 2X dye solution. The control was incubated and washed in parallel with exosomes.
After the final wash, the pellets from the stained exosomes and the control were resuspended
in 200 µL of exosome-depleted media.
2.9.2 Co-culturing of stained exosomes with cells
Appropriate amounts of Melmet1 and Wi38 cells (Table 2.2) were seeded out on glass cover
slips inserted in four-well plates (Thermo Scientific) 24 h prior to exosome addition. The cells
were incubated in RPMI media which, immediately before exosome addition, was replaced
with exosome-depleted RPMI media containing 1% antibiotics. Ten µl of exosomal
suspension or ten µl of the control solution was added to the wells and incubated with the
cells for 24 h. After that, the media was removed and the cells were washed with PBS before
they were fixed with 4% paraformaldehyde for 15 min at room temperature. The cover slips
were then mounted on a cover glass using ProLong® Gold Antifade Mountant with DAPI
(Thermo Scientific). Pictures were taken using a confocal laser microscope Zeiss LSM710
(Carl Zeiss MicroImaging GmbH) with 63 x oil immersion objective.
Table 2.2: Seeding densities used.
Wi38 Melme1
80000 cells/well 40000 cells/well
33
2.10 Metabolic assay
To evaluate whether cancer-derived exosomes can influence the metabolism of the stromal
cells, we performed metabolic analysis of fibroblasts co-cultured with Melmet5 exosomes
using the Seahorse XF Analyser instrument (Seahorse Bioscience).
Seahorse measures two parameters indicative of metabolic changes in cells, oxygen
consumption and extracellular acidification. Alterations in oxygen consumption rate (OCR)
assume adjustments in mitochondria-based respiration, while extracellular acidification rate
(ECAR) reflects changes in glycolysis. These alterations are monitored through measuring the
concentrations of dissolved oxygen and free protons in the cell medium in real-time. The
measurement is performed after cells are grown as monolayers in a microplate. The oxygen
and proton concentrations are measured for 2-5 min, by solid state sensor probes, on a
cartridge plate, residing 200 microns above the cell monolayer. The OCR and ECAR are then
calculated by the instrument. Drugs interfering with several steps in cellular metabolism are
used in the analysis. The instrument allows for the sequential injection of up to four drugs to
each well through injection ports on the cartridge.
2.10.1 XF Cell Mito Stress Test Assay
In this assay, metabolic stress is induced by using drugs that interfere with the function of
mitochondrial components responsible for cellular respiration (drugs’ function is summarized
in table 2.3).
The Wi38 cells were harvested and re-suspended in a proper volume of normal EMEM
growth medium. 9000 cell/well were seeded in a Seahorse 96-well XF cell culture plate and
incubated overnight. Melmet5 exosomes were added to the cells, 1 day after seeding, at 10
µg/mL for 48-hour incubation. Wells with EMEM media (without exosomes) were used as a
control. One hour prior to analysis, the cell media was replaced with assay media prepared
from non-buffered, pH adjusted RPMI medium supplemented with glucose, glutamine and
pyruvate (Table 2.4). The plate was incubated in a non-CO2 37oC incubator for 1hour.
The drugs used to modulate the metabolism during the assay were diluted in pre- defined
volumes of the RPMI medium (Table 2.3) and loaded into the injection ports of the cartridge.
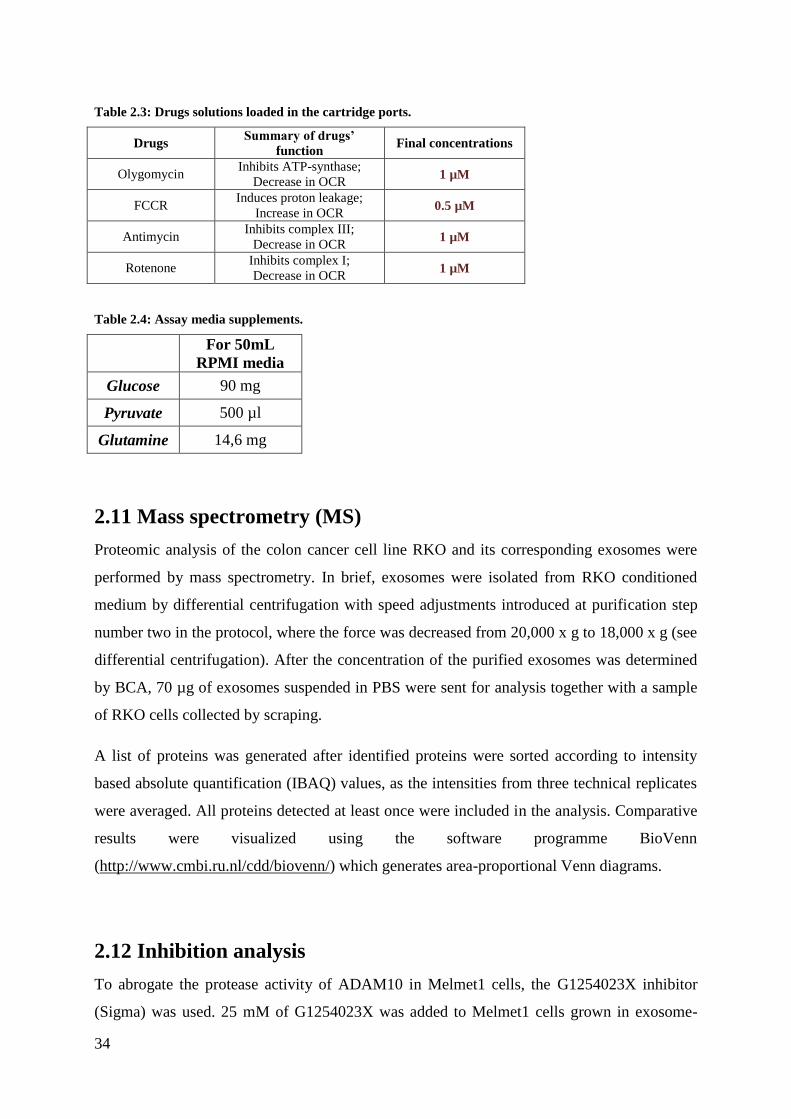
34
Table 2.3: Drugs solutions loaded in the cartridge ports.
Drugs Summary of drugs’
function Final concentrations
Olygomycin Inhibits ATP-synthase;
Decrease in OCR 1 µM
FCCR Induces proton leakage;
Increase in OCR 0.5 µM
Antimycin Inhibits complex III;
Decrease in OCR 1 µM
Rotenone Inhibits complex I;
Decrease in OCR 1 µM
Table 2.4: Assay media supplements.
For 50mL
RPMI media
Glucose 90 mg
Pyruvate 500 µl
Glutamine 14,6 mg
2.11 Mass spectrometry (MS)
Proteomic analysis of the colon cancer cell line RKO and its corresponding exosomes were
performed by mass spectrometry. In brief, exosomes were isolated from RKO conditioned
medium by differential centrifugation with speed adjustments introduced at purification step
number two in the protocol, where the force was decreased from 20,000 x g to 18,000 x g (see
differential centrifugation). After the concentration of the purified exosomes was determined
by BCA, 70 µg of exosomes suspended in PBS were sent for analysis together with a sample
of RKO cells collected by scraping.
A list of proteins was generated after identified proteins were sorted according to intensity
based absolute quantification (IBAQ) values, as the intensities from three technical replicates
were averaged. All proteins detected at least once were included in the analysis. Comparative
results were visualized using the software programme BioVenn
(http://www.cmbi.ru.nl/cdd/biovenn/) which generates area-proportional Venn diagrams.
2.12 Inhibition analysis
To abrogate the protease activity of ADAM10 in Melmet1 cells, the G1254023X inhibitor
(Sigma) was used. 25 mM of G1254023X was added to Melmet1 cells grown in exosome-
35
depleted media. After 72 h the media was harvested and exosomes were isolated by
differential centrifugation.

36
37
3 Results
3.1 Characterization of exosomes from melanoma cell lines with
regard to methodological evaluation
Different reports state the use of different g- forces for the purification of exosomes. Greatest
force variation is observed during the step aiming at precipitating microvesicles. As reported
by Cvjetkovic et al, discrepancies in isolation protocols can lead to inconsistencies in the
results obtained by different groups [82].
At our lab, the current protocol uses 20,000 x g for the sedimentation of EVs larger than 100-
150 nm (Figure 2.1). However, as lower forces are often reported in different publications, we
decided to study the effect of lowering the speed at this purification step on the pelleted
material. Thus the present work was initiated with focus on protocol adjustments regarding
the reduction of sedimentation forces in the second centrifugation step, and the effect of this
decrease on the quantity and the quality of the isolated material.
We hypothesized that the force of 20,000 x g during the second purification step in the
protocol could be powerful enough to co-precipitate high density exosomes together with the
contaminating vesicular populations. Consequently, decreasing the force would reduce the
number of exosomes lost during purification. Force decline, on the other hand, was expected
to have the reverse effect on the purity of the exosomal material. Lowering of g might result
in inefficient precipitation of a portion of bigger EVs, allowing them to later fractionate
together with exosomes at 100,000 x g.
Study design
The resolution efficiencies of 20,000 x g and the corresponding force reduction of 16,000 x g
were estimated using conditioned media from the cell lines Melmet1 and Melmet5. After the
initial low speed centrifugation, the collected media from each cell line was split in two and
each part was subjected to purification at one of the two alternative centrifugal forces. The
pellets containing the bigger EVs, which are normally discarded, were saved and included in
the consequent analysis. Following this, the purified supernatants were subjected to 100,000 x
38
g for exosome precipitation and washing. Several analytical techniques were used to study all
collected pellets.
3.1.1 Protein analysis of pelleted material
In order to investigate the purity and the yield of the isolated material, we performed protein
analysis of both EV and exosomal fractions. In the call for standardization from the
International Society for Extracellular Vesicles (ISEV), the use of several markers,
confirming both the enrichment of exosomes and the absence of contaminations, is
recommended [87]. Following this statement, we included in our protein analysis five markers
enriched in exosomes and three markers expected to be depleted from exosomal populations
(Table 3.1).
First, we performed western blot using three of the listed exosomal markers (CD9, CD63 and
ALIX) and two non-exosomal markers (CANX and CYC). Figure 3.1A and B (left panels)
shows that CD63 is ubiquitously expressed across vesicular populations. CD9 appeared in all
of the analyzed fractions from Melmet5, whereas, in Melmet1, the tetraspanin was detected
mainly in the EV extracts. In correlation to this, the weak band in lane four (EXO 16,000g) on
the Melmet1 membrane likely is an evidence for the crossing of contaminating CD9-
expressing vesicles into the exosomal pellet due to the lower purification speed. This is
further confirmed by the weak CYC1 signal in the same lane. Of note, the CD9 bands
detected in Melmet5 slightly differ in size between EVs and exosomes. Possible variations in
post-translational modifications might be the origin for this size inconsistency. Compared to
the ambiguous nature of the tetraspanins, ALIX showed a more reliable exosome marker
pattern of appearance, with the strongest signals in the lanes loaded with the 16,000 x g
extracts. In general, contaminations were not evident in the third lanes (EXO 20,000g), while
in the fourth lanes (EXO 16,000g) very weak signals appeared for CYC1 in Melmet1 and
CANX in Melmet5.
Second, we further characterized these lysates using the Simple Western technology. Two of
the markers previously detected by Western blot, ALIX and CANX, were used to validate the
method (Figure 3.1A and B, middle and right figures). In addition, the exosomal markers
TSG101and FLOT1 were tested in both Melmet1 and Melmet5 lysates. GM130 was used as a
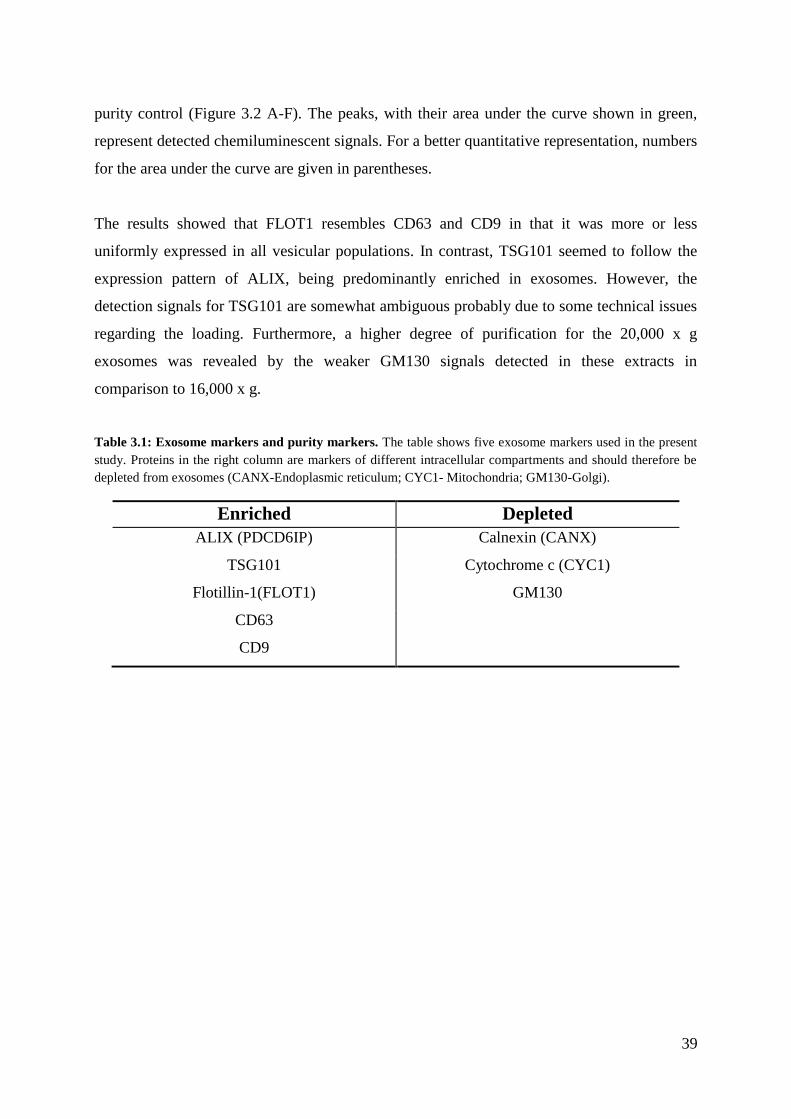
39
purity control (Figure 3.2 A-F). The peaks, with their area under the curve shown in green,
represent detected chemiluminescent signals. For a better quantitative representation, numbers
for the area under the curve are given in parentheses.
The results showed that FLOT1 resembles CD63 and CD9 in that it was more or less
uniformly expressed in all vesicular populations. In contrast, TSG101 seemed to follow the
expression pattern of ALIX, being predominantly enriched in exosomes. However, the
detection signals for TSG101 are somewhat ambiguous probably due to some technical issues
regarding the loading. Furthermore, a higher degree of purification for the 20,000 x g
exosomes was revealed by the weaker GM130 signals detected in these extracts in
comparison to 16,000 x g.
Table 3.1: Exosome markers and purity markers. The table shows five exosome markers used in the present
study. Proteins in the right column are markers of different intracellular compartments and should therefore be
depleted from exosomes (CANX-Endoplasmic reticulum; CYC1- Mitochondria; GM130-Golgi).
Enriched Depleted
ALIX (PDCD6IP) Calnexin (CANX)
TSG101 Cytochrome c (CYC1)
Flotillin-1(FLOT1) GM130
CD63
CD9
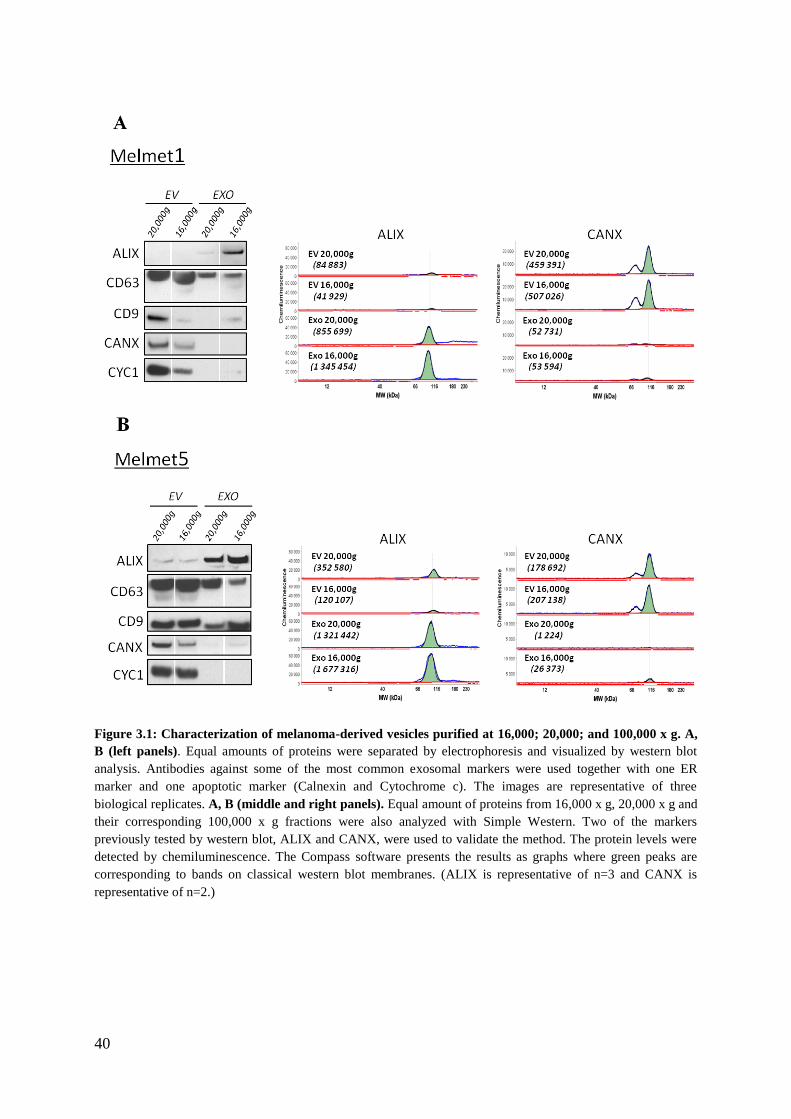
40
Figure 3.1: Characterization of melanoma-derived vesicles purified at 16,000; 20,000; and 100,000 x g. A,
B (left panels). Equal amounts of proteins were separated by electrophoresis and visualized by western blot
analysis. Antibodies against some of the most common exosomal markers were used together with one ER
marker and one apoptotic marker (Calnexin and Cytochrome c). The images are representative of three
biological replicates. A, B (middle and right panels). Equal amount of proteins from 16,000 x g, 20,000 x g and
their corresponding 100,000 x g fractions were also analyzed with Simple Western. Two of the markers
previously tested by western blot, ALIX and CANX, were used to validate the method. The protein levels were
detected by chemiluminescence. The Compass software presents the results as graphs where green peaks are
corresponding to bands on classical western blot membranes. (ALIX is representative of n=3 and CANX is
representative of n=2.)
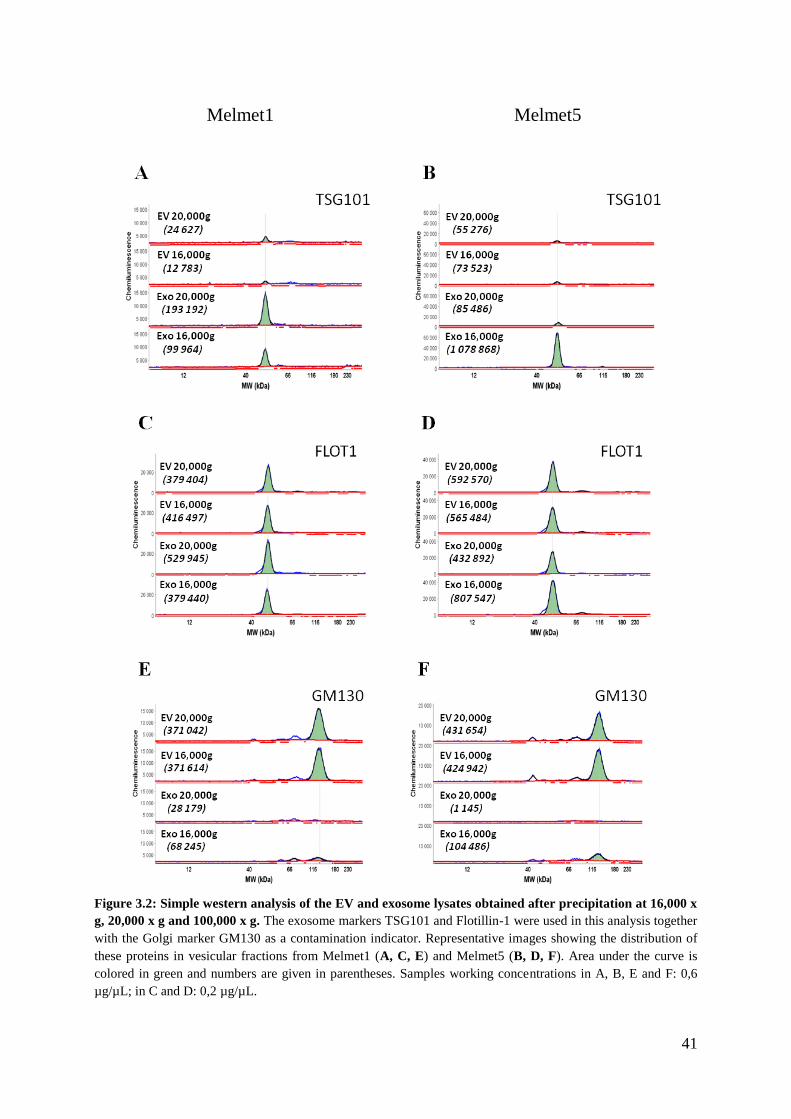
41
Melmet1 Melmet5
Figure 3.2: Simple western analysis of the EV and exosome lysates obtained after precipitation at 16,000 x
g, 20,000 x g and 100,000 x g. The exosome markers TSG101 and Flotillin-1 were used in this analysis together
with the Golgi marker GM130 as a contamination indicator. Representative images showing the distribution of
these proteins in vesicular fractions from Melmet1 (A, C, E) and Melmet5 (B, D, F). Area under the curve is
colored in green and numbers are given in parentheses. Samples working concentrations in A, B, E and F: 0,6
µg/µL; in C and D: 0,2 µg/µL.
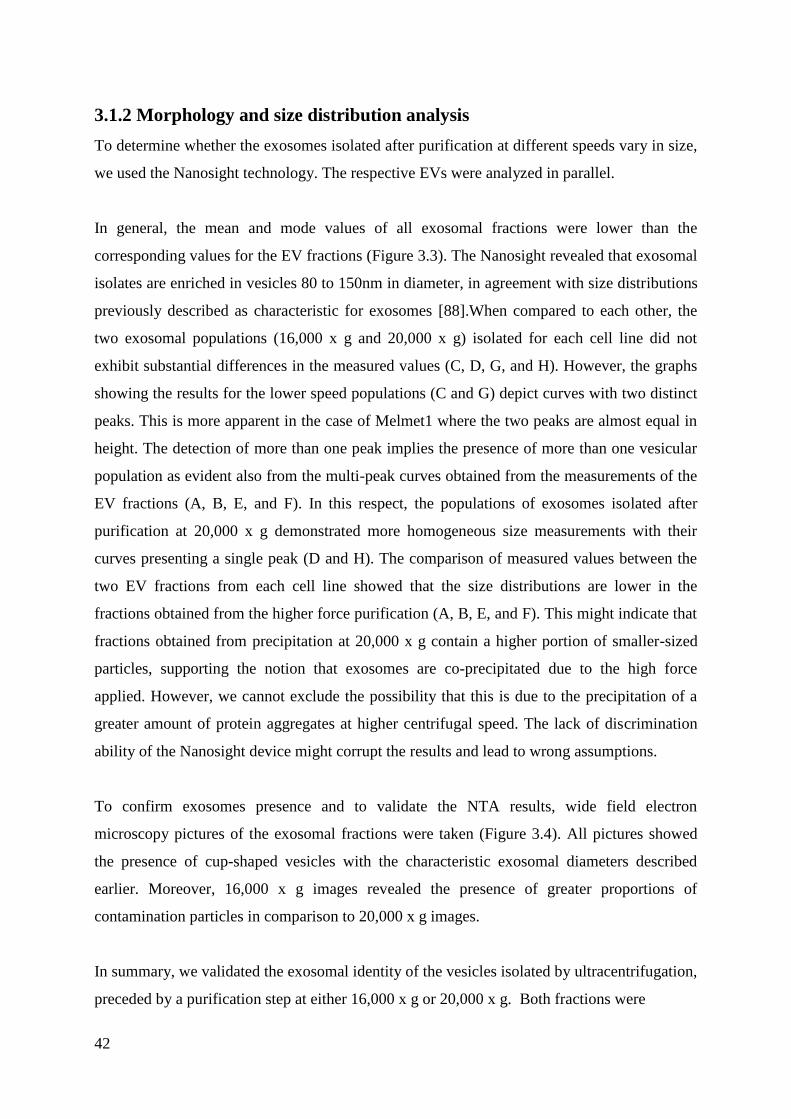
42
3.1.2 Morphology and size distribution analysis
To determine whether the exosomes isolated after purification at different speeds vary in size,
we used the Nanosight technology. The respective EVs were analyzed in parallel.
In general, the mean and mode values of all exosomal fractions were lower than the
corresponding values for the EV fractions (Figure 3.3). The Nanosight revealed that exosomal
isolates are enriched in vesicles 80 to 150nm in diameter, in agreement with size distributions
previously described as characteristic for exosomes [88].When compared to each other, the
two exosomal populations (16,000 x g and 20,000 x g) isolated for each cell line did not
exhibit substantial differences in the measured values (C, D, G, and H). However, the graphs
showing the results for the lower speed populations (C and G) depict curves with two distinct
peaks. This is more apparent in the case of Melmet1 where the two peaks are almost equal in
height. The detection of more than one peak implies the presence of more than one vesicular
population as evident also from the multi-peak curves obtained from the measurements of the
EV fractions (A, B, E, and F). In this respect, the populations of exosomes isolated after
purification at 20,000 x g demonstrated more homogeneous size measurements with their
curves presenting a single peak (D and H). The comparison of measured values between the
two EV fractions from each cell line showed that the size distributions are lower in the
fractions obtained from the higher force purification (A, B, E, and F). This might indicate that
fractions obtained from precipitation at 20,000 x g contain a higher portion of smaller-sized
particles, supporting the notion that exosomes are co-precipitated due to the high force
applied. However, we cannot exclude the possibility that this is due to the precipitation of a
greater amount of protein aggregates at higher centrifugal speed. The lack of discrimination
ability of the Nanosight device might corrupt the results and lead to wrong assumptions.
To confirm exosomes presence and to validate the NTA results, wide field electron
microscopy pictures of the exosomal fractions were taken (Figure 3.4). All pictures showed
the presence of cup-shaped vesicles with the characteristic exosomal diameters described
earlier. Moreover, 16,000 x g images revealed the presence of greater proportions of
contamination particles in comparison to 20,000 x g images.
In summary, we validated the exosomal identity of the vesicles isolated by ultracentrifugation,
preceded by a purification step at either 16,000 x g or 20,000 x g. Both fractions were
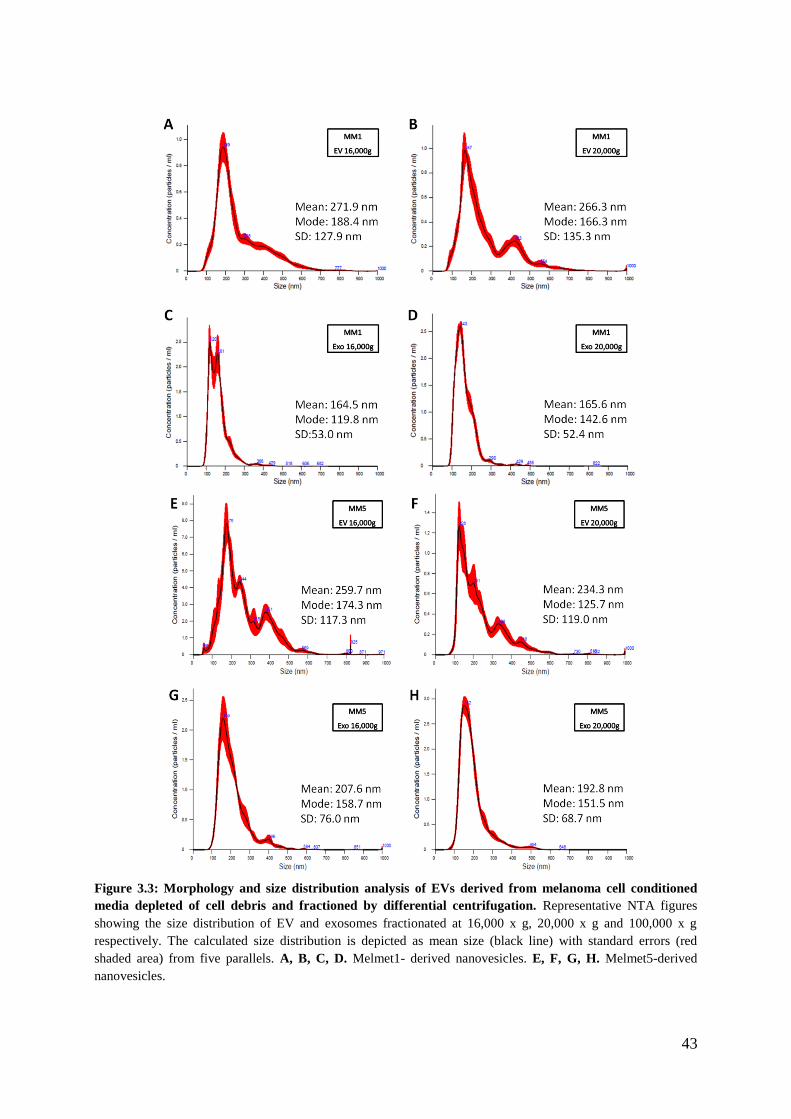
43
Figure 3.3: Morphology and size distribution analysis of EVs derived from melanoma cell conditioned
media depleted of cell debris and fractioned by differential centrifugation. Representative NTA figures
showing the size distribution of EV and exosomes fractionated at 16,000 x g, 20,000 x g and 100,000 x g
respectively. The calculated size distribution is depicted as mean size (black line) with standard errors (red
shaded area) from five parallels. A, B, C, D. Melmet1- derived nanovesicles. E, F, G, H. Melmet5-derived
nanovesicles.
44
enriched in several exosome markers, revealed a cup-shaped appearance on electron
microscopy and a size distribution of 80-150 nm. Moreover, these results support our
hypothesis, indicating that a decrease in centrifugal force at step two, in our case from 20,000
x g to 16,000 x g, correlates with an increase in purified exosomal material, while also
allowing for more contaminations to pass to the enriched exosomal fraction. Still, since the
degree of contamination seems to be moderate, we decided to introduce a decrease in the
speed in step two in our isolation protocol. Unless stated otherwise, further isolation of
exosomes in this master thesis has been performed using 18,000 x g at step two.
Further, our results indicated the unspecific distribution of Flotillin-1 across vesicular
fractions. Because of the high abundance of Flotillin-1, we considered using it further as a
more general positive control for vesicular enrichment.
Figure 3.4: Representative electron microscopy images of the exosome fractions pelleted at 100,000 x g
after the preceding purification at either 16,000 x g and the 20,000 x g. Wide field images reveal a more
heterogeneous size distribution in exosomes isolated after purification at 16,000 x g. In contrasts, the Exo 20,000
x g images depict samples enriched in smaller size vesicles. Scale bar, 500 nm.
45
3.2 Simple Western analysis of proteins in melanoma-derived
vesicles
To study protein expression in melanoma cells and corresponding vesicles we have performed
Simple Western analysis of some selected proteins expected to be present in these
compartments.
3.2.1 B7-H3
B7-H3 is a transmembrane glycoprotein with immunoregulatory function which is expressed
in normal human tissues and in different cancer cell lines [92]. In melanoma, increased
expression of this protein in metastatic tissue has been shown to correlate with tumor
progression [93]. The functional role of B7-H3 in regulating the metastatic capacity of
melanoma cells has been within the research focus of our lab [94].
To investigate the distribution of B7-H3 in melanoma cells and their vesicles, we performed
Simple Western analysis of cellular and vesicular extracts from Melmet1 and Melmet5. All
capillaries were loaded with 0,6 µg/µL of protein lysate, and signal was expected to appear
around 117 kDa. As figure 3.5A shows, B7-H3 was detected in all lysates. Interestingly,
cellular levels of the protein were much lower in comparison to the levels detected in
exosomes, for both cell lines. In Melmet5, B7-H3 was equally abundant in both EVs and
exosomes, while the signal intensity detected in Melmet1exosomes was higher than the signal
in the EVs. These date suggest that the protein B7-H3 is highly enriched in extracellular
vesicles from Melmet1 and Melmet5.
3.2.2 N-cadherin
It has previously been reported that melanoma development is marked by an increase in the
expression of the adhesion molecule N-cadherin [9]. N-cadherin-mediated interactions
between tumor cells or between tumor and stromal cells promote melanoma survival and
migration [12].
Here we evaluated the distribution of N-cadherin in melanoma cells and their derived
vesicles, using the same experimental setup as for B7-H3. We intended to test whether this
protein can function as a loading control in experiments where various cellular compartments,
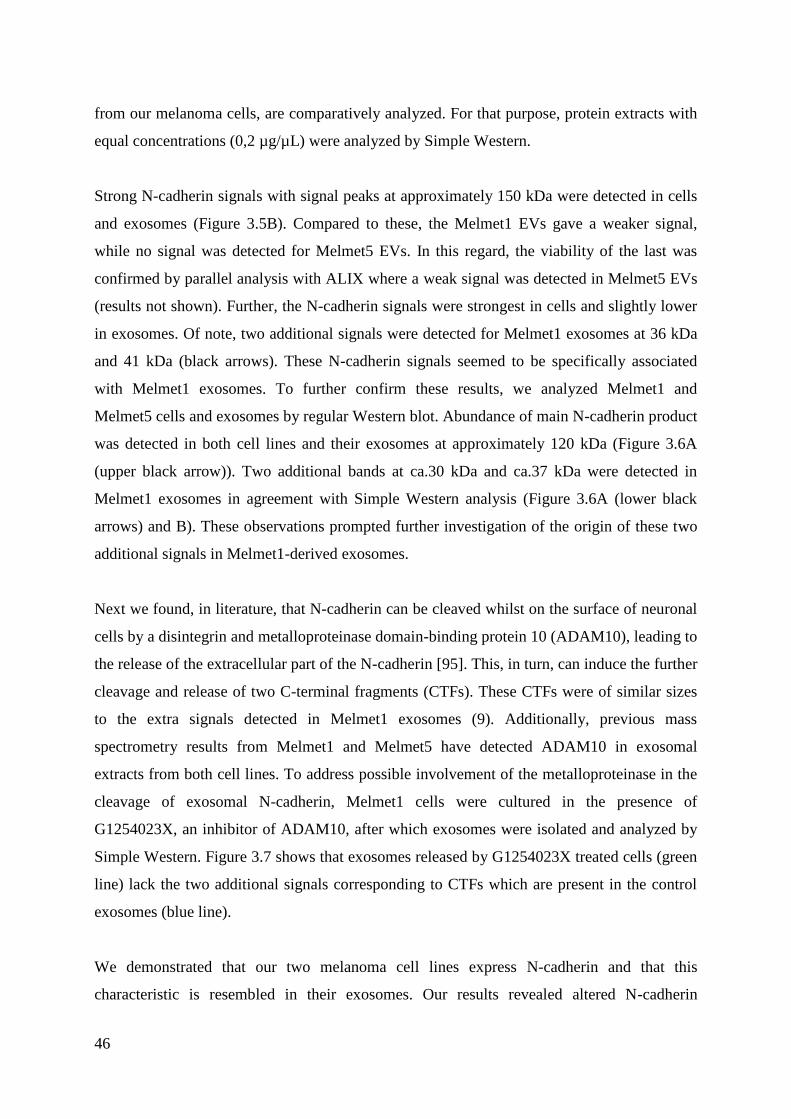
46
from our melanoma cells, are comparatively analyzed. For that purpose, protein extracts with
equal concentrations (0,2 µg/µL) were analyzed by Simple Western.
Strong N-cadherin signals with signal peaks at approximately 150 kDa were detected in cells
and exosomes (Figure 3.5B). Compared to these, the Melmet1 EVs gave a weaker signal,
while no signal was detected for Melmet5 EVs. In this regard, the viability of the last was
confirmed by parallel analysis with ALIX where a weak signal was detected in Melmet5 EVs
(results not shown). Further, the N-cadherin signals were strongest in cells and slightly lower
in exosomes. Of note, two additional signals were detected for Melmet1 exosomes at 36 kDa
and 41 kDa (black arrows). These N-cadherin signals seemed to be specifically associated
with Melmet1 exosomes. To further confirm these results, we analyzed Melmet1 and
Melmet5 cells and exosomes by regular Western blot. Abundance of main N-cadherin product
was detected in both cell lines and their exosomes at approximately 120 kDa (Figure 3.6A
(upper black arrow)). Two additional bands at ca.30 kDa and ca.37 kDa were detected in
Melmet1 exosomes in agreement with Simple Western analysis (Figure 3.6A (lower black
arrows) and B). These observations prompted further investigation of the origin of these two
additional signals in Melmet1-derived exosomes.
Next we found, in literature, that N-cadherin can be cleaved whilst on the surface of neuronal
cells by a disintegrin and metalloproteinase domain-binding protein 10 (ADAM10), leading to
the release of the extracellular part of the N-cadherin [95]. This, in turn, can induce the further
cleavage and release of two C-terminal fragments (CTFs). These CTFs were of similar sizes
to the extra signals detected in Melmet1 exosomes (9). Additionally, previous mass
spectrometry results from Melmet1 and Melmet5 have detected ADAM10 in exosomal
extracts from both cell lines. To address possible involvement of the metalloproteinase in the
cleavage of exosomal N-cadherin, Melmet1 cells were cultured in the presence of
G1254023X, an inhibitor of ADAM10, after which exosomes were isolated and analyzed by
Simple Western. Figure 3.7 shows that exosomes released by G1254023X treated cells (green
line) lack the two additional signals corresponding to CTFs which are present in the control
exosomes (blue line).
We demonstrated that our two melanoma cell lines express N-cadherin and that this
characteristic is resembled in their exosomes. Our results revealed altered N-cadherin
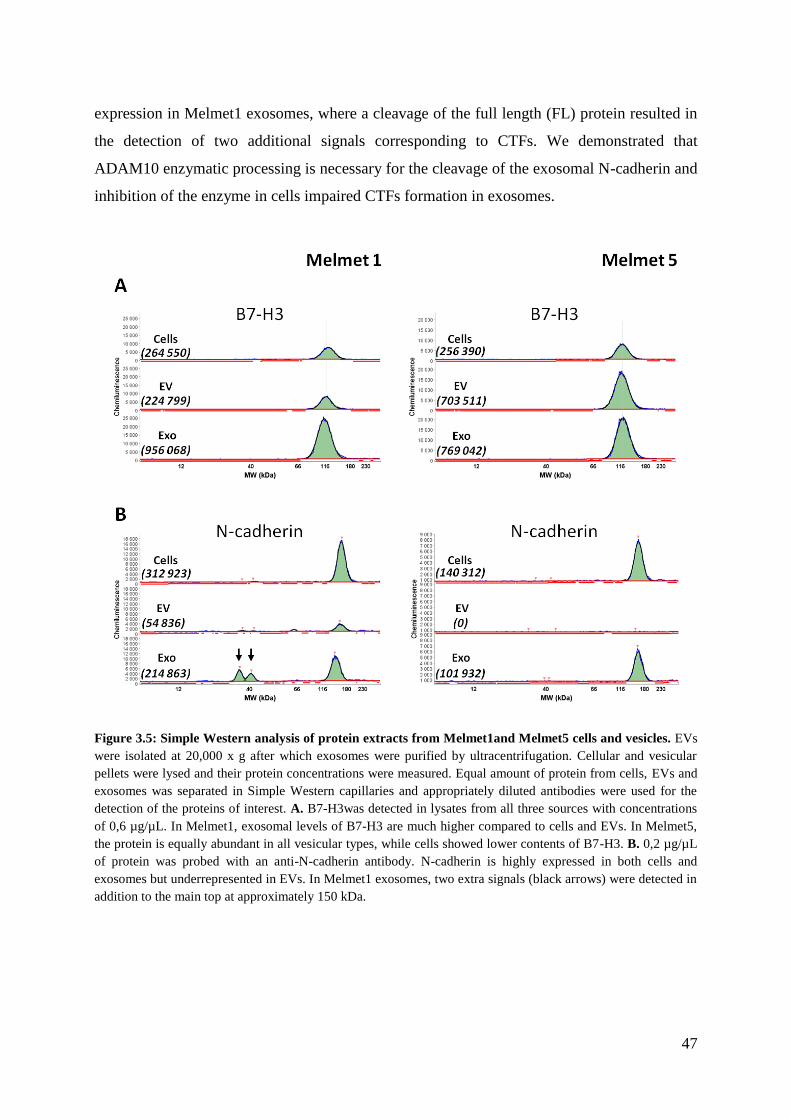
47
expression in Melmet1 exosomes, where a cleavage of the full length (FL) protein resulted in
the detection of two additional signals corresponding to CTFs. We demonstrated that
ADAM10 enzymatic processing is necessary for the cleavage of the exosomal N-cadherin and
inhibition of the enzyme in cells impaired CTFs formation in exosomes.
Figure 3.5: Simple Western analysis of protein extracts from Melmet1and Melmet5 cells and vesicles. EVs
were isolated at 20,000 x g after which exosomes were purified by ultracentrifugation. Cellular and vesicular
pellets were lysed and their protein concentrations were measured. Equal amount of protein from cells, EVs and
exosomes was separated in Simple Western capillaries and appropriately diluted antibodies were used for the
detection of the proteins of interest. A. B7-H3was detected in lysates from all three sources with concentrations
of 0,6 µg/µL. In Melmet1, exosomal levels of B7-H3 are much higher compared to cells and EVs. In Melmet5,
the protein is equally abundant in all vesicular types, while cells showed lower contents of B7-H3. B. 0,2 µg/µL
of protein was probed with an anti-N-cadherin antibody. N-cadherin is highly expressed in both cells and
exosomes but underrepresented in EVs. In Melmet1 exosomes, two extra signals (black arrows) were detected in
addition to the main top at approximately 150 kDa.
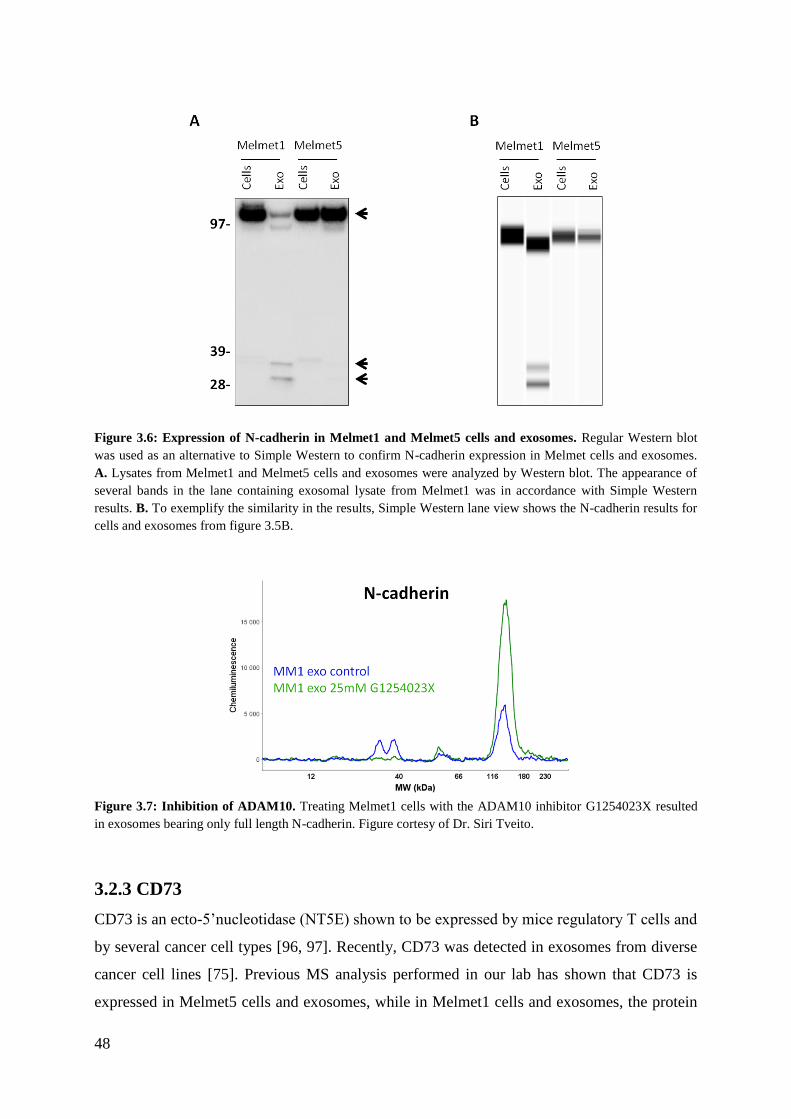
48
Figure 3.6: Expression of N-cadherin in Melmet1 and Melmet5 cells and exosomes. Regular Western blot
was used as an alternative to Simple Western to confirm N-cadherin expression in Melmet cells and exosomes.
A. Lysates from Melmet1 and Melmet5 cells and exosomes were analyzed by Western blot. The appearance of
several bands in the lane containing exosomal lysate from Melmet1 was in accordance with Simple Western
results. B. To exemplify the similarity in the results, Simple Western lane view shows the N-cadherin results for
cells and exosomes from figure 3.5B.
Figure 3.7: Inhibition of ADAM10. Treating Melmet1 cells with the ADAM10 inhibitor G1254023X resulted
in exosomes bearing only full length N-cadherin. Figure cortesy of Dr. Siri Tveito.
3.2.3 CD73
CD73 is an ecto-5’nucleotidase (NT5E) shown to be expressed by mice regulatory T cells and
by several cancer cell types [96, 97]. Recently, CD73 was detected in exosomes from diverse
cancer cell lines [75]. Previous MS analysis performed in our lab has shown that CD73 is
expressed in Melmet5 cells and exosomes, while in Melmet1 cells and exosomes, the protein
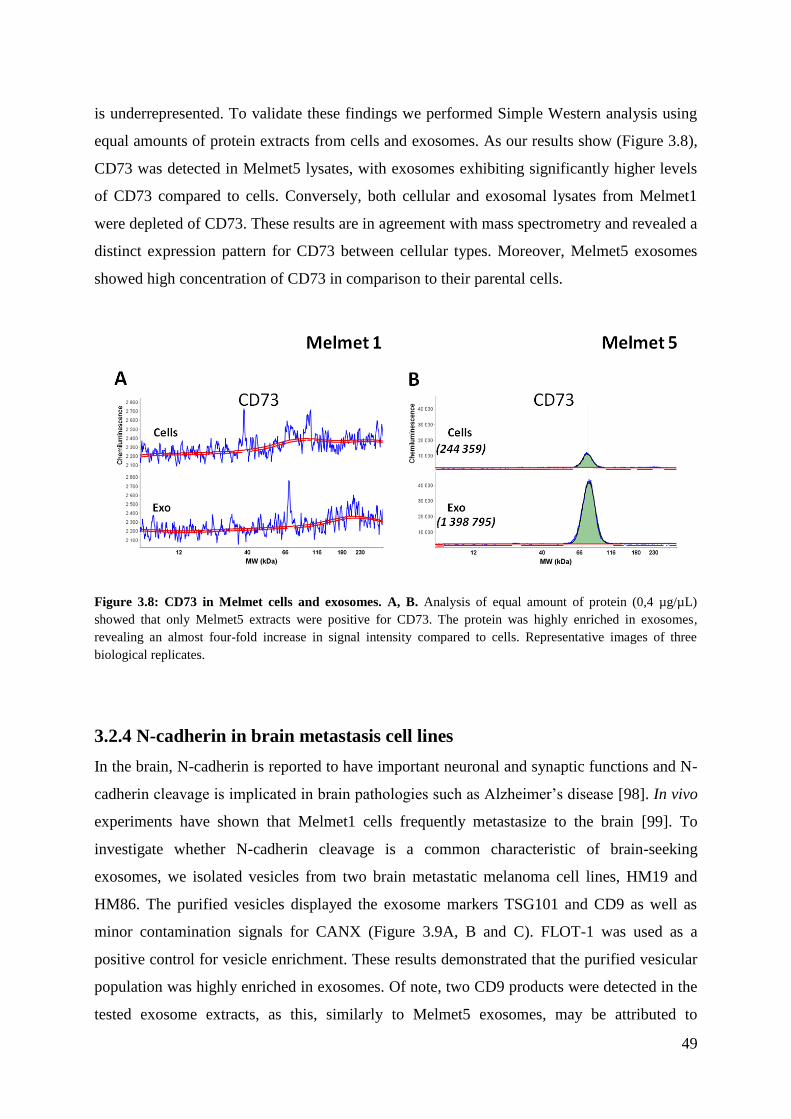
49
is underrepresented. To validate these findings we performed Simple Western analysis using
equal amounts of protein extracts from cells and exosomes. As our results show (Figure 3.8),
CD73 was detected in Melmet5 lysates, with exosomes exhibiting significantly higher levels
of CD73 compared to cells. Conversely, both cellular and exosomal lysates from Melmet1
were depleted of CD73. These results are in agreement with mass spectrometry and revealed a
distinct expression pattern for CD73 between cellular types. Moreover, Melmet5 exosomes
showed high concentration of CD73 in comparison to their parental cells.
Figure 3.8: CD73 in Melmet cells and exosomes. A, B. Analysis of equal amount of protein (0,4 µg/µL)
showed that only Melmet5 extracts were positive for CD73. The protein was highly enriched in exosomes,
revealing an almost four-fold increase in signal intensity compared to cells. Representative images of three
biological replicates.
3.2.4 N-cadherin in brain metastasis cell lines
In the brain, N-cadherin is reported to have important neuronal and synaptic functions and N-
cadherin cleavage is implicated in brain pathologies such as Alzheimer’s disease [98]. In vivo
experiments have shown that Melmet1 cells frequently metastasize to the brain [99]. To
investigate whether N-cadherin cleavage is a common characteristic of brain-seeking
exosomes, we isolated vesicles from two brain metastatic melanoma cell lines, HM19 and
HM86. The purified vesicles displayed the exosome markers TSG101 and CD9 as well as
minor contamination signals for CANX (Figure 3.9A, B and C). FLOT-1 was used as a
positive control for vesicle enrichment. These results demonstrated that the purified vesicular
population was highly enriched in exosomes. Of note, two CD9 products were detected in the
tested exosome extracts, as this, similarly to Melmet5 exosomes, may be attributed to
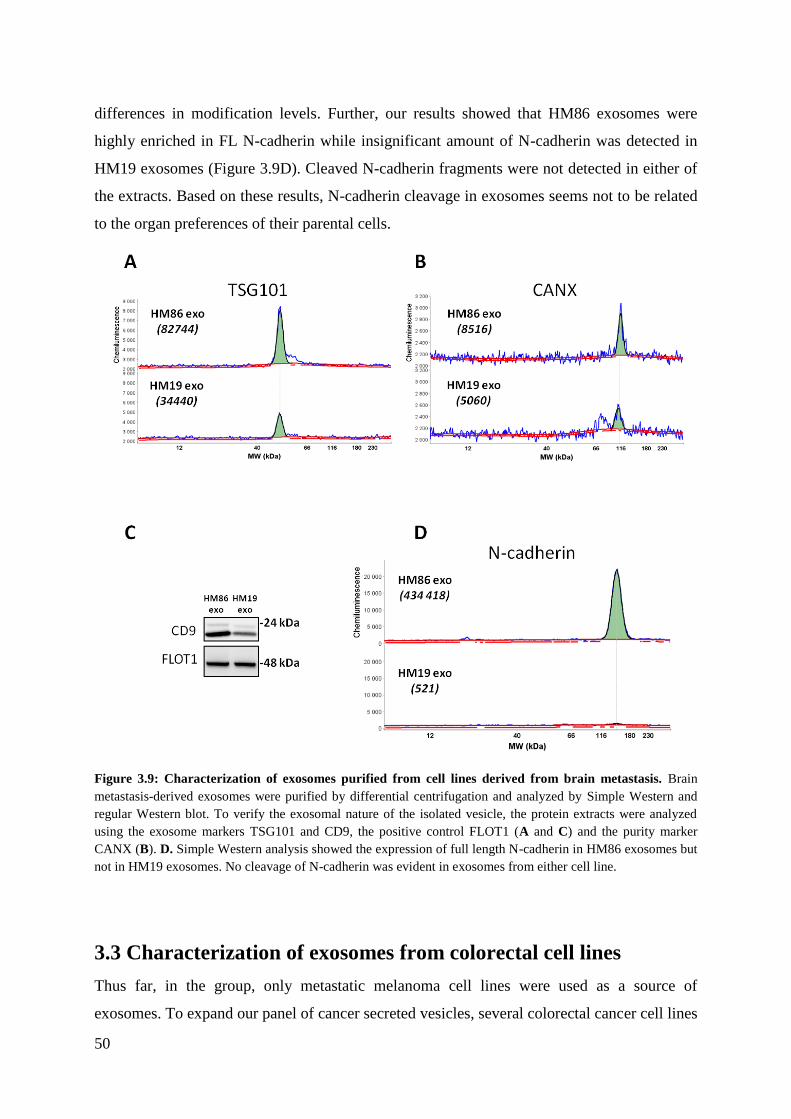
50
differences in modification levels. Further, our results showed that HM86 exosomes were
highly enriched in FL N-cadherin while insignificant amount of N-cadherin was detected in
HM19 exosomes (Figure 3.9D). Cleaved N-cadherin fragments were not detected in either of
the extracts. Based on these results, N-cadherin cleavage in exosomes seems not to be related
to the organ preferences of their parental cells.
Figure 3.9: Characterization of exosomes purified from cell lines derived from brain metastasis. Brain
metastasis-derived exosomes were purified by differential centrifugation and analyzed by Simple Western and
regular Western blot. To verify the exosomal nature of the isolated vesicle, the protein extracts were analyzed
using the exosome markers TSG101 and CD9, the positive control FLOT1 (A and C) and the purity marker
CANX (B). D. Simple Western analysis showed the expression of full length N-cadherin in HM86 exosomes but
not in HM19 exosomes. No cleavage of N-cadherin was evident in exosomes from either cell line.
3.3 Characterization of exosomes from colorectal cell lines
Thus far, in the group, only metastatic melanoma cell lines were used as a source of
exosomes. To expand our panel of cancer secreted vesicles, several colorectal cancer cell lines
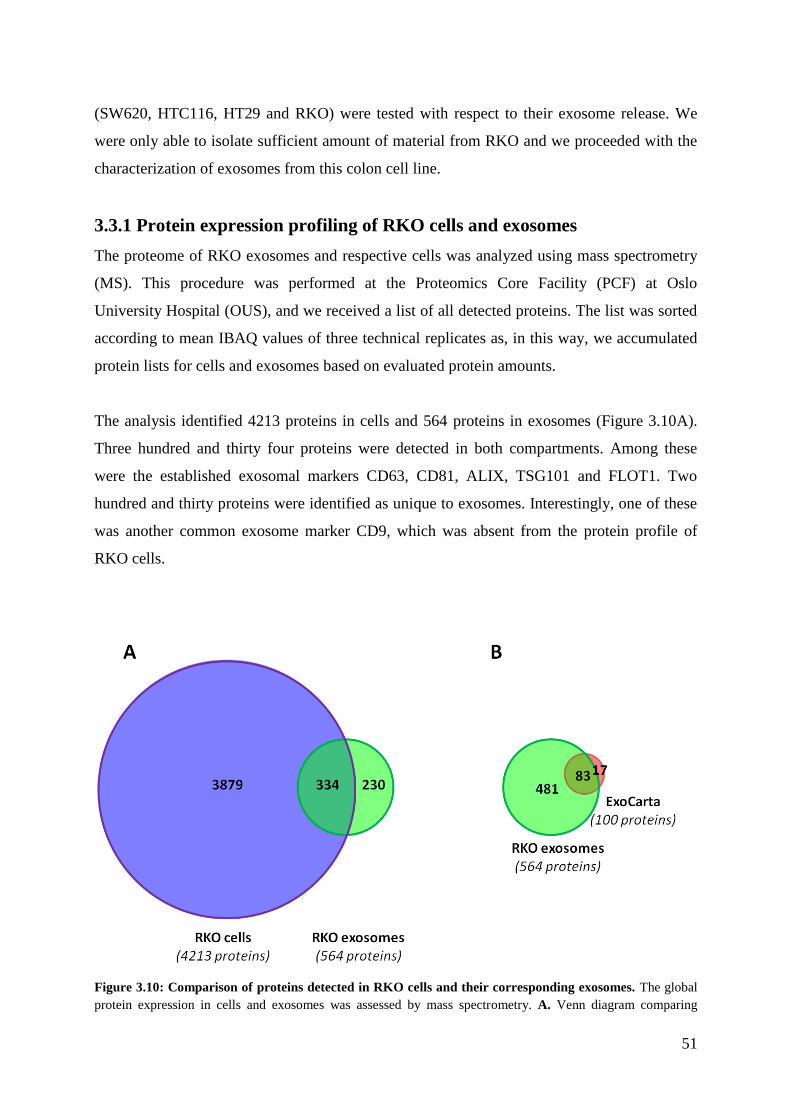
51
(SW620, HTC116, HT29 and RKO) were tested with respect to their exosome release. We
were only able to isolate sufficient amount of material from RKO and we proceeded with the
characterization of exosomes from this colon cell line.
3.3.1 Protein expression profiling of RKO cells and exosomes
The proteome of RKO exosomes and respective cells was analyzed using mass spectrometry
(MS). This procedure was performed at the Proteomics Core Facility (PCF) at Oslo
University Hospital (OUS), and we received a list of all detected proteins. The list was sorted
according to mean IBAQ values of three technical replicates as, in this way, we accumulated
protein lists for cells and exosomes based on evaluated protein amounts.
The analysis identified 4213 proteins in cells and 564 proteins in exosomes (Figure 3.10A).
Three hundred and thirty four proteins were detected in both compartments. Among these
were the established exosomal markers CD63, CD81, ALIX, TSG101 and FLOT1. Two
hundred and thirty proteins were identified as unique to exosomes. Interestingly, one of these
was another common exosome marker CD9, which was absent from the protein profile of
RKO cells.
Figure 3.10: Comparison of proteins detected in RKO cells and their corresponding exosomes. The global
protein expression in cells and exosomes was assessed by mass spectrometry. A. Venn diagram comparing
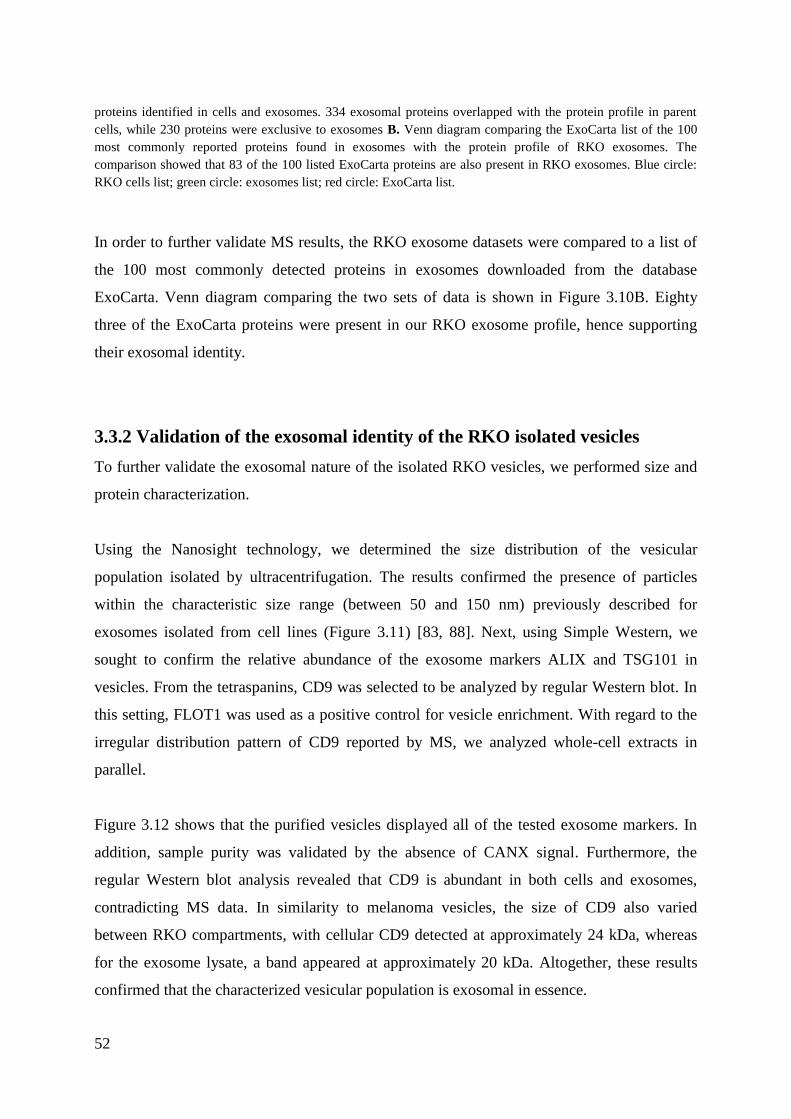
52
proteins identified in cells and exosomes. 334 exosomal proteins overlapped with the protein profile in parent
cells, while 230 proteins were exclusive to exosomes B. Venn diagram comparing the ExoCarta list of the 100
most commonly reported proteins found in exosomes with the protein profile of RKO exosomes. The
comparison showed that 83 of the 100 listed ExoCarta proteins are also present in RKO exosomes. Blue circle:
RKO cells list; green circle: exosomes list; red circle: ExoCarta list.
In order to further validate MS results, the RKO exosome datasets were compared to a list of
the 100 most commonly detected proteins in exosomes downloaded from the database
ExoCarta. Venn diagram comparing the two sets of data is shown in Figure 3.10B. Eighty
three of the ExoCarta proteins were present in our RKO exosome profile, hence supporting
their exosomal identity.
3.3.2 Validation of the exosomal identity of the RKO isolated vesicles
To further validate the exosomal nature of the isolated RKO vesicles, we performed size and
protein characterization.
Using the Nanosight technology, we determined the size distribution of the vesicular
population isolated by ultracentrifugation. The results confirmed the presence of particles
within the characteristic size range (between 50 and 150 nm) previously described for
exosomes isolated from cell lines (Figure 3.11) [83, 88]. Next, using Simple Western, we
sought to confirm the relative abundance of the exosome markers ALIX and TSG101 in
vesicles. From the tetraspanins, CD9 was selected to be analyzed by regular Western blot. In
this setting, FLOT1 was used as a positive control for vesicle enrichment. With regard to the
irregular distribution pattern of CD9 reported by MS, we analyzed whole-cell extracts in
parallel.
Figure 3.12 shows that the purified vesicles displayed all of the tested exosome markers. In
addition, sample purity was validated by the absence of CANX signal. Furthermore, the
regular Western blot analysis revealed that CD9 is abundant in both cells and exosomes,
contradicting MS data. In similarity to melanoma vesicles, the size of CD9 also varied
between RKO compartments, with cellular CD9 detected at approximately 24 kDa, whereas
for the exosome lysate, a band appeared at approximately 20 kDa. Altogether, these results
confirmed that the characterized vesicular population is exosomal in essence.
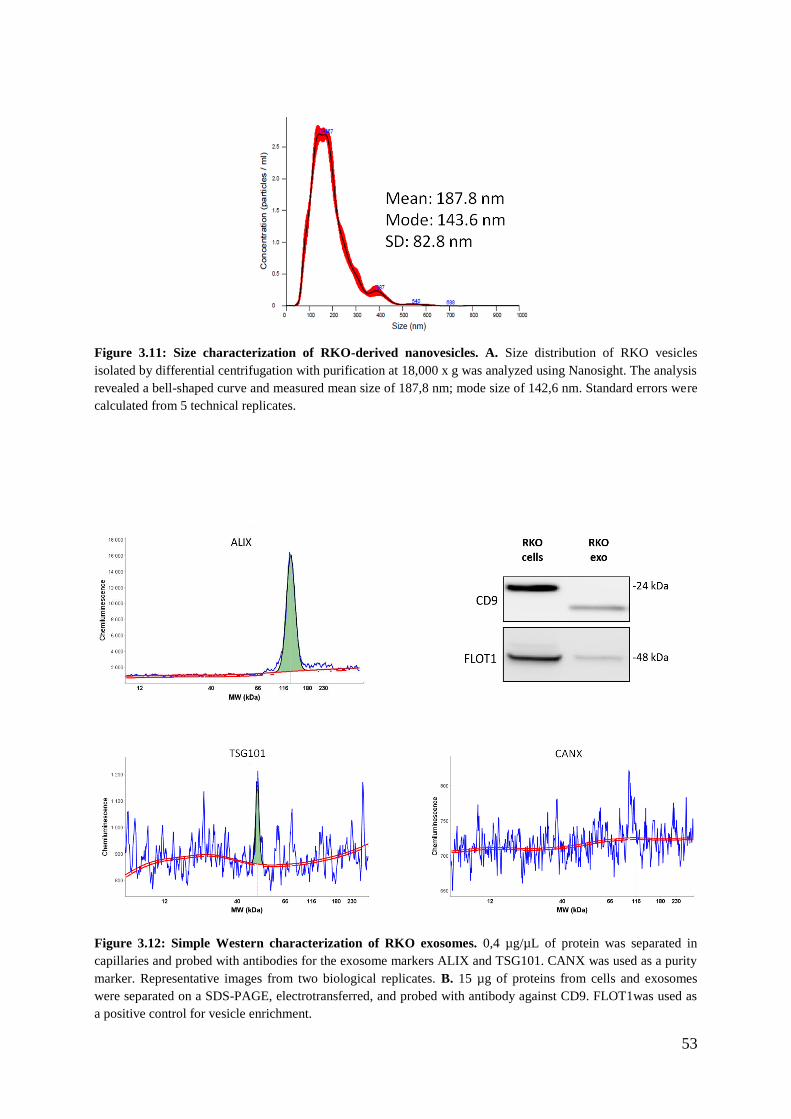
53
Figure 3.11: Size characterization of RKO-derived nanovesicles. A. Size distribution of RKO vesicles
isolated by differential centrifugation with purification at 18,000 x g was analyzed using Nanosight. The analysis
revealed a bell-shaped curve and measured mean size of 187,8 nm; mode size of 142,6 nm. Standard errors were
calculated from 5 technical replicates.
Figure 3.12: Simple Western characterization of RKO exosomes. 0,4 µg/µL of protein was separated in
capillaries and probed with antibodies for the exosome markers ALIX and TSG101. CANX was used as a purity
marker. Representative images from two biological replicates. B. 15 µg of proteins from cells and exosomes
were separated on a SDS-PAGE, electrotransferred, and probed with antibody against CD9. FLOT1was used as
a positive control for vesicle enrichment.
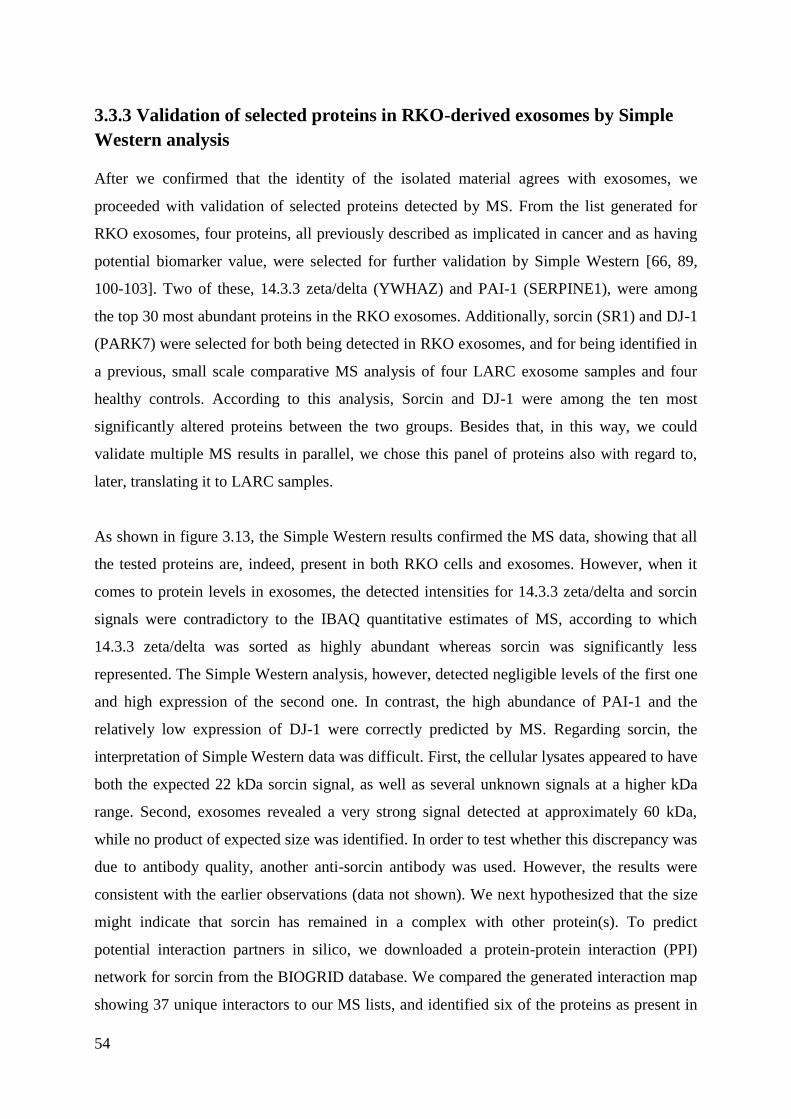
54
3.3.3 Validation of selected proteins in RKO-derived exosomes by Simple
Western analysis
After we confirmed that the identity of the isolated material agrees with exosomes, we
proceeded with validation of selected proteins detected by MS. From the list generated for
RKO exosomes, four proteins, all previously described as implicated in cancer and as having
potential biomarker value, were selected for further validation by Simple Western [66, 89,
100-103]. Two of these, 14.3.3 zeta/delta (YWHAZ) and PAI-1 (SERPINE1), were among
the top 30 most abundant proteins in the RKO exosomes. Additionally, sorcin (SR1) and DJ-1
(PARK7) were selected for both being detected in RKO exosomes, and for being identified in
a previous, small scale comparative MS analysis of four LARC exosome samples and four
healthy controls. According to this analysis, Sorcin and DJ-1 were among the ten most
significantly altered proteins between the two groups. Besides that, in this way, we could
validate multiple MS results in parallel, we chose this panel of proteins also with regard to,
later, translating it to LARC samples.
As shown in figure 3.13, the Simple Western results confirmed the MS data, showing that all
the tested proteins are, indeed, present in both RKO cells and exosomes. However, when it
comes to protein levels in exosomes, the detected intensities for 14.3.3 zeta/delta and sorcin
signals were contradictory to the IBAQ quantitative estimates of MS, according to which
14.3.3 zeta/delta was sorted as highly abundant whereas sorcin was significantly less
represented. The Simple Western analysis, however, detected negligible levels of the first one
and high expression of the second one. In contrast, the high abundance of PAI-1 and the
relatively low expression of DJ-1 were correctly predicted by MS. Regarding sorcin, the
interpretation of Simple Western data was difficult. First, the cellular lysates appeared to have
both the expected 22 kDa sorcin signal, as well as several unknown signals at a higher kDa
range. Second, exosomes revealed a very strong signal detected at approximately 60 kDa,
while no product of expected size was identified. In order to test whether this discrepancy was
due to antibody quality, another anti-sorcin antibody was used. However, the results were
consistent with the earlier observations (data not shown). We next hypothesized that the size
might indicate that sorcin has remained in a complex with other protein(s). To predict
potential interaction partners in silico, we downloaded a protein-protein interaction (PPI)
network for sorcin from the BIOGRID database. We compared the generated interaction map
showing 37 unique interactors to our MS lists, and identified six of the proteins as present in
55
RKO exosomes (marked with green stars) (Figure 3.14). An effort to unravel this further
involved MS analysis of polyacrylamide gel pieces excised from the lanes holding RKO
extracts, both cellular and exosomal, at the appropriate sizes. However, this analysis did not
detect either sorcin or predicted sorcin partners within the pool of proteins extracted from the
gel pieces.
In summary, all the tested proteins were present in RKO cells and exosomes in agreement
with MS results. However, the iBAQ-based quantification by MS did not correlate with the
signals detected by Simple Western for 14.3.3 zeta/delta and sorcin. Moreover, a strong sorcin
signal, inconsistent with the reported size for this protein, was observed in exosomes.
Attempts to identify that as a complex of interacting partners have failed so far.
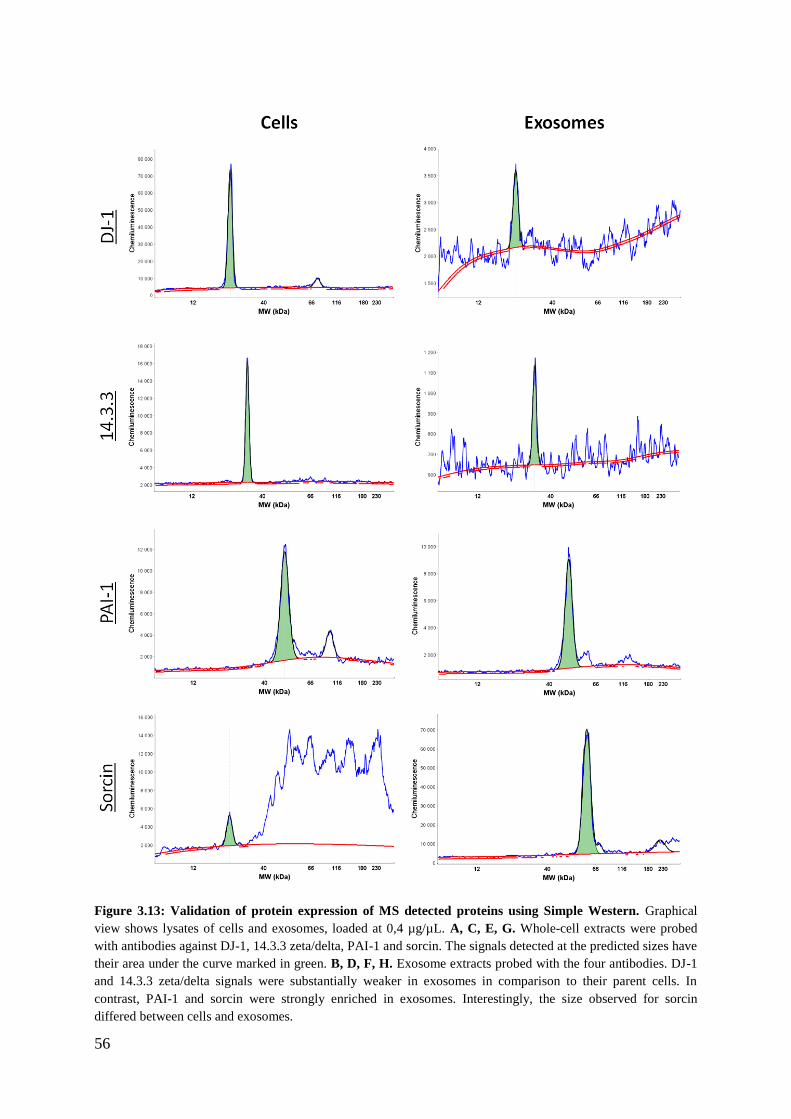
56
Figure 3.13: Validation of protein expression of MS detected proteins using Simple Western. Graphical
view shows lysates of cells and exosomes, loaded at 0,4 µg/µL. A, C, E, G. Whole-cell extracts were probed
with antibodies against DJ-1, 14.3.3 zeta/delta, PAI-1 and sorcin. The signals detected at the predicted sizes have
their area under the curve marked in green. B, D, F, H. Exosome extracts probed with the four antibodies. DJ-1
and 14.3.3 zeta/delta signals were substantially weaker in exosomes in comparison to their parent cells. In
contrast, PAI-1 and sorcin were strongly enriched in exosomes. Interestingly, the size observed for sorcin
differed between cells and exosomes.
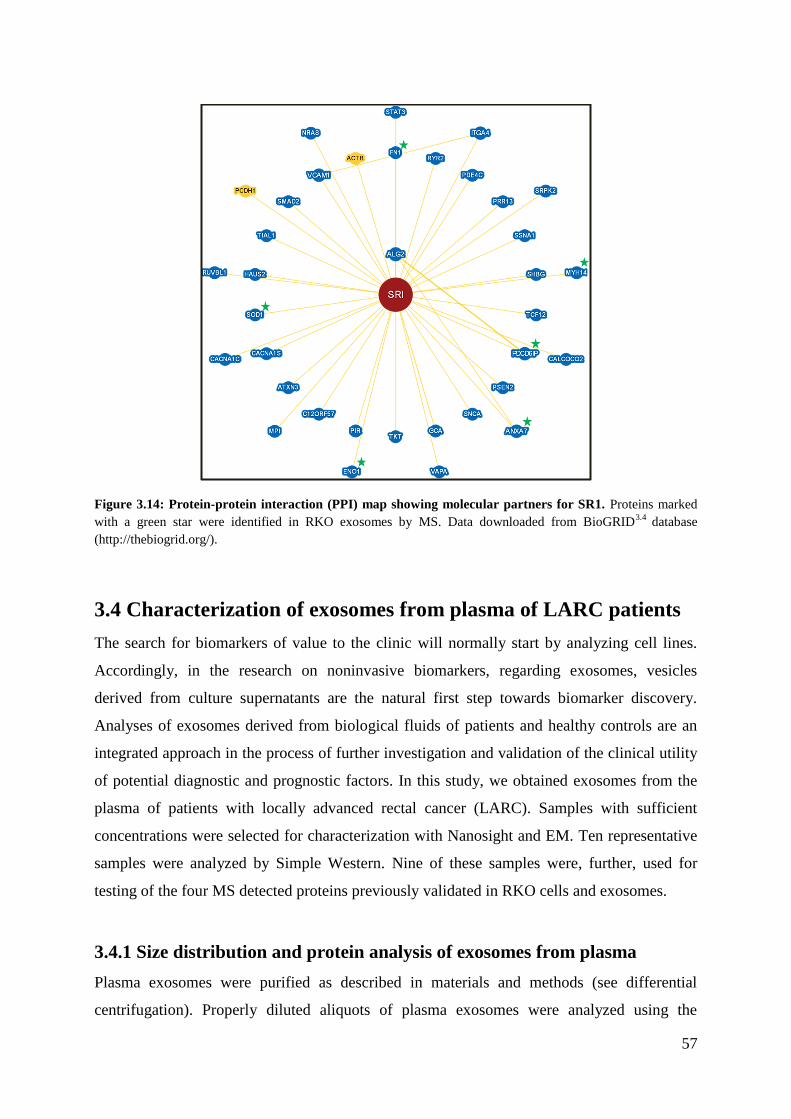
57
Figure 3.14: Protein-protein interaction (PPI) map showing molecular partners for SR1. Proteins marked
with a green star were identified in RKO exosomes by MS. Data downloaded from BioGRID3.4
database
(http://thebiogrid.org/).
3.4 Characterization of exosomes from plasma of LARC patients
The search for biomarkers of value to the clinic will normally start by analyzing cell lines.
Accordingly, in the research on noninvasive biomarkers, regarding exosomes, vesicles
derived from culture supernatants are the natural first step towards biomarker discovery.
Analyses of exosomes derived from biological fluids of patients and healthy controls are an
integrated approach in the process of further investigation and validation of the clinical utility
of potential diagnostic and prognostic factors. In this study, we obtained exosomes from the
plasma of patients with locally advanced rectal cancer (LARC). Samples with sufficient
concentrations were selected for characterization with Nanosight and EM. Ten representative
samples were analyzed by Simple Western. Nine of these samples were, further, used for
testing of the four MS detected proteins previously validated in RKO cells and exosomes.
3.4.1 Size distribution and protein analysis of exosomes from plasma
Plasma exosomes were purified as described in materials and methods (see differential
centrifugation). Properly diluted aliquots of plasma exosomes were analyzed using the
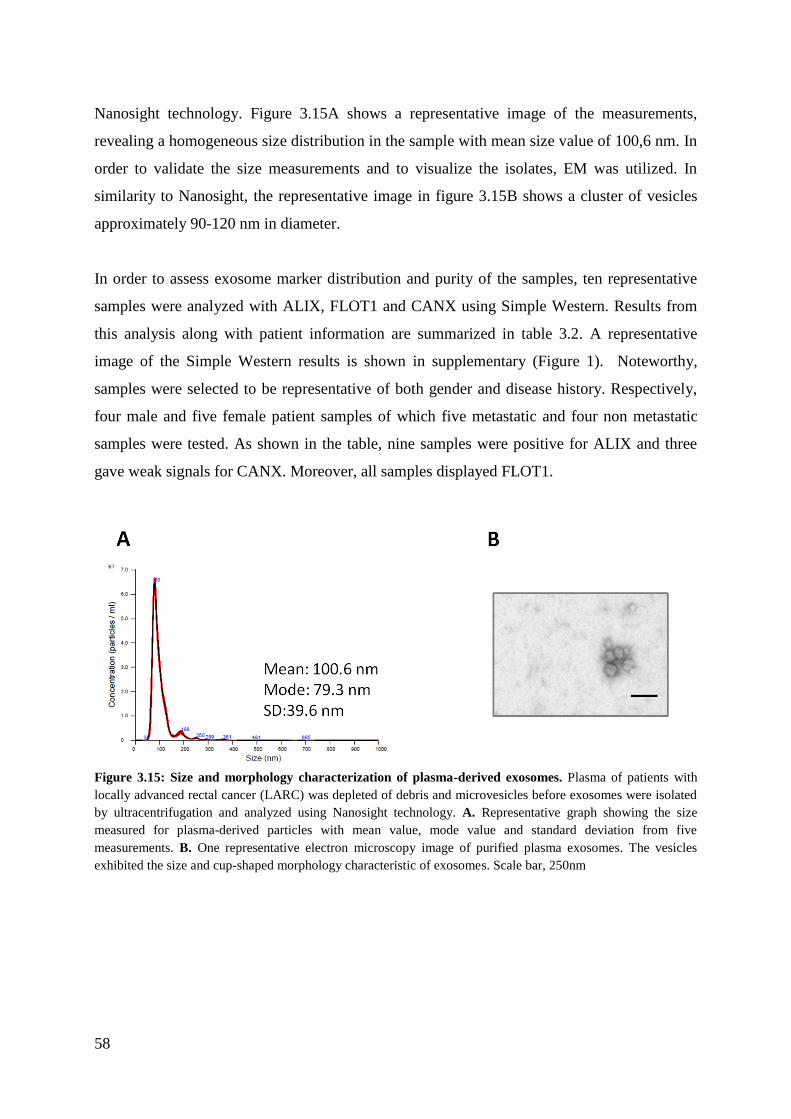
58
Nanosight technology. Figure 3.15A shows a representative image of the measurements,
revealing a homogeneous size distribution in the sample with mean size value of 100,6 nm. In
order to validate the size measurements and to visualize the isolates, EM was utilized. In
similarity to Nanosight, the representative image in figure 3.15B shows a cluster of vesicles
approximately 90-120 nm in diameter.
In order to assess exosome marker distribution and purity of the samples, ten representative
samples were analyzed with ALIX, FLOT1 and CANX using Simple Western. Results from
this analysis along with patient information are summarized in table 3.2. A representative
image of the Simple Western results is shown in supplementary (Figure 1). Noteworthy,
samples were selected to be representative of both gender and disease history. Respectively,
four male and five female patient samples of which five metastatic and four non metastatic
samples were tested. As shown in the table, nine samples were positive for ALIX and three
gave weak signals for CANX. Moreover, all samples displayed FLOT1.
Figure 3.15: Size and morphology characterization of plasma-derived exosomes. Plasma of patients with
locally advanced rectal cancer (LARC) was depleted of debris and microvesicles before exosomes were isolated
by ultracentrifugation and analyzed using Nanosight technology. A. Representative graph showing the size
measured for plasma-derived particles with mean value, mode value and standard deviation from five
measurements. B. One representative electron microscopy image of purified plasma exosomes. The vesicles
exhibited the size and cup-shaped morphology characteristic of exosomes. Scale bar, 250nm
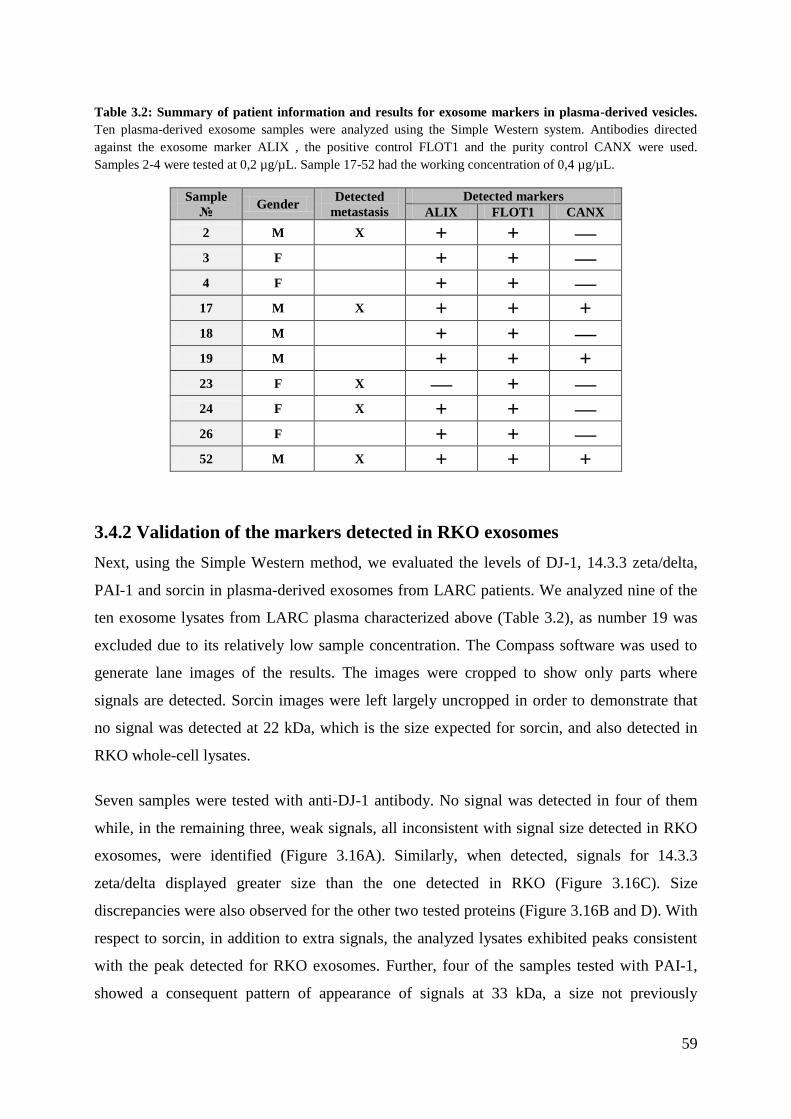
59
Table 3.2: Summary of patient information and results for exosome markers in plasma-derived vesicles.
Ten plasma-derived exosome samples were analyzed using the Simple Western system. Antibodies directed
against the exosome marker ALIX , the positive control FLOT1 and the purity control CANX were used.
Samples 2-4 were tested at 0,2 µg/µL. Sample 17-52 had the working concentration of 0,4 µg/µL.
Sample
№ Gender
Detected
metastasis
Detected markers
ALIX FLOT1 CANX
2 M X + + —
3 F + + —
4 F + + —
17 M X + + +
18 M + + —
19 M + + +
23 F X — + —
24 F X + + —
26 F + + —
52 M X + + +
3.4.2 Validation of the markers detected in RKO exosomes
Next, using the Simple Western method, we evaluated the levels of DJ-1, 14.3.3 zeta/delta,
PAI-1 and sorcin in plasma-derived exosomes from LARC patients. We analyzed nine of the
ten exosome lysates from LARC plasma characterized above (Table 3.2), as number 19 was
excluded due to its relatively low sample concentration. The Compass software was used to
generate lane images of the results. The images were cropped to show only parts where
signals are detected. Sorcin images were left largely uncropped in order to demonstrate that
no signal was detected at 22 kDa, which is the size expected for sorcin, and also detected in
RKO whole-cell lysates.
Seven samples were tested with anti-DJ-1 antibody. No signal was detected in four of them
while, in the remaining three, weak signals, all inconsistent with signal size detected in RKO
exosomes, were identified (Figure 3.16A). Similarly, when detected, signals for 14.3.3
zeta/delta displayed greater size than the one detected in RKO (Figure 3.16C). Size
discrepancies were also observed for the other two tested proteins (Figure 3.16B and D). With
respect to sorcin, in addition to extra signals, the analyzed lysates exhibited peaks consistent
with the peak detected for RKO exosomes. Further, four of the samples tested with PAI-1,
showed a consequent pattern of appearance of signals at 33 kDa, a size not previously
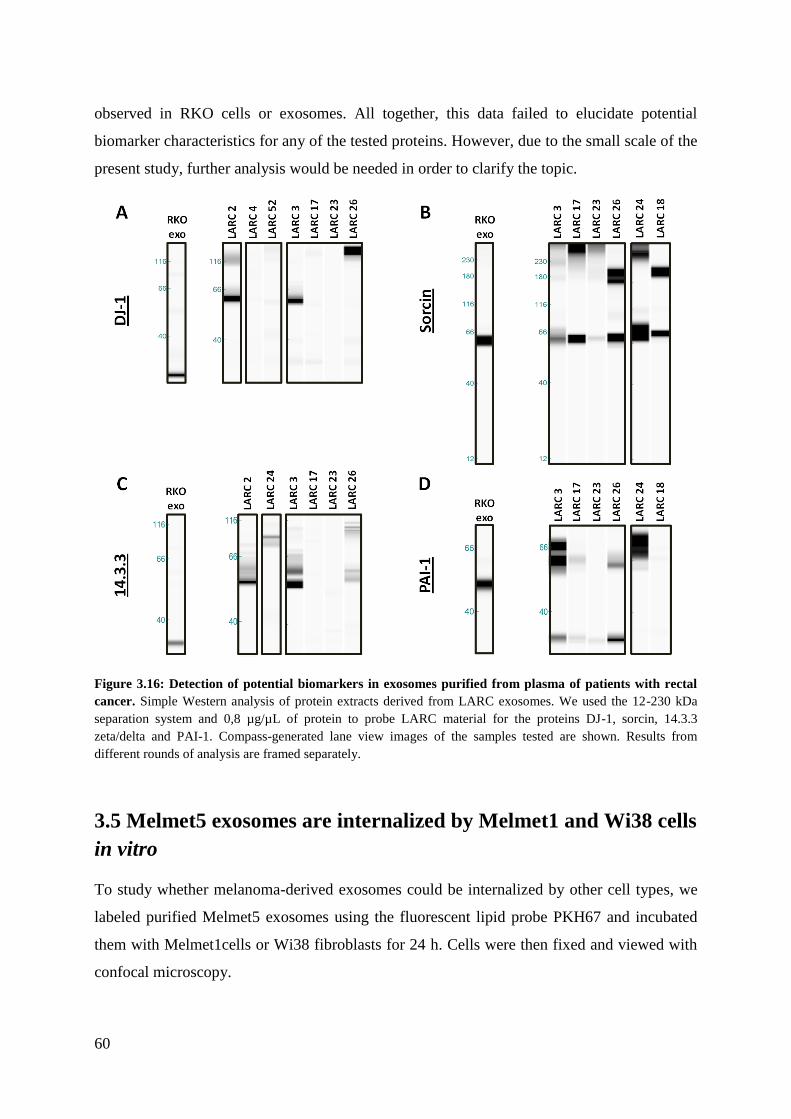
60
observed in RKO cells or exosomes. All together, this data failed to elucidate potential
biomarker characteristics for any of the tested proteins. However, due to the small scale of the
present study, further analysis would be needed in order to clarify the topic.
Figure 3.16: Detection of potential biomarkers in exosomes purified from plasma of patients with rectal
cancer. Simple Western analysis of protein extracts derived from LARC exosomes. We used the 12-230 kDa
separation system and 0,8 µg/µL of protein to probe LARC material for the proteins DJ-1, sorcin, 14.3.3
zeta/delta and PAI-1. Compass-generated lane view images of the samples tested are shown. Results from
different rounds of analysis are framed separately.
3.5 Melmet5 exosomes are internalized by Melmet1 and Wi38 cells
in vitro
To study whether melanoma-derived exosomes could be internalized by other cell types, we
labeled purified Melmet5 exosomes using the fluorescent lipid probe PKH67 and incubated
them with Melmet1cells or Wi38 fibroblasts for 24 h. Cells were then fixed and viewed with
confocal microscopy.
61
The results showed that both cell lines acquired PKH67 fluorescence, indicating uptake of
exosomes (Figure 3.17). Interestingly, in contrast to Wi38 images showing an even
distribution of the fluorescent signal in fibroblasts, the analysis revealed a more
heterogeneous internalization pattern for Melmet1 cells. All together, these results
demonstrate that Melmet5-derived exosomes are taken up in vitro by both stroma cells and
cancer cells.
Figure 3.17: Uptake of exosomes by Melmet1 cells and Wi38 fibroblasts. The exosomes were labelled with
PKH67 dye (green fluorescence) as described in Materials and methods. The cells were incubated with the
fluorescent exosomes for 24 h. After this, the cells were fixed and pictures were taken using a confocal
microscope. Scale bar, 20 µm. (Representative of n = 2).
3.6 Metabolic analysis of fibroblasts co-cultured with Melmet5
exosomes
The Seahorse™ technology is valuable for performing in vitro surveillance studies of cellular
metabolic activities in real time. It enables the metabolic profiling of cells as well as the
detection of metabolic changes induced by environmental stresses. After we demonstrated
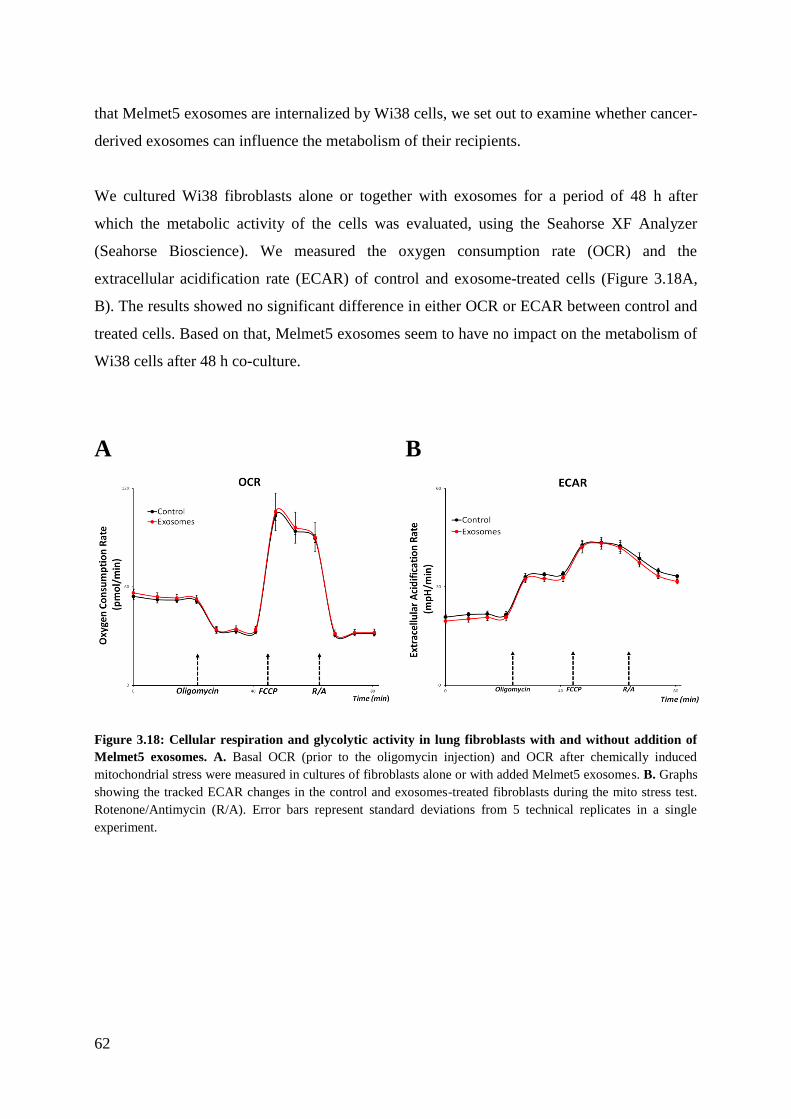
62
that Melmet5 exosomes are internalized by Wi38 cells, we set out to examine whether cancer-
derived exosomes can influence the metabolism of their recipients.
We cultured Wi38 fibroblasts alone or together with exosomes for a period of 48 h after
which the metabolic activity of the cells was evaluated, using the Seahorse XF Analyzer
(Seahorse Bioscience). We measured the oxygen consumption rate (OCR) and the
extracellular acidification rate (ECAR) of control and exosome-treated cells (Figure 3.18A,
B). The results showed no significant difference in either OCR or ECAR between control and
treated cells. Based on that, Melmet5 exosomes seem to have no impact on the metabolism of
Wi38 cells after 48 h co-culture.
A B
Figure 3.18: Cellular respiration and glycolytic activity in lung fibroblasts with and without addition of
Melmet5 exosomes. A. Basal OCR (prior to the oligomycin injection) and OCR after chemically induced
mitochondrial stress were measured in cultures of fibroblasts alone or with added Melmet5 exosomes. B. Graphs
showing the tracked ECAR changes in the control and exosomes-treated fibroblasts during the mito stress test.
Rotenone/Antimycin (R/A). Error bars represent standard deviations from 5 technical replicates in a single
experiment.
63
4 Discussion
4.1 Exploring protocol adjustments
In this thesis, we performed characterization of EVs and exosomes isolated by differential
centrifugation with introduced speed variations. The aim was to test whether we can improve
exosomal yield by optimizing the isolation protocol. In addition to the five markers used to
confirm the exosomal identity of the isolated vesicles, we included three markers expected to
be depleted in exosomes; calnexin (CANX), cytochrome c (CYC1) and golgin (GM130).
CANX is a chaperon protein residing in the endoplasmic reticulum (ER), where it assists the
folding of the newly synthesized proteins. CYC1 is a mitochondrial marker that in apoptotic
cells is released into the cytosole. GM130 is a member of the Golgin family of proteins,
which functions include establishing and maintaining Golgi structure and transport. None of
these proteins should, to our knowledge, be present in exosomes, so they were used to assess
the purity of the isolated material. In addition to protocol optimization, this experimental
design allowed for a detailed testing of the applicability of commonly used exosomal markers
with regard to exosomes derived from the melanoma cell lines, Melmet1 and Melmet5.
4.1.1 The tetraspanins and Flotillin-1 are not specific to exosomes
The members of the tetraspanin family, CD9, CD63 and CD81, are among the proteins most
commonly associated with exosomes [38]. Their establishment as commonly accepted
exosome markers has been strongly supported by independent studies showing their
enrichment on MVB-derived vesicles [41, 104]. In accordance with this, we explored two of
the tetraspanins, CD9 and CD63, as exosome markers for melanoma-derived vesicles.
In this study, CD9 expression was detected across all vesicular populations, with expression
levels varying between cell types. In particular, the CD9 was abundant in EVs from both cell
lines, but only detected in exosomes from Melmet5 (Figure 3.1A and B left panels).
Moreover, we present evidence that CD9 is differentially modified in cells and vesicles. This
is in agreement with a previous study which has illustrated that CD9 can be modified by both
O-and N-glycosylation as well as by acylation [105]. Our results show that RKO cells and
Melmet1 and Melmet5 EVs (Figure 3.1 A and B, and figure 3.12) express a ca. 24 kDa form
of the protein which, according to Seehafer et al., is shown to be expressed in carcinoma cell
64
lines, biopsies and epithelial tissues [105]. In addition, exosomes from all cancer cell lines
included in our analysis, express a smaller versions of the protein, approximately 20 kDa and
22 kDa, which agree with the sizes reported for the unglycosylated precursor and the O-
glycosylated version of CD9, respectively (Figure 3.1B, figure 3.9C and figure 3.12) [105].
CD63 was one of the first proteins described as enriched in exosomes [41]. In accordance
with this, we employed CD63 in our analysis to specifically identify vesicles of exosomal
origin. However, our results showed that CD63 is represented in all EV fractions and not
enriched in exosomes (Figure 3.1A and B). This observation is consistent with a previous
report by Jørgensen et al. [42], showing that, in plasma exosomes, CD63 is underrepresented
in comparison to CD81 and CD9. These results, together with our findings, undermine the
capacity of CD63 to function as an exosomal marker.
Aware of the unreliability of the tetraspanins, ISEV has recommended using at least one
additional exosome marker of cytosolic origin in combination with a tetraspanin to validate
that the purified material is exosomal [87]. To comply with this requirement, we included
three additional markers, one of which was flotillin-1 (FLOT1). A sucrose gradient
fractionation of vesicular populations has previously identified FLOT1 expression as
characteristic for exosome containing fractions [43]. However, our Simple Western analysis
of the vesicles isolated by differential centrifugation revealed that FLOT1 is abundant across
all populations. Thus, similar to CD9 and CD63, FLOT1 showed lack of specificity towards
the exosomal subtype of extracellular vesicles. In this respect, our results demonstrated that
the other two cytosolic proteins used in the study, ALIX and TSG101, show greater exosome
specificity towards exosomes derived from the two cells lines, Melmet1 and Melmet5 and are,
therefore, better suited as exosome markers in future investigations. However, due to the high
expression levels of FLOT1, we evaluated its application as a more general positive marker of
vesicular enrichment.
4.1.2 G-force reduction influences yield and purity
There are many different methods for exosome isolation, and at the moment there is little
consensus regarding the criteria for purity. Consequently different laboratories employ
different strategies, probably resulting in different populations of vesicles being analyzed.
[84]. The recently published position paper from ISEV illustrates the need for validation and
65
standardization of the isolation methods [81]. The most utilized isolation technique is
differential centrifugation and, as such, the requirement for standardization is most urgent for
this method. Cvjetkovic and colleagues have shown that rotor type and centrifugation time
influence the yield and the purity of the material [82]. Here we assessed how speed variations
during the second purification step influence these parameters. As indicated by our results,
force reduction is directly proportional to purity, and inversely proportional to yield. Protein
analysis of vesicular extracts obtained after purification at either 16,000 x g or 20,000 x g
showed that the exosome marker ALIX was detected in all exosome extracts, with lower
speed fractions expressing higher ALIX contents (Figure 3.1). This is indicative of increased
exosomal yield at that force level. Simultaneously, the purity of the material was slightly
reduced, as evident from the detection of weak bands for CANX and CYC1 by regular
western blot, and by the increased signals obtained for CANX and GM130 by Simple
Western (Figure 3.1 and figure 3.2). This indicates the co-precipitation of other types of EVs
together with exosomes. Nanosight and EM results further supported this by showing slightly
more heterogeneous size distributions in the exosomal fractions isolated after a 16,000 x g
purification (Figure 3.1A, B and figure 3.2E, F).
Combined, these results support the notion that higher forces offer increased purification
capacity. Further, the results also indicate that exosomal material has been removed together
with bigger vesicles, thus reducing the final yield after exosome isolation. Following a careful
evaluation, we decided that the g-force should still be kept at higher rates than 16,000 x g,
with respect to exosome isolation from cultured media. However, due to the possibility to
increase our yield, we modified the preparation method, adjusting the purification force to
18,000 x g. It should be noted that 16,000 x g still delivered acceptable results and we applied
this force to less accessible sources of exosomes such as patient-derived material.
Methodological considerations
Blotting techniques are highly dependent on reference points called loading controls to
validate the equal loading of compared protein material. In the case of whole-cell extracts,
loading controls are normally ubiquitous proteins regarded as be equally expressed across cell
types. These are often the so called house-keeping proteins that a cell cannot function without.
Among the most extensively used ones are the cytoskeleton constituents actin and tubulin and
66
the metabolic enzyme GAPDH. No such protein has been identified for use in comparative
analysis of protein extracts derived from different cellular compartments. In the absence of
loading controls, blotting methods, among others, solely depend on measurements of protein
concentrations for normalization. With regard to exosome lysates, accurate measurements can
be challenging due to small sample volumes and low protein concentrations. Deviations in
figure 3.2A and C illustrate that, by showing higher peaks for 20,000 x g exosome fraction
than the 16,000 x g fraction. We believe that this inconsistency is due to errors in protein
concentration measurements.
4.2 Expression of proteins in melanoma cells and cell-derived
vesicles
In the present study, we explored the protein expression of melanoma cells and corresponding
vesicles. We selected proteins that have previously been reported as characteristic for
melanoma progression or, alternatively, that have been detected by mass spectrometry
analysis in exosomes from our melanoma models.
We have shown that exosomes derived from metastatic melanoma cell lines are enriched in
the immune regulatory proteins B7-H3 and CD73 (Figure 3.5A and figure 3.8). A previous
report has demonstrated that B7-H3 expression in cell lines and clinical specimens did not
vary considerably between primary and metastatic melanoma [94]. Here we showed that B7-
H3 is abundant both in metastatic melanoma cell lines with a proliferative phenotype
(Melmet5), and in cells with an invasive phenotype (Melmet1) [99]. Interestingly, the protein
seems to be highly enriched in exosomes from both cell lines. As this observation is based on
the comparison of equal amounts of proteins coming from all compartments, there are at least
two possible explanations; B7-H3 is actually enriched in exosomes, or B7-H3, being a
transmembrane protein, is enriched in exosomal lysates since exosomes have higher
membrane to content ratio than cell lysates. If the latter explanation is correct, all membrane
proteins should, in theory, be highly enriched in exosomes. However, we have not observed
that with respect to other membrane proteins that were tested in this work (e.g. N-cadherin).
This would indicate that B7-H3 is actually enriched in exosomes.
67
In contrast to B7-H3, we found that CD73 is only expressed by Melmet5 cells and exosomes,
thus validating previous MS data. This protein has recently received much interest as it is a
potential target for immunotherapy, and clinical trials using anti-CD73 mAbs are currently
ongoing [106]. In this respect, further investigation of CD73 funcion in Melmet5 cells and
exosomes might be of potential clinical interest.
The expression of CD73 on the surface of tumor cells and exosomes has previously been
reported to impair antitumor T-cell responses through the production of immunosuppressive
adenosine in the cancer microenvironment [75, 97]. In accordance, B7-H3 expression on
tumor cells can facilitate immune surveillance escape and promote immune tolerance [93].
Several publications have implicated B7-H3 expression with melanoma invasion and
migration [93, 94]. As these two immune modulatory molecules are highly expressed on our
metastatic melanoma exosomes, it would be of interest to explore their biological function in
tumor invasion and metastasis.
Melanoma development is marked by a switch in the cadherin profiles of the cells [9].
Interactions between cadherin molecules on adjacent cells promote cell-to-cell adhesion
through the formation of adhesion complexes. N-cadherin expression was shown to promote
survival and migration of melanoma cells by enhancing their ability to adhere to one another
and to stromal cells [12].
Our protein analysis revealed a distinct expression pattern for N-cadherin in Melmet1
exosomes where, in addition to the signal corresponding to the full length protein, two
additional signals were detected (Figure 3.5B). These were identified as C-terminal fragments
produced after the proteolytic cleavage of full length (FL) N-cadherin. We showed that this
enzymatic processing of exosomal N-cadherin is dependent on the activity of the
metalloproteinase ADAM10 (Figure 3.7). ADAM10-induced proteolysis leads to shedding of
the N-terminal domain of N-cadherin, also called ectodomain shedding, and to the formation
of a transmembrane domain called C-terminal fragment 1 (CTF1). This domain can further be
processed by the protease gamma-secretase which leads to the release of a C-terminal
fragment 2 (CTF2) (Figure 4.1) [95, 98, 107]. It has been shown that proteolytic processing of
N-cadherin enhances synapse damage in the brain, thus associating CTFs formation with
brain pathologies [98, 107]. In correlation, Melmet1 cells have previously demonstrated high
68
brain metastatic capacity [99]. In order to investigate whether CTFs in melanoma exosomes
might be a characteristic of brain-adaptive pathology, we isolated exosomes from two brain
metastatic melanoma cell lines, HM19 and HM86. Though FL N-cadherin was detected in
HM86 exosomes, none of the cell lines expressed CTFs in the exosomal fraction (Figure
3.9D). These findings indicate that the presence of CTFs in exosomes from brain metastatic
cell lines is not a molecular determinant of the brain-adaptive phenotypes.
Ectodomain shedding at the cell surface might interfere with intercellular adhesion, promoting
cell migration and invasion [108]. This correlates with the previously described invasive
phenotype of Melmet1 cells [99]. Given that CTFs also have been shown to exert biological
activity [107, 109], an interesting subject for further investigation would be the functional role
of the N-cadherin cleavage in Melmet1 exosomes. In parallel, we can investigate whether N-
cadherin cleavage is initiated at the cell surface or that full length protein is first imported into
exosomes where it, consequently, undergoes processing. The later view is supported by
previous findings showing that ADAM10 can initiate cleavage of its substrates, L1 and CD44,
inside MVBs from ovarian carcinoma cell lines and that further cleavage can occur after the
release of exosomes [110].
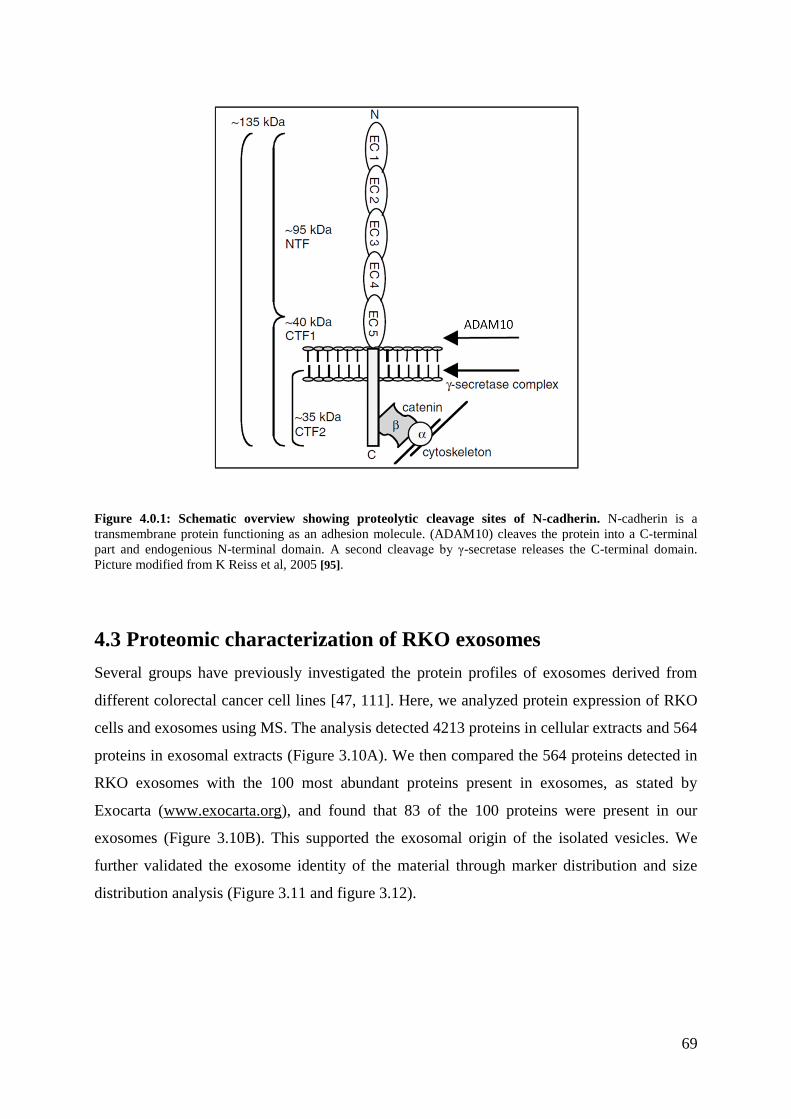
69
Figure 4.0.1: Schematic overview showing proteolytic cleavage sites of N-cadherin. N-cadherin is a
transmembrane protein functioning as an adhesion molecule. (ADAM10) cleaves the protein into a C-terminal
part and endogenious N-terminal domain. A second cleavage by γ-secretase releases the C-terminal domain.
Picture modified from K Reiss et al, 2005 [95].
4.3 Proteomic characterization of RKO exosomes
Several groups have previously investigated the protein profiles of exosomes derived from
different colorectal cancer cell lines [47, 111]. Here, we analyzed protein expression of RKO
cells and exosomes using MS. The analysis detected 4213 proteins in cellular extracts and 564
proteins in exosomal extracts (Figure 3.10A). We then compared the 564 proteins detected in
RKO exosomes with the 100 most abundant proteins present in exosomes, as stated by
Exocarta (www.exocarta.org), and found that 83 of the 100 proteins were present in our
exosomes (Figure 3.10B). This supported the exosomal origin of the isolated vesicles. We
further validated the exosome identity of the material through marker distribution and size
distribution analysis (Figure 3.11 and figure 3.12).
70
4.3.1 Validation of selected proteins detected by mass spectrometry
From the MS lists, we selected four proteins that have previously been reported as implicated
in various types of cancer. Moreover, these proteins have been investigated as potential
diagnostic, prognostic, and predictive factors in several malignancies [66, 101-103].
One of these was the protein deglycase (DJ-1) which is encoded by the PARK7 gene. PARK7
has been identified as an oncogene and its multifunctional protein product has been shown to
be overexpressed in different tumors [100]. In accordance, our analysis showed that DJ-1 is
strongly expressed in RKO cells (Figure 3.13). However, only limited amount of the protein
was detected in RKO-derived exosomes. These results were not completely unexpected as
they resonated with MS findings.
Similar distribution pattern was detected for 14.3.3 zeta/delta (Figure 3.13). This protein is a
member of the 14.3.3 family of adaptor proteins involved in the regulation of multiple
signaling pathways in cells. In CRC-derived vesicles, 14.3.3 zeta/delta was shown to be a
mediator of a malignant phenotype to normal cells, and it has further been suggested to have a
biomarker potential in plasma-derived vesicles of CRC patients [66]. Our results showed that,
in contrast to the relatively high cellular levels of 14.3.3 zeta/delta, only small amount of the
protein was detected in RKO exosomes. This contradicted MS results, which predicted high
abundances for 14.3.3 zeta/delta in exosomal extracts.
Our Simple Western results also highlighted the erroneous MS detection of sorcin. Sorcin
(SR1) is a Ca+2
-binding protein that has been reported as being overexpressed in many cancer
cells and that has been suggested as a useful multi-drug resistance marker [112].We found
that RKO exosomes are highly enriched in this protein (Figure 3.13). What is more, our
results showed that sorcin differs in size between cells and exosomes, with exosome-
associated sorcin having a higher molecular weight compared with sorcin detected in whole-
cell extracts. Ca+2
-binding is believed to initiate sorcin translocation from the cytosol to the
membrane, where it binds specific membrane proteins. One investigation of sorcin
distribution between exosome membranes and exosome supernatants after permeabilization
using saponin indicated that sorcin, in the presence of calcium, partially remains associated
with membrane components [113]. In light of this, we may speculate that, sorcin in RKO
exosomes, may form a lysis-resistant complex that persists after detergent treatment.
71
However, our attempts to identify the detected high molecular weight product as a
serpin/partner complex have this far remained futile. Exosome permeabilization in the
presence of EDTA, to interfere with calcium-binding, might give some further clues about the
nature of this high molecular weight signal.
Plasminogen activator inhibitor-1 (PAI-1), together with its target urokinase-type
plasminogen activator (uPA), are extensively investigated for its clinical utility as prognostic
markers in breast cancer [102]. Increased plasma levels of PAI-1 have also been identified in
CRC patients with liver metastasis [114]. Our protein analyses revealed high PAI-1 levels for
both RKO cells and exosomes, in correlation with MS (Figure 3.13).
4.4 Characterization of plasma-derived exosomes
Patient-derived material is indispensable in the process of cancer biomarker discovery. In this
study, we isolated and characterized exosomal material from plasma samples of patients
diagnosed with locally advanced rectal cancer (LARC). As stated previously, for this
experiment, we chose to purify the material at 16,000 x g, to secure the efficient extraction of
patient-derived exosomal material, while maintaining acceptable purity for the isolated
material.
We applied the marker panel selected for RKO cells and exosomes, consisting of proteins
previously identified as potential biomarkers, to a small set of LARC plasma samples. Two of
the tested proteins, DJ-1 and sorcin, had already been identified as highly enriched in LARC
exosomes by a previous MS analysis.
Since Simple Western requires only 1-4 µg of protein per sample, this method allows for the
use of a larger panel of potential markers, even in very small patient samples. Our small scale
analysis demonstrated that we can easily measure 4 different proteins in less than one tenth of
the material isolated from ~4 mL of plasma. These are promising results for future use of this
technology on patient derived material. Antibodies compatible with the system are currently a
limiting factor, but this will probably improve with extended use.
72
None of the tested protein markers proved successful in our small patient cohort (Figure
3.16). This result is not entirely surprising, as the road from mass spectrometry analysis of
cell line-derived material to antibody based validation in patient plasma, is not straight
forward. Cell lines are not always correct models for the complexity of physiological samples,
and, in this respect, the proteins detected might not be the ones that are most expressed in
patients. In this study, we used only one cell line for the mass spectrometry, RKO, when a
larger panel would have been more appropriate to cover the variation present amongst
patients. Moreover, mass spectrometry offers an overview of the analyzed proteome, but due
to differences in sequence, mass and 3D structure, different proteins will have different
affinity for this detection method. Thus, for biomarker analysis, MS results should always be
validated using antibody detection, and as proven here, this validation might fail.
4.5 Functional studies of melanoma exosomes
4.5.1 Melmet5 exosomes are internalized by melanoma cells and fibroblasts
Transfer of exosomal cargo to recipient cells has been demonstrated in various studies [28,
46, 54, 55]. Here we show that fluorescently labeled melanoma exosomes are taken up by
cancer and stromal cells. The internalization of vesicles was evident from the accumulation of
green fluorescent exosomes in the recipient cells (Figure 3.17). The mechanism of exosome
internalization remains not fully understood [58]. A recently published study by J. Paggetti
and colleagues showed that the stromal cell line HS-5 takes up leukemia exosomes, while the
chronic lymphocytic leukemia (CLL) cells do not. In line with these findings, we show that
fibroblasts internalize labeled exosomes quite uniformly and efficiently, while Melmet1 cells
are more heterogeneous, with some cells showing green color and some remaining completely
dark. For the leukemia model, the group of Paggetti et.al identified the presence of specific
heparan sulfate proteoglycans (HSPGs) on the surface of stroma cells as at least partially
responsible for this dissimilarity in the uptake [54]. It would, therefore, be interesting to
investigate the role of HSPGs in our model. As discussed previously, N-cadherin expression
modulates the interactions of melanoma cells to each other and to stromal cells [12]. Knowing
that N-cadherin expression differs between Melmet1 and Melmet5, we could also explore the
effect of this protein on exosome internalization.
73
4.5.2 Metabolic activity of stroma cells remains unchanged after uptake of
cancer-derived exosomes
Emerging evidence suggest that cancer derived exosomes induce fibroblast differentiation
into myofibroblasts, a type of cancer-associate fibroblasts (CAFs) [67]. Furthermore, CAFs
are shown to utilize aerobic glycolysis, where lactate is produced and secreted to the
microenvironment for utilization by the cancer cells. This phenomenon is termed “reverse
Warburg effect” [4]. To study whether cancer-derived exosomes can directly induce this
metabolic switch, following internalization, we performed metabolic analysis of Wi38 cells
after 48h of exposure to Melmet5-derived exosomes. Our results showed no apparent effect of
Melmet5 exosomes on Wi38 cells’ metabolism (Figure 3.18). It is possible that, if capable of
inducing an effect, melanoma exosomes require a longer co-culturing period before metabolic
changes can surface in fibroblasts. Further studies are required to investigate this possibility.

74
75
5 Concluding remarks
We have demonstrated that differential centrifugation is a feasible method to obtain
exosomes from both conditioned media and human plasma. Using differential
ultracentrifugation, the force of 18,000 x g in the second centrifugation gives acceptable
results in terms of purity, and slightly better yield than 20 000 x g.
Some markers (ALIX, TSG101) showed greater specificity towards identifying the
exosomal population than others (CD9, CD63, FLOT1), and should be preferentially
used in further studies of exosomes from our melanoma cell lines.
Mass spectrometry is a high throughput method which provides a general overview of
the proteome associated with exosomes. Different steps of the method, such as the
nature of the proteins, sample treatment, software used, and data processing, might
affect the final results. In this respect, MS is a good starting point for investigation and
detection of proteins with clinical potential, but the results require further validation
and, as evident from our analysis, they might not always be confirmed.
Simple Western is a promising new technology which permits the examination of
several protein markers, even in very small samples. This is a good example of how
advances in technology allow for advances in biology.
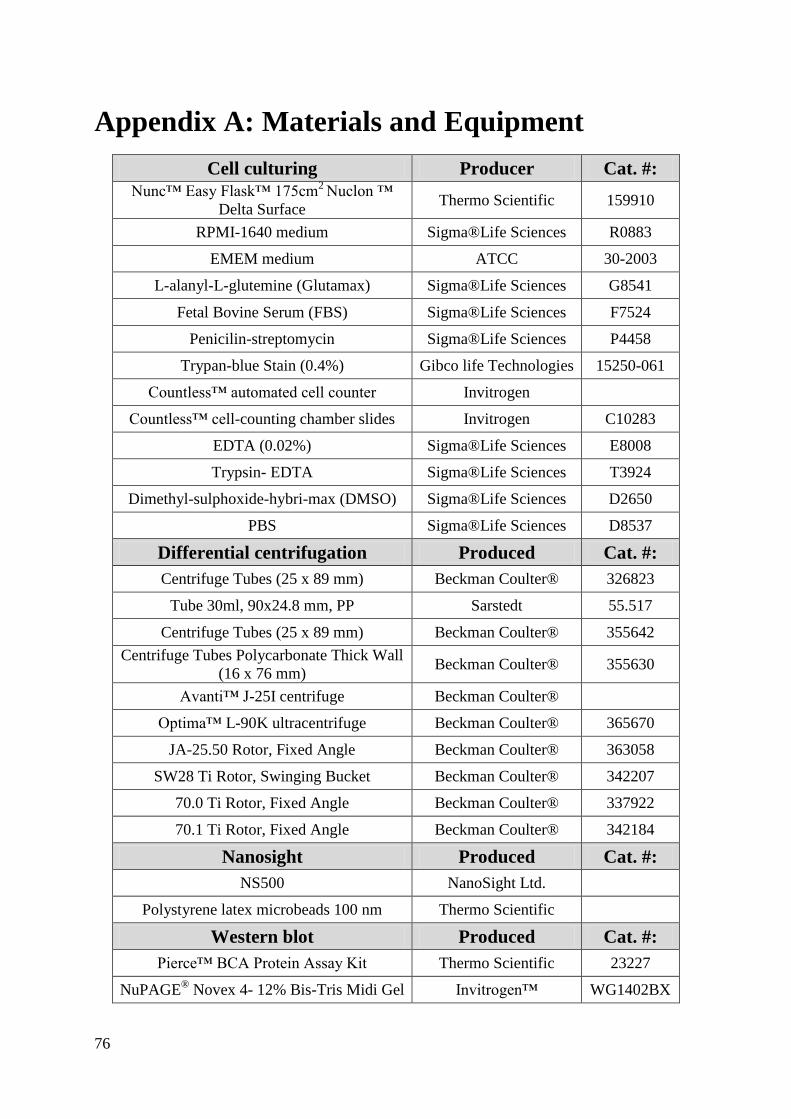
76
Appendix A: Materials and Equipment
Cell culturing Producer Cat. #:
Nunc™ Easy Flask™ 175cm2
Nuclon ™
Delta Surface Thermo Scientific 159910
RPMI-1640 medium Sigma®Life Sciences R0883
EMEM medium ATCC 30-2003
L-alanyl-L-glutemine (Glutamax) Sigma®Life Sciences G8541
Fetal Bovine Serum (FBS) Sigma®Life Sciences F7524
Penicilin-streptomycin Sigma®Life Sciences P4458
Trypan-blue Stain (0.4%) Gibco life Technologies 15250-061
Countless™ automated cell counter Invitrogen
Countless™ cell-counting chamber slides Invitrogen C10283
EDTA (0.02%) Sigma®Life Sciences E8008
Trypsin- EDTA Sigma®Life Sciences T3924
Dimethyl-sulphoxide-hybri-max (DMSO) Sigma®Life Sciences D2650
PBS Sigma®Life Sciences D8537
Differential centrifugation Produced Cat. #:
Centrifuge Tubes (25 x 89 mm) Beckman Coulter® 326823
Tube 30ml, 90x24.8 mm, PP Sarstedt 55.517
Centrifuge Tubes (25 x 89 mm) Beckman Coulter® 355642
Centrifuge Tubes Polycarbonate Thick Wall
(16 x 76 mm) Beckman Coulter® 355630
Avanti™ J-25I centrifuge Beckman Coulter®
Optima™ L-90K ultracentrifuge Beckman Coulter® 365670
JA-25.50 Rotor, Fixed Angle Beckman Coulter® 363058
SW28 Ti Rotor, Swinging Bucket Beckman Coulter® 342207
70.0 Ti Rotor, Fixed Angle Beckman Coulter® 337922
70.1 Ti Rotor, Fixed Angle Beckman Coulter® 342184
Nanosight Produced Cat. #:
NS500 NanoSight Ltd.
Polystyrene latex microbeads 100 nm Thermo Scientific
Western blot Produced Cat. #:
Pierce™ BCA Protein Assay Kit Thermo Scientific 23227
NuPAGE® Novex 4- 12% Bis-Tris Midi Gel Invitrogen™ WG1402BX
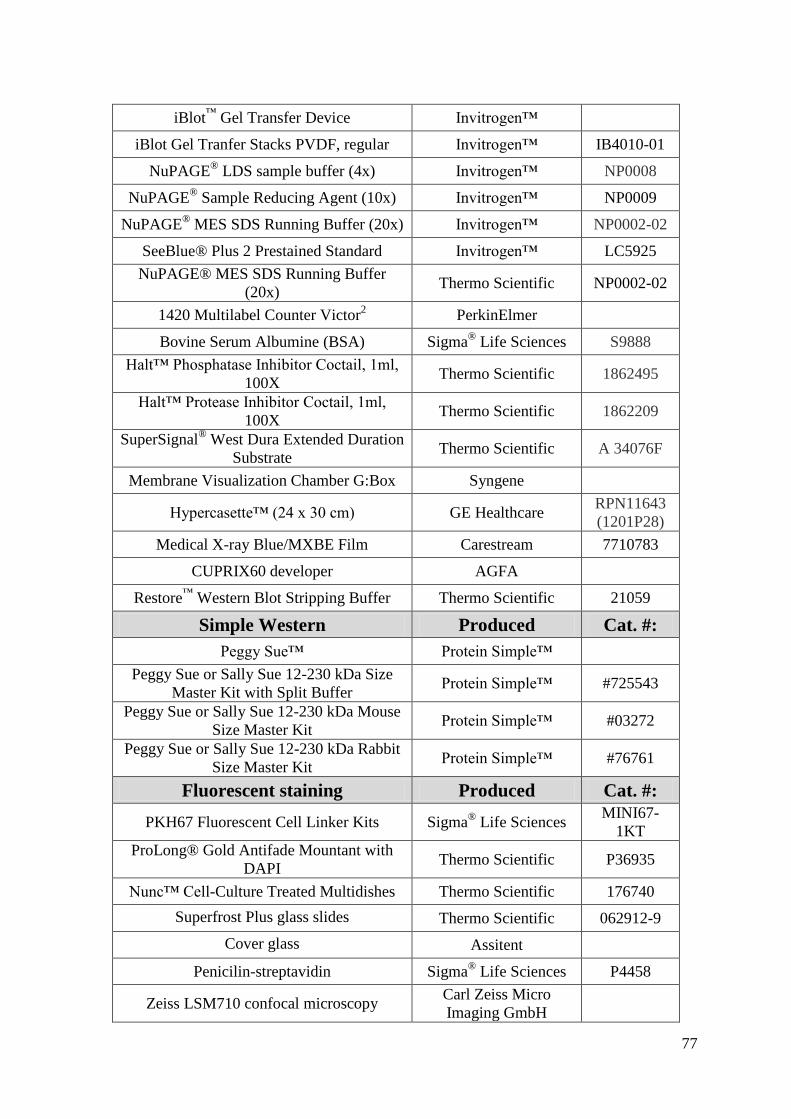
77
iBlot™
Gel Transfer Device Invitrogen™
iBlot Gel Tranfer Stacks PVDF, regular Invitrogen™ IB4010-01
NuPAGE® LDS sample buffer (4x) Invitrogen™ NP0008
NuPAGE® Sample Reducing Agent (10x) Invitrogen™ NP0009
NuPAGE® MES SDS Running Buffer (20x) Invitrogen™ NP0002-02
SeeBlue® Plus 2 Prestained Standard Invitrogen™ LC5925
NuPAGE® MES SDS Running Buffer
(20x) Thermo Scientific NP0002-02
1420 Multilabel Counter Victor2 PerkinElmer
Bovine Serum Albumine (BSA) Sigma® Life Sciences S9888
Halt™ Phosphatase Inhibitor Coctail, 1ml,
100X Thermo Scientific 1862495
Halt™ Protease Inhibitor Coctail, 1ml,
100X Thermo Scientific 1862209
SuperSignal® West Dura Extended Duration
Substrate Thermo Scientific A 34076F
Membrane Visualization Chamber G:Box Syngene
Hypercasette™ (24 x 30 cm) GE Healthcare RPN11643
(1201P28)
Medical X-ray Blue/MXBE Film Carestream 7710783
CUPRIX60 developer AGFA
Restore™
Western Blot Stripping Buffer Thermo Scientific 21059
Simple Western Produced Cat. #:
Peggy Sue™ Protein Simple™
Peggy Sue or Sally Sue 12-230 kDa Size
Master Kit with Split Buffer Protein Simple™ #725543
Peggy Sue or Sally Sue 12-230 kDa Mouse
Size Master Kit Protein Simple™ #03272
Peggy Sue or Sally Sue 12-230 kDa Rabbit
Size Master Kit Protein Simple™ #76761
Fluorescent staining Produced Cat. #:
PKH67 Fluorescent Cell Linker Kits Sigma® Life Sciences
MINI67-
1KT
ProLong® Gold Antifade Mountant with
DAPI Thermo Scientific P36935
Nunc™ Cell-Culture Treated Multidishes Thermo Scientific 176740
Superfrost Plus glass slides Thermo Scientific 062912-9
Cover glass Assitent
Penicilin-streptavidin Sigma® Life Sciences P4458
Zeiss LSM710 confocal microscopy Carl Zeiss Micro
Imaging GmbH
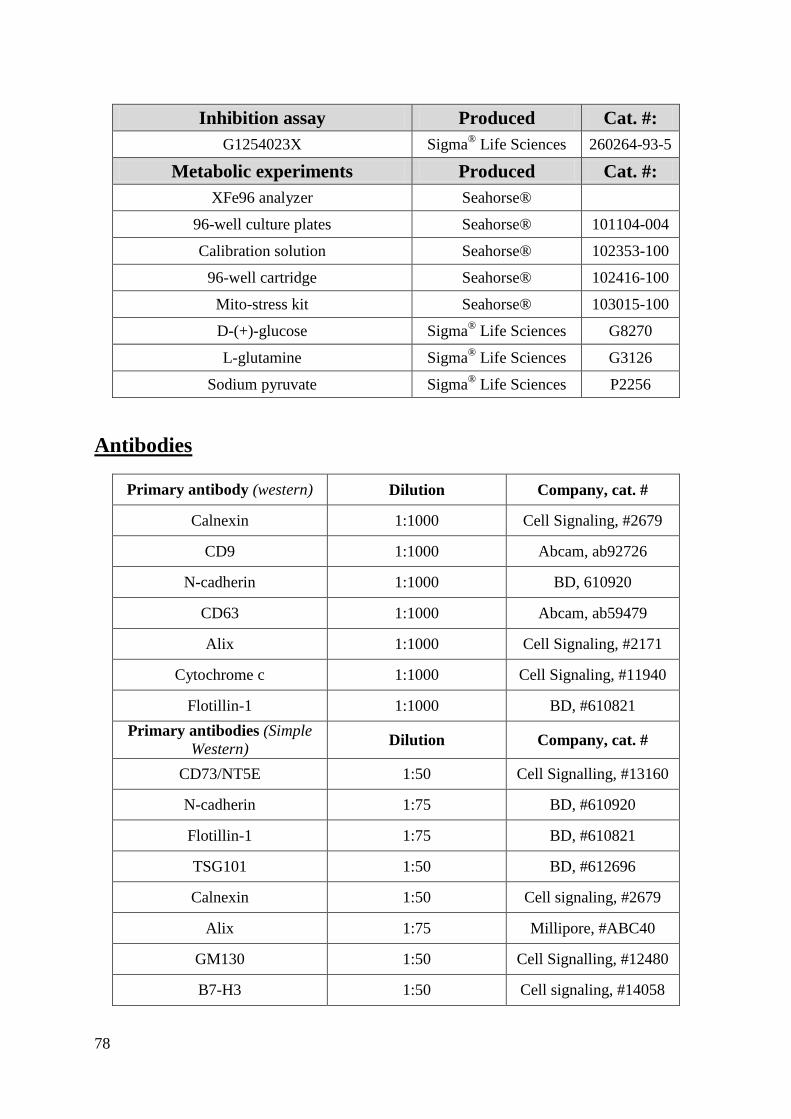
78
Inhibition assay Produced Cat. #:
G1254023X Sigma® Life Sciences 260264-93-5
Metabolic experiments Produced Cat. #:
XFe96 analyzer Seahorse®
96-well culture plates Seahorse® 101104-004
Calibration solution Seahorse® 102353-100
96-well cartridge Seahorse® 102416-100
Mito-stress kit Seahorse® 103015-100
D-(+)-glucose Sigma® Life Sciences G8270
L-glutamine Sigma® Life Sciences G3126
Sodium pyruvate Sigma® Life Sciences P2256
Antibodies
Primary antibody (western) Dilution Company, cat. #
Calnexin 1:1000 Cell Signaling, #2679
CD9 1:1000 Abcam, ab92726
N-cadherin 1:1000 BD, 610920
CD63 1:1000 Abcam, ab59479
Alix 1:1000 Cell Signaling, #2171
Cytochrome c 1:1000 Cell Signaling, #11940
Flotillin-1 1:1000 BD, #610821
Primary antibodies (Simple
Western) Dilution Company, cat. #
CD73/NT5E 1:50 Cell Signalling, #13160
N-cadherin 1:75 BD, #610920
Flotillin-1 1:75 BD, #610821
TSG101 1:50 BD, #612696
Calnexin 1:50 Cell signaling, #2679
Alix 1:75 Millipore, #ABC40
GM130 1:50 Cell Signalling, #12480
B7-H3 1:50 Cell signaling, #14058
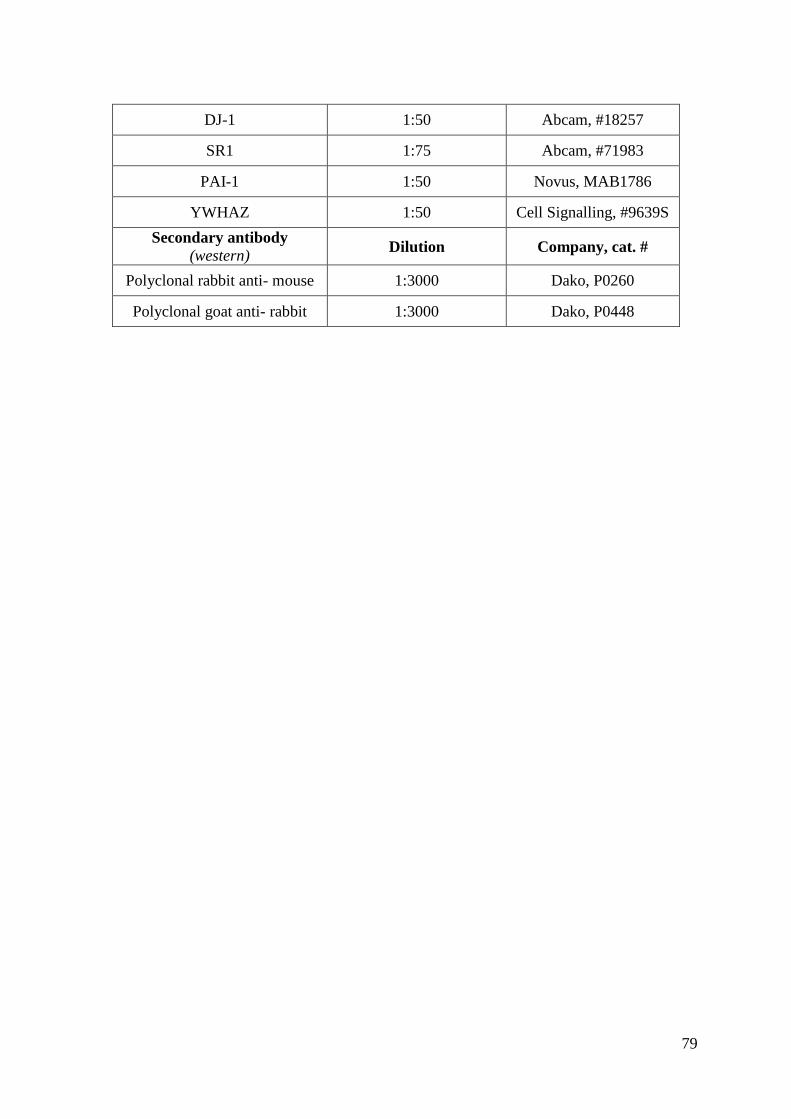
79
DJ-1 1:50 Abcam, #18257
SR1 1:75 Abcam, #71983
PAI-1 1:50 Novus, MAB1786
YWHAZ 1:50 Cell Signalling, #9639S
Secondary antibody
(western) Dilution Company, cat. #
Polyclonal rabbit anti- mouse 1:3000 Dako, P0260
Polyclonal goat anti- rabbit 1:3000 Dako, P0448
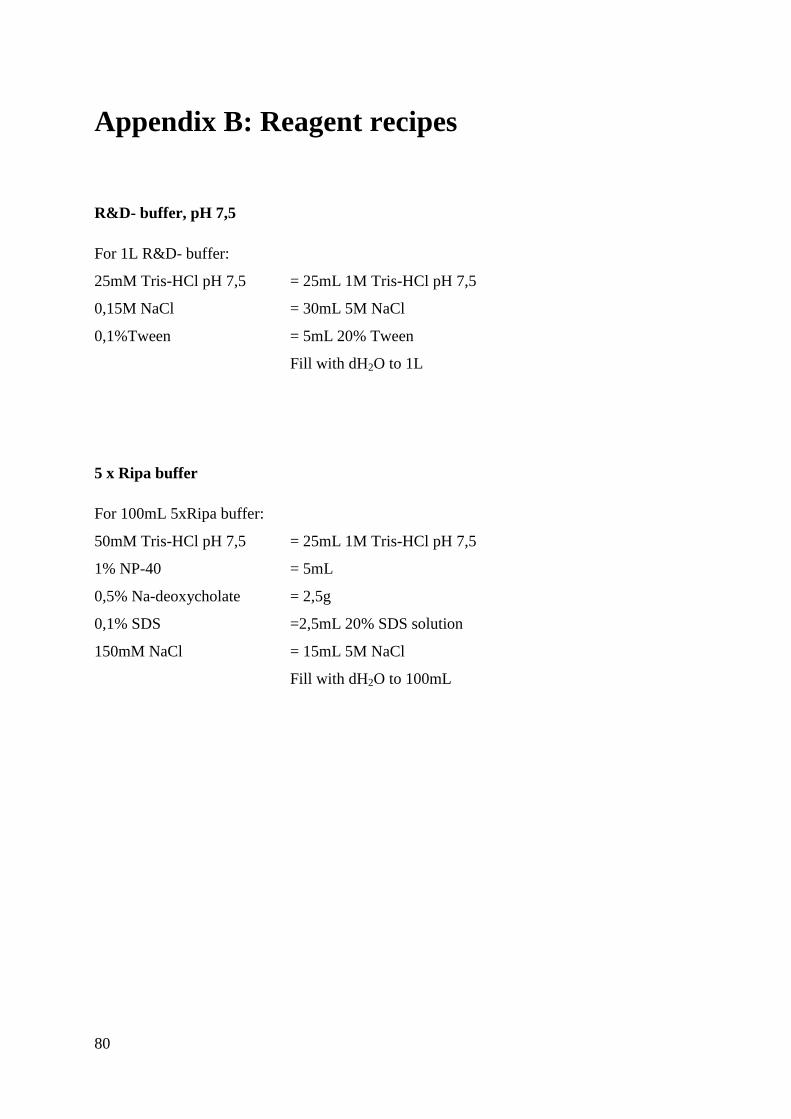
80
Appendix B: Reagent recipes
R&D- buffer, pH 7,5
For 1L R&D- buffer:
25mM Tris-HCl pH 7,5 = 25mL 1M Tris-HCl pH 7,5
0,15M NaCl = 30mL 5M NaCl
0,1%Tween = 5mL 20% Tween
Fill with dH2O to 1L
5 x Ripa buffer
For 100mL 5xRipa buffer:
50mM Tris-HCl pH 7,5 = 25mL 1M Tris-HCl pH 7,5
1% NP-40 = 5mL
0,5% Na-deoxycholate = 2,5g
0,1% SDS =2,5mL 20% SDS solution
150mM NaCl = 15mL 5M NaCl
Fill with dH2O to 100mL
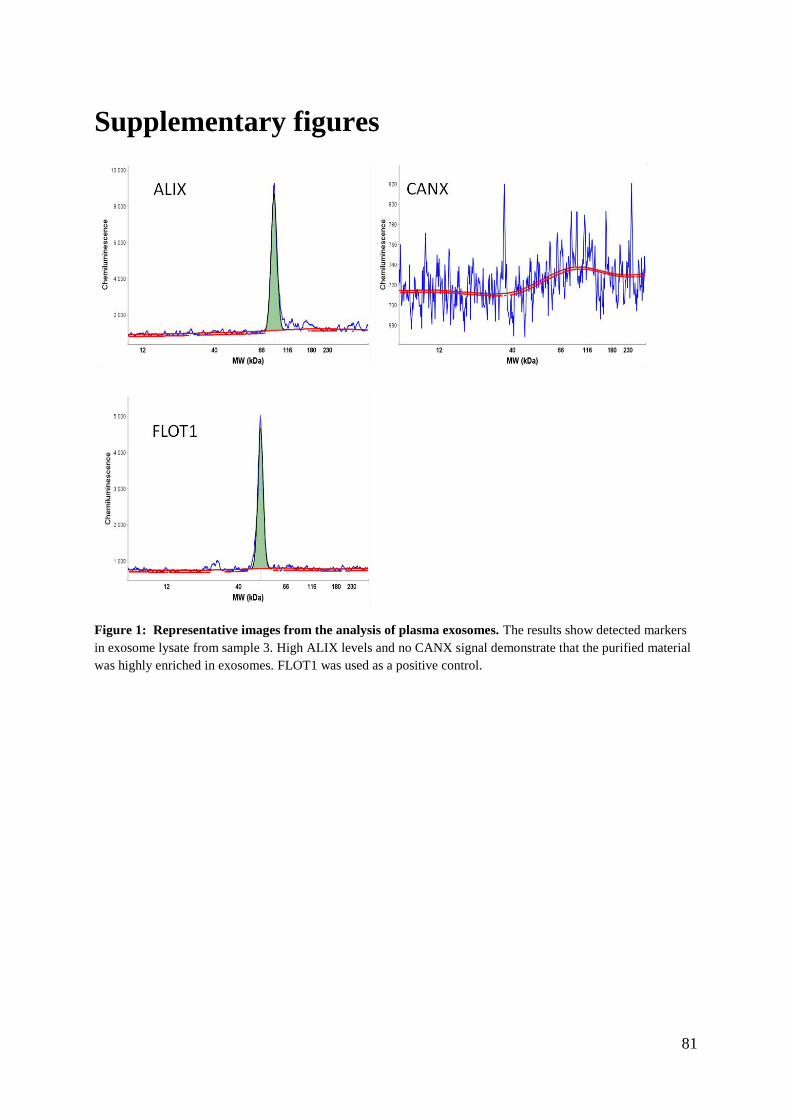
81
Supplementary figures
Figure 1: Representative images from the analysis of plasma exosomes. The results show detected markers
in exosome lysate from sample 3. High ALIX levels and no CANX signal demonstrate that the purified material
was highly enriched in exosomes. FLOT1 was used as a positive control.

82
83
References
1. Hanahan D, Weinberg RA: Hallmarks of cancer: the next generation. Cell 2011,
144(5):646-674.
2. Barcellos-Hoff MH, Lyden D, Wang TC: The evolution of the cancer niche during
multistage carcinogenesis. Nature reviews Cancer 2013, 13(7):511-518.
3. Kaplan RN, Rafii S, Lyden D: Preparing the "soil": the premetastatic niche.
Cancer research 2006, 66(23):11089-11093.
4. Pavlides S, Whitaker-Menezes D, Castello-Cros R, Flomenberg N, Witkiewicz AK,
Frank PG, Casimiro MC, Wang C, Fortina P, Addya S et al: The reverse Warburg
effect: aerobic glycolysis in cancer associated fibroblasts and the tumor stroma.
Cell cycle (Georgetown, Tex) 2009, 8(23):3984-4001.
5. Cancer-Registry-of-Norway: Cancer in Norway 2014- Cancer incidence, mortality,
survival and prevalence in Norway. In.; 2014.
6. Cancer-Registry-of-Norway: Facts on cancer Melanoma. 2014.
7. Miller AJ, Mihm MC, Jr.: Melanoma. The New England journal of medicine 2006,
355(1):51-65.
8. Liu J, Fukunaga-Kalabis M, Li L, Herlyn M: Developmental pathways activated in
melanocytes and melanoma. Archives of biochemistry and biophysics 2014, 563:13-
21.
9. Hsu MY, Wheelock MJ, Johnson KR, Herlyn M: Shifts in cadherin profiles between
human normal melanocytes and melanomas. The journal of investigative
dermatology Symposium proceedings / the Society for Investigative Dermatology, Inc
[and] European Society for Dermatological Research 1996, 1(2):188-194.
10. Wheelock MJ, Shintani Y, Maeda M, Fukumoto Y, Johnson KR: Cadherin
switching. Journal of cell science 2008, 121(Pt 6):727-735.
11. Hsu M, Andl T, Li G, Meinkoth JL, Herlyn M: Cadherin repertoire determines
partner-specific gap junctional communication during melanoma progression.
Journal of cell science 2000, 113 ( Pt 9):1535-1542.
12. Li G, Satyamoorthy K, Herlyn M: N-cadherin-mediated intercellular interactions
promote survival and migration of melanoma cells. Cancer research 2001,
61(9):3819-3825.
13. Christofori G: New signals from the invasive front. Nature 2006, 441(7092):444-
450.
14. Hoek KS, Eichhoff OM, Schlegel NC, Dobbeling U, Kobert N, Schaerer L, Hemmi S,
Dummer R: In vivo switching of human melanoma cells between proliferative and
invasive states. Cancer research 2008, 68(3):650-656.
15. Muto T, Bussey HJ, Morson BC: The evolution of cancer of the colon and rectum.
Cancer 1975, 36(6):2251-2270.
16. Leslie A, Carey FA, Pratt NR, Steele RJ: The colorectal adenoma-carcinoma
sequence. The British journal of surgery 2002, 89(7):845-860.
17. Fearon ER, Vogelstein B: A genetic model for colorectal tumorigenesis. Cell 1990,
61(5):759-767.
18. Graham DM, Coyle VM, Kennedy RD, Wilson RH: Molecular Subtypes and
Personalized Therapy in Metastatic Colorectal Cancer. Current colorectal cancer
reports 2016, 12:141-150.
19. de la Chapelle A: Genetic predisposition to colorectal cancer. Nature reviews
Cancer 2004, 4(10):769-780.
84
20. Baena R, Salinas P: Diet and colorectal cancer. Maturitas 2015, 80(3):258-264.
21. Ahn J, Sinha R, Pei Z, Dominianni C, Wu J, Shi J, Goedert JJ, Hayes RB, Yang L:
Human gut microbiome and risk for colorectal cancer. Journal of the National
Cancer Institute 2013, 105(24):1907-1911.
22. Thomas RM, Jobin C: The Microbiome and Cancer: Is the 'Oncobiome' Mirage
Real? Trends in cancer 2015, 1(1):24-35.
23. Harding C, Heuser J, Stahl P: Endocytosis and intracellular processing of
transferrin and colloidal gold-transferrin in rat reticulocytes: demonstration of a
pathway for receptor shedding. European journal of cell biology 1984, 35(2):256-
263.
24. Johnstone RM, Adam M, Hammond JR, Orr L, Turbide C: Vesicle formation during
reticulocyte maturation. Association of plasma membrane activities with released
vesicles (exosomes). The Journal of biological chemistry 1987, 262(19):9412-9420.
25. Johnstone RM, Mathew A, Mason AB, Teng K: Exosome formation during
maturation of mammalian and avian reticulocytes: evidence that exosome release
is a major route for externalization of obsolete membrane proteins. Journal of
cellular physiology 1991, 147(1):27-36.
26. Raposo G, Nijman HW, Stoorvogel W, Liejendekker R, Harding CV, Melief CJ,
Geuze HJ: B lymphocytes secrete antigen-presenting vesicles. The Journal of
experimental medicine 1996, 183(3):1161-1172.
27. Zitvogel L, Regnault A, Lozier A, Wolfers J, Flament C, Tenza D, Ricciardi-
Castagnoli P, Raposo G, Amigorena S: Eradication of established murine tumors
using a novel cell-free vaccine: dendritic cell-derived exosomes. Nature medicine
1998, 4(5):594-600.
28. Valadi H, Ekstrom K, Bossios A, Sjostrand M, Lee JJ, Lotvall JO: Exosome-
mediated transfer of mRNAs and microRNAs is a novel mechanism of genetic
exchange between cells. Nature cell biology 2007, 9(6):654-659.
29. Zhang Y, Liu D, Chen X, Li J, Li L, Bian Z, Sun F, Lu J, Yin Y, Cai X et al: Secreted
monocytic miR-150 enhances targeted endothelial cell migration. Molecular cell
2010, 39(1):133-144.
30. Kosaka N, Iguchi H, Yoshioka Y, Takeshita F, Matsuki Y, Ochiya T: Secretory
mechanisms and intercellular transfer of microRNAs in living cells. The Journal
of biological chemistry 2010, 285(23):17442-17452.
31. Gyorgy B, Szabo TG, Pasztoi M, Pal Z, Misjak P, Aradi B, Laszlo V, Pallinger E, Pap
E, Kittel A et al: Membrane vesicles, current state-of-the-art: emerging role of
extracellular vesicles. Cellular and molecular life sciences : CMLS 2011,
68(16):2667-2688.
32. Wollert T, Hurley JH: Molecular mechanism of multivesicular body biogenesis by
ESCRT complexes. Nature 2010, 464(7290):864-869.
33. Baietti MF, Zhang Z, Mortier E, Melchior A, Degeest G, Geeraerts A, Ivarsson Y,
Depoortere F, Coomans C, Vermeiren E et al: Syndecan-syntenin-ALIX regulates
the biogenesis of exosomes. Nature cell biology 2012, 14(7):677-685.
34. van Niel G, Charrin S, Simoes S, Romao M, Rochin L, Saftig P, Marks MS,
Rubinstein E, Raposo G: The tetraspanin CD63 regulates ESCRT-independent
and -dependent endosomal sorting during melanogenesis. Developmental cell
2011, 21(4):708-721.
35. Trajkovic K, Hsu C, Chiantia S, Rajendran L, Wenzel D, Wieland F, Schwille P,
Brugger B, Simons M: Ceramide triggers budding of exosome vesicles into
multivesicular endosomes. Science (New York, NY) 2008, 319(5867):1244-1247.

85
36. Colombo M, Raposo G, Thery C: Biogenesis, secretion, and intercellular
interactions of exosomes and other extracellular vesicles. Annual review of cell and
developmental biology 2014, 30:255-289.
37. Zhen Y, Stenmark H: Cellular functions of Rab GTPases at a glance. Journal of
cell science 2015, 128(17):3171-3176.
38. Mathivanan S, Fahner CJ, Reid GE, Simpson RJ: ExoCarta 2012: database of
exosomal proteins, RNA and lipids. Nucleic acids research 2012, 40(Database
issue):D1241-1244.
39. Martins VR, Dias MS, Hainaut P: Tumor-cell-derived microvesicles as carriers of
molecular information in cancer. Current opinion in oncology 2013, 25(1):66-75.
40. Mathivanan S, Ji H, Simpson RJ: Exosomes: extracellular organelles important in
intercellular communication. Journal of proteomics 2010, 73(10):1907-1920.
41. Peters PJ, Neefjes JJ, Oorschot V, Ploegh HL, Geuze HJ: Segregation of MHC class
II molecules from MHC class I molecules in the Golgi complex for transport to
lysosomal compartments. Nature 1991, 349(6311):669-676.
42. Jorgensen M, Baek R, Pedersen S, Sondergaard EK, Kristensen SR, Varming K:
Extracellular Vesicle (EV) Array: microarray capturing of exosomes and other
extracellular vesicles for multiplexed phenotyping. Journal of extracellular vesicles
2013, 2.
43. de Gassart A, Geminard C, Fevrier B, Raposo G, Vidal M: Lipid raft-associated
protein sorting in exosomes. Blood 2003, 102(13):4336-4344.
44. Llorente A, Skotland T, Sylvanne T, Kauhanen D, Rog T, Orlowski A, Vattulainen I,
Ekroos K, Sandvig K: Molecular lipidomics of exosomes released by PC-3 prostate
cancer cells. Biochimica et biophysica acta 2013, 1831(7):1302-1309.
45. Chiba M, Kimura M, Asari S: Exosomes secreted from human colorectal cancer
cell lines contain mRNAs, microRNAs and natural antisense RNAs, that can
transfer into the human hepatoma HepG2 and lung cancer A549 cell lines.
Oncology reports 2012, 28(5):1551-1558.
46. Lazar I, Clement E, Ducoux-Petit M, Denat L, Soldan V, Dauvillier S, Balor S,
Burlet-Schiltz O, Larue L, Muller C et al: Proteome characterization of melanoma
exosomes reveals a specific signature for metastatic cell lines. Pigment cell &
melanoma research 2015, 28(4):464-475.
47. Demory Beckler M, Higginbotham JN, Franklin JL, Ham AJ, Halvey PJ, Imasuen IE,
Whitwell C, Li M, Liebler DC, Coffey RJ: Proteomic analysis of exosomes from
mutant KRAS colon cancer cells identifies intercellular transfer of mutant
KRAS. Molecular & cellular proteomics : MCP 2013, 12(2):343-355.
48. Wang GJ, Liu Y, Qin A, Shah SV, Deng ZB, Xiang X, Cheng Z, Liu C, Wang J,
Zhang L et al: Thymus exosomes-like particles induce regulatory T cells. Journal
of immunology (Baltimore, Md : 1950) 2008, 181(8):5242-5248.
49. Wolfers J, Lozier A, Raposo G, Regnault A, Thery C, Masurier C, Flament C,
Pouzieux S, Faure F, Tursz T et al: Tumor-derived exosomes are a source of shared
tumor rejection antigens for CTL cross-priming. Nature medicine 2001, 7(3):297-
303.
50. Peinado H, Aleckovic M, Lavotshkin S, Matei I, Costa-Silva B, Moreno-Bueno G,
Hergueta-Redondo M, Williams C, Garcia-Santos G, Ghajar C et al: Melanoma
exosomes educate bone marrow progenitor cells toward a pro-metastatic
phenotype through MET. Nature medicine 2012, 18(6):883-891.
51. Thakur BK, Zhang H, Becker A, Matei I, Huang Y, Costa-Silva B, Zheng Y, Hoshino
A, Brazier H, Xiang J et al: Double-stranded DNA in exosomes: a novel biomarker
in cancer detection. Cell research 2014, 24(6):766-769.
86
52. Kahlert C, Melo SA, Protopopov A, Tang J, Seth S, Koch M, Zhang J, Weitz J, Chin
L, Futreal A et al: Identification of double-stranded genomic DNA spanning all
chromosomes with mutated KRAS and p53 DNA in the serum exosomes of
patients with pancreatic cancer. The Journal of biological chemistry 2014,
289(7):3869-3875.
53. Nolte-'t Hoen EN, Buermans HP, Waasdorp M, Stoorvogel W, Wauben MH, t Hoen
PA: Deep sequencing of RNA from immune cell-derived vesicles uncovers the
selective incorporation of small non-coding RNA biotypes with potential
regulatory functions. Nucleic acids research 2012, 40(18):9272-9285.
54. Paggetti J, Haderk F, Seiffert M, Janji B, Distler U, Ammerlaan W, Kim YJ, Adam J,
Lichter P, Solary E et al: Exosomes released by chronic lymphocytic leukemia cells
induce the transition of stromal cells into cancer-associated fibroblasts. Blood
2015, 126(9):1106-1117.
55. Lasser C, Alikhani VS, Ekstrom K, Eldh M, Paredes PT, Bossios A, Sjostrand M,
Gabrielsson S, Lotvall J, Valadi H: Human saliva, plasma and breast milk
exosomes contain RNA: uptake by macrophages. Journal of translational medicine
2011, 9:9.
56. Christianson HC, Svensson KJ, van Kuppevelt TH, Li JP, Belting M: Cancer cell
exosomes depend on cell-surface heparan sulfate proteoglycans for their
internalization and functional activity. Proceedings of the National Academy of
Sciences of the United States of America 2013, 110(43):17380-17385.
57. Purushothaman A, Bandari SK, Liu J, Mobley JA, Brown EE, Sanderson RD:
Fibronectin on the Surface of Myeloma Cell-derived Exosomes Mediates
Exosome-Cell Interactions. The Journal of biological chemistry 2016, 291(4):1652-
1663.
58. Mulcahy LA, Pink RC, Carter DR: Routes and mechanisms of extracellular vesicle
uptake. Journal of extracellular vesicles 2014, 3.
59. Christianson HC, Belting M: Heparan sulfate proteoglycan as a cell-surface
endocytosis receptor. Matrix biology : journal of the International Society for Matrix
Biology 2014, 35:51-55.
60. Parolini I, Federici C, Raggi C, Lugini L, Palleschi S, De Milito A, Coscia C, Iessi E,
Logozzi M, Molinari A et al: Microenvironmental pH is a key factor for exosome
traffic in tumor cells. The Journal of biological chemistry 2009, 284(49):34211-
34222.
61. Zhang HG, Grizzle WE: Exosomes: a novel pathway of local and distant
intercellular communication that facilitates the growth and metastasis of
neoplastic lesions. The American journal of pathology 2014, 184(1):28-41.
62. Sabapatha A, Gercel-Taylor C, Taylor DD: Specific isolation of placenta-derived
exosomes from the circulation of pregnant women and their immunoregulatory
consequences. American journal of reproductive immunology (New York, NY : 1989)
2006, 56(5-6):345-355.
63. Kosaka N, Iguchi H, Yoshioka Y, Hagiwara K, Takeshita F, Ochiya T: Competitive
interactions of cancer cells and normal cells via secretory microRNAs. The
Journal of biological chemistry 2012, 287(2):1397-1405.
64. Riches A, Campbell E, Borger E, Powis S: Regulation of exosome release from
mammary epithelial and breast cancer cells - a new regulatory pathway.
European journal of cancer (Oxford, England : 1990) 2014, 50(5):1025-1034.
65. Xiao D, Barry S, Kmetz D, Egger M, Pan J, Rai SN, Qu J, McMasters KM, Hao H:
Melanoma cell-derived exosomes promote epithelial-mesenchymal transition in
87
primary melanocytes through paracrine/autocrine signaling in the tumor
microenvironment. Cancer letters 2016.
66. Mulvey HE, Chang A, Adler J, Del Tatto M, Perez K, Quesenberry PJ, Chatterjee D:
Extracellular vesicle-mediated phenotype switching in malignant and non-
malignant colon cells. BMC cancer 2015, 15:571.
67. Webber J, Steadman R, Mason MD, Tabi Z, Clayton A: Cancer exosomes trigger
fibroblast to myofibroblast differentiation. Cancer research 2010, 70(23):9621-
9630.
68. Cho JA, Park H, Lim EH, Lee KW: Exosomes from breast cancer cells can convert
adipose tissue-derived mesenchymal stem cells into myofibroblast-like cells.
International journal of oncology 2012, 40(1):130-138.
69. Millimaggi D, Mari M, D'Ascenzo S, Carosa E, Jannini EA, Zucker S, Carta G, Pavan
A, Dolo V: Tumor vesicle-associated CD147 modulates the angiogenic capability
of endothelial cells. Neoplasia (New York, NY) 2007, 9(4):349-357.
70. Sidhu SS, Mengistab AT, Tauscher AN, LaVail J, Basbaum C: The microvesicle as a
vehicle for EMMPRIN in tumor-stromal interactions. Oncogene 2004, 23(4):956-
963.
71. Hong BS, Cho JH, Kim H, Choi EJ, Rho S, Kim J, Kim JH, Choi DS, Kim YK,
Hwang D et al: Colorectal cancer cell-derived microvesicles are enriched in cell
cycle-related mRNAs that promote proliferation of endothelial cells. BMC
genomics 2009, 10:556.
72. Liu C, Yu S, Zinn K, Wang J, Zhang L, Jia Y, Kappes JC, Barnes S, Kimberly RP,
Grizzle WE et al: Murine mammary carcinoma exosomes promote tumor growth
by suppression of NK cell function. Journal of immunology (Baltimore, Md : 1950)
2006, 176(3):1375-1385.
73. Szajnik M, Czystowska M, Szczepanski MJ, Mandapathil M, Whiteside TL: Tumor-
derived microvesicles induce, expand and up-regulate biological activities of
human regulatory T cells (Treg). PloS one 2010, 5(7):e11469.
74. Abusamra AJ, Zhong Z, Zheng X, Li M, Ichim TE, Chin JL, Min WP: Tumor
exosomes expressing Fas ligand mediate CD8+ T-cell apoptosis. Blood cells,
molecules & diseases 2005, 35(2):169-173.
75. Clayton A, Al-Taei S, Webber J, Mason MD, Tabi Z: Cancer exosomes express
CD39 and CD73, which suppress T cells through adenosine production. Journal
of immunology (Baltimore, Md : 1950) 2011, 187(2):676-683.
76. Hoshino A, Costa-Silva B, Shen TL, Rodrigues G, Hashimoto A, Tesic Mark M,
Molina H, Kohsaka S, Di Giannatale A, Ceder S et al: Tumour exosome integrins
determine organotropic metastasis. Nature 2015, 527(7578):329-335.
77. Shedden K, Xie XT, Chandaroy P, Chang YT, Rosania GR: Expulsion of small
molecules in vesicles shed by cancer cells: association with gene expression and
chemosensitivity profiles. Cancer research 2003, 63(15):4331-4337.
78. Ginestra A, Miceli D, Dolo V, Romano FM, Vittorelli ML: Membrane vesicles in
ovarian cancer fluids: a new potential marker. Anticancer research 1999,
19(4C):3439-3445.
79. Logozzi M, De Milito A, Lugini L, Borghi M, Calabro L, Spada M, Perdicchio M,
Marino ML, Federici C, Iessi E et al: High levels of exosomes expressing CD63 and
caveolin-1 in plasma of melanoma patients. PloS one 2009, 4(4):e5219.
80. Guan M, Chen X, Ma Y, Tang L, Guan L, Ren X, Yu B, Zhang W, Su B: MDA-9 and
GRP78 as potential diagnostic biomarkers for early detection of melanoma
metastasis. Tumour biology : the journal of the International Society for
Oncodevelopmental Biology and Medicine 2015, 36(4):2973-2982.
88
81. Witwer KW, Buzas EI, Bemis LT, Bora A, Lasser C, Lotvall J, Nolte-'t Hoen EN,
Piper MG, Sivaraman S, Skog J et al: Standardization of sample collection,
isolation and analysis methods in extracellular vesicle research. Journal of
extracellular vesicles 2013, 2.
82. Cvjetkovic A, Lotvall J, Lasser C: The influence of rotor type and centrifugation
time on the yield and purity of extracellular vesicles. Journal of extracellular
vesicles 2014, 3.
83. Thery C, Amigorena S, Raposo G, Clayton A: Isolation and characterization of
exosomes from cell culture supernatants and biological fluids. Current protocols in
cell biology / editorial board, Juan S Bonifacino [et al] 2006, Chapter 3:Unit 3 22.
84. Van Deun J, Mestdagh P, Sormunen R, Cocquyt V, Vermaelen K, Vandesompele J,
Bracke M, De Wever O, Hendrix A: The impact of disparate isolation methods for
extracellular vesicles on downstream RNA profiling. Journal of extracellular
vesicles 2014, 3.
85. Yamada T, Inoshima Y, Matsuda T, Ishiguro N: Comparison of methods for
isolating exosomes from bovine milk. The Journal of veterinary medical science /
the Japanese Society of Veterinary Science 2012, 74(11):1523-1525.
86. Dragovic RA, Gardiner C, Brooks AS, Tannetta DS, Ferguson DJ, Hole P, Carr B,
Redman CW, Harris AL, Dobson PJ et al: Sizing and phenotyping of cellular
vesicles using Nanoparticle Tracking Analysis. Nanomedicine : nanotechnology,
biology, and medicine 2011, 7(6):780-788.
87. Lotvall J, Hill AF, Hochberg F, Buzas EI, Di Vizio D, Gardiner C, Gho YS,
Kurochkin IV, Mathivanan S, Quesenberry P et al: Minimal experimental
requirements for definition of extracellular vesicles and their functions: a
position statement from the International Society for Extracellular Vesicles.
Journal of extracellular vesicles 2014, 3:26913.
88. Conde-Vancells J, Rodriguez-Suarez E, Embade N, Gil D, Matthiesen R, Valle M,
Elortza F, Lu SC, Mato JM, Falcon-Perez JM: Characterization and comprehensive
proteome profiling of exosomes secreted by hepatocytes. Journal of proteome
research 2008, 7(12):5157-5166.
89. Le Naour F, Misek DE, Krause MC, Deneux L, Giordano TJ, Scholl S, Hanash SM:
Proteomics-based identification of RS/DJ-1 as a novel circulating tumor antigen
in breast cancer. Clinical cancer research : an official journal of the American
Association for Cancer Research 2001, 7(11):3328-3335.
90. Marimpietri D, Petretto A, Raffaghello L, Pezzolo A, Gagliani C, Tacchetti C, Mauri
P, Melioli G, Pistoia V: Proteome profiling of neuroblastoma-derived exosomes
reveal the expression of proteins potentially involved in tumor progression. PloS
one 2013, 8(9):e75054.
91. Protocol: Pierce BCA Protein Assay Kit. In: USA: Thermo Fisher Scientific Inc.
2011.
92. Chapoval AI, Ni J, Lau JS, Wilcox RA, Flies DB, Liu D, Dong H, Sica GL, Zhu G,
Tamada K et al: B7-H3: a costimulatory molecule for T cell activation and IFN-
gamma production. Nature immunology 2001, 2(3):269-274.
93. Wang J, Chong KK, Nakamura Y, Nguyen L, Huang SK, Kuo C, Zhang W, Yu H,
Morton DL, Hoon DS: B7-H3 associated with tumor progression and epigenetic
regulatory activity in cutaneous melanoma. The Journal of investigative
dermatology 2013, 133(8):2050-2058.
94. Tekle C, Nygren MK, Chen YW, Dybsjord I, Nesland JM, Maelandsmo GM, Fodstad
O: B7-H3 contributes to the metastatic capacity of melanoma cells by modulation
89
of known metastasis-associated genes. International journal of cancer 2012,
130(10):2282-2290.
95. Reiss K, Maretzky T, Ludwig A, Tousseyn T, de Strooper B, Hartmann D, Saftig P:
ADAM10 cleavage of N-cadherin and regulation of cell-cell adhesion and beta-
catenin nuclear signalling. The EMBO journal 2005, 24(4):742-752.
96. Deaglio S, Dwyer KM, Gao W, Friedman D, Usheva A, Erat A, Chen JF, Enjyoji K,
Linden J, Oukka M et al: Adenosine generation catalyzed by CD39 and CD73
expressed on regulatory T cells mediates immune suppression. The Journal of
experimental medicine 2007, 204(6):1257-1265.
97. Jin D, Fan J, Wang L, Thompson LF, Liu A, Daniel BJ, Shin T, Curiel TJ, Zhang B:
CD73 on tumor cells impairs antitumor T-cell responses: a novel mechanism of
tumor-induced immune suppression. Cancer research 2010, 70(6):2245-2255.
98. Andreyeva A, Nieweg K, Horstmann K, Klapper S, Muller-Schiffmann A, Korth C,
Gottmann K: C-terminal fragment of N-cadherin accelerates synapse
destabilization by amyloid-beta. Brain : a journal of neurology 2012, 135(Pt
7):2140-2154.
99. Nygaard V, Prasmickaite L, Vasiliauskaite K, Clancy T, Hovig E: Melanoma brain
colonization involves the emergence of a brain-adaptive phenotype. Oncoscience
2014, 1(1):82-94.
100. Cao J, Lou S, Ying M, Yang B: DJ-1 as a human oncogene and potential
therapeutic target. Biochemical pharmacology 2015, 93(3):241-250.
101. Fan J, Yu H, Lv Y, Yin L: Diagnostic and prognostic value of serum thioredoxin
and DJ-1 in non-small cell lung carcinoma patients. Tumour biology : the journal
of the International Society for Oncodevelopmental Biology and Medicine 2016,
37(2):1949-1958.
102. Jelisavac-Cosic S, Sirotkovic-Skerlev M, Kulic A, Jakic-Razumovic J, Kovac Z,
Vrbanec D: Prognostic significance of urokinase-type plasminogen activator
(uPA) and plasminogen activator inhibitor (PAI-1) in patients with primary
invasive ductal breast carcinoma - a 7.5-year follow-up study. Tumori 2011,
97(4):532-539.
103. Tan Y, Li G, Zhao C, Wang J, Zhao H, Xue Y, Han M, Yang C: Expression of sorcin
predicts poor outcome in acute myeloid leukemia. Leukemia research 2003,
27(2):125-131.
104. Escola JM, Kleijmeer MJ, Stoorvogel W, Griffith JM, Yoshie O, Geuze HJ: Selective
enrichment of tetraspan proteins on the internal vesicles of multivesicular
endosomes and on exosomes secreted by human B-lymphocytes. The Journal of
biological chemistry 1998, 273(32):20121-20127.
105. Seehafer JG, Tang SC, Slupsky JR, Shaw AR: The functional glycoprotein CD9 is
variably acylated: localization of the variably acylated region to a membrane-
associated peptide containing the binding site for the agonistic monoclonal
antibody 50H.19. Biochimica et biophysica acta 1988, 957(3):399-410.
106. Antonioli L, Yegutkin GG, Pacher P, Blandizzi C, Hasko G: Anti-CD73 in cancer
immunotherapy: awakening new opportunities. Trends in cancer 2016, 2(2):95-
109.
107. Marambaud P, Wen PH, Dutt A, Shioi J, Takashima A, Siman R, Robakis NK: A
CBP binding transcriptional repressor produced by the PS1/epsilon-cleavage of
N-cadherin is inhibited by PS1 FAD mutations. Cell 2003, 114(5):635-645.
108. Paradies NE, Grunwald GB: Purification and characterization of NCAD90, a
soluble endogenous form of N-cadherin, which is generated by proteolysis during
90
retinal development and retains adhesive and neurite-promoting function.
Journal of neuroscience research 1993, 36(1):33-45.
109. Shoval I, Ludwig A, Kalcheim C: Antagonistic roles of full-length N-cadherin and
its soluble BMP cleavage product in neural crest delamination. Development
(Cambridge, England) 2007, 134(3):491-501.
110. Stoeck A, Keller S, Riedle S, Sanderson MP, Runz S, Le Naour F, Gutwein P, Ludwig
A, Rubinstein E, Altevogt P: A role for exosomes in the constitutive and stimulus-
induced ectodomain cleavage of L1 and CD44. The Biochemical journal 2006,
393(Pt 3):609-618.
111. Ji H, Greening DW, Barnes TW, Lim JW, Tauro BJ, Rai A, Xu R, Adda C,
Mathivanan S, Zhao W et al: Proteome profiling of exosomes derived from human
primary and metastatic colorectal cancer cells reveal differential expression of
key metastatic factors and signal transduction components. Proteomics 2013,
13(10-11):1672-1686.
112. Colotti G, Poser E, Fiorillo A, Genovese I, Chiarini V, Ilari A: Sorcin, a calcium
binding protein involved in the multidrug resistance mechanisms in cancer cells.
Molecules (Basel, Switzerland) 2014, 19(9):13976-13989.
113. Salzer U, Hinterdorfer P, Hunger U, Borken C, Prohaska R: Ca(++)-dependent
vesicle release from erythrocytes involves stomatin-specific lipid rafts, synexin
(annexin VII), and sorcin. Blood 2002, 99(7):2569-2577.
114. Chen H, Peng H, Liu W, Sun Y, Su N, Tang W, Zhang X, Wang J, Cui L, Hu P et al:
Silencing of plasminogen activator inhibitor-1 suppresses colorectal cancer
progression and liver metastasis. Surgery 2015, 158(6):1704-1713.

91