Embed Size (px)
Citation preview

International Journal of Engineering Research and General Science Volume 3, Issue 3, Part-2 , May-June, 2015 ISSN 2091-2730
121 www.ijergs.org
CONTROL OF SOLAR PHOTOVOLTAIC (PV) POWER GENERATION IN
GRID-CONNECTED AND ISLANDED MICROGRIDS
Hussain Basha Sh1, Venkatesh p
2
1PG Scholar, Dept of EEE, sree vidyanikethan engineering college (Autonomous) Tirupati, Andhra Pradesh,
India.(email:[email protected]). ph no 9494733600
Abstract— With the ever increasing demand of electricity, the requirement of green distributed energy resources and fast depletion
of fossil fuel is increasing. Most common green distributed energy resources are Solar PV, Fuel Cell (FC), or Microturbines connected
at the distribution voltage level. Most of the DERs are connected to the microgrids or utility grid with the help of power electronics
interface. With the proper control of the inverter interface they are capable of producing both active and reactive power. This paper
focuses on examination of the capability of the renewable energy based DERs, such as solar PV array and battery energy storage
system (BESS) to provide voltage support in grid connected low-voltage microgrids and both voltage and frequency support in
islanded microgrids. In addition to that an active and reactive (i.e., nonactive) power control is also provided by using solar PV
functioning at MPPT and battery energy storage system for grid connected mode is also investigated. The control methods are carried
out by using a Proportional and Integral (PI) controller. This paper also provides the balance between DC and AC sides of the inverter
is also proposed and studied. The balance control method is also developed by using Proportional and Integral (PI) controller. Various
case results are presented to validate the proposed methods. The simulation results, obtained in MATLAB/SIMULINK software,
clearly prove the effectiveness of the proposed control methods.
Key words—Active and reactive power control, distributed energy resource (DER), distributed generation (DG), maximum power
point tracking.
NOMENCLATURE
( )
Instantaneous PCC voltage
( ) Average PCC voltage
( ) Instantaneous inverter output voltage
( ) Average inverter output voltage
Coupling inductor
( ) Inverter average active power
( ) Inverter average reactive power
( ) Inverter average apparent power
PMPPref Reference maximum power
α*1 Phase shift between ( ) and ( )
PBatt Actual injected battery active power
Pbattref Reference power to the battery
Qref Average reactive power reference (Reactive load)
Pref Average active power reference (Active load)
Qactual Actual generated reactive power
Pactual Actual generated active power
Pactual Actual generated active power
INTRODUCTION
The microgrid is a collection of distributed generators or microresources, energy storage devices, and loads which operate as a single

International Journal of Engineering Research and General Science Volume 3, Issue 3, Part-2 , May-June, 2015 ISSN 2091-2730
122 www.ijergs.org
and independent controllable system capable of providing both power and heat to the area of service [1]. The microresources that are
incorporated in a microgrid are comprised of small units, less than 100 kW, provided with power electronics (PE) interface. Most
common resources are Solar Photovoltaic (PV), Fuel Cell (FC), or microturbines connected at the distribution voltage level.
In a microgrid, the microsources and storage devices are connected to the feeders through the microsource controllers (MCs) and the
coordination among the microsources is carried out by the central controller (CC) [2]. The microgrid is connected to the medium
voltage level utility grid at the point of common coupling (PCC) through the circuit breakers. When a microgrid is connected to the
grid, the operational control of voltage and frequency is done entirely by the grid; however, a microgrid still supplies the critical loads
at PCC, thus, acting as a PQ bus. In islanded condition, a microgrid has to operate on its own, independent of the grid, to control the
voltage and frequency of the microgrid and hence, acts like a PV (power-voltage) bus. The operation and management in both the
modes is controlled and coordinated with the help of microsource controllers (MCs) at the local level and central controller (CCs) at
the global level.
Similar to the traditional synchronous generator frequency control [3], the microgrid voltage and frequency control can also be
performed using droop control methods [4]–[8]. The present work provides fast response characteristics for voltage and frequency
control as compared to the secondary control considered in [8]. The analogy between inverter control and the synchronous generator
control in an islanded microgrid is studied in detail in [9]. In the islanded mode, there is the necessity of having a reference voltage
and frequency signals in the microgrid inverter control [10]. The operation and control of the inverter interface of renewable-based
distributed energy resources (DERs), like Solar Photovoltaic (PV) in a microgrid, is a real challenge, especially when it comes to
maintaining both microgrid voltage and freuency within an acceptable range. A voltage control method based on traditional droop
control for voltage sag mitigation along with voltage ride through capability is proposed in [11]. A dynamic voltage regulation based
on adaptive control is proposed in [12], [13]. However, there are not many research works performed on V-f or P-Q control using
solar PV including MPPT control and battery storage in microgrids. In [14], frequency regulation with PV in microgrids is studied;
however, this work does not consider the voltage control objective and lacks battery storage in the microgrid.
In [15], a small scale PV is considered in a grid-connected mode to control the active and reactive power of the system. Here, the
control methods consider abc-dq0 transformation and vice versa which is avoided in the present paper. In [16], power modulation of
solar PV generators with an electric double layer capacitor as energy storage is considered for frequency control. In [17], load
frequency control is implemented in microgrid with PV and storage; however, this work also lacks the consideration of a voltage
control objective. The voltage and frequency control with solar PV and battery in microgrid with an induction machine is investigated
in [18]; however, this work does not explain the transfer mechanism of controls to consider the battery SOC constraint. In summary,
the previous works in this topic either lack the incorporation of an energy storage component or the voltage control objective along
with frequency control or the incorporation of control transition in different scenarios. The present work fulfills these gaps by
considering all of these objectives.
Fig. 1:. One diode equivalent circuit of Solar PV
II. SOLAR PV MODELING AND VALIDATION
The commonly accepted solar cell model is a one diode model [19]. This work uses the single diode model of the solar cell to model
the Kyocera KC200GT solar array, which is shown in Fig. 1.
The I-V characteristics of a solar array, as shown in Fig. 2, are represented by (1).

International Journal of Engineering Research and General Science Volume 3, Issue 3, Part-2 , May-June, 2015 ISSN 2091-2730
123 www.ijergs.org
( (
) )
1
Where Ipv and I0 are the photo current and the diode saturation currents respectively. The photocurrent of the PV array depends linearly
on the solar irradiation and the cell temperature. Where Ipv and I0 are the photo current and the diode saturation currents respectively.
The photocurrent of the PV array depends linearly on the solar irradiation and the cell temperature. V therm(=NskT/q) is the thermal
voltage of the array, Ns being the cells connected in series for greater output voltage, K is the Boltzmann constant (1.3806503X10⁻²³
J/K), T is the temperature of the p-n junction of the diode q (1.60217646 X 10⁻¹⁹
) is the electron charge Rs and Rsh are the
equivalent series and shunt resistances of the array respectively and a is the ideality factor usually chosen in the range 1a1.5. Here a
is taken as 1.
The photocurrent of the PV array depends linearly on the solar irradiance and the cell temperature, as shown by (2)
( )
(2)
Here, is the photocurrent at the standard test condition (STC, 250C and 1000 W/m
2), KI is the short circuit current/temperature
coefficient, is the difference between the actual and nominal temperature in Kelvin, G is the irradiation on the device surface and
Gn is the nominal radiation, both in W/m2.
can be calculated based on
(3)
Using these fundamental equations and parameters from the data sheet, the PV model is developed and verified with the panel
datasheet. The I-V characteristics of KC200GT for different irradiance levels at the cell temperature of 250C and varying cell
temperature for a constant irradiance level of 1000 W/m2 as obtained from the simulation are shown in Figs. 2(a) and (b), respectively.
The similarities of the I-V curves for different conditions with the corresponding curves in the KC200GT panel datasheet prove the
validity of the developed solar panel model. The parameters of the PV panel under study are shown in Table I
Fig. 2: The - characteristics of Kyocera KC200GT from simulation with (a) varying irradiance at a cell temperature of 250C and; (b)
varying cell temperatureat 1000W/m2
The PV system under study for the proposed V-f and P-Q control has 125 strings with each string having 4 series connected panels.
The Maximum Power Point (MPP) for a single panel of KC200GT at 1000 W/m2 and 25
0C (STC) is 200 W. Hence, the maximum
power of the PV generator at STC is 125 X 4 X 200 =100kW. But the MPP varies according to the change in irradiance level and cell
temperature.

International Journal of Engineering Research and General Science Volume 3, Issue 3, Part-2 , May-June, 2015 ISSN 2091-2730
124 www.ijergs.org
Table 1:PV Panel Parameters at 1000 W/m2 and 25
0C
Model Kyocera KC200GT
PMPP 200W
VMPP 26.30V
IMPP 7.61A
VOC 32.90V
ISC 8.21A
III. PV SYSTEM CONFIGURATION AND SYSTEM DESCRIPTION
A. PV System Configuration
Fig. 3 shows the PV system configuration for V-f and P-Q control with PV operating at MPP including the battery storage backup. It
is a two-stage configuration where a DC-DC boost converter is used for MPPT control. The system also considers a battery back-up in
case of emergencies while maintaining the voltage and frequency of the microgrid or while trying to supply the critical loads.
A battery is connected in parallel to the PV to inject or absorb active power through a bidirectional DC-DC converter. When the
battery is absorbing power, the converter operates in the buck mode and when battery is injecting power to the grid, it operates in the
boost mode. The operation mode is maintained through the control signal provided to the converter switches.
The PV system is connected to the grid through a coupling inductor LC. The coupling inductor filters out the ripples in the PV output
current. The connection point is called the point of common coupling (PCC) and the PCC voltage is denoted as vc(t). The rest of the
system in Fig. 3 denotes the IEEE 13-bus distribution feeder which is simplified as a substation with the feeder equivalent impedance,
R+jwLS. The PV source is connected to the DC link of the inverter with a capacitor Cdc. The PV is the active power source, and the
capacitor is the reactive power source of the PV system.
According to the instantaneous power definitions for a balanced three-phase system consider vt(t) and vc(t ) denote the instantaneous
PCC voltage and the inverter output voltage (harmonics neglected) respectively,then the
Fig. 3: System configuration of V-f control with solar PV generator operating at MPPT with a battery storage system.

International Journal of Engineering Research and General Science Volume 3, Issue 3, Part-2 , May-June, 2015 ISSN 2091-2730
125 www.ijergs.org
average power of the PV denoted as P(t), the apparent power S(t) and the average reactive power Q(t) of the PV are as given by
eqs.(4)-(6)[20]
( )
∫ ( ) ( )
( ) ( )
(4)
( ) ( ) ( ) ( )
√ ( )
( ) ( ) ( ) (5)
( ) √ ( ) ( ) ( )
( ( ) ( )) (6)
Here,α is the phase angle of vc(t)relative to the PCC voltage. P(t) and Q(t) in (4) and (6) can be approximated by the first terms of the
Taylor series if the angle α is small, as shown in (7) and (8):
( ) ( ) ( )
(7)
( ) ( )
( ( ) ( )) (8)
B. Battery Modelling
In this paper, the battery model is taken from the MATLAB SimPower Systems library with appropriate parameters which will be
used for the proposed V-f and P-Q controls. The detailed description about the battery model is given in [21].
It is assumed that the lead acid battery can be discharged up to SOC of 20% and can be charged up to SOC of 80%. The battery model
in [21] is an analytical model with two equations representing the battery discharge and charge models. The battery discharge and
charge model for a lead acid battery is given by eqs.(9) and (10), respectively.
( ) ( ) (9)
[
] [
] ( ) (10)

International Journal of Engineering Research and General Science Volume 3, Issue 3, Part-2 , May-June, 2015 ISSN 2091-2730
126 www.ijergs.org
where Vbatt is the battery voltage (V), V0 is the battery constant voltage (V), K is polarization constant (V/Ah) or polarization
resistance Q is battery capacity (Ah), it=∫ battery charge (Ah), A is exponential zone amplitude (V),B is exponential zone time
constant inverse (Ah ), R is the internal resistance is battery current (A), i and is filtered current (A).
The size of the battery is selected to provide a maximum backup power to compensate for the PV generation in the case of a very
small or no irradiance level. In this work, the MPP of PV generator at STC is 100 kW. Hence, the battery is chosen to provide this
amount of power for a maximum of 1 hour with an energy content of 100 kWh. The battery backup is considered for short duration
applications like frequency control and supplying power to critical loads in the event of emergency situations One hour of battery
backup is considered to be enough for other backup generators to take over the controls in the microgrid emergency situations.
C. Description Of IEEE 13-Bus Distribution Feeder
Fig. 4: IEEE-13 bus distribution feeder.
The diagram of the IEEE 13-bus distribution test system is shown in Fig. 4. It consists of a substation, 13 buses or nodes, 11 line
sections, and 8 loads. The loads comprise of a combination of constant impedance, constant current, and constant power (ZIP) loads
but most of them are constant power loads. The substation is at 115 kV and it is stepped down to 4.16 kV by a distribution transformer
(T1). There is one more transformer (T2) which steps down 4.16 kV to 480 V. In the grid connected mode, the substation located at
Bus 650 at 115 kV level is considered as a source. In an islanded microgrid case, a diesel generator connected at the same bus supplies
the microgrid with a fixed amount of active power as referenced by the central controller (CC) of the microgrid.
IV. MPPT AND BATTERY INTEGRATED V-F AND P-Q CONTROL METHODS
MPPT and Battery Integrated V-f Control Method
The MPPT and battery integrated V-f control diagrams are shown in Figs. 5 and 6, respectively. The control comprises of one loop for
MPPT control, two different loops for V-f control at the inverter side and another loop for battery power management.
The loop 1 in Fig. 5 is a MPPT control. The actual PV power output, PPV is compared with the MPP reference, PMPPref from the look
up table 1 of irradiance versus MPP and this error is fed to a PI controller, PI1 which outputs the duty cycle δ* for the DC-DC booster
so that the array always operates at the referenced point by changing this duty cycle. The equation for this control loop is given by eq.
(11). Here, Kp1and Ki1 are the controller proportional and integral gains respectively for this control loop.
( ) ∫ ( )
(11)
International Journal of Engineering Research and General Science Volume 3, Issue 3, Part-2 , May-June, 2015 ISSN 2091-2730
127 www.ijergs.org
Another feedback PI controller is used for voltage control at AC side. As shown in the control diagram in Fig. 5 (loop 2), the PCC
voltage is measured and the rms value of is vt(t) calculated. Then, the rms value Vt(t) is compared to a voltage reference Vt(t)* which
could be a voltage specified by the utility, and the error is fed to a PI controller. The inverter output voltage is controlled so that it is in
phase with the PCC voltage, and the magnitude of the inverter output voltage is controlled so that the PCC voltage is regulated at a
given level Vt(t)* . The control scheme can be specifically expressed as eq. (12).
( ) ( ) [ (
( ) ( )) ∫ (( ( ) ( )) )
] (12)
Where KP2, KI2 are the gain parameters of the PI controller2.
In eq. (12), 1 has been added to the right-hand side such that when there is no injection from the PV generator, the PV output voltage
is exactly the same as the terminal voltage.
Fig. 5: Integrated Solar PV MPPT and V-f control diagram
Fig. 6: Battery power control diagram.

International Journal of Engineering Research and General Science Volume 3, Issue 3, Part-2 , May-June, 2015 ISSN 2091-2730
128 www.ijergs.org
The frequency control is carried out by controlling the active power output at the inverter side as shown in the outermost loop 3. The
referenced microgrid frequency of 60 Hz is compared with the measured value, and this error is fed to the PI controller PI3 that
provides the phase shift contribution α1* so as to shift the voltage waveform in timescale. Thus, the active power injected will be
enough to maintain the frequency at the nominal value 60 Hz. The equation for this control is given by eq. (13).
( ) ∫ ( )
(13)
There is another controller PI4 used in the same loop 3. This controller maintains the active power balance between the AC and DC
side of the inverter. The reference signal for PI4 is obtained from the dynamically changing active power injection from the inverter at
the AC side as determined by the output of PI3. Then, this measured AC side active power, PACmeasured is multiplied by a factor of
1.02 considering the efficiency of inverter as 98% such that the DC side active power is 102% of the AC side active power. The DC
side active power is compared with this value of AC side power and the error is α2*
fed to PI4 to obtain the phase shift contribution
from this loop is given by eq. (14).
( ) ∫ ( )
(14)
The phase shift contributions from DC and AC sides, α1* and α2
* are then averaged as given by eq. (15) to obtain the final phase shift,
of the voltage waveform , vc1* which will then generate the voltage reference signal vc* for the inverter PWM.
(
) (15)
Here, the reason behind considering phase shift contributions from both DC and AC side active power is to control the DC side
voltage to achieve the desired value. By making α1*
and α2*
in a close range through the controller gains, it can be assured that the
active power at the DC and AC sides is balanced. This, coupled with the voltage control loop, assures that the DC side voltage is
maintained at the value desired by the AC side voltage.
The controls shown in the diagram of Fig. 5 and described above are also integrated with the battery power control shown in the
diagram in Fig. 6. The battery is incorporated into the PV system configuration in order to supply or absorb active power to support
the frequency control objective with the PV generator. If there is abundant solar power and the active power required for frequency
control is less than PV MPP, then the battery will be charged; otherwise, if there is not enough solar power available or if the active
power required for frequency control is more than maximum available power from PV, then the battery will supply the deficit power
in order to follow the load and maintain the microgrid frequency at 60 Hz. Hence, the control method for the battery charge/discharge
depending on this requirement is developed as shown in Fig. 6.
In Fig. 6, the reference power to the battery, PBattref is generated dynamically by subtracting the inverter active power injection, Pinverter
from the power generated by PV, PPV. The controller comprises of a PI controller, PI5 which receives the error signal obtained after
subtracting the actual battery power, Pbatt from the battery reference, PBattref. The signal obtained from PI5 is then compared with a
triangular waveform of unity magnitude to generate the signal, S*. This is similar to common Pulse Width Modulation (PWM) in
inverter controls. Kp5 and KI5 are the proportional and integral gains, respectively. The equation for this control is given by eq.(16).

International Journal of Engineering Research and General Science Volume 3, Issue 3, Part-2 , May-June, 2015 ISSN 2091-2730
129 www.ijergs.org
( ) ∫ ( )
(16)
One more step is considered to differentiate the charging and discharging mode of the battery. This is undertaken by comparing PPV
with Pinverter. If PPV >= Pinverter, the battery is in charging mode, hence, the signal obtained from the PWM, S* and the result of this
comparison is passed through a logical AND to generate a switching signal to activate the Buck mode of the DC-DC converter. If PPV
>= Pinverter is false, (i.e., PPV < Pinverter), the opposite of this signal and S* is passed through a logical AND to generate a switching
signal to activate the boost mode of the DC-DC converter. Hence, with this control logic, the converter is capable of operating in both
directions, therefore, effectively charging and discharging the battery whenever required.
B. Modification of V-f control to consider Battery State of Charge (SOC) constraint
When there is abundant solar irradiance available and the active power required for the microgrid frequency control is less than active
power produced by solar PV generator at MPP i.e. Pfcontrol < PPVMPP and at the same time the battery SOC is 80%, then, the battery
cannot be charged beyond this upper limit of SOC. In such case, decreasing the output power of solar PV generator would lead to
underutilization of the solar resource. Hence, a global control mechanism is required in a microgrid which can transition the PV
control from frequency control mode to constant power mode with power to be generated at PPVMPP. Meanwhile, there should be a
mechanism to allow any other generator of the microgrid to handle the frequency control problem. In the microgrid system under
consideration, there is a diesel generator which can decrease its generation in order to match the PV generation increase. Hence, the
power balance of the system will be maintained to eventually control the microgrid frequency.
Similarly, when the irradiance is low such that the maximum power from PV generator is not enough to maintain the microgrid
frequency i.e. Pfcontrol > PPVMPP and at the same time, the battery SOC is 20%, then the battery will not be able to back up the PV
generator and hence, the frequency control function needs to be transferred to other available generator if possible, in this case, a
diesel generator. Again, a global control mechanism becomes an absolute necessity to allow the transition of PV generator control
from frequency control mode to constant MPP mode and the transition of diesel generator control from constant active power mode to
frequency control mode such that the frequency stability of the microgrid can be maintained.
Fig. 7: Diesel generator control transition

International Journal of Engineering Research and General Science Volume 3, Issue 3, Part-2 , May-June, 2015 ISSN 2091-2730
130 www.ijergs.org
Fig. 8: Modification of PV inverter frequency control loop.
Fig. 6,7 and 8 shows the modifications of controls at different levels in the microgrid. Fig. 7 shows the transition of the diesel
generator control from constant active power control to frequency control. Instead of considering the error between the reference
electrical power and the measured electrical power to generate the mechanical power reference, the frequency error is considered in
the controls. Fig. 8 shows the modification in V-f control loop of the PV inverter which includes the transition to another loop to take
care of the constant active power control at MPP. The transition timing can be obtained from a separate module which compares
active power generated from the PV generator with the inverter active power injection to maintain frequency and at the same time
monitors the SOC of the battery and comes up with a time at which the controls should transition from one mode to the other. This
logic, however, has not been implemented in the simulation. During the simulation process, the transition timing is heuristically
selected as 1 sec so that the smootheness ın transfer of controls can be observed.
C. MPPT and Battery Integrated P-Q Control Method
This sub-section presents the proposed coordinated active and nonactive/reactive (P-Q) power control integrated with PV MPPT and
battery controls. Either in grid connected or islanded mode, the microresources may be required to supply critical loads like hospitals,
industries, etc. The proposed control strategy is applicable particularly for such cases. The MPPT control part for generating the duty
cycle of a proper control for the DC-DC boost converter is the same as described in Section IV-A above and hence, will not be
explained here. Thus, Fig. 9 shows the P-Q control blocks only, leaving behind the MPPT control block which is also present in the
entire integrated control system. The P-Q control initially proposed in [22] and implemented in a larger system in [23] is converted to
a more robust control with the integration of MPPT control and battery storage control in the present work.

International Journal of Engineering Research and General Science Volume 3, Issue 3, Part-2 , May-June, 2015 ISSN 2091-2730
131 www.ijergs.org
Fig. 9: Integrated Solar PV MPPT and PQ control diagram.
The inverter side P-Q control is slightly modified version of inverter V-f control. It is entirely based on the relationship of active and
reactive power at PCC with inverter output phase and voltage magnitude as given by the (7) and (8), respectively. In Fig. 9 (loop 2),
the measured reactive power injection at PCC is compared with the referenced reactive load and this error signal is passed to the PI
controller,PI2
Then, the term obtained is multiplied by the terminal voltage vt to obtain the reference voltage vc1* which is in phase with vt . The
control loop 3 in Fig. 9 handles active power control through the controller,PI3 to generate the phase shift contribution α1* and at the
same time insure the active power balance between AC and DC sides through the controller,PI4 . This is already explained in detail in
Section V-A for V-f control. Thus, the equations for P-Q control are given by (17)–(20)
( ( ) ∫ ( ) )
(17)
( ) ∫ ( )
(18)
( ) ∫ ( )
(19)
(
) (20)
Equation (17) represents the reactive power control loop, (18) represents the active power control loop, and (19) ensures the active
power balance between the DC and AC sides of the inverter. Equation (20) averages the phase shift contribution obtained from the

International Journal of Engineering Research and General Science Volume 3, Issue 3, Part-2 , May-June, 2015 ISSN 2091-2730
132 www.ijergs.org
active power control at the AC and DC sides such that the active power control at AC side and power balance objectives are taken into
account.
Table 2: Controller Gain Parameters For V-F Control (Case1)
MPPT Control Loop Kp1 6 X 10⁻⁸
Ki1 6 X 10⁻⁶
Voltage Control
Loop
Kp2 0.0004
Ki2 0.005
Frequency Control
Loop
Kp3 9.9 X 10⁻⁴
Ki3 5 X 10⁻³
PDC Control Loop Kp4 0.8 X 10⁻⁹
Ki4 0.8 X 10⁻⁸
Battery Control
Loop
Kp5 1.5 X 10⁻⁸
Ki5 1.5 X 10⁻⁷
V. SIMULATION RESULTS AND DISCUSSIONS
This section presents the simulation results obtained with applications of the proposed control methods to the IEEE 13-bus distribution
feeder. First, the results obtained from the coordinated V-f control are presented which is followed by the results from the coordinated
P-Q control. In grid connected mode, the distribution feeder is considered to be supplied by a central generator with a substation at
Bus 650 at 115 kV level and a PV generator at Bus 632. Hence, in an islanded case, the distribution feeder is supplied by a diesel
generator and a PV connected at Buses 650 and 632, respectively.
A. Test of V-F Control in Microgrid Mode:
For the demonstration of the V-f control algorithm, two different irradiance cases are considered: Case 1 with irradiance 1000 W/m2
and Case 2 with 750 W/m2. The PI controller gain parameters for Case 1 are given in Table 2. The controller gains should be adjusted
slightly for the change in irradiance.
While moving from the grid connected to microgrid mode, the diesel generator is controlled to generate a fixed amount of active
power according to the command from the central controller. The diesel generator produces a fixed amount of 1.25 MW throughout
the simulation period as shown in Fig. 10(a) and 11(a). It also shows the reactive power generated from the diesel generator.
In the islanded mode, the active power generated by the diesel generator is not enough to fulfill the power demand of the microgrid.
Fig. 10(b) and Fig. 11(b) shows the microgrid frequency which initially dips to a value of 57.8 Hz due to the load-generation
imbalance. The frequency control from the PV generator starts at 0.1 sec which quickly regulates the frequency back to 60 Hz in 0.2
sec. Fig. 10(c) and 11(c) shows the plot of the PCC voltage in p.u. It can be observed that voltage is also quickly regulated at 1 p.u.

International Journal of Engineering Research and General Science Volume 3, Issue 3, Part-2 , May-June, 2015 ISSN 2091-2730
133 www.ijergs.org
after the control is started.
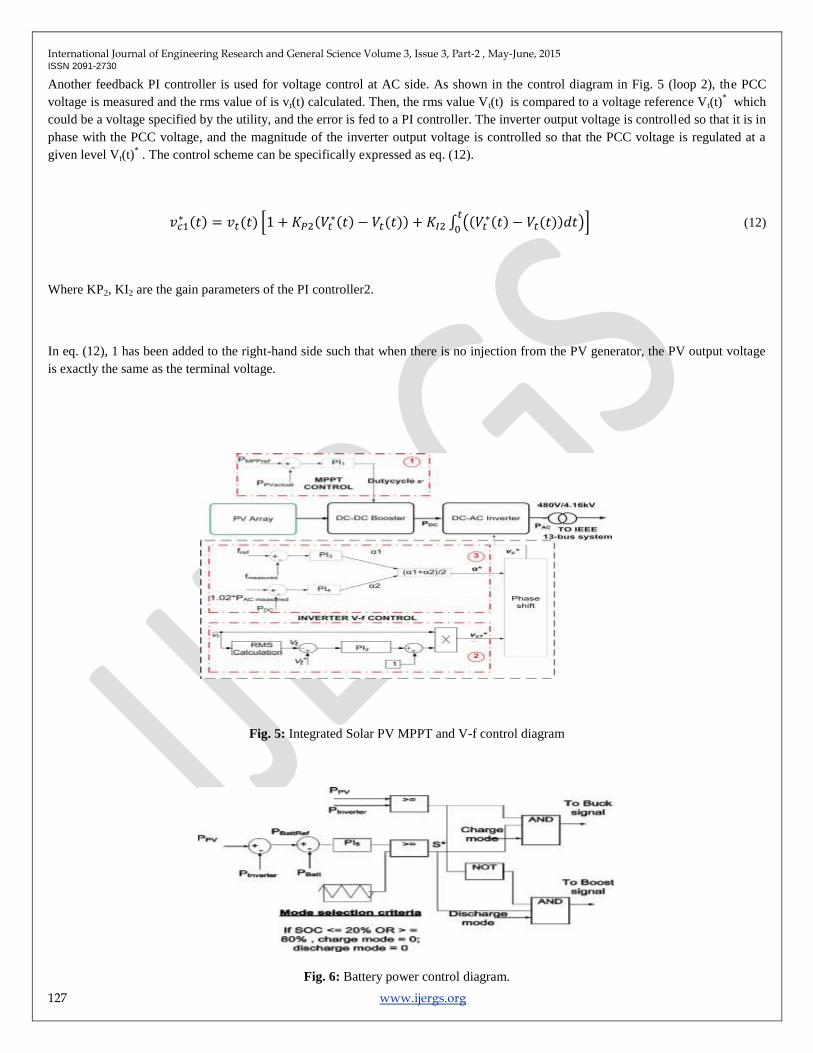
Fig. 10(d) and Fig. 11(d) shows the active and reactive power injection from the PV inverter which regulates the frequency and
voltage of the microgrid. The active power injection from the inverter, which is required to maintain the frequency at 60 Hz in both
cases, is around 80 kW.
However, there is a difference in the share of the PV generator and the battery energy storage while providing the required 80 kW to
the microgrid. This is evident from Fig. 10(e) which shows the active power from the PV, the battery, and the inverter, respectively,
for both cases.
In Case 1, solar irradiance is abundant at 1000 W/m2 and hence, the PV generates the maximum power of 100 kW which is more than
is required to maintain the microgrid frequency. The surplus 20 kW is used to charge the battery. The negative sign in battery power
means that it is a charging phase, i.e., the battery absorbs power is shown in Fig. 10(e). In Case 2, PV generates only around 75 kW at
MPP due to decreased irradiance. This is not sufficient to maintain the microgrid frequency at 60 Hz. Hence, the deficit power of
around 5 kW is supplied by the battery as shown in Fig. 11(e). Here, the positive sign of battery power means that it injects active
power into the microgrid
Fig. 10(f) and Fig. 11(f) shows the state of charge (SOC) of the lead acid battery considered for this study. Fig. 10(f) represents the
SOC for Case 1 which shows that it gradually increases as the excess power is fed to charge the battery. The decreasing curve for Case
2 in Fig. 11(f) shows that the power is being extracted from the battery.
a g
b h
c Fig. 10: Results of coordinated V-f control with
solar PV including MPPT control and battery control (case I).

International Journal of Engineering Research and General Science Volume 3, Issue 3, Part-2 , May-June, 2015 ISSN 2091-2730
134 www.ijergs.org
d a
e b
f c
d a
e b
International Journal of Engineering Research and General Science Volume 3, Issue 3, Part-2 , May-June, 2015 ISSN 2091-2730
135 www.ijergs.org
f c
g d
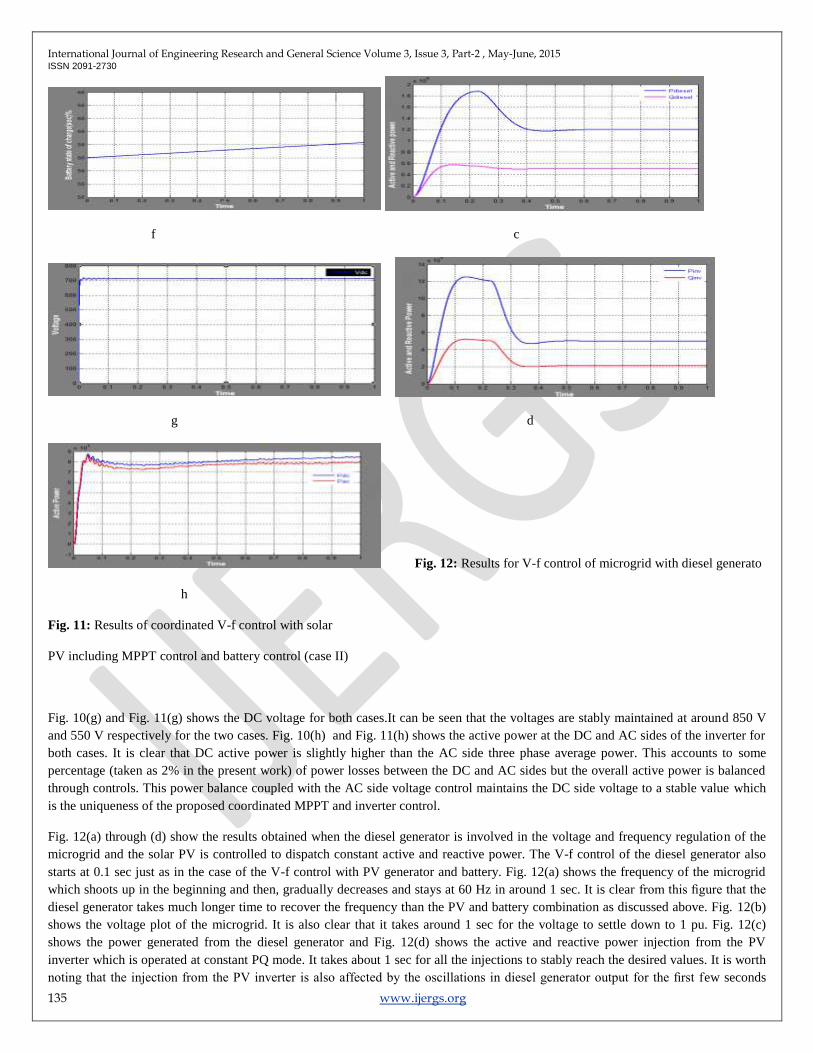
Fig. 12: Results for V-f control of microgrid with diesel generato
h
Fig. 11: Results of coordinated V-f control with solar
PV including MPPT control and battery control (case II)
Fig. 10(g) and Fig. 11(g) shows the DC voltage for both cases.It can be seen that the voltages are stably maintained at around 850 V
and 550 V respectively for the two cases. Fig. 10(h) and Fig. 11(h) shows the active power at the DC and AC sides of the inverter for
both cases. It is clear that DC active power is slightly higher than the AC side three phase average power. This accounts to some
percentage (taken as 2% in the present work) of power losses between the DC and AC sides but the overall active power is balanced
through controls. This power balance coupled with the AC side voltage control maintains the DC side voltage to a stable value which
is the uniqueness of the proposed coordinated MPPT and inverter control.
Fig. 12(a) through (d) show the results obtained when the diesel generator is involved in the voltage and frequency regulation of the
microgrid and the solar PV is controlled to dispatch constant active and reactive power. The V-f control of the diesel generator also
starts at 0.1 sec just as in the case of the V-f control with PV generator and battery. Fig. 12(a) shows the frequency of the microgrid
which shoots up in the beginning and then, gradually decreases and stays at 60 Hz in around 1 sec. It is clear from this figure that the
diesel generator takes much longer time to recover the frequency than the PV and battery combination as discussed above. Fig. 12(b)
shows the voltage plot of the microgrid. It is also clear that it takes around 1 sec for the voltage to settle down to 1 pu. Fig. 12(c)
shows the power generated from the diesel generator and Fig. 12(d) shows the active and reactive power injection from the PV
inverter which is operated at constant PQ mode. It takes about 1 sec for all the injections to stably reach the desired values. It is worth
noting that the injection from the PV inverter is also affected by the oscillations in diesel generator output for the first few seconds

International Journal of Engineering Research and General Science Volume 3, Issue 3, Part-2 , May-June, 2015 ISSN 2091-2730
136 www.ijergs.org
before reaching the steady state.
Hence, it is clearly verified that solar PV and battery without inertia can perform the V-f control for microgrid much faster than the
diesel generator with inertial effect.
B. Test of V-F Control Showing Transition from Grid Connected to Islanded Microgrid Mode
A separate case study is carried out to show the dynamic characteristics of the proposed V-f and P-Q control algorithms while
transitioning from the grid connected to microgrid structure. For this study, Case 1 of Section VI-A is considered in which the
irradiance is at 1000 W/m2. The bus 650 is connected to the substation in the grid connected mode and in the islanded case, the tie
switch is opened at t=0.5 sec. The microgrid is then fed only by the diesel generator located at the same bus 650, and the PV generator
and battery at bus 632. Fig. 13(a) shows the frequency of the system and voltage at PCC both in grid connected and islanded cases. It
can be observed that the islanded microgrid frequency is quickly revived back to 60 Hz. A similar response can be observed in the
voltage profile at PCC as shown in Fig. 13(b). This is due to the faster control characteristics of PV and battery integrated system
involved in V-f control in islanded case.
Fig. 13(c) shows the active and reactive power injection from the PV inverter. The PV is controlled to a constant active power of
around 50 kW and constant reactive powerof around 20 kVAR in a grid connected mode.Both active and reactive power injections
from PV increase as the microgrid transitions to the islanded case in which PV is responsible for maintaining the microgrid frequency
and voltage at PCC.
Fig. 13(d) shows the power injection at Bus 650 of the IEEE 13-bus system. The injection is from the substation in the grid connected
mode.
(a)
(b)

International Journal of Engineering Research and General Science Volume 3, Issue 3, Part-2 , May-June, 2015 ISSN 2091-2730
137 www.ijergs.org
(c)
(d)
Fig. 13: Results of V-f control showing grid to microgrid transition.
In contrast, in islanded mode, the injection comes from the diesel generator which is maintained at a constant value of 1.25 MW. The
results presented here clearly show the effectiveness of the V-f and P-Q control algorithms even when the microgrid transitions from
the grid connected to the islanded mode.
D. Test of P-Q Control
The results of P-Q control with integrated MPPT and battery control is presented in Fig. 14 (a)–(f) for case 3 and in Fig. 15 (a)–(f) for
case 4. Like V-f control, two different cases, namely Case 3 and Case 4, are considered for simulation validation of this control as
well. Cases 3 and 4 are similar to Cases 1 and 2 with slight differences which are elaborated in the following paragraph. The controller
gain parameters for Case 3 are given in Table 3. The parameters need to be readjusted slightly for Case 4.
Here, in Case 3, the critical active power load of a microgrid is less than the maximum available PV power (i.e.,Pref <=PPV) , and in
Case 4, Pref >PPV . Hence, the disturbance for this part is the load changes which are very common in real operation. Moreover, since
coordinated P-Q control method is to be validated, the load change is the most representative scenario to study the effectiveness of the
proposed control. Hence, the solar irradiance is considered constant at 1000 W/m2 for both cases. Fig. 14(a) and Fig. 15(a) shows the
active and reactive power from the diesel generator. The diesel genset produces a constant active power of 1250 kW throughout the
simulation period for both cases with a slight change in reactive power between the two cases. Fig. 14(b) and Fig. 15(b) shows the
reference and actual active and reactive power of the PV inverter. The reference values of active power represent the critical loads of
the microgrid as previously mentioned. The references of the active power for Cases 3 and 4 are 50 kW and 120 kW, respectively.
Similarly, the references of the reactive power for Cases 3 and 4 are 20 kVAR and 70 kVAR, respectively. The references are chosen
to demonstrate both charging and discharging processes of the backup battery energy storage system.

International Journal of Engineering Research and General Science Volume 3, Issue 3, Part-2 , May-June, 2015 ISSN 2091-2730
138 www.ijergs.org
a e
b f
Fig. 14: Results of coordinated P-Q control with solar PV
c including MPPT control and battery control for case 3
d a

International Journal of Engineering Research and General Science Volume 3, Issue 3, Part-2 , May-June, 2015 ISSN 2091-2730
139 www.ijergs.org
b e
c f
d Fig. 15: Results of coordinated P-Q control with
solar PV including MPPT control and battery control for case 4
It can be observed from Fig. 14(b) and Fig. 15(b) that the proposed coordinated controls are capable of serving the critical loads in as
little as 1 seconds. Fig. 14(c) and Fig. 15(c) shows the plot of active power from the PV generator, the inverter injection, and the
active power to and from the battery. In both cases, the power from PV is maintained constant at the MPP power of 100 kW through
MPPT controls as shown in Fig. 14(c) and Fig. 15(c). The active power injection from the inverter is maintained at the reference
values of 50 kW and 120 kW in Cases 3 and 4, respectively. These reference values are demanded by the critical loads. The generation
from PV in Case 3 is more than the critical load by 50 kW. Thus, this surplus power is sent to charge the lead acid battery which is
shown in (Pbatt Case3) Fig. 14(c). The negative sign of power from the battery shown in Fig. 15(c) shows that it is being charged.
For Case 4, the critical load is greater than the PVgeneration at MPP and the deficit power of 20 kW is supplied by the battery as shown
by the (Pbatt Case4) curve in Fig. 15(c). As explained earlier, the positive sign of power from the battery shows that it is being
discharged. Therefore, for Case 3, the power injection from the inverter comes only from the solar PV generator. However, in Case 4,
the injection comes from PV and battery.
Fig. 14(d) and Fig. 15(d) shows the SOC of the battery. It is clear that the SOC changes occurs for Case 3 and Case 4 as expected
because of the respective charging and discharging scenarios. It also validates the effectiveness of the battery control algorithm
adopted in controlling the bidirectional power flow to and from the battery.
International Journal of Engineering Research and General Science Volume 3, Issue 3, Part-2 , May-June, 2015 ISSN 2091-2730
140 www.ijergs.org
Fig. 14(e) and Fig. 15(e) shows the DC side voltage at the inverter input. It is stably maintained at around 820 V and 740 V for Cases
3 and 4, respectively. It validates the indirect control of the DC side voltage through the power balance between AC and DC sides of
the inverter. Similarly, Fig. 14(f) and Fig. 15(f) shows the active power measured at the DC and AC sides of the inverter. Clearly, the
DC side active power is slightly greater than the AC side power which means that the control algorithm also takes care of the
efficiency of the inverter in the model. Hence, the effectiveness of the proposed coordinated P-Q control algorithm in microgrids is
clearly demonstrated from the presented results.
ACKNOWLEDGEMENT
I am deeply indebted to my supervisor, Mr. P.VENKATESH, M.Tech. M.I.S.T.E., Assistant Professor, Department of Electrical
and Electronics Engineering, for his valuable guidance, constant encouragement and keen interest evinced throughout the course of
my project work.
I express my deep sense of gratitude to Dr. T.NAGESWAR PRASAD, M.Tech., Ph.D., Professor and HOD, Department of
Electrical and Electronics Engineering, for his valuable guidance and constant encouragement given to me during this project work
and the course.
I express my gratitude to our Principal Dr. P.C. KRISHNAMACHARY and the Management of SVEC for providing all the
facilities and supporting in completing my project work successfully. I express my heartfelt thanks to all my Teachers in the
department of EEE of Sree Vidyanikethan Engineering College for their moral support and good wishes.
Finally, I would like to express my sincere thanks to my parents, friends, one and all those who guided, inspired and helped me in
completion of my project work.
CONCLUSION
The contribution of this paper can be summarized as follows:
This paper proposes and presents coordinated strategies of V-f control and P-Q control, respectively, for microgrids with PV
generator and battery storage.
In the control strategies, the PV generator is operated at MPP, and the battery storage acts as a buffer in order to inject and
absorb deficit or surplus power by using the charge/discharge cycle of the battery. The paper contributes in demonstrating the
control strategies with effective coordination between inverter V-f (or P-Q) control, MPPT control, and energy storage control.
The proposed control strategy also provides a smooth transition of PV side PQ control in grid connected mode to V-f control in
islanded mode. This is the most essential feature required in the modern microgrid controllers.
The proposed V-f control method shows a very satisfactory performance in reviving highly reduced voltage and frequency back
to the nominal values in a matter of only 0.1 seconds. It is much faster than the diesel generator control which takes around 1
seconds to settle down. Hence, PV and battery installations might be applied effectively in restoring the microgrid frequency and
the voltage at PCC after disturbances.
Similarly, the proposed integrated and coordinated P-Q control algorithm can be effectively used in supplying some critical loads
of a microgrid with solar PV and battery.
REFERENCES:
[1] Sarina Adhikari and Fangxing Li,‖ Coordinated V-f and P-Q Control of Solar Photovoltaic Generators With MPPT
and Battery Storage in Microgrids‖ in Proc. IEEE Transactions On Smart Grid, vol. 5, no. 3, May 2014.
[2] S. Chowdhury, S. P. Chowdhury, and P. Crossley, ―Microgrids and ActiveDistribution Networks‖, IET Renewable
Energy Series 6,2009.

International Journal of Engineering Research and General Science Volume 3, Issue 3, Part-2 , May-June, 2015 ISSN 2091-2730
141 www.ijergs.org
[3] H. Saadat, Power System Analysis, 2nd ed. New York, NY, USA:Mc- Graw Hill, 2002.
[4] J. A. P. Lopes, C. L. Moreira, and A. G. Madureira, ―Defining control strategies for MicroGrids islanded operation,‖
IEEE Trans. Power Syst., vol. 21, pp. 916–924, 2006.
[5] B. Awad, J.Wu, and N. Jenkins, ―Control of distributed generation,‖ Electrotechn. Info., vol. 125/12, pp. 409–
414,2008.
[6] J. C. Vasquez, J. M. Guerrero, E. Gregorio, P. Rodriguez, R. Teodorescu, and F.Blaabjerg, ―Adaptive droop control
applied to distributed generation inverters connected to the grid,‖ in Proc. 2008 IEEE ISIE, pp. 2420–2425.
[7] H. Bevrani and S. Shokoohi, ―An intelligent droop control for simultaneous voltage and frequency regulation in
islanded microgrids,‖ IEEE Trans. Smart Grid, vol. 4, no. 3, pp. 1505–1513, Sep. 2013.
[8] J. C. Vasquez, J. M. Guerrero, M. Savaghebi, and R. Teodorescu, ―Modelling, analysis and design of stationary
reference frame droop controlled parallel three-phase voltage source inverters,‖ in Proc. IEEE 8th ICPE & ECCE,
pp. 272–279,2011.
[9] T. L. Vandoorn, B. Meersman, J. D. M. De Kooning, and L. Vandevelde, ―Analogy between conventional grid
contro and islanded microgrid control based on a global DC-link voltage droop,‖ IEEE Trans. Power Delivery, vol.
27, no. 3, pp. 1405–1414, Jul. 2012.
[10] H. Laaksonen, P. Saari, and R. Komulainen, ―Voltage and frequency control of inverter based weak LV network
microgrid,‖ presented at the Int. Conf. Future Power Syst., Amsterdam, The Netherlands, Nov. 18, 2005.
[11] J. C. Vasquez, R. A. Mastromauro, J. M. Guerrero, and M. Liserre, ―Voltage support provided by a droop-controlled
multifunctional inverter,‖ IEEE Trans. Ind. Electron., vol. 56, pp. 4510–4519, 2009.
[12] H. Li, F. Li, Y. Xu, D. T. Rizy, and J. D. Kueck, ―Adaptive voltage control with distributed energy resources:
Algorithm, theoretical analysis, simulation and field test verification,‖ IEEE Trans. Power Syst., vol. 25, pp. 1638–
1647, Aug. 2010.
[13] H. Li, F. Li, Y. Xu, D. T. Rizy, and S. Adhikari, ―Autonomous and adaptive voltage control using multiple
distributed energy resources,‖ IEEE Trans. Power Syst., vol. 28, no. 2, pp. 718–730, May 2013.
[14] L. D.Watson and J.W. Kimball, ―Frequency regulation of a microgrid using solar power,‖ in Proc. 2011 IEEE APEC,
pp. 321–326.
[15] M. G. Molina and P. E. Mercado, ―Modeling and control of grid-connected photovoltaic energy conversion system
used as a dispersed generator,‖ in Proc. 2008 IEEE/PES Transm. Distrib. Conf. Expo.: Latin America, pp. 1–8,2008.
[16] N. Kakimoto, S. Takayama, H. Satoh, and K. Nakamura, ―Power modulation of photovoltaic generator for frequency
control of power system,‖ IEEE Trans. Energy Conv., vol. 24, pp. 943–949, 2009.
[17] T. Ota, K. Mizuno, K. Yukita, H. Nakano, Y. Goto, and K. Ichiyanagi, ―Study of load frequency control for a
microgrid,‖ in Proc. 2007AUPEC Power Eng. Conf., pp. 1–6.
[18] L. Xu, Z. Miao, and L. Fan, ―Coordinated control of a solar battery system in amicrogrid,‖ in Proc. 2012 IEEE/PES
Transm. istrib. Conf. Expo. (T&D), pp. 1–7.
[19] M. G. Villalva, J. R. Gazoli, and E. R. Filho, ―Comprehensive approach to modeling and simulation of photovoltaic
arrays,‖ IEEE Trans. Power Electron., vol. 24, no. 5, pp. 1198–1208, 2009.
[20] Y. Xu, H. Li, D. T. Rizy, F. Li, and J. D. Kueck, ―Instantaneous active and nonactive power control of distributed
energy resources with a current limiter,‖ in Proc. IEEE Energy Conversion Congr. Expo., pp. 3855–3861,2010.
[21] O. Tremblay and L. A. Dessaint, ―Experimental validation of a battery dynamic model for EV applications,‖ World
Electric Vehicle J., vol. 3, 2009.
[22] Y. Xu, F. Li, D. T. Rizy, and J. D. Kueck, ―Active and nonactive power control with distributed energy resources,‖ in
Proc. 2008 40th North American Power Symp. NAPS’08, pp. 1–7,2008.
[23] S. Adhikari et al., ―Utility-side voltage and PQ control with inverterbased photovoltaic systems,‖ in Proc. 18th World
Congr. IFAC,Milan, Italy, , pp. 6110–6116, Aug. 28–Sep. 2 2011.