Embed Size (px)
Citation preview

1
WWA A
1
Alspfomtous
Oapstrarocogo
A is wm
Anfohiman
WWIIRREEBIMONTHND MINER
Sonic log
Geotechn
. OOvveerrvviie
l wireline logpacing) at cound this meaximum resoool where thesing the SSD
ne importapplication orength, rocating studiesole for wireontinuity, reood day, pre
key measurcompressio
hich is luckilmost mineral
nother impormation dengher resolu
measurementnd accurate w
EELLIINNHLY BULLETRAL EXPLO
quality
nical logging
eeww ooff GGee
gs have theioal densitiesasurement holution of SSe BRD log is ulog as a calib
ant but peof wireline k mechanic. There shoueline loggingsolution, obcision of the
rement in geon wave soly both precborehole co
portant lognsity. Some ution than t. They can within a reas
NNEE WWTIN FOR WRATION
eeootteecchhnnii
r limitations is challengihard to get rSD or HRD at uncalibratedbrator. High
erhaps undlogs is in
cs and rockuld be an impg because bjectivity ande various logs
eotechnical onic transitise and accunditions.
g componedensity logs the P‐wavebe made
sonable toler
WWOORRWIRELINE L
iccaall IIssssuuee
s. Logging foring in termsight. They haa spacing of
d. That is fineresolution is
derused n rock k mass portant of the d, on a s.
logging t time, urate in
ent is have a
e sonic precise rance.
RRKKSSHHOGGERS A
eess
rmation dens of physics.ave circumvef something e for geotechs a desired be
Simto ausocenofrewausfirssligcosocoroctraoffthe
HHOOPP AND GEOSC
nsity at bed r Most mineented the praround 22chnical studiesenefit of wir
milarly, equigenerate
tomatically. nde did thntralised, it oise and it haequency ofaveform tooually 10 or 1st break andghtly but nontext). Yes, mewhere bualfield straticks. The tooansit time afer the full ese limitatio
CIENTISTS
resolution (1eral logging roblem honem or they has. The raw Beline‐based
pment suppa compreThe old B
he job adwas a quiead an audibf 20KHz els use a low15KHz, which so impacts ot substantiathere was a
ut logs were graphies andol generatet different rsonic wavens is to capt
Issue 16 –
ENGAGED
15cm Cs137 soequipment sestly by eitheave offered aRD log can urock strengt
pliers have fession wavBPB Multi‐Cmirably. It et sonde in le click at a every 0.1 wer frequench reduces reson measureally in the ma despiking nearly alwayd remarkablyd a set of resolutions eform. The sture a set of
– March 2016
D IN MININ
ource‐detectsuppliers haer by offeringa triple densusually be fixh logs.
found it touve sonic lChannel Sonwas alwa
terms of rorelatively hiseconds (fcy transmittesolution of tment accuramineral loggifilter in theys very goody good in halog curves but it did nsolution to full wavefor
NG
tor ave g a ity ed
gh og nic ays ad gh full er, he acy ng ere in ard of
not all rm

2
logs and get the log analyst to discriminate (or repair) the first arrival front as precisely as possible. This rather passes the buck but the there are advantages: better measurement quality assurance, the ability to repair poor data, the availability of a precise shear wave log via semblance analysis and the ability to log through PVC pipe and cemented steel casing (see section 2 on sonic logging).
With sleight of hand and some extra effort in the data processing room, we can routinely capture a pretty good 15 or 22cm resolution density log and a very precise sonic log at 20cm resolution. Precision is the key.
The first geotechnical objective is a continuous high resolution log of intact rock strength (IRS) in terms of uniaxial (and unconfined) compressive strength (UCS) calibrated in MPa or PSI units.
The laboratory technician measures rock strength by applying stress to a piece of drill core in one direction (uniaxially) until it fails. There is no second chance so, to smooth out the natural measurement variation in this type of destructive process, the technician is advised to perform the test on more than one sample from the same length of core. The rules are:
Use NX core if possible (21/8" or 54.7mm diameter).
The sample should have a length of roughly twice its diameter.
The sample should have no visible cracks or other defects.
The unconfined compressive strength of a core sample is calculated by dividing the stress or compressive load recorded at the moment of failure by the sample's cross‐sectional area. UCS log units are PSI or MPa.
1 PSI = load in lbs / area in square inches
1MPa = load in Newtons / area in square mm
Since the advice is to measure and average at least three samples from a core stick, the effective resolution of the measurement is not normally better than , in the case of NX drill core, 55mm x 2 x 3 or 330 millimetres or 33 centimetres...about a foot.
This is similar to the wireline log's resolution but there is a problem. In broken, weathered or otherwise weakened rocks, the laboratory technician will struggle to find undamaged core samples of sufficient length to validate the test or to be representative of the formation. There will be gaps in the data precisely where data is needed; in the weaker zones.
Where laboratory UCS data are available, they should offer a reference with which to calibrate wireline logs if some form of empirical relationship exists.
LLooggss ooff ffoorrmmaattiioonn ddeennssiittyy aanndd ccoommpprreessssiioonn wwaavvee ssoonniicc ooffffeerr
ccoonnttiinnuuiittyy ‐‐ ffiilllliinngg tthhee ggaappss iinn llaabboorraattoorryy UUCCSS ddaattaa.. The question is; can sonic and density logs or a combination of them be made to create a log of intact rock strength with an acceptable degree of accuracy? If so, the precision, continuity and resolution they offer will supplement and improve the laboratory data set.
Wireline logs are more precise than laboratory logs and they may be repeated ‐ to prove the point.
In sedimentary rocks, sonic and density logs are related to and, in clean formations, can be converted to porosity. Porous rocks (being full of holes) are weaker rocks. The two porosity logs will overlay well in clean sandstone, limestone and dolomite, assuming the correct conversion formula is applied. The neutron log will describe porosity (free water) in clean formations but it is very sensitive to hydrogen in bound water (in clay).
McNally in "The Prediction of Geotechnical Rock Properties from Sonic and Neutron Logs" (1990) got the ball rolling in empirical analysis by describing a strong relationship between sonic transit time logs and UCS measurements in Australian coal basin sediments (his trials with the neutron log were less successful).

3
Thexco
Wm
It mlimsesurealt
Thric
Bo
AA
dd
dd
he empirical xtend to haronversion of
UCSA(MPa
Where DT is ticro‐seconds
P‐Wadata caand Que
soon becaore valid relamiting dataettings. Rolauggested thesolution (BRternative for
UCSR (MP
he result is vch formation
oth wireline
AA ssiittee‐‐sspp
deennssiittyy ll
diissccrreettee
relationshiprd rock tranhundreds of
a)=1000exp((‐
the sonic tras per foot.
ave Sonic logsaptured in 40 eensland coal
me clear tationships coa to indiviand Turner e incorporaRD) density rmula shown
Pa) = 150000
very similar ins, the incorp
and laborato
ppeecciiffiicc ee
looggss rreess
iimmpprreecc
p was strongensit times. Nf very precise
‐0.035)*{DT})
ansit time lo
s versus UCS uboreholes in fields during
hat tighter ould be foundual geolo(Reeves)
ation of a log by usinn below.
00*({BRD}/({
in soft rocksporation of d
UCSA
ory data ben
eemmppiirriiccaa
uullttss iinn aa
iissee llaabboo
est in clean sNeverthelesse sonic logs p
)
og in
using NSW 1990
and nd by ogical later bed g an
{DT}^2))
but, in harddensity impro
A and UCSR co
efit from com
aall rreellaattii
aa ccoonnttiinn
oorraattoorryy d
sandstones, , McNally's previously ca
d rocks, wheoves the ana
ompared in tr
mbination, e
iioonnsshhiipp
nnuuoouuss pp
ddaattaa......ee
poor in clayefforts repraptured by th
ere sonic logalysis, as wel
rack 4 from th
each adding s
ccoonnvveerr
rreecciissee lloo
eeaacchh lloogg
y‐rich formatresented a bhat old BPB m
s tend to plal as log resol
he left
something to
rttiinngg ssoonn
oogg tthhaatt
gg ssuuppppoorr
tions and thebreakthrougmulti‐channe
ateau in highution.
o supplemen
nniicc oorr ss
iiss llaaiidd oo
rrttss tthhee oo
e study did nh and offerel sonic sond
h density iro
nt the other.
soonniicc aann
oonn ttoopp oo
ootthheerr..
not ed de.
on‐
nndd
ooff

4
The objectives of rock mass classifications or rating (RMR) are described below (Bieniawski 1973):
1. Identify the most significant parameters influencing the behaviour of a rock mass.
2. Divide a particular rock mass into groups of similar behaviour – rocks of varying quality.
3. Provide a basis of understanding the characteristics of each rock mass class.
4. Relate the experience of rock conditions at one site to those encountered at others.
5. Derive quantitative data and guidelines for engineering design.
6. Provide a common basis for communication between engineers and geologists.
Wireline logs provide an objective, quantitative, in‐situ measurement of some rock characteristics that can be compared from rock mass to rock mass, site to site.
Formation transit time ‐ porosity / compaction / IRS / fractures
Sonic amplitude ‐ rock hardness
Formation density ‐ compaction / chemistry / fractures
Natural gamma ‐ clay fraction
In all this, we are discussing intact rock strength (IRS). Above 40MPa, rocks can be described as strong. Typical building foundation concrete is about 30MPa. High strength concrete used in bridge construction is about 50MPa. So, if not weathered or very rich in clay or coal, most intact rocks are "strong". Much of the emphasis of RMR studies is to take account of the number and nature of discontinuities in the rock mass.
Bieniawski used the following list of parameters in his rock mass rating.
1. Uniaxial compressive strength of intact rock 2. Rock quality designation (RQD) 3. Spacing of discontinuities 4. Condition of discontinuities 5. Groundwater conditions 6. Orientation of discontinuities
Of these six parameters, four are directly related to fractures, their frequency, condition, orientation and also the groundwater produced through them.
The wireline logger's ability to describe fractures has been improving steadily since the introduction of the acoustic televiewer in the early 1990s. This tool maps the borehole wall in terms of sonic reflectivity, which is related directly to rock hardness. Fractures stand out clearly on the images they produce. Image resolution is now better than 3mm in slim boreholes.
An alternative is the optical televiewer, which describes the borehole wall photographically at even higher resolution, about 1mm, offering an excellent description of rocks intersected by a borehole, including all the fractures, their apertures (not possible from drill core) and their orientations (difficult from drill core). With such high resolution, it is possible to comment on fracture condition...planar, rough, broken, mineralised etc.
5
TThhee bbiigg qquueessttiioonn iiss......wwhhiicchh tteelleevviieewweerr ttoo uussee aanndd wwhhyy..
Acoustic Televiewer
Will only work in a fluid‐filled borehole.
Will not work well in drilling mud.
Will not work well in large diameter boreholes. Centralisation is a big quality factor.
Image quality is compromised by a rough borehole wall.
Resolution is high but not as high as the optical tool.
Some geological information is available from the image...coarse or fine texture.
The log is very sensitive to fractures...particularly in hard rocks (high contrast).
The amplitude log is sensitive to rock hardness, so describes weathered zones well.
The system offers a 360 degree log of transit time ‐ borehole radius.
The log describes, measures and orientates breakout... caused by the stress regime.
Optical Televiewer
Requires dry hole or, if wet hole, clean water.
Will not work well in dirty water or drilling mud.
Works well in small and large diameter boreholes.
Does not work well where the borehole is coated with mud or other deposits.
Image quality is not seriously affected by a rough borehole wall.
Resolution in very high although deposits on the lense cover can damage the image.
Image picking is often difficult and small fractures can be lost in the complex imagery.
The system does not offer a 360 degree log of transit time ‐ borehole radius.
A lot of geological information is available...virtual core.
The log describes and orientates breakout but not clearly. It does not measure its depth.
The acoustic televiewer generates an orientated image in terms of rock hardness whereas the optical version provides an orientated photographic image. Perhaps, given a borehole filled with clean water, the ATV is a better geotechnical tool and the OTV a better geological tool, but that is not a general rule.
One way or the other, the sought after knowledge, particularly knowledge about the fracture regime, can be got from any borehole except one that is filled with drilling mud...that is where the resistivity micro‐scanner is required.
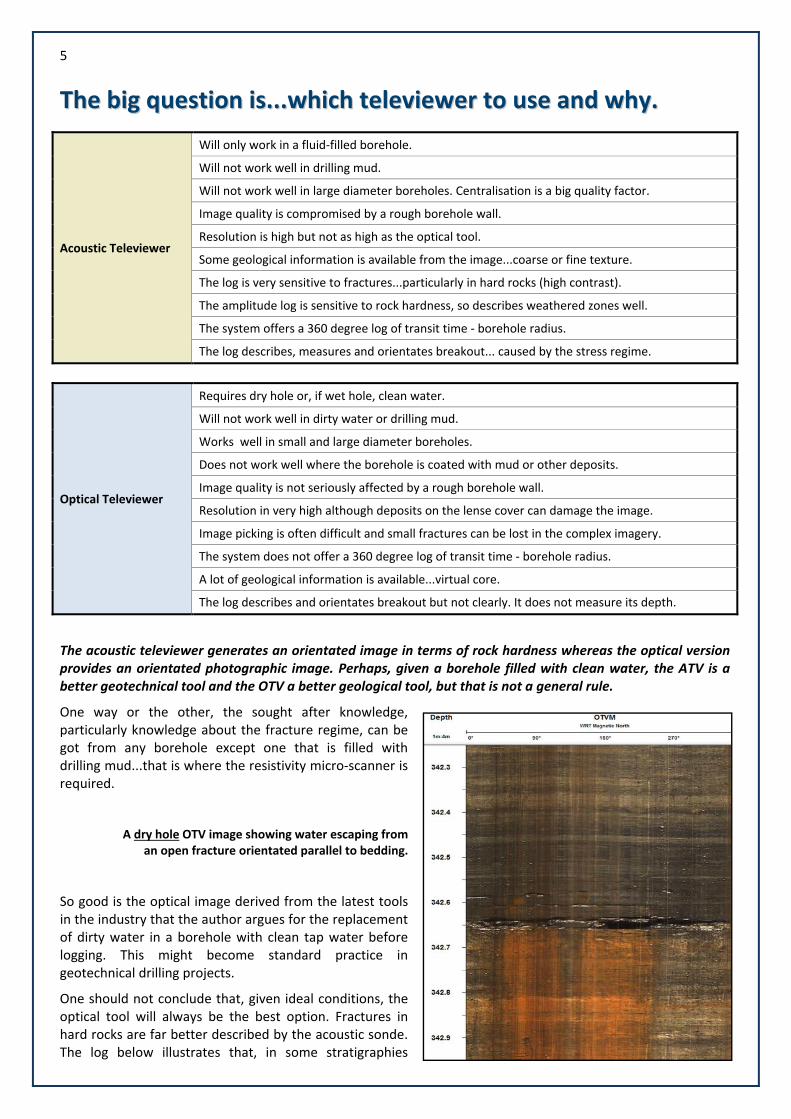
A dry hole OTV image showing water escaping from an open fracture orientated parallel to bedding.
So good is the optical image derived from the latest tools in the industry that the author argues for the replacement of dirty water in a borehole with clean tap water before logging. This might become standard practice in geotechnical drilling projects.
One should not conclude that, given ideal conditions, the optical tool will always be the best option. Fractures in hard rocks are far better described by the acoustic sonde. The log below illustrates that, in some stratigraphies

6
Rebyaltso
22
A
Th
Thgeprbestthco
Thbawarerecemmseve
Thto
So
Twram
Trm
egardless of y a boreholeternative to o they are de
.. MMeeaassuu
review of o
he Sonic L
he various eologist andrecise and aetween the rength and ee logs arompromise lo
he compressased on dedave from teceiver) fromeceiver 2. Ifentimetres, ticro‐secondsultiplied by econds per melocity and b
he log does nool geometry
o what can
wo variables y path. A leasured crit
raditionally, teasured aut
which sondee. He can athe preferre
efined in sect
urreemmeenntt
one wireline
Log Revisit
sonic transid geotechnicccurate. Thelogs (and
elasticity. It ire normallyog quality.
sion wave duction of ttransmitter m the travef the spacinthe result iss through 25, we get
metre. All vaorehole diam
not require cy (sometimes
go wrong?
affect the acow signal amical path, pa
the comprestomatically
e is deployedalso count ted RQD log (tion 3.
FFooccuuss
e log measu
ted
it time logscal engineeere are emptheir deriv
s important y accurate
transit timehe travel tito receive
el time frong of the s a log of t0 cm of roa transit t
ariables suchmeter are de
calibration ass requires ve
ccuracy of thmplitude marticularly for
ssion wave (within a so
d, the loggerthe picked f(rock quality
urement
s available r should bepirical relatiovatives) andto understanand wha
e measuremme of a refer 1 (the om transmittransducers the transit tck. If that ttime log in h as ray patheducted out.
s its responserification by
he sonic log iakes first arrr the shorter
(P‐wave), beonde. Transit
r can describfractures any designation
to the e both onships d rock nd why at can
ment is fracted closest tter to is 20
time in time is micro‐h, fluid
e depends ey multiple log
n adverse borival discrim transducer
eing the first t times, as
be and orientd generate n). The logge
entirely on ang overlay).
orehole condmination diffispacings.
event to afflog values,
(perhaps sueven geoloclearer on texperimentaimportant intensity torunning theshows an oappears to b
ATV (left) anboundaries aon the acous
tate beddinga fracture
er will need t
n accurate cl
ditions. Thescult and bo
fect the waiwere trans
urprisingly), gical informthe acoustication is into set th the optimu sonde. The optical imagbe slightly ov
d OTV (right) and cross bedstic image.
g and fracturfrequency lto understan
lock (assume
se are signal rehole cavin
ting transdusmitted to t
bedding amation can c image. Somdicated. It he OTV ligum level whlog on the lege (right) thver exposed.
where ding are clear
res intersectog. This is nd these term
ed) and a fixe
amplitude ang extends t
ucers, could the surface.
nd be me is
ght ile eft hat .
rer
ed an ms
ed
nd he
be A
7
phenomenon called cycle‐skipping occurred when the sonde's electronics failed to discriminate the arriving pulse and, instead, picked a later cycle. This would result in a spike on the log. Discrete events were easily removed from the data in the sonde by means of a despiking filter (an unfiltered log was generated as an extra curve so that the log analyst could see how much despiking had been applied to the data). So, most logs were displayed spike‐free. If the odd spike got past the downhole filter it could be refiltered on the surface or, where necessary, manually edited from the log.
In hard/fast rocks however, the first arrival amplitude is naturally low and difficult to discriminate.
Modern sonic tools transmit a set of full waveforms to the surface allowing some extra or corrective processing to be performed. Automatic picking of the first break is still made more difficult if signal amplitude is low. As a general rule:
Hard/fast rocks generate: very small hard‐to‐see P‐wave front, large/easy‐to‐see S‐wave front
Soft/slower rocks generate: small P‐wave front, large/moderate S‐wave front
Very soft/slow rocks generate: small P‐wave front, weak or missing S‐wave front
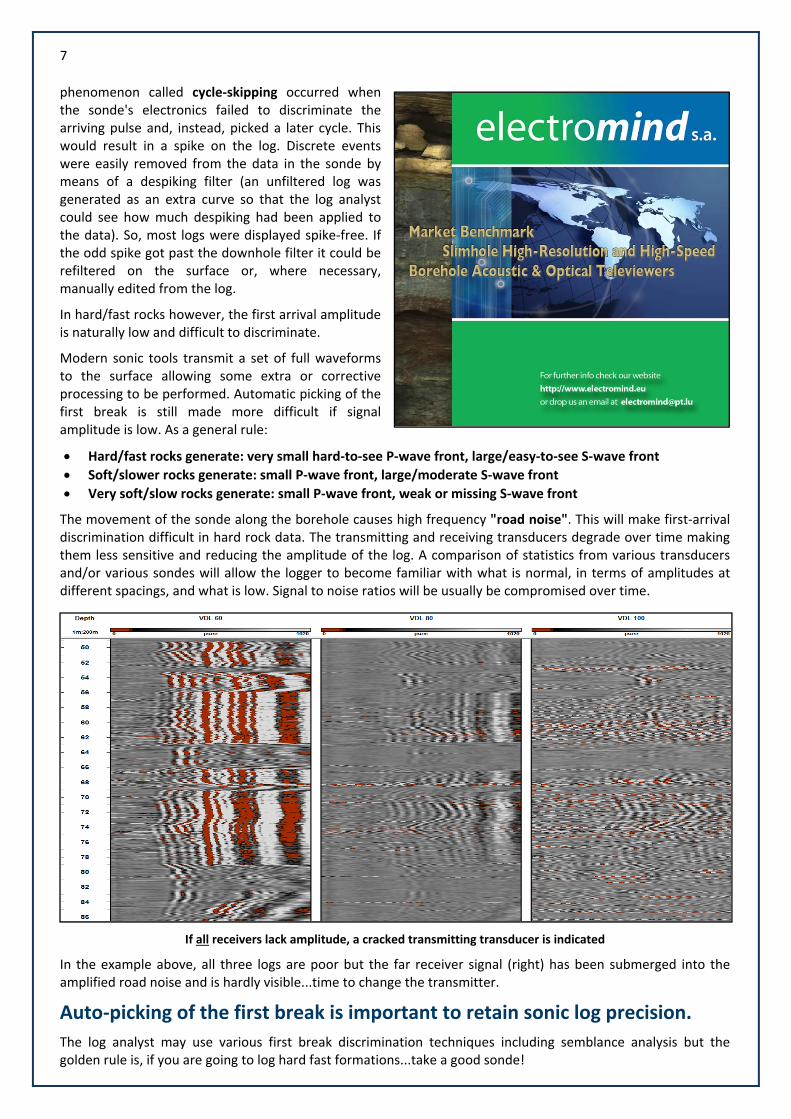
The movement of the sonde along the borehole causes high frequency "road noise". This will make first‐arrival discrimination difficult in hard rock data. The transmitting and receiving transducers degrade over time making them less sensitive and reducing the amplitude of the log. A comparison of statistics from various transducers and/or various sondes will allow the logger to become familiar with what is normal, in terms of amplitudes at different spacings, and what is low. Signal to noise ratios will be usually be compromised over time.
If all receivers lack amplitude, a cracked transmitting transducer is indicated
In the example above, all three logs are poor but the far receiver signal (right) has been submerged into the amplified road noise and is hardly visible...time to change the transmitter.
Auto‐picking of the first break is important to retain sonic log precision.
The log analyst may use various first break discrimination techniques including semblance analysis but the golden rule is, if you are going to log hard fast formations...take a good sonde!

8
Even if a low amplitude arrival is picked, the measured transit time might be affected by signal stretch where travel times are overstated due to the shape of the first break.
This effect is deducted out if all receivers are affected similarly but longer travel results in lower amplitude and a cracked receiver can result in shorter or longer deductions and so slight errors in the log.
The same effect can be caused by lack of tool centralisation where the arrival is splurged due to circumferential ray paths being of different lengths. Again, the effect is deducted away but good centralisation resulting in a sharper higher peak amplitude will improve discrimination and reduce stretch.
The sonic tool will not operate above the borehole fluid level. Its log will also be adversely affected by gas in the fluid. A poor log caused by gas bubbles often confuses the logger who thinks there is something wrong with his sonde (do a repeat and look for common start depth of the gas ingress).
Radon gas ingress causing separation of sonic data and availing the logger of the
opportunity to flag the ingress point.
Gas bubbles travel along the high side of the borehole and the sonde travels along the low side but gas still causes problems to data quality. The only solution, on the basis that the effect is random, is to record multiple runs and stack the data. This works rather better on full waveform data sets where further stacking of waveforms (vertical moving averaging) is possible.
Borehole compensation is not normally required in mineral logging but it is available from specialised dual transmitter tools and, rather cleverly, by mathematical comparison of two deductions of similar resolution.
If the borehole is caved or fractured, there may be some overstatement of transit time due to a longer ray path or one that includes water in open fractures. The shorter spaced logs will have a higher resolution, which is desirable, but suffer more from borehole irregularities.
Longer spacings will result in the ray path being deeper in the formation and cause a slightly faster log from (T1R4 – T1R1)*1.667, for instance, because the shorter T1R1 might be affected by near‐hole fractures and caving. This effect is not normally significant in cored boreholes.
Log compensation is available if a second transmitter (T2) is present on the sonde (not the norm in mineral logging). In which case, data stacking is available.
Mathematical compensation of single transmitter data using the delayed deduction of T‐R measurements is illustrated below.

9
A stack of two separate measurements is achieved by deducting the remembered green ray path time in position 1 from T1‐R4 in position 2...leaving the first red measurement DT1.
The result is compared with the standard deduction of T1‐R1 from T1‐R4 in position 3...which leaves the second red transit time measurement DT2. This can occur real‐time as the sonde logs the borehole.
Automatic continuous sonic log compensation (modified from Weatherford's mineral division)
The two logs target the same formation (the grey layer) but are based on different deductions from ray paths covering different sections of borehole.
The analyst can then stack or take the shorter of the two transit times. This is a better sonic log if only one transmitter is available.
In most cases, borehole conditions are conducive to the capture of precise P‐wave sonic logs and precision and accuracy are inherent in the system. This is the strength of the sonic log and it is vital if the logs are to be used in geotechnical studies. They are also used for cross‐hole correlation and to estimate porosity, flag secondary porosity (in conjunction with density porosity), describe lithology, correct surface seismic records and create synthetic seismograms. Their peak amplitude log is used to evaluate cementation behind casing (CBL or cement bond log).
We can usually discriminate three wave fronts.
The dual image log below is a really good example of a clean VDL (variable density log) set of images. No road noise is visible. Compression wave (P) and shear wave (S) fronts are clearly defined. Even a third front, the Stoneley (tube) wave (T), can be seen on both images.
Gamma ray, near transducer waveform and far transducer waveform
Note that when both transit times increase (move to the right / slower rock) the shear wave front disappears.

10
We are not concerned with the tube wave as a geotechnical tool but it should be mentioned. This is not a refracted wave. It is a surface or interface wave whose path is constrained by the borehole. The tube wave transit time is affected (slowed) by formation permeability. Part of its energy may be reflected back up or down the borehole wall if it encounters the sharp edge of an open fracture. This causes a chevron pattern on the VDLs.
The significant limitation of the (Mineral) Monopole Full Waveform Sonic tool:
If the shear wave velocity in the formation is slower than the compression wave velocity of the fluid in the borehole column, the transmitted signal will be refracted away from the borehole and cannot be measured.
Refracted ray paths with shear waves created by mode conversion (shear waves are not
supported by water).
Unfortunately, there is no perfectly reliable way around this problem (in oilfield logging they use the very sophisticated dipole sonic tool). The only option is to use some empirically‐based formula, using P‐wave sonic and density data, to estimate the shear wave transit time. This technique is well tried and there are many formulae which, at least, retain precision in the log.
Two‐detector data processed to generate a P‐wave transit time log (in red)
Many sonic tools have just two receivers. First breaks can be picked automatically and deducted, resulting (after correction to the universal lengths of foot or metre) in an objective measurement of P‐wave transit time. If there are just two waveforms, one can also pick the shear fronts manually and apply some trickery with "adjust extremum" to inject necessary objectivity, but it's hard work.
One oft‐employed conversion formula is Christensen's Equation. It estimates the S‐wave transit time using a density log ({BRD}) in gm/cc and velocity log ({PVEL} = 1000000/{PWAV}) in metres per second. In straight‐line rather than mathematical syntax...
SWAV = 1000000/({PVEL}*((1‐(1.15*(((1/{BRD})+(1/{BRD}^3))/(exp(1/{BRD})))))^(3/2)))
It's ugly, but it normally works well enough and it is precise. Better, perhaps, to use a three or four detector sonde and determine the shear wave transit times directly by means of semblance processing.

11
The shear wave is important as a component in the calculation of Poisson's Ratio and the elastic moduli. Refer to Issue 3 of this bulletin. Because shear waves do not easily get around open water‐filled fractures, the waveform character and breaks in the shear front will indicate the presence of fractures.
A 4 channel full waveform sonic log with semblance image on the right
The user of sonic logs should not over estimate the importance of the shear wave or the tube wave logs. Derived logs of formation elasticity are not usually relied upon directly because these dynamic moduli generally describe greater values than the static moduli measured in the laboratory. Some form of empirically based conversion is required (see Issue 4). Fractures are described much better by means of an acoustic televiewer log.
33.. WWiirreelliinnee ddaattaa pprroocceessssiinngg aanndd aannaallyyssiiss
How to get the best from the logs
Fracture frequency and rock quality designation
FF (fracture frequency): The simple fracture count per depth range, usually count per metre or per foot. This log is easily generated in log analysis software such as WellCAD. Log quality depends on whether all fractures have been identified on the image. Picking complex images for the purpose of fracture counting can be extremely arduous but then so is counting fractures on core. Another factor is whether to include drilling‐induced fractures (DIFs). Drilling‐induced breaks (or handling breaks) should not be included in FF or RQD measurement.
The problem with simple fracture frequency is that it takes no account of fracture aperture or large zones of caved formation where no fractures can be counted.
FF works well enough if caving is not a major factor. Sample length should be kept small in order to retain resolution. It is a number per length of televiewer image which may be displayed numerically or as a histogram.

12
RQD (rock quality designation): The percentage of a length of drill core that comprises pieces of 10cm (or 4 inches) or more in length and that are competent (hard and unweathered). This definition was proposed by D. U. Deere in 1964 and is in general use today.
RQD provides the percentage of mostly intact core to that of fractured or missing core. The core diameter is, like UCS measurement, preferred as 54.7mm (NX core).
The reference to missing core, assumed to be very poor rock, is important because, firstly, missing core cannot be identified with confidence on a televiewer image and, secondly, it is not accounted for by simple fracture count. That is not important if zones of generally poor rock can be identified with confidence and sufficient resolution using the wireline logs.
We need an RQD equivalent log based on a televiewer image rather than a tray of drill‐core.
Exactly the same principles apply!
In the core log, the combined missing core and weathered rock percentage are subtracted from the RQD value (starting as 100%) regardless of fracture count. Rock condition is, in this respect, determined subjectively.
In the wireline log, the same process can be followed using an acoustic televiewer image where dark (soft or caved) zones can be excluded as part of the RQD calculation.
An RQD log (centre right histogram) derived from televiewer data
In both cases, excluded zones are subjectively picked. That does not represent a problem because they are fairly easy to identify, particularly on the acoustic televiewer amplitude (rock hardness) image. The wireline option allows more accurate measurement of "lost core" metreage. It is also possible to make the process more objective by using another log, such as sonic or density, and stipulate a cut‐off value below which, the length is not included in the RQD value. In this geotechnical logging application, the ATV, which is sensitive to rock quality and from which a mean amplitude log curve can be derived, is superior to the OTV.

13
RQD analysis is part of most mining or tunnelling support calculations and is a component in Bieniawski's RMR system. It is related to rock mass classification by using the table below.
RQD Rating
<20% Very poor
21‐40% Poor
41‐60% Fair
61‐80% Good
81‐100% Excellent
If about half the core is missing, weathered or regularly broken, (not surprisingly) the rock quality is described as poor. It is possible for a 0% value to result from the analysis if all the core within a sample length is broken, weathered or missing.
The important thing, for the log analyst, is to recognise and pick all natural fractures on the image...this is not always as easy as one might think.
44.. SSuummmmaarryy
Geotechnical logging
RMR, MRMR, IRS and RQD
Five years after Bieniawski introduced the RMR (rock mass rating) classification system to the world of geotechnical engineering, Laubscher modified it to generate mining support criteria. His MRMR (mining rock mass rating) is similar to Bieniawski's RMR, employing IRS and RQD measurements but with additional qualification based on the type of mining, the stress regime and the orientation of discontinuities with respect to mining and stress directions. It's a complex business and we don't need to understand it fully (this is a practical guide) we just need to contribute to it by offering reliable objective data.
IRS: Intact Rock Strength in MPa or PSI ‐ can be estimated based on conversion of sonic logs via empirical studies from the same location.
RQD: Percentage of unweathered rock with low fracture frequency ‐ can be measured by televiewer analysis.
These two parameters describe the rock mass in terms of its strength and condition.
The wireline logger offers continuity and completeness of measurement as well as very high resolution (from the latest televiewers) and inherent objectivity.
In addition...the logger can further add value from lithological analysis, primary and secondary porosity estimation and by measuring stress orientation from borehole breakout analysis (if breakout results from the drilling process).
Reversed pressure flowmeter logging
Laubscher qualifies the IRS/RQD based MRMR by including an analysis of the local groundwater that might flow through discontinuities during mine development. He is interested in the presence of groundwater,

14
its volume, pressure and ingress points. The wireline logger can flag fluid ingress points using flowmeter or differential temperature logs. He can measure flow rates at known pressure imbalances and can even capture a fluid sample at a groundwater ingress point (see Issue 11).
Two sonic tools, whose measurements are both fundamentally precise and accurate, dominate geotechnical wireline logging programmes; Full Waveform Sonic and Acoustic Televiewer.
High quality data processing and log analysis are critical to derive full value from these measurements.
NNeexxtt IIssssuuee::
Density logs
Porosity correction
MMaarrccuuss CChhaattffiieelldd –– MMaarrcchh 22001166
CCooppyyrriigghhttss aappppllyy ((wwwwww..wwiirreelliinneewwoorrkksshhoopp..ccoomm))
AAccttiinngg eeddiittoorr//ccoonnttaacctt:: wwiillnnaa@@wwiirreelliinneewwoorrkksshhoopp..ccoomm
FFoorr bbaacckk ccooppiieess,, ggoo ttoo:: wwwwww..wwiirreelliinneewwoorrkksshhoopp..ccoomm//bbuulllleettiinn aanndd cclliicckk oonn ""PPrreevviioouuss IIssssuueess""..