Embed Size (px)
Citation preview
Is there a clientele effect in Islamic bonds? Evidence from the
Malaysian sovereign bond market∗
Minxia Chen†
Joseph Cherian‡
Yuping Shao§
Marti G. Subrahmanyam¶
This Version: June 18, 2018
∗We thank Emir Hrnjic for suggesting this topic. We would also like to thank Christine Kon and Johnson Mo fortheir excellent research assistance and involvement in this project. We are grateful to Yakov Amihud, Florian Nagler,Obiyathulla Bacha, and seminar participants at NUS Business School and NYU-Stern Corporate Governance Lunchfor helpful comments. We acknowledge the assistance of anonymous traders and portfolio managers in the Malaysianbond market, as well as officials at Bank Negara Malaysia (Central Bank of Malaysia) and Employee Provident Fund(EPF) Malaysia, in sharing their thorough understanding of market practice with us.
†National University of Singapore, the Centre for Asset Management Research & Investments (CAMRI) NUSBusiness School, Mochtar Riady Building, 15 Kent Ridge Drive, Singapore 119245; tel: +65 9036 0355; email:[email protected].
‡National University of Singapore, the Centre for Asset Management Research & Investments (CAMRI) NUSBusiness School, Mochtar Riady Building, 15 Kent Ridge Drive, Singapore 119245; tel: +65 6516 5991; email:[email protected].
§Societe Generale and National University of Singapore, the Centre for Asset Management Research & Investments(CAMRI) NUS Business School, Mochtar Riady Building, 15 Kent Ridge Drive, Singapore 119245; tel: +65 98780648; email: [email protected].
¶New York University, Stern School of Business, Department of Finance, 44 West Fourth Street, Room 9-68, NewYork, NY 10012; tel: +1 212 998 0348; email: [email protected].
Is there a clientele effect in Islamic bonds? Evidence from the
Malaysian sovereign bond market
Abstract
It is challenging to separate clientele effects from other determinants of bond yield spreads.
Malaysia provides a unique laboratory to address this issue, since Islamic and conventional
financial systems operate in tandem there. Malaysian Islamic sovereign bonds have, on average,
a higher yield than conventional sovereign bonds of 4.8 to 9.8 bps, after controlling for bond
characteristics and liquidity. We document that foreign clienteles influenced this yield spread
due to their selling of conventional bonds during the financial crisis. Similarly, when Islamic
bonds were added to the J.P. Morgan bond index, foreign holdings rose and their yield spread
fell, again suggesting clientele effects.
JEL classification: G11, G12, G18
Keywords: clientele effect, liquidity, credit risk, sovereign Sukuk, Islamic sovereign bond, conven-
tional sovereign bond
1. Introduction
Clientele effects, such as supply/demand, regulatory and issuance policy, tax considerations, and
investor preferences, are generally hard to disentangle from market microstructure and other effects,
such as liquidity effects and credit risk. In the case of bonds, the yield curves for different subsets of
the bond market could be different, with the yield spread between various bond categories within the
same country being driven by liquidity, maturity, credit risk and tax considerations, in addition to
clientele effects. Thus, it has been a challenge for researchers to control for these competing effects
and focus purely on clientele effects. The Malaysian sovereign bond market provides a unique and
ideal laboratory that allows for such controls, as both government-issued Sukuk and conventional
sovereign bonds are issued by the Malaysian government: these two subsets of bonds have the same
credit risk exposure.1 In this case, after controlling for maturity differentials, liquidity effects, and
other bond characteristics, the residual yield spread, if any, is likely due to “other clientele effects,”
such as client supply/demand effects.
Since 2005, the Malaysian bond market, particularly its Islamic bond (Sukuk) segment, has
shown significant development in terms of increasing issuance volume, market size, and trading
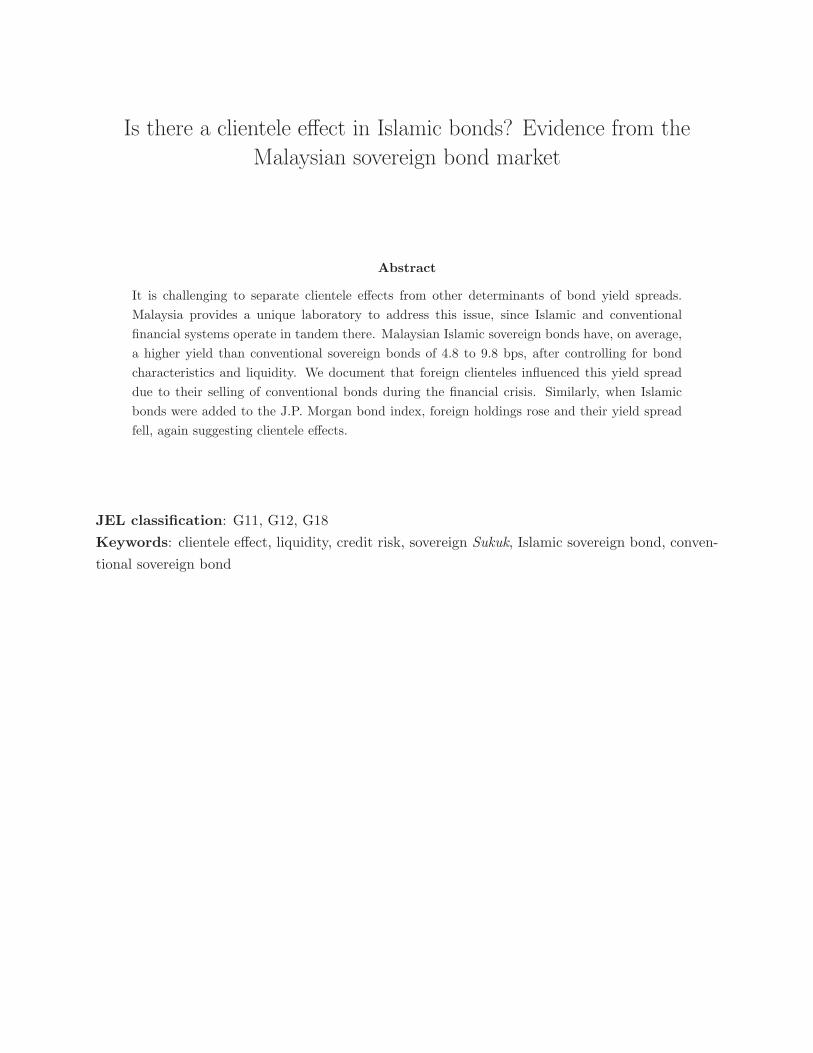
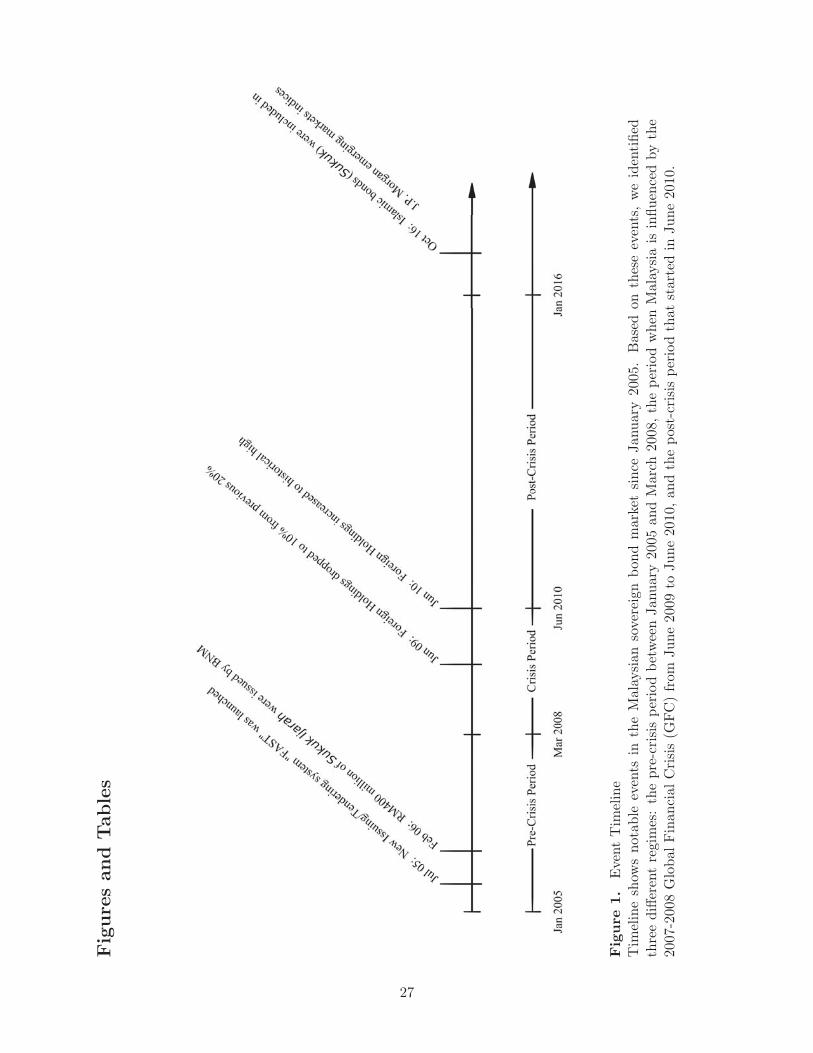
activity. To put things in perspective , Figure 1 provides a timeline of notable events in the
development of the Malaysian sovereign bond market. For example, the new Fully Automated
System for Issuing/Tendering (FAST) was launched in July 2005 and provides greater transparency
to its members and the public. The percentage of foreign holdings, relative to all institutional
holdings in the Malaysian sovereign bond market, increased from 5% in 2005 to around 35% in
2016. Furthermore, Islamic bonds (Sukuk) have always been an important component of the
Malaysian bond market, as well as in the global context. Malaysia issued the world’s first Sukuk in
2000, and is currently the largest issuer of Sukuk in the world, with over half of the Sukuk issued
worldwide denominated in Malaysian ringgit (MYR). A more detailed background of the Malaysian
bond market and its Sukuk segment is provided in Internet Appendix B.
[Insert Figure 1 about here]
1Sukuk is also commonly referred to as “Islamic bonds” or “Shariah-compliant bonds”. In this paper, we use“Sukuk” and “Islamic bonds” interchangeably.
2
Are Islamic bonds (Sukuk) different from conventional bonds? Some researchers claim that
Sukuk are sufficiently different, given that including Sukuk in a portfolio has the potential to
diversify the portfolio and significantly reduce its Value at Risk (VaR) (Raei and Cakir, 2007).
Others believe that Sukuk returns are for most intents and purposes, structured to imitate features
of conventional bonds (Wilson, 2008). Indeed, most bond traders in Malaysia anecdotally view
government-issued Sukuk as similar to conventional sovereign bonds, especially in terms of effective
cash flows, issuance structure, and legal status. A series of FAQs and articles found on the website
of the Bank Negara Malaysia (BNM), the Central Bank of Malaysia, appears to confirm this
conjecture (see Internet Appendix Table IA-1 for details).
As a consequence, an important question is whether government-issued Sukuk and their con-
ventional counterparts have the same yield levels, ceteris paribus? If they do not, what are the
determinants of the yield spread? Some preliminary evidence from independent sources suggests
that Sukuk have higher yields (or lower prices) than the corresponding conventional sovereign
bonds. According to Reuters, the average yield of the government-issued Sukuk in Malaysia, the
world’s most liquid Sukuk market, is 8 bps higher than that of the conventional sovereign bonds.2
However, no rigorous academic research has been conducted to date to analyze this yield spread.
To our knowledge, we are the first to systematically quantify and explain the higher average yield
of Sukuk as compared to their conventional counterparts.
There is also anecdotal evidence provided by market practitioners that corporate Islamic bonds
are in greater demand than corporate conventional bonds, and thus command a higher price.
The reasons include the lower issuance volume of corporate Sukuk, and that Islamic investment
funds have mandates that require the purchase of Islamic securities. Evidence in support of this
widespread belief is provided by Hrnjic, Kapetanovic, and Reeb (2014) who find that the Sukuk
issued by Emirates airline had a higher price (lower yield) than its corresponding conventional
corporate bond, hence making the Sukuk a cheaper source of financing for Emirates during its
purchase of 30 new Airbus A380 airplanes.
In this paper, we focus on the Malaysian sovereign bond market and examine whether government-
2http://www.reuters.com/article/islamic-finance-adb/Sukuk-issuance-costs-still-above-conventional-bonds-in-asia-adb-idUSL5N0ML00D20140324.
3
issued Sukuk have higher or lower yields than their conventional counterparts, ceteris paribus.3 In
addition, we investigate whether the yield spread is explained by liquidity effects.4 Finally, in case
the yield spread is not (fully) explained by liquidity effects, we attempt to tease out other factors
that could potentially explain the higher yields of government-issued Sukuk, which is one of our
primary findings.
Our database, comprising only of Malaysian sovereign bonds, enables us to automatically control
for credit differentials between the two subsets of bonds. We employ a variety of liquidity proxies,
which are both included and not included in the prior literature. This is necessary as we are among
the first to measure liquidity in the context of an emerging sovereign bond market. The results
allow us to comment on the differences between government-issued Sukuk and their conventional
counterparts. Our sample covers the entire Malaysian sovereign bond market from January 2005
to December 2017. We use all traded sovereign bond prices reported in Malaysian ringgit (MYR)
by Bank Negara Malaysia, along with the associated bond characteristics and trading activity
variables. To the best of our knowledge, our combined database is the most comprehensive one
of the Malaysian sovereign bond market that has been assembled to date. It comprises of 37,686
bond-week observations (675 weeks) in total. Our analysis explores both the cross-sectional and
time series differences in the yields between the two subsets of Malaysian sovereign bonds using a
variety of well-established econometric methodologies in the finance literature.
The remainder of the paper is organized as follows: In Section 2, we provide a review of the
literature. We describe our database and present the summary statistics in Section 3. Section 4
presents our empirical results and Section 5 concludes.
2. Literature Review
There is a vast literature on conventional bonds, especially for developed financial markets. First, in
terms of the conventional sovereign bond markets, some earlier papers focus on the direct impact of
liquidity on bond yields and prices. Chakravarty and Sarkar (1999) investigate the liquidity in the
3Constraining our sample to the Malaysian sovereign bond market should alleviate the concern of credit risk. Inany case, there is no differential credit risk between the two types of bonds.
4It is possible that the yield spread survives after controlling for liquidity effects, due to microstructure as well asother factors that potentially remain unmeasured within our analysis.
4
U.S. Treasury bond market using data from the National Association of Insurance Commissioners,
while Fleming (2003) studies the same issue using a different dataset called GovPX. Cherian,
Jacquier, and Jarrow (2004) posit that the yield spread between otherwise identical on-the-run and
off-the-run Treasury securities is a so-called “convenience yield” driven by the profit opportunities
available in the Treasury special versus general collateral repo market. They develop an arbitrage-
free bond pricing model for the on-the-run (or more liquid) securities, where both interest rates and
special repo rates are stochastic. Their model generates yield spreads that are consistent with the
prior empirical evidence. Some more recent papers investigate the dynamic relation among these
determinants (e.g., credit risk and liquidity) of bond yields. Pelizzon, Subrahmanyam, Tomio, and
Uno (2016) examine the dynamic relation among market liquidity, credit risk, and other risk factors,
such as global systemic risk, market volatility, and the funding liquidity risk of market makers. They
focus on the Italian sovereign bond market during the eurozone crisis and the subsequent European
Central Bank (ECB) interventions. Their results show that credit risk can be one of the main
driving forces in determining the liquidity of the bond market. They find that a 10% change in the
credit default swap (CDS) spread can lead to a 13% change in the bid-ask spread.
Second, since the inception of the Trade Reporting and Compliance Engine (TRACE) database
in July 2012 there has been a growing body of literature focusing on the liquidity effects in the US
corporate bond market. Some earlier papers in this area focus on the effect of post-trade trans-
parency on corporate bond transaction costs, and find that there is a significant decline in bid-ask
spreads after the introduction of TRACE, for example, Bessembinder, Maxwell, and Venkatara-
man (2006); Edwards, Harris, and Piwowar (2007). More recent papers point out that liquidity
can be an issue for corporate bonds, particularly during periods of financial distress. Dick-Nielsen,
Feldhutter, and Lando (2012) focus on market-level liquidity, and show that transaction costs in-
creased significantly during the recent financial crisis, especially for bonds with high credit risk. In
contrast, Jankowitsch, Nagler, and Subrahmanyam (2014) focus on liquidity at the security level,
and analyse the recovery rates of defaulted bonds.
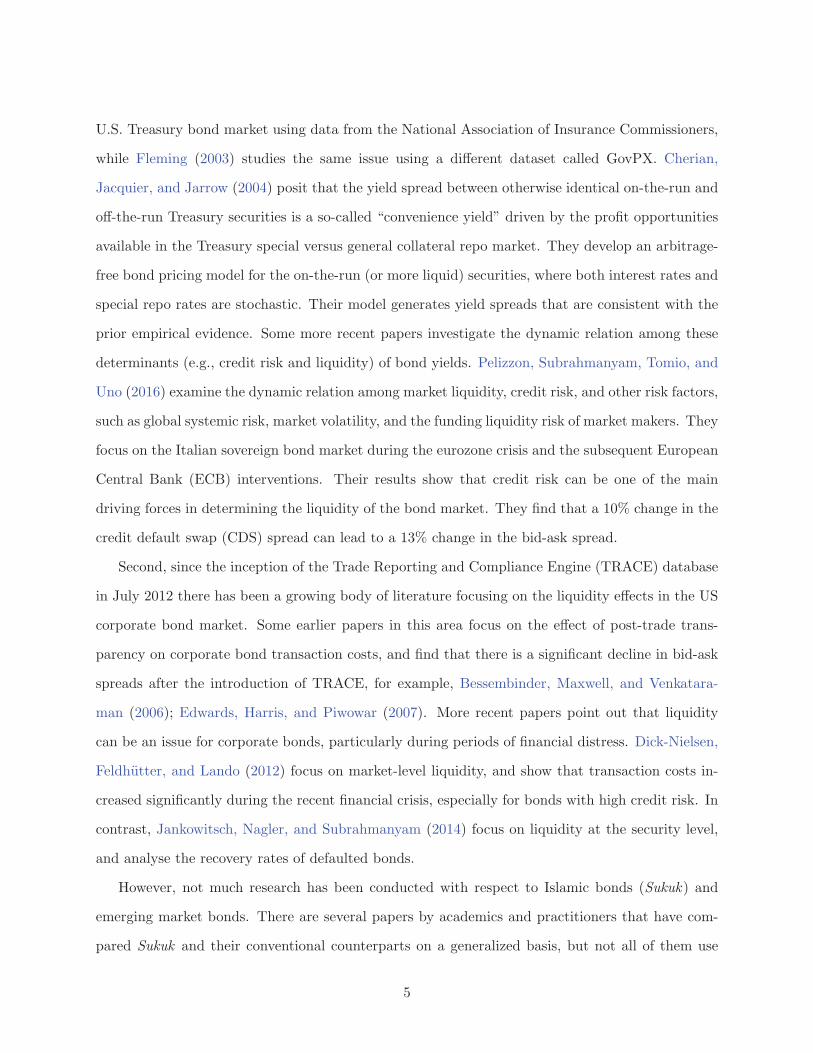
However, not much research has been conducted with respect to Islamic bonds (Sukuk) and
emerging market bonds. There are several papers by academics and practitioners that have com-
pared Sukuk and their conventional counterparts on a generalized basis, but not all of them use
5
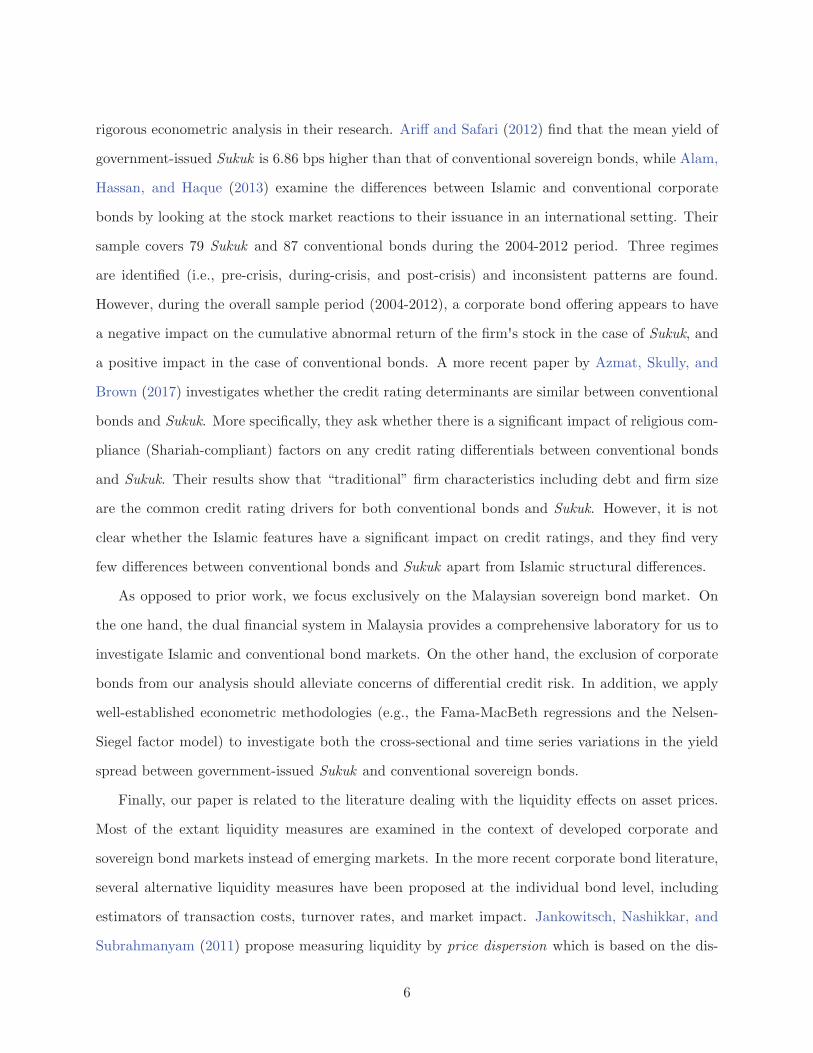
rigorous econometric analysis in their research. Ariff and Safari (2012) find that the mean yield of
government-issued Sukuk is 6.86 bps higher than that of conventional sovereign bonds, while Alam,
Hassan, and Haque (2013) examine the differences between Islamic and conventional corporate
bonds by looking at the stock market reactions to their issuance in an international setting. Their
sample covers 79 Sukuk and 87 conventional bonds during the 2004-2012 period. Three regimes
are identified (i.e., pre-crisis, during-crisis, and post-crisis) and inconsistent patterns are found.
However, during the overall sample period (2004-2012), a corporate bond offering appears to have
a negative impact on the cumulative abnormal return of the firm's stock in the case of Sukuk, and
a positive impact in the case of conventional bonds. A more recent paper by Azmat, Skully, and
Brown (2017) investigates whether the credit rating determinants are similar between conventional
bonds and Sukuk. More specifically, they ask whether there is a significant impact of religious com-
pliance (Shariah-compliant) factors on any credit rating differentials between conventional bonds
and Sukuk. Their results show that “traditional” firm characteristics including debt and firm size
are the common credit rating drivers for both conventional bonds and Sukuk. However, it is not
clear whether the Islamic features have a significant impact on credit ratings, and they find very
few differences between conventional bonds and Sukuk apart from Islamic structural differences.
As opposed to prior work, we focus exclusively on the Malaysian sovereign bond market. On
the one hand, the dual financial system in Malaysia provides a comprehensive laboratory for us to
investigate Islamic and conventional bond markets. On the other hand, the exclusion of corporate
bonds from our analysis should alleviate concerns of differential credit risk. In addition, we apply
well-established econometric methodologies (e.g., the Fama-MacBeth regressions and the Nelsen-
Siegel factor model) to investigate both the cross-sectional and time series variations in the yield
spread between government-issued Sukuk and conventional sovereign bonds.
Finally, our paper is related to the literature dealing with the liquidity effects on asset prices.
Most of the extant liquidity measures are examined in the context of developed corporate and
sovereign bond markets instead of emerging markets. In the more recent corporate bond literature,
several alternative liquidity measures have been proposed at the individual bond level, including
estimators of transaction costs, turnover rates, and market impact. Jankowitsch, Nashikkar, and
Subrahmanyam (2011) propose measuring liquidity by price dispersion which is based on the dis-
6
persion of the transaction prices of an asset around its consensus valuation by market participants.
The zero-return measure is constructed on the number of unchanged sequential prices, while the
no-trade measure is based on the number of periods with no trading activity (Chen, Lesmond, and
Wei, 2007). Amihud (2002) measures liquidity using the relative price impact of a trade to its
trading volume. Roll (1984) posits that the autocovariance in price changes provides for a simple
liquidity measure, commonly refered to as the Roll measure, and interprets the subsequent prices
as arising from the “bid-ask bounce.” Friewald, Jankowitsch, and Subrahmanyam (2017) examine
the liquidity effects in the U.S. fixed income structured product market, using some of the liquidity
proxies mentioned above. In our paper, we first test the relevance of the existing liquidity measures
and then try to develop novel liquidity measures that adapt better to emerging markets (e.g., the
Malaysian sovereign bond market).
Even though the existing evidence suggests that Sukuk, ceteris paribus, deliver a higher yield
(or have a lower price) than their corresponding conventional bonds, our unique database and ro-
bust methodologies allow us to produce more reliable results, while automatically controlling for
macroeconomic factors and credit risk differentials. In summary, we fill the gap in the current liter-
ature by (1) quantifying and explaining the potential yield spread between Sukuk and conventional
bonds; (2) examining the existing liquidity measures in the context of an emerging market; and (3)
developing novel liquidity measures which are better adapted to emerging markets.
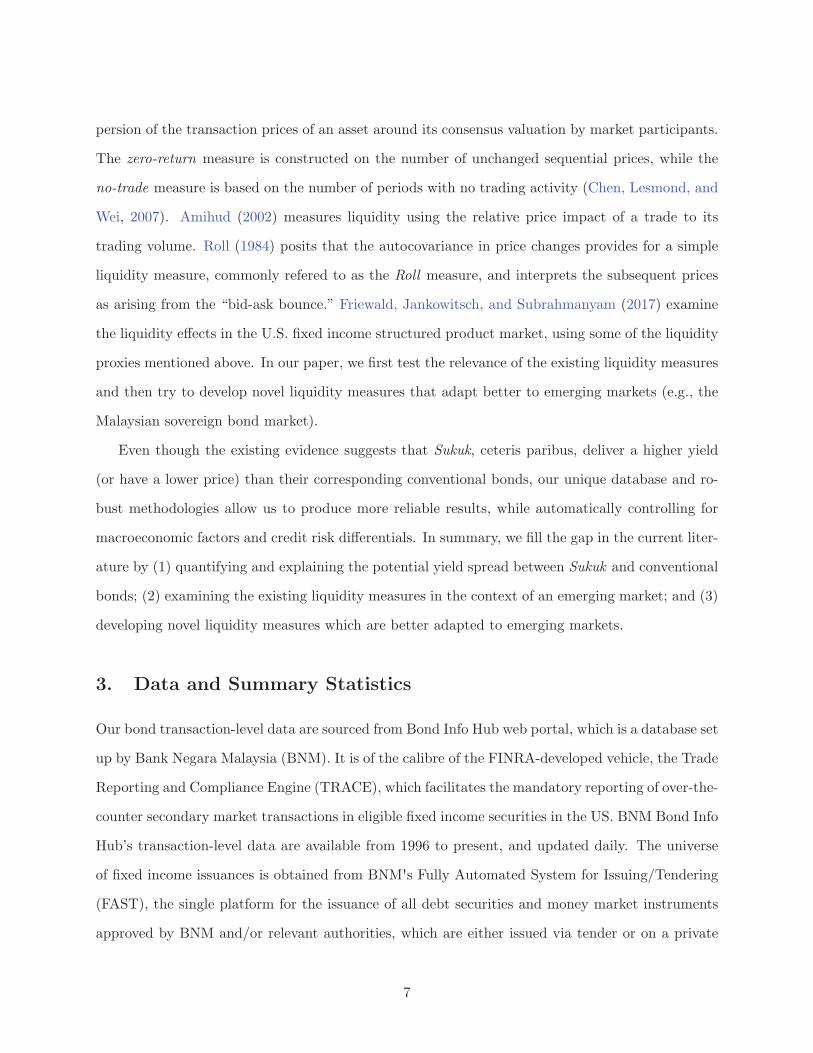
3. Data and Summary Statistics
Our bond transaction-level data are sourced from Bond Info Hub web portal, which is a database set
up by Bank Negara Malaysia (BNM). It is of the calibre of the FINRA-developed vehicle, the Trade
Reporting and Compliance Engine (TRACE), which facilitates the mandatory reporting of over-the-
counter secondary market transactions in eligible fixed income securities in the US. BNM Bond Info
Hub’s transaction-level data are available from 1996 to present, and updated daily. The universe
of fixed income issuances is obtained from BNM's Fully Automated System for Issuing/Tendering
(FAST), the single platform for the issuance of all debt securities and money market instruments
approved by BNM and/or relevant authorities, which are either issued via tender or on a private
7
placement basis. Our sample period is from January 2005 to December 2017.
3.1. Data Description
The instruments in our database can be grouped into asset-backed securities (ABS), corporate
bonds, sovereign securities, commercial paper, Bank Negara Malaysia securities, and medium-term
notes. To exclude the impact of credit risk differentials, we focus exclusively on Malaysian sovereign
bonds and restrict our sample to six types of bonds: Bank Negara Bills (BNB), Bank Negara Mone-
tary Notes - Discount Based (BNMN-DB), Bank Negara Monetary Notes - Islamic Discount Based
(BNMN-IDB and BNMN-IDM), GII (Government Investment Issues), and Malaysian Government
Securities (MGS). The list of included and excluded Malaysian sovereign bond instruments is avail-
able in Internet Appendix C, along with their corporate bond counterparts.
We find that the cash flows and price/yield calculation convention of Sukuk are the same as
for conventional bonds, which we confirmed with the Malaysian financial regulators and industry
practitioners. BNM calculates the yield to maturity according to U.S. street convention, self-styled
as BNM convention. In the U.S. street convention, yield is compounded over the bond coupon
period (usually semi-annually), including the fractional first period (Henrard, 2013).
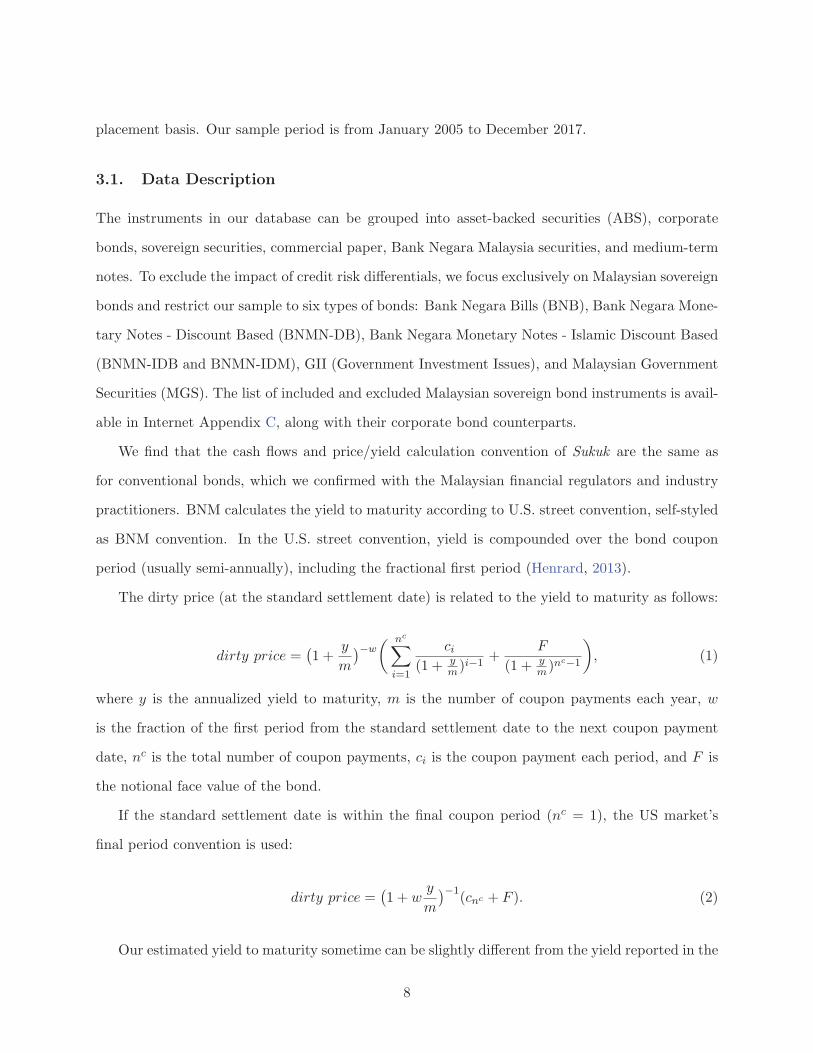
The dirty price (at the standard settlement date) is related to the yield to maturity as follows:
dirty price =(1 +
y
m
)−w( nc∑
i=1
ci(1 + y
m)i−1+
F
(1 + ym)nc−1
), (1)
where y is the annualized yield to maturity, m is the number of coupon payments each year, w
is the fraction of the first period from the standard settlement date to the next coupon payment
date, nc is the total number of coupon payments, ci is the coupon payment each period, and F is
the notional face value of the bond.
If the standard settlement date is within the final coupon period (nc = 1), the US market’s
final period convention is used:
dirty price =(1 + w
y
m
)−1(cnc + F ). (2)
Our estimated yield to maturity sometime can be slightly different from the yield reported in the
8
standard databases. This discrepancy can be attributed to several factors. Bonds with a missing
coupon rate, and sometimes despite official classification as a zero-coupon bond, are not necessarily
zero-coupon bonds. They can have fixed returns. In addition, the periodic cash flows of Sukuk
may not be called “coupon payments”. Instead, they are called “fixed returns”. These bonds could
also be classified as zero-coupon bonds on the Bond Info Hub web portal, although they are more
like coupon bonds. Other reasons for the yield discrepancy could be an unusual interest payment
structure, an embedded option, a floating rate feature, or simply a data entry error.
To make our price/yield estimation as accurate as possible, we further restrict our sample to
fixed-rate “straight” instruments without optionality, and eliminate suspicious data points using
the following six filters.
• Identity information filter: We delete the observation if its instrument type, stock description,
issuer, and maturity date are all missing.
• Price information filter: We apply this filter is to make sure the price/yield information is
available and accurate to the best of our knowledge.
• Extreme price, yield, and volume filter: We omit outliers, which we define as price, yield, and
volume observations which are below the 0.1th percentile or above the 99.9th percentile.
• Duplicated reports filter: We remove duplicate reports with the same bond code, bond de-
scription, trade date, trade time, price, yield, and amount are all identical. We believe these
observations are duplicates, rather than these reports randomly just happening to be the
same. This is because we observe such cases repeatedly for specific bonds only.
• Price median filter: The median filter eliminates any transaction where the price deviates by
more than 10% from the daily median, or from a nine-day median centered at the trading
day. (The 10% level was determined to be a good threshold based on our data.)
• Price reversal filter: The price reversal filter eliminates any transaction with an absolute price
change deviating from the lead, lag and average lead/lag price change by at least 10%.
To further reduce the noise in our transaction-level data, we aggregate the data points into
bond-week observations, following Friewald, Jankowitsch, and Subrahmanyam (2012). That is, if
9
there is more than one transaction for one bond during the same week, we take the dollar-volume
weighted average over the week. The volume-weighted average yield can be calculated as follows:
yjt =
∑i y
ijt ×Qi
jt∑iQ
ijt
, (3)
where yjt is the volume-weighted average yield of bond j in week t, yijt is the yield corresponding
to the ith trade of bond j in week t, and Qijt is the volume for the ith trade of bond j in week
t. However, there are two exceptions, Number of Trades and Amount Traded where we take the
summation of all the trades for one bond during the same week, instead of the volume-weighted
average.
Our final sample contains 37,686 bond-week observations (675 weeks). Our filtering process
results in 432,633 transactions, which represents 68.81% of the total number of transactions in
the raw data.5 A more detailed illustration about how each filtering step affects our sample is in
Appendix A.
3.2. Summary Statistics
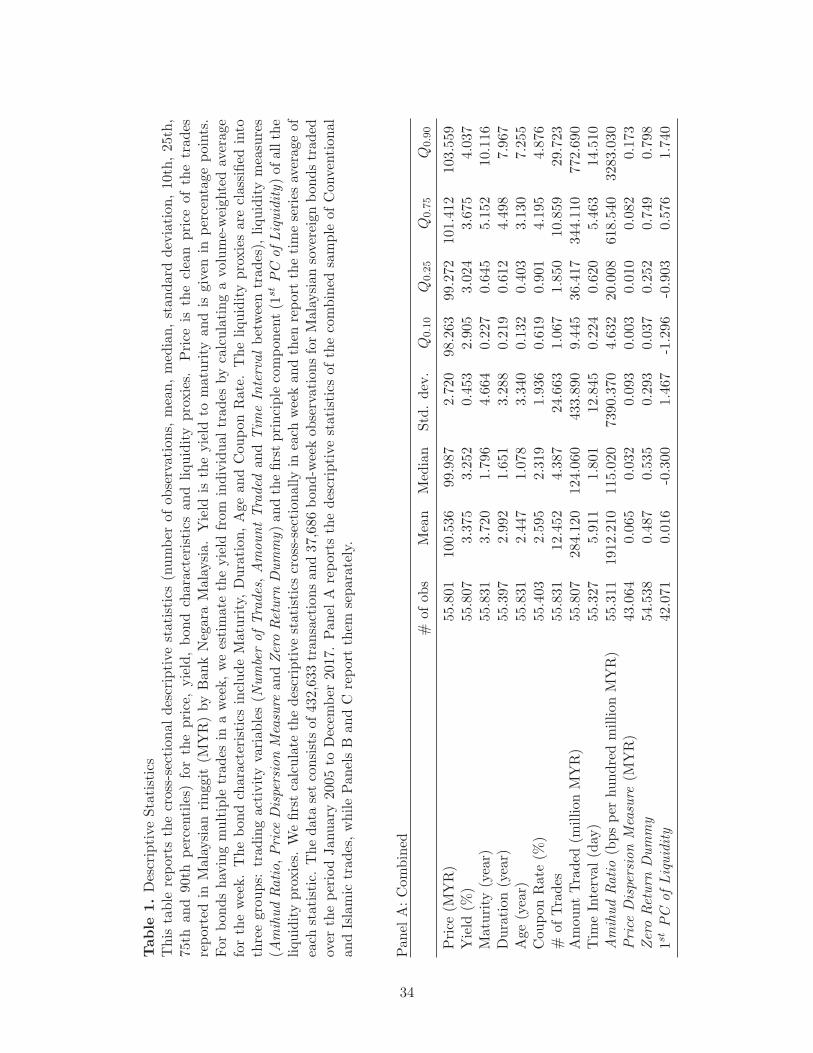
Table 1 reports the summary statistics for the main variables in our empirical analysis, including
the price, yield, bond characteristics and liquidity proxies. Maturity is calculated as the number
of years between the trading date and the maturity date. Duration is the modified duration of
the bond. Age is the number of years between the bond issue date and the trading date. The
coupon rate we use is directly reported in the database. Number of Trades and Amount Traded are
counted for each bond within one week. Time Interval is, for each bond, the number of days since
the last day the bond was traded. The Amihud Ratio measures the price impact of trades. For
each transaction, we divide the absolute value of its return, measured in basis points, by its dollar
trading volume, measured in hundred million Malaysian ringgit (MYR). A higher Amihud Ratio
reflects lower liquidity (i.e., higher illiquidity). The Amihud Ratio is calculated as the average of
5The raw database from Bond Info Hub contains 628,710 transactions during the sample period of January 2005to December 2017.
10
all observed trades within the same week:
Amihud Ratiot =1
Number of Tradest×
∑j
|Returnj |Dollar Trading V olumej
. (4)
The Price Dispersion measure is constructed following Jankowitsch et al. (2011). It measures
how the transaction price differs from the market-wide valuation, and can thus be considered as
a proxy of the transaction cost for a trade. A higher dispersion around the valuation indicates
higher transaction costs and therefore lower liquidity (i.e., higher illiquidity). As we are not able to
obtain the market-wide valuation for the Malaysian bonds in our database, we use volume-weighted
average price as a substitute. Hence the Price Dispersion measure is defined as:
Price Dispersiont =
√1∑k vk
∑k(pk − vwapt)2vk, (5)
where pk is the price of trade k, vk represents its corresponding traded volume, and vwapt is the
volume-weighted average price of all the trades for the same bond in week t. To get a valid Price
Dispersion measure, we also require that the bond has at least two trades within the week. The
Zero Return Dummy is set to one if there is no price change from the previous trade, and zero
otherwise. Constant unchanged price information could reveal low liquidity or high illiquidity.
[Insert Table 1 about here]
One concern about using the aforementioned traditional liquidity proxies in an illiquid emerging
bond market is that they may be quite noisy, given that most bonds are infrequently traded. Each
liquidity proxy may also be capturing one aspect of liquidity (e.g., trading activity, price impact or
transaction cost). Putting all of them together in the analysis may make it difficult to understand
the overall effect of liquidity. In addition, some of the liquidity proxies may be highly correlated,
which will reduce the power of the test, due to multicollinearity, and hence underestimate the
significance of the liquidity effect. For example, the correlation between the Number of Trades and
the Amount Traded was as high as 0.759. As a result, we compute the first principal component of
all the liquidity proxies and use it as our main liquidity proxy.
All the variables are winsorized at the 99% confidence interval. The cross-sectional summary
11
statistics are first calculated for each week, and then the time series average of each statistic
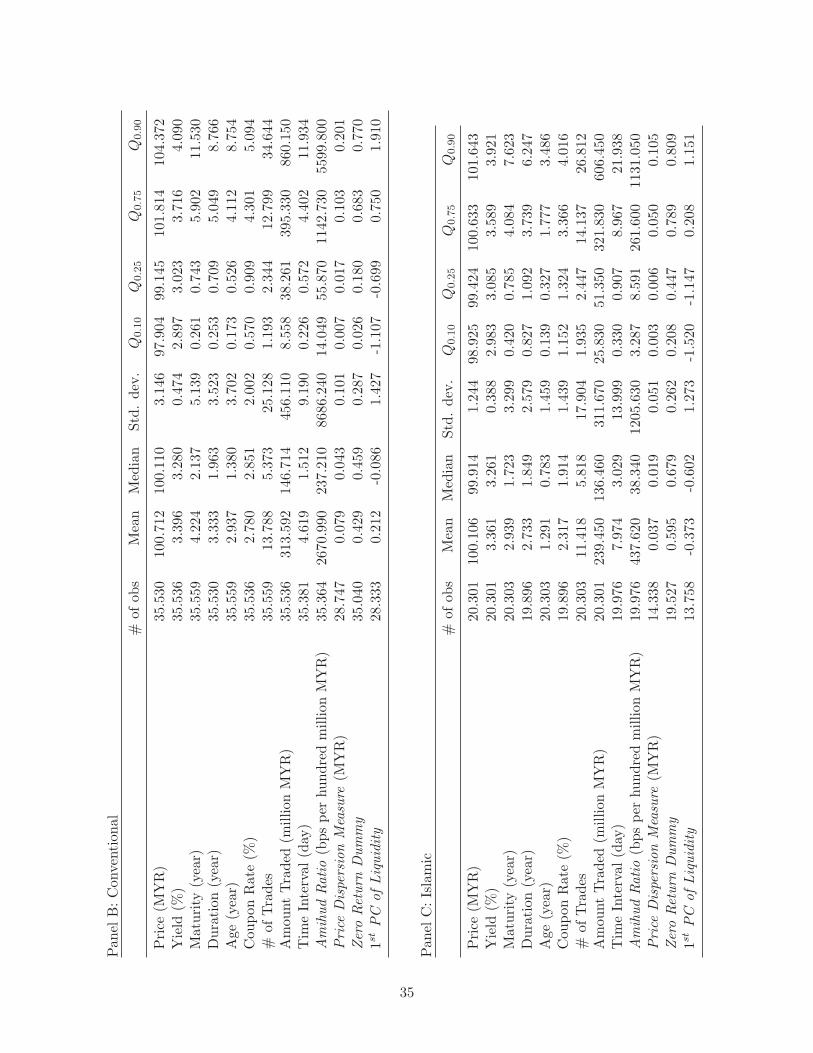
is reported. Summary statistics for the combined sample, conventional bonds only, and Islamic
bonds (Sukuk) only are reported in Panels A, B, and C in Table 1, respectively.
The results show that, on average, 55 bonds were traded every week: 35 conventional sovereign
bonds and 20 government-issued Sukuk. The average yield of all the traded bonds was 3.375%.
Conventional bonds had a higher yield of 3.396%, while Sukuk had a yield of 3.361%, yielding an
average spread of 3.5 bps. With respect to bond characteristics, Sukuk appeared to have a lower
maturity (2.939 years vs. 4.224 years), shorter age (1.291 years vs. 2.937 years) and lower coupon
rate (2.317% vs. 2.780%).
The weekly average Number of Trades for each bond is 12.452, which corresponded to a total
amount of MYR284.120 million, or about USD71.03 million. The average Time Interval between
two trades for the same bond is 5.911 days. As for the Amihud Ratio, the mean is 1912.210 bps
per MYR100 million, or equivalently 76.488 bps per USD1 million. This implies that trading
USD1 million in a particular Malaysian sovereign bond could shift its price by 76.488 bps. By
way of comparison, Friewald et al. (2012) reported that for the U.S. corporate bond market, the
weekly average Number of Trades and total Traded Amount for each bond was USD17.35 million (=
USD3.47M×5 days) and USD6.75 million(= USD1.35M×5 days), respectively. The average Time
Interval and Amihud Ratio are 4.46 days and 78.38 bps per USD1 million, respectively. Overall,
the evidence suggests that the liquidity of the Malaysian sovereign bond market is comparable to
that of the U.S. corporate bond market.
If we focus on the liquidity difference between conventional and Sukuk, we can see that the Sukuk
has a lower Number of Trades, lower Traded Amount, higher Time Interval, higher possibility of an
unchanged price, but lower Amihud Ratio, and lower Price Dispersion. Although the first principal
component analysis of liquidity seems to imply that conventional bonds has slightly better liquidity
overall, the mixed results indicate that no firm conclusion can be easily drawn as to whether
conventional bonds were more liquid than Sukuk.
Finally, the summary statistics in Table 1 also show that the conventional and Islamic sovereign
bonds in our sample are fairly similar, except for the Shariah compliance requirements of the
latter. Thus, it is reasonable to analyze and study the yield difference between these two subsets of
12
bonds. Table 2 presents the correlation matrix of the main variables. To construct the matrix, we
first compute the cross-sectional pairwise correlations for each week, and then take the time series
average of the correlation coefficients. As the primary determinants of yield, maturity and duration
have fairly high correlation coefficients with yield (0.917 and 0.943, respectively). In general, the
two trading activity measures, Number of Trades and Amount Traded, are negatively correlated
with illiquidity measures such as Time Interval, Amihud Ratio, and Zero Return Dummy. The
only exception is the Price Dispersion measure, which has an unexpected positive correlation with
the trading activity measures but is negatively correlated with the Time Interval and Zero Return
Dummy. The correlations are quite low for certain pairs of the liquidity proxies. For example, the
correlation coefficient between the Zero Return Dummy and Amihud Ratio is only 0.069, while Time
Interval has a correlation coefficient of -0.252 with Number of Trades. This evidence is consistent
with the findings in Friewald et al. (2012) that liquidity proxies have substantial idiosyncratic
movements and thus may capture somewhat different aspects of liquidity. As a result, we use
the first principal component of the various liquidity proxies as our main liquidity measure. The
correlation coefficient between the first principal component and trading activity variables is around
0.8, which implies the first principal component is mainly capturing and driven by the Number of
Trades and the Amount Traded.
[Insert Table 2 about here]
4. Empirical Results
4.1. Actual (data-based Yields by Maturities)
In the first step, we compare the actual (data-based) yields between the Malaysian government-
issued Sukuk and their conventional counterparts simply by grouping the observations into 17
different maturity groups for each week.6 Table 3 reports the descriptive statistics for these bond
yields by different maturity groups. Since the government-issued Sukuk in our sample have matu-
rities shorter than 10 years, we only compare the yields within each maturity group, which range
6We pick 17 commonly-used maturities (in months): 3, 6, 9, 12, 15, 18, 21, 24, 30, 36, 48, 60, 72, 84, 96, 108, and120.
13
between 3 and 120 months. The cross-sectional descriptive statistics are averaged over the 675
weeks. In the case of Sukuk, the average yield goes from 2.938% to 4.026% as the maturity in-
creases. Sukuk have a higher average yield than conventional bonds for almost all the maturity
groups. This suggests that the yield difference between these two types of bonds is uniformly
widespread, and not specific to any particular maturity group.
[Insert Table 3 about here]
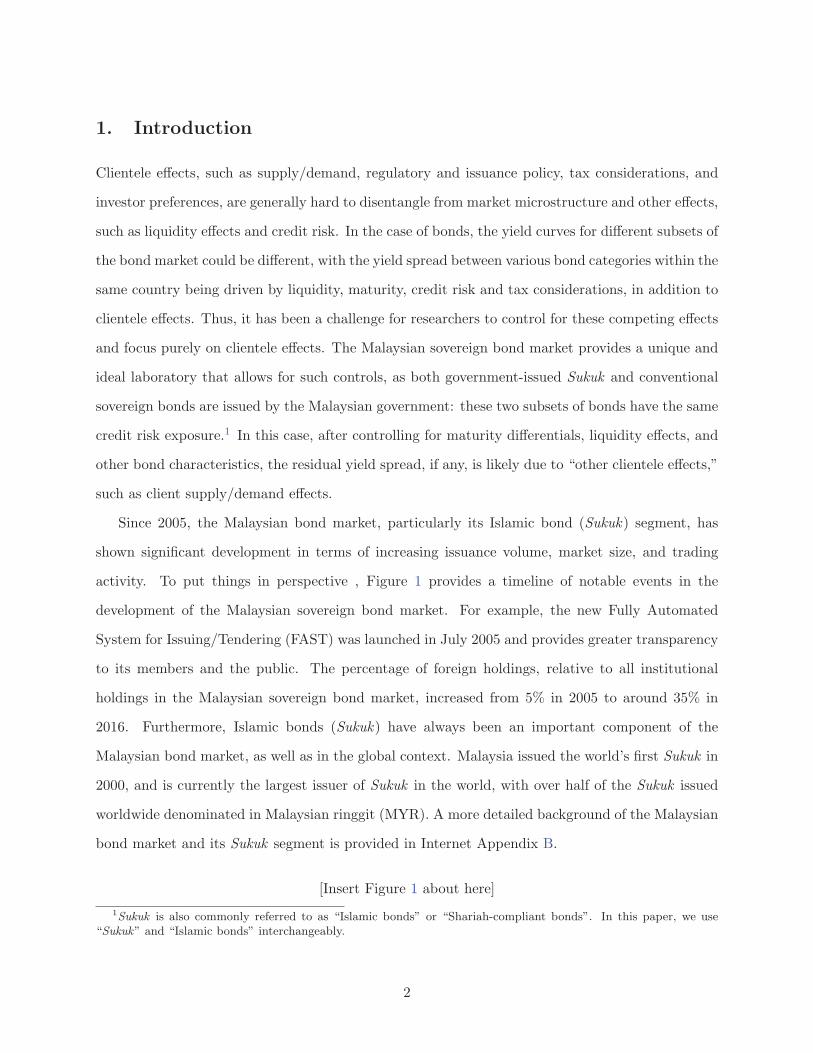
Figure 2 shows the time trend of actual (data-based) yield levels at different maturities for
both subsets of bonds. In general, their yields co-move during the sample period. The 2007-2008
Global Financial Crisis (GFC) impacts the Malaysian sovereign bond market from 2008:Q1 to
2010:Q2. The average yield fell by around 1.75% during a 9-month period, from about 4.25% in
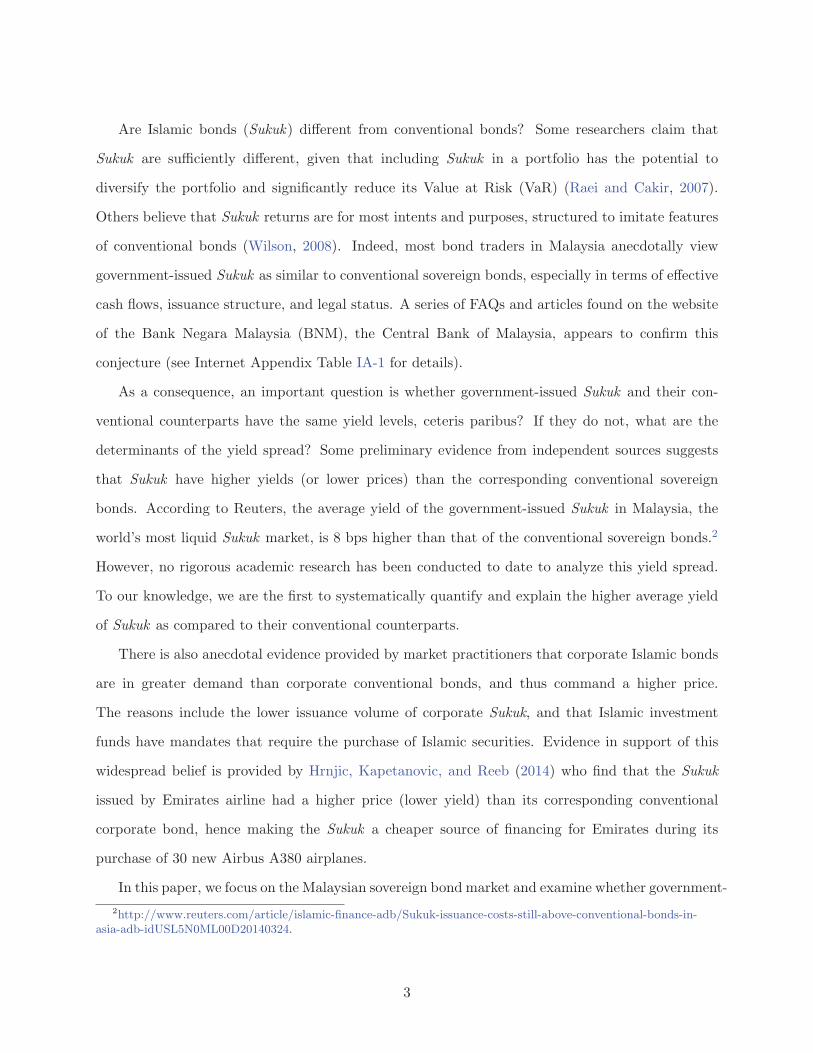
June 2008 to about 2.5% in March 2009. Figure 3 shows the time trend of actual (data-based) yield
spreads at different maturities. In general, there is a positive yield spread between the two subsets
of bonds. That is, government-issued Sukuk have, on average, higher yields than conventional
sovereign bonds.
[Insert Figures 2 and 3 about here]
4.2. Fama-MacBeth Cross-sectional Regressions
We next investigate whether there is a significant yield spread between the two bond subsets,
holding other factors equal. To overcome the problem of heteroscedasticity and serial correlation,
we use the Fama-MacBeth regression with a Newey-West correction as our main method. In the
following model, yield is regressed on an Islamic Dummy, various bond characteristics, and the first
principle component of liquidity proxies:
Y ieldi,t = α0 + α1 × Islamic Dummyi,t + α2 ×Maturityi,t
+ α3 ×Maturity2i,t + α4 × Coupon Ratei,t
+ α5 ×Agei,t + α6 × 1st PC of Liquidityi,t
. (6)
The key variable we are interested in, the Islamic Dummy, takes the value of one if it is a
14
government-issued Sukuk, and zero otherwise. Regression results using the combined sample, and
results separating the database into conventional and Islamic (Sukuk) samples (with the Islamic
Dummy omitted in the latter case) are reported in Panels A, B, and C of Table 4. On average,
Sukuk traded at a yield 4.8 bps higher than conventional bonds, ceteris paribus. In other words,
government-issued Sukuk were cheaper than their conventional counterparts. An increase in matu-
rity from one year to two years would lead to a 0.153 % (= 0.168×2−0.005×4−0.168×1+0.005×1)
rise in yield. The coupon rate has a positive effect on yield, which is consistent with the expectation
that bonds with a larger coupon tend to be less liquid and thus less expensive. This significant
positive effect remains after controlling for liquidity. A typical bond with a 3% coupon paid semi-
annually would have a yield 2.4 bps higher than a zero-coupon discount bond, other factors held
constant. Although we expect recently issued bonds (i.e., those with a lower age) to be on-the-run
and hence more liquid, the empirical results suggest that age, after controlling for liquidity and
other bond characteristics, did not have any additional or significant impact on yield. Bonds with
higher liquidity appeared to have lower yields. A one standard deviation increase in liquidity would
decrease the yield by 1.027 bps (−0.007× 1.467), all else held constant. The evidence implies that
the illiquidity premium in the Malaysian sovereign bond market is relatively low.
[Insert Table 4 about here]
To better understand the Islamic (Sukuk) premium among different bond instrument types, we
add three instrument type dummies in the Fama-MacBeth regression, one for Sukuk (Is BNMN ID)
and two for conventional bonds (Is BNMN DB and Is MGS ). Is BNMN ID is defined as one if
the bond traded belongs to Bank Negara Monetary Notes-Islamic Discount Based (BNMN-IDB
and BNMN-IDM), and zero otherwise. Other instrument type dummies are defined similarly.
The remaining two instrument types, GII and BNB are used as the base group for Sukuk and
conventional bonds respectively.
The regression results are reported in Table 5. After controlling for the instrument type fixed
effect, we find that the Islamic (Sukuk) premium increases from 4.8 bps to 9.8 bps, which is both
statistically and economically significant. Moreover, we do not observe a significant difference
between the two Islamic bond groups (BNMN-ID and GII), while within the conventional bond
15
category, BNMN-DB and MGS traded at a yield 2.9 and 7 bps higher than BNB, respectively. This
result seems to indicate that investors prefer short-term Malaysian sovereign bonds for reasons other
than the credit, interest rate and liquidity differences.
[Insert Table 5 about here]
4.3. Nelsen-Siegel Three-Factor Model
In order to better capture the nonlinear relation between bond yields and maturities, we fit our
data with a Nelsen-Siegel three-factor model. Following Diebold and Li (2006), we fit the weekly
yield curves of the Islamic (Sukuk) and conventional sovereign bonds separately, using the following
three-factor model:
yt(τ) = β1t + β2tX2t + β3tX3t;X2t =1− e−λtτ
λtτ,X3t =
1− e−λtτ
λtτ− e−λtτ , (7)
where the three factors are β1t, β2t, and β3t, the corresponding factor loadings are a constant 1,
X2t, and X3t, and τ denotes the maturity. λt is the decaying factor and we fix λt = 0.0609.
Diebold and Li (2006) interprets β1t, β2t, and β3t as three latent dynamic factors. β1t can be
viewed as a long-term factor (i.e., the level of the yield curve) because it has a loading of 1, a
constant that does not decay to zero in the limit. β2t can be viewed as a short-term factor (i.e.,
the slope of the yield curve) because the associated factor loading, X2t =1−e−λtτ
λtτstarts at 1 but
decays quickly to zero. β3t can be viewed as a medium-term factor (i.e., the curvature of the yield
curve) because the loading X3t =1−e−λtτ
λtτ− e−λtτ starts at 0, increases (and thus is medium-term)
and then decays to zero.
For each week t, we regress the yield yt(τ) on three factor loadings (a constant 1, X2t, and
X3t) cross-sectionally, giving us a time series of the three estimated factors. Table 6 reports the
time series mean of the three estimated factors. The yield curve is jointly determined by the values
of the three factors.7 The results show that, government-issued Sukuk have higher values for all
the three estimated factors. For example, the long-term component (level) of the yield curve for
government-issued Sukuk is 4.405% while that for conventional sovereign bonds is 4.373%.
7The three factors are a constant 1 , X2t, and X3t.
16
[Insert Table 6 about here]
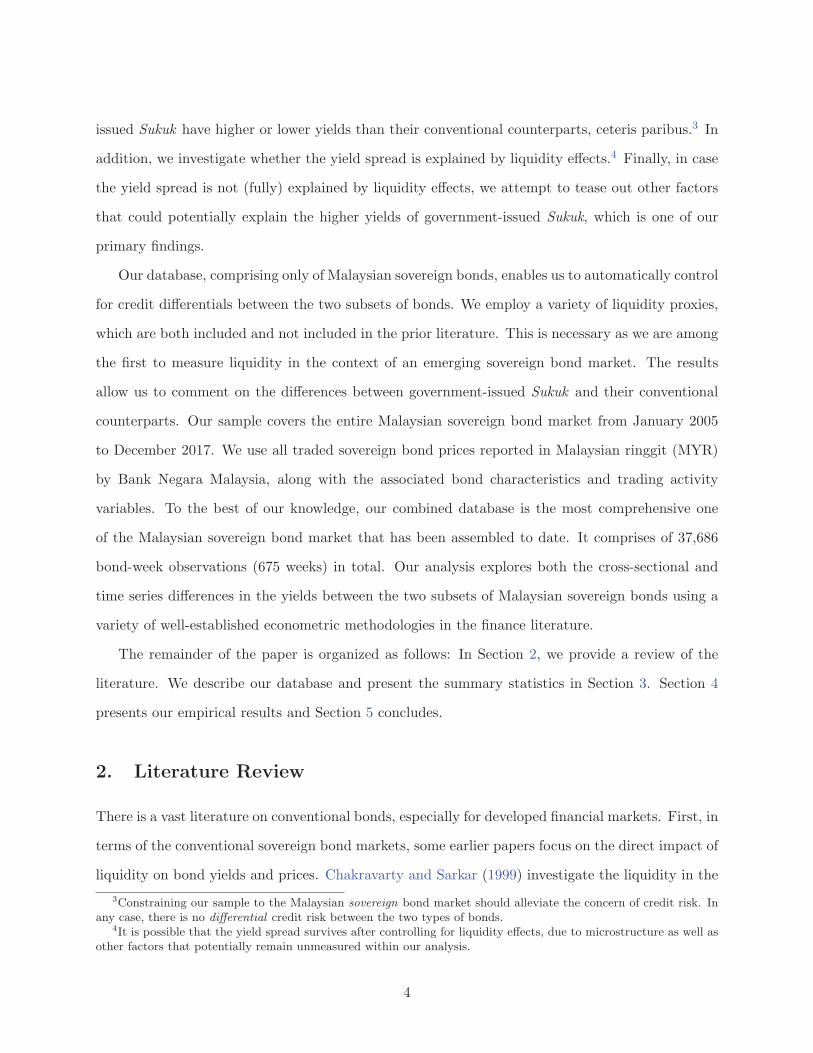
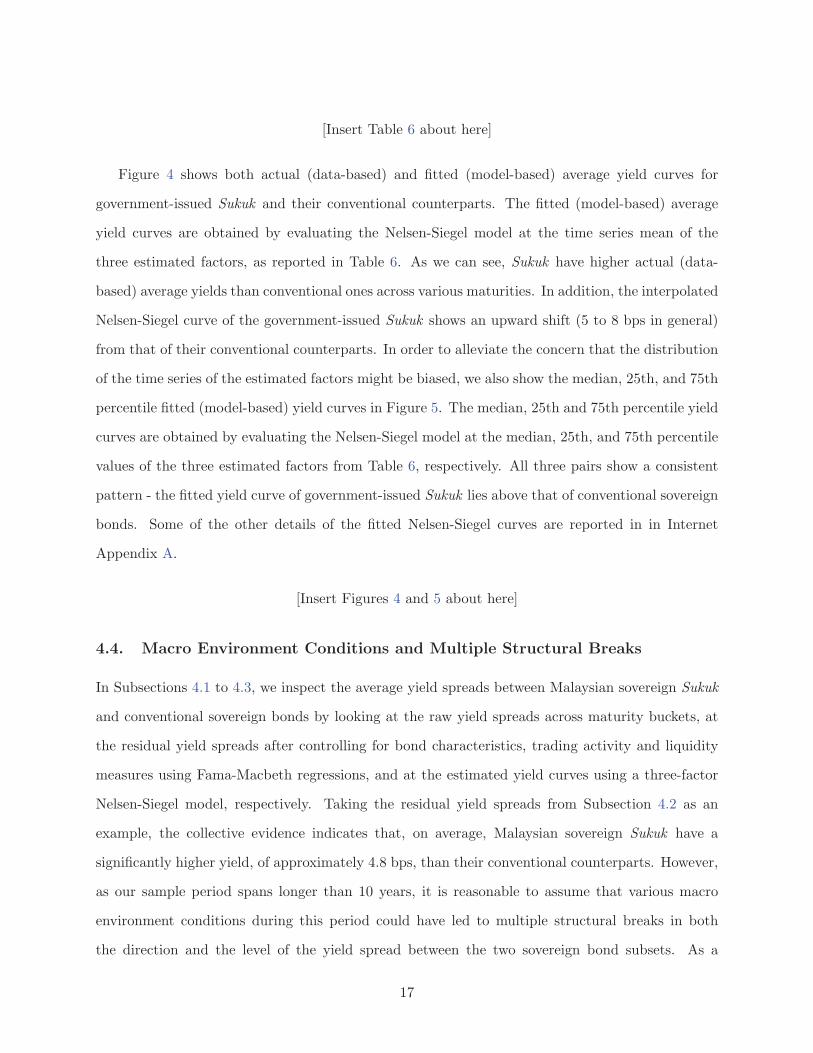
Figure 4 shows both actual (data-based) and fitted (model-based) average yield curves for
government-issued Sukuk and their conventional counterparts. The fitted (model-based) average
yield curves are obtained by evaluating the Nelsen-Siegel model at the time series mean of the
three estimated factors, as reported in Table 6. As we can see, Sukuk have higher actual (data-
based) average yields than conventional ones across various maturities. In addition, the interpolated
Nelsen-Siegel curve of the government-issued Sukuk shows an upward shift (5 to 8 bps in general)
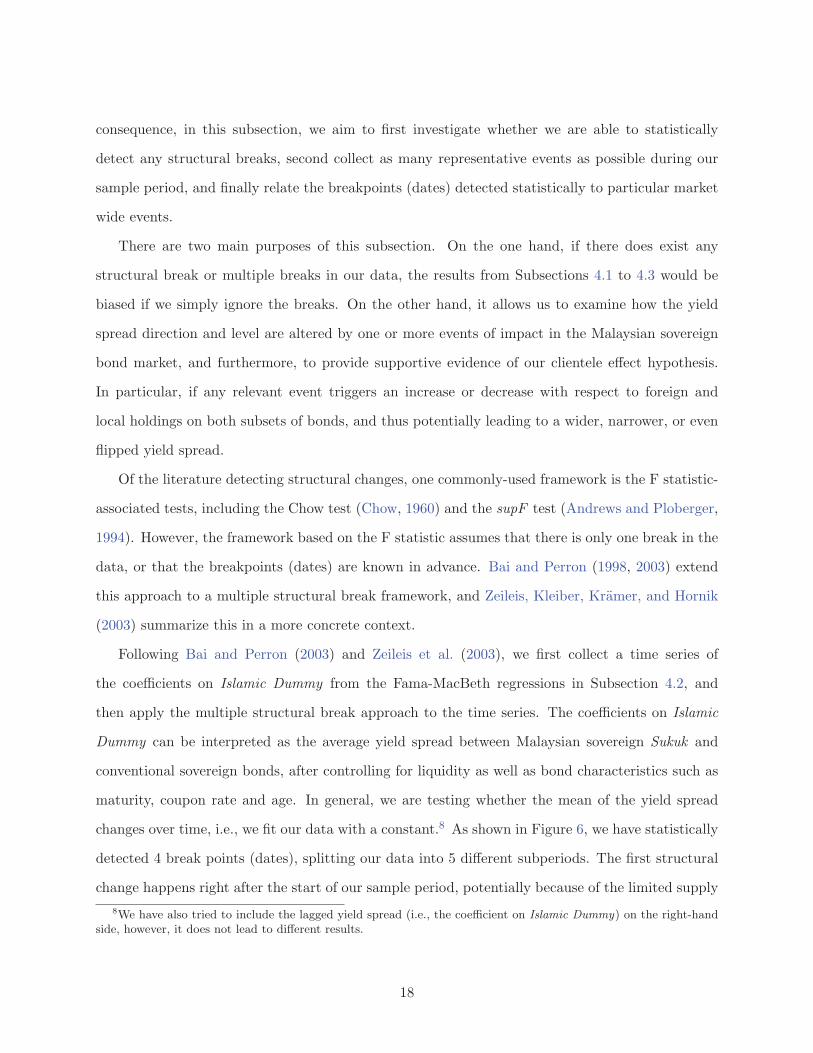
from that of their conventional counterparts. In order to alleviate the concern that the distribution
of the time series of the estimated factors might be biased, we also show the median, 25th, and 75th
percentile fitted (model-based) yield curves in Figure 5. The median, 25th and 75th percentile yield
curves are obtained by evaluating the Nelsen-Siegel model at the median, 25th, and 75th percentile
values of the three estimated factors from Table 6, respectively. All three pairs show a consistent
pattern - the fitted yield curve of government-issued Sukuk lies above that of conventional sovereign
bonds. Some of the other details of the fitted Nelsen-Siegel curves are reported in in Internet
Appendix A.
[Insert Figures 4 and 5 about here]
4.4. Macro Environment Conditions and Multiple Structural Breaks
In Subsections 4.1 to 4.3, we inspect the average yield spreads between Malaysian sovereign Sukuk
and conventional sovereign bonds by looking at the raw yield spreads across maturity buckets, at
the residual yield spreads after controlling for bond characteristics, trading activity and liquidity
measures using Fama-Macbeth regressions, and at the estimated yield curves using a three-factor
Nelsen-Siegel model, respectively. Taking the residual yield spreads from Subsection 4.2 as an
example, the collective evidence indicates that, on average, Malaysian sovereign Sukuk have a
significantly higher yield, of approximately 4.8 bps, than their conventional counterparts. However,
as our sample period spans longer than 10 years, it is reasonable to assume that various macro
environment conditions during this period could have led to multiple structural breaks in both
the direction and the level of the yield spread between the two sovereign bond subsets. As a
17
consequence, in this subsection, we aim to first investigate whether we are able to statistically
detect any structural breaks, second collect as many representative events as possible during our
sample period, and finally relate the breakpoints (dates) detected statistically to particular market
wide events.
There are two main purposes of this subsection. On the one hand, if there does exist any
structural break or multiple breaks in our data, the results from Subsections 4.1 to 4.3 would be
biased if we simply ignore the breaks. On the other hand, it allows us to examine how the yield
spread direction and level are altered by one or more events of impact in the Malaysian sovereign
bond market, and furthermore, to provide supportive evidence of our clientele effect hypothesis.
In particular, if any relevant event triggers an increase or decrease with respect to foreign and
local holdings on both subsets of bonds, and thus potentially leading to a wider, narrower, or even
flipped yield spread.
Of the literature detecting structural changes, one commonly-used framework is the F statistic-
associated tests, including the Chow test (Chow, 1960) and the supF test (Andrews and Ploberger,
1994). However, the framework based on the F statistic assumes that there is only one break in the
data, or that the breakpoints (dates) are known in advance. Bai and Perron (1998, 2003) extend
this approach to a multiple structural break framework, and Zeileis, Kleiber, Kramer, and Hornik
(2003) summarize this in a more concrete context.
Following Bai and Perron (2003) and Zeileis et al. (2003), we first collect a time series of
the coefficients on Islamic Dummy from the Fama-MacBeth regressions in Subsection 4.2, and
then apply the multiple structural break approach to the time series. The coefficients on Islamic
Dummy can be interpreted as the average yield spread between Malaysian sovereign Sukuk and
conventional sovereign bonds, after controlling for liquidity as well as bond characteristics such as
maturity, coupon rate and age. In general, we are testing whether the mean of the yield spread
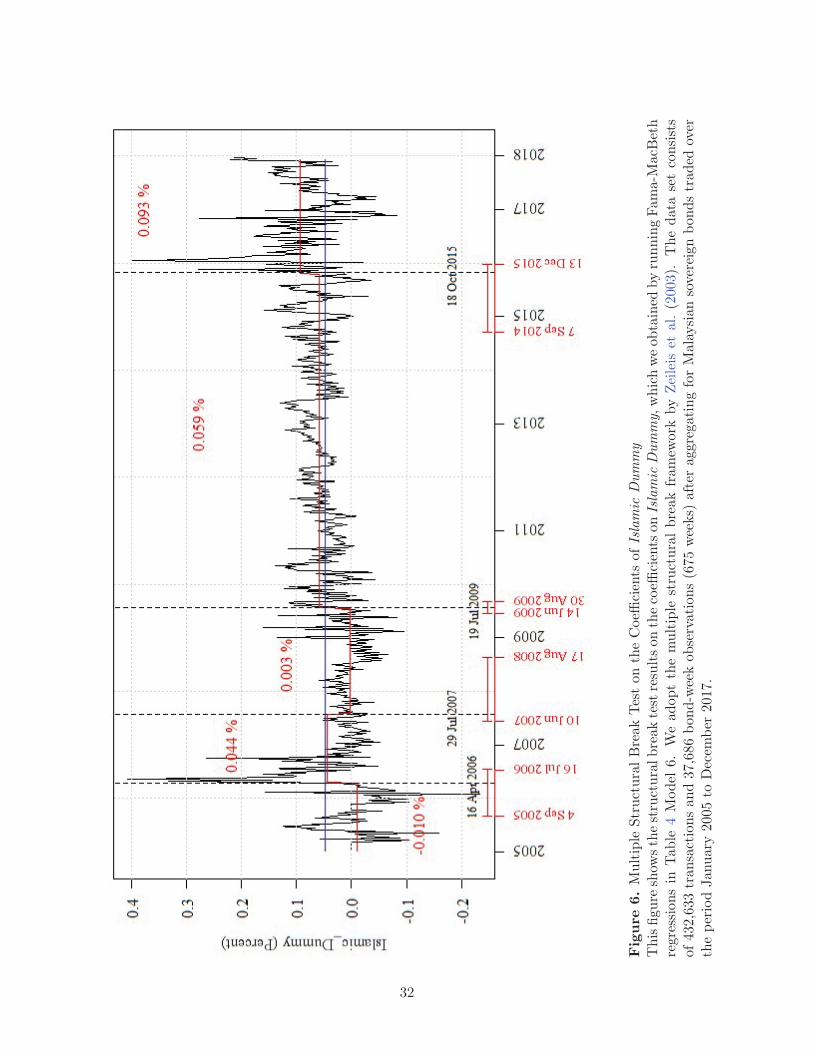
changes over time, i.e., we fit our data with a constant.8 As shown in Figure 6, we have statistically
detected 4 break points (dates), splitting our data into 5 different subperiods. The first structural
change happens right after the start of our sample period, potentially because of the limited supply
8We have also tried to include the lagged yield spread (i.e., the coefficient on Islamic Dummy) on the right-handside, however, it does not lead to different results.
18
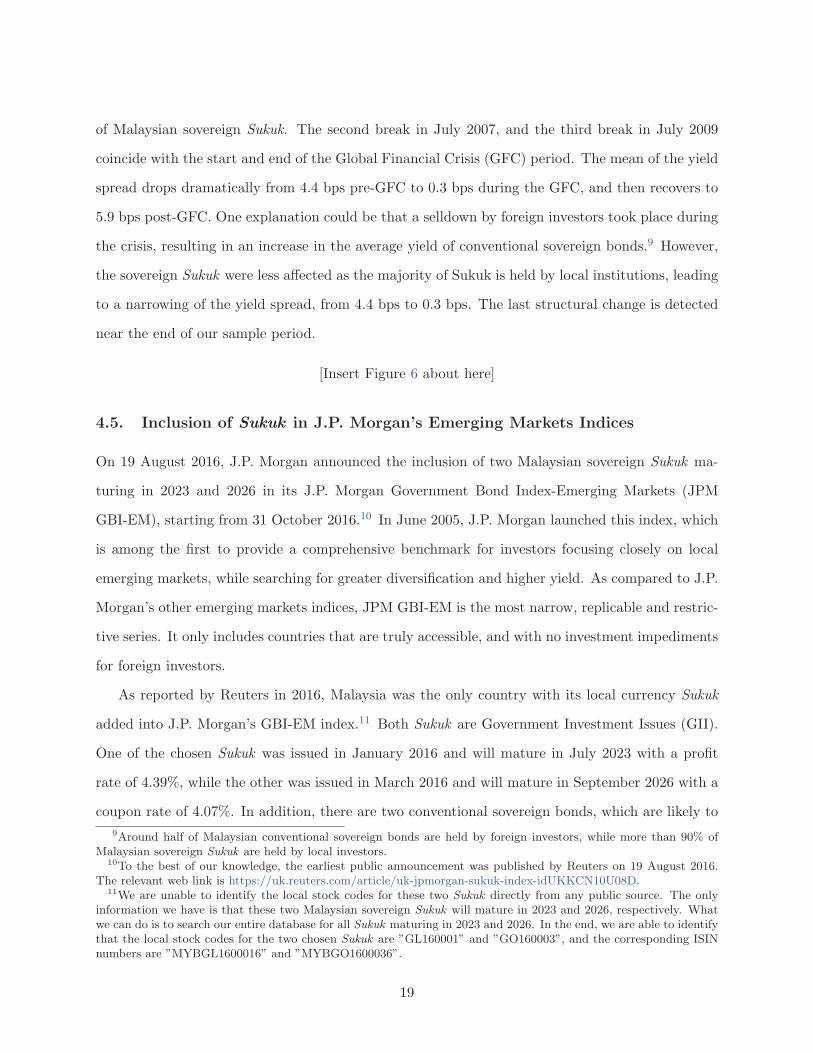
of Malaysian sovereign Sukuk. The second break in July 2007, and the third break in July 2009
coincide with the start and end of the Global Financial Crisis (GFC) period. The mean of the yield
spread drops dramatically from 4.4 bps pre-GFC to 0.3 bps during the GFC, and then recovers to
5.9 bps post-GFC. One explanation could be that a selldown by foreign investors took place during
the crisis, resulting in an increase in the average yield of conventional sovereign bonds.9 However,
the sovereign Sukuk were less affected as the majority of Sukuk is held by local institutions, leading
to a narrowing of the yield spread, from 4.4 bps to 0.3 bps. The last structural change is detected
near the end of our sample period.
[Insert Figure 6 about here]
4.5. Inclusion of Sukuk in J.P. Morgan’s Emerging Markets Indices
On 19 August 2016, J.P. Morgan announced the inclusion of two Malaysian sovereign Sukuk ma-
turing in 2023 and 2026 in its J.P. Morgan Government Bond Index-Emerging Markets (JPM
GBI-EM), starting from 31 October 2016.10 In June 2005, J.P. Morgan launched this index, which
is among the first to provide a comprehensive benchmark for investors focusing closely on local
emerging markets, while searching for greater diversification and higher yield. As compared to J.P.
Morgan’s other emerging markets indices, JPM GBI-EM is the most narrow, replicable and restric-
tive series. It only includes countries that are truly accessible, and with no investment impediments
for foreign investors.
As reported by Reuters in 2016, Malaysia was the only country with its local currency Sukuk
added into J.P. Morgan’s GBI-EM index.11 Both Sukuk are Government Investment Issues (GII).
One of the chosen Sukuk was issued in January 2016 and will mature in July 2023 with a profit
rate of 4.39%, while the other was issued in March 2016 and will mature in September 2026 with a
coupon rate of 4.07%. In addition, there are two conventional sovereign bonds, which are likely to
9Around half of Malaysian conventional sovereign bonds are held by foreign investors, while more than 90% ofMalaysian sovereign Sukuk are held by local investors.
10To the best of our knowledge, the earliest public announcement was published by Reuters on 19 August 2016.The relevant web link is https://uk.reuters.com/article/uk-jpmorgan-sukuk-index-idUKKCN10U08D.
11We are unable to identify the local stock codes for these two Sukuk directly from any public source. The onlyinformation we have is that these two Malaysian sovereign Sukuk will mature in 2023 and 2026, respectively. Whatwe can do is to search our entire database for all Sukuk maturing in 2023 and 2026. In the end, we are able to identifythat the local stock codes for the two chosen Sukuk are ”GL160001” and ”GO160003”, and the corresponding ISINnumbers are ”MYBGL1600016” and ”MYBGO1600036”.
19
be issued for the same purposes as the two chosen Sukuk.12 One of the two conventional sovereign
bonds was issued in February 2016 with a coupon rate of 3.80%, while the other was issued in May
2016 with a coupon rate of 3.90%. Both of the conventional bonds have earlier issue dates, same
term to maturity, and lower coupon rates than the two Sukuk included in J.P. Morgan’s GBI-EM
index. In this section, we investigate whether the two chosen Sukuk behave differently from the
remaining ones after 19 August 2016, which is when J.P. Morgan announced its addition of the two
Sukuk into its GBI-EM index.
There is a stream of literature studying the effects of stocks being included in global indices.
Lynch and Mendenhall (1997) investigate stock price and volume changes after being added to or
deleted from the S&P 500 during the sample period of March 1990 to April 1995. Their results
show that there exists a significant positive (cumulative) abnormal return during the announcement
day, and during the following period from the day after the announcement until the day before the
effective change. Furthermore, the stock price experiences a significant decrease after the addition
itself. In a most recent paper by Bena, Ferreira, Matos, and Pires (2017), the authors study the
long-term effects of foreign holdings on a sample of publicly-listed firms in 30 countries from 2001 to
2010. Using the addition (deletion) of a firm’s stock to (from) the MSCI All Country World Index
(MSCI ACWI) as an instrument, the paper finds that foreign institutional ownership benefits the
firm in the long run. However, to the best of our knowledge, there are few papers in the literature
focussing on the effect of bonds being included in global indices, especially in the context of the
sovereign bond market.
In the following subsection, we adopt two alternative methodologies to investigate the effect of
the two Malaysian sovereign Sukuk being included in the JPM GBI-EM index. In Subsection 4.5.1,
we conduct separate tests on the average yields of the two Sukuk within pre- and post- announce-
ment windows, respectively. And in Subsection 4.5.2, which serves as a robustness check, we apply
the “classical” event study method in the context of bonds, by using the cumulative mean abnormal
return (CAR) around the announcement.
12The local stock codes of the two conventional sovereign bonds are ”ML160001” and ”MO160003”, and thecorresponding ISIN numbers are ”MYBML1600014” and ”MYBMO1600034”.
20
4.5.1. Average yield spread pre- and post- the announcement
One way to study whether the two chosen Sukuk behave differently after their inclusion in the
JPM GBI-EM index is to test whether the average yield difference between the two Sukuk and the
remaining Sukuk changes dramatically after the announcement. In order to obtain a proper and
coherent measure of the yield spread, we modify the Fama-MacBeth regression model in Section 4
Subsection 4.2 by adding another dummy variable - JPM Dummy. We define the JPM Dummy
as 1 if the bond traded is one of the chosen Sukuk, and as 0 if it belongs to the remaining group
of Sukuk. Similar to the first step in the Fama-MacBeth methodology, we first run the following
cross-sectional regressions every week from 24 March 2016 to 31 December 2017, and then collect
the time series of each of the eight coefficients, including the intercept (i.e., αj for j = 0, 1, ..., 7).13
Y ieldi,t = α0 + α1 × Islamic Dummyi,t + α2 × JPM Dummyi,t + α3 ×Maturityi,t
+ α4 ×Maturity2i,t + α5 × Coupon Ratei,t
+ α6 ×Agei,t + α7 × 1st PC of Liquidityi,t
. (8)
In the second step, instead of computing the mean of each coefficient (i.e., αj for j = 0, 1, ..., 7)
using the entire time series, we first split the time series into pre- and post- announcement pe-
riods, and then do separate tests on the two time-series means. The variable of interest here is
JPM Dummy, which measures the average yield difference between the two chosen Sukuk and the
remaining Sukuk after controlling for maturity, coupon rate, age and liquidity. The corresponding
results are shown in Table 7. The first column reports the time-series mean of each coefficient
through the full subsample window.14 The second column presents the results of Fama-MacBeth
coefficients within the 5-week pre-event window, while the third column shows the results within
the 5-week post-event window. Similarly, the fifth (seventh) and sixth (eighth) columns report the
results with a longer estimation window - 10 (15) weeks pre- and post- announcement.15 As we can
13One of the chosen Sukuk was issued on 7 January 2016, while the other was issued on 24 March 2016. We onlykeep weeks when both of the chosen Sukuk are available in the market.
14The full subsample window in this section is from 24 March 2016 to 31 December 2017.15Our data are weekly, and we define every Thursday (every next Wednesday) as the start (end) of each week.
The announcement date is on Friday, 19 August 2016, and the event window is defined as the week around theannouncement from Thursday, 18 August to Wednesday, 24 August 2016. The 5-week pre-event window is from
21
see from the first column in Table 7, the Malaysian sovereign Sukuk have a higher yield of 8.2 bps
than their conventional counterparts, and there are no significant yield difference between the two
chosen Sukuk and the remaining Sukuk during the full subsample window from 24 March 2016 to
31 December 2016. In addition, the coefficients of JPM Dummy are insignificantly different from
zero within two out of the three pre-event windows. That is, before J.P. Morgan’s announcement
to add the two Sukuk into the GBI-EM index, there are no significant yield difference between the
chosen Sukuk and the remaining ones. However, within all three post-event windows, the two cho-
sen Malaysian sovereign Sukuk, as compared to other Sukuk, experience a significantly lower yield,
of around 7.6-10.2 bps on average at a significance level of 1%. The results are consistent with our
hypothesis that the yield spread between the two Malaysian Sukuk and their conventional coun-
terparts would be narrower as compared to the remaining Sukuk, potentially due to a significant
increase in foreign holdings on the two chosen Sukuk.
[Insert Table 7 about here]
4.5.2. Cumulative abnormal return (CAR) around the announcement
In this section, we adopt an alternative method to test whether the two Sukuk behave differently
from other Sukuk after the announcement date by using the cumulative abnormal return (CAR)
analysis. In order to take a closer look at the immediate responses of the two Sukuk around the
announcement, we examine the CARs within a shorter window (i.e., within one week) using daily
data. The CAR is calculated by taking the differences between the realized return and the predicted
return from a market model. Market model parameters are estimated over a period of 1 year
prior to the event window. We choose the S&P Malaysian Sovereign Bond Index as our market
model benchmark. Furthermore, we divide our bonds into three different groups: conventional
sovereign bonds, the two chosen Sukuk by J.P. Morgan, and the remaining Sukuk excluding those
two Sukuk. We are able to detect a substantially significant positive CAR of 0.547 bps for the two
chosen Sukuk universe during the event window of 1 day before and 1 day after the announcement.
Thursday, 14 July to Wednesday, 17 August 2016, excluding the announcement week. The 5-week post-event windowis from Thursday, 18 August to Wednesday, 21 September 2016, including the announcement week. Similarly, the10-week (15-week) pre-event window is from Thursday, 9 June (5 May) to Wednesday, 17 August 2016, while the10-week (15-week) post-event window is from Thursday, 18 August to Wednesday, 26 October (30 November) 2016.
22

However, the CARs of both the remaining sovereign Sukuk and the conventional sovereign bonds
are indifferent from zero. The results are consistent with our hypothesis as well as those from
Subsection 4.5.1. That is, the prices of the two chosen Sukuk, as compared to the remaining Sukuk
and the conventional sovereign bonds, experience a significant increase after the announcement by
J.P. Morgan. In Subsection 4.5.3, we provide some supplementary evidence which could potentially
explain the positive (negative) price (yield) response of the two chosen Sukuk by J.P. Morgan.
4.5.3. Supplementary evidence: increase of foreign holdings
Do foreign holdings of the two chosen Sukuk really increase after the announcement? In this section,
we aim to provide some supportive evidence. The holdings data at the individual bond level in the
available databases are only disclosed quarterly. Due to the frequency mismatch, we are not able
to conduct any formal analysis of the holdings. Instead, we first hand-collect the quarterly holdings
data on the two chosen Sukuk from Bloomberg, and then plot the time trend of holdings by both
foreigners and local investors. As the announcement is on 19 August 2016, which falls right in the
middle of the third quarter, we are interested to see if foreign holdings on both Sukuk increase
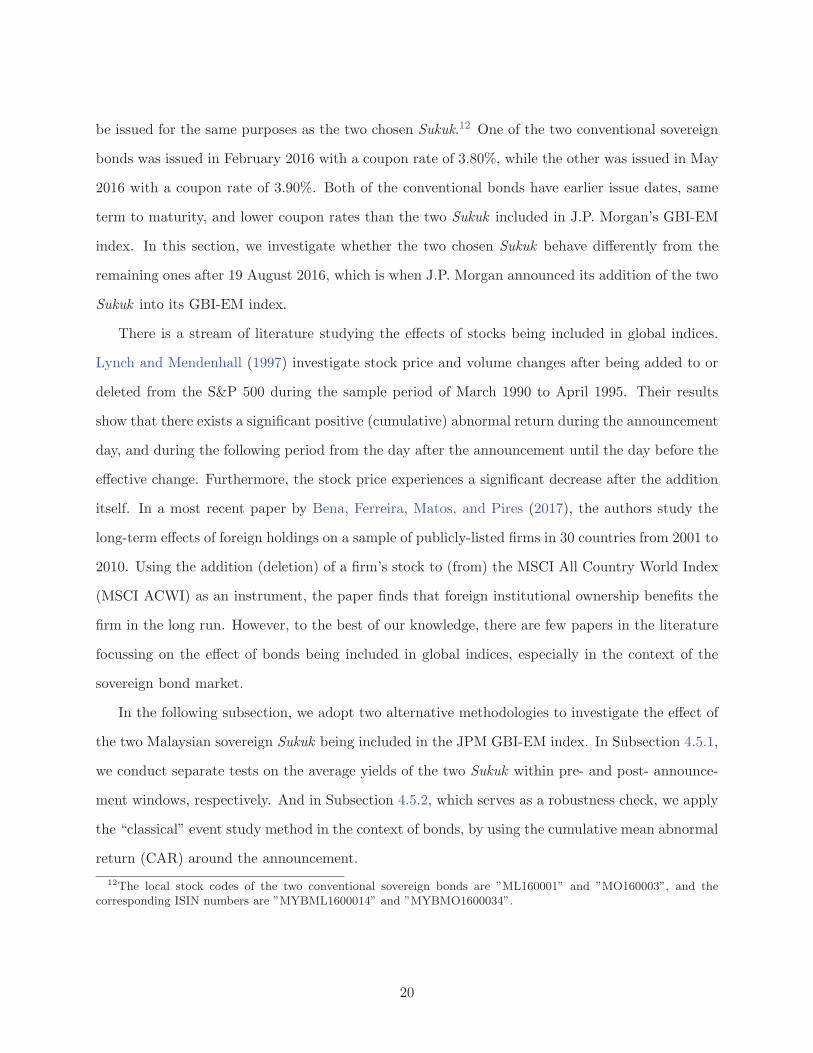
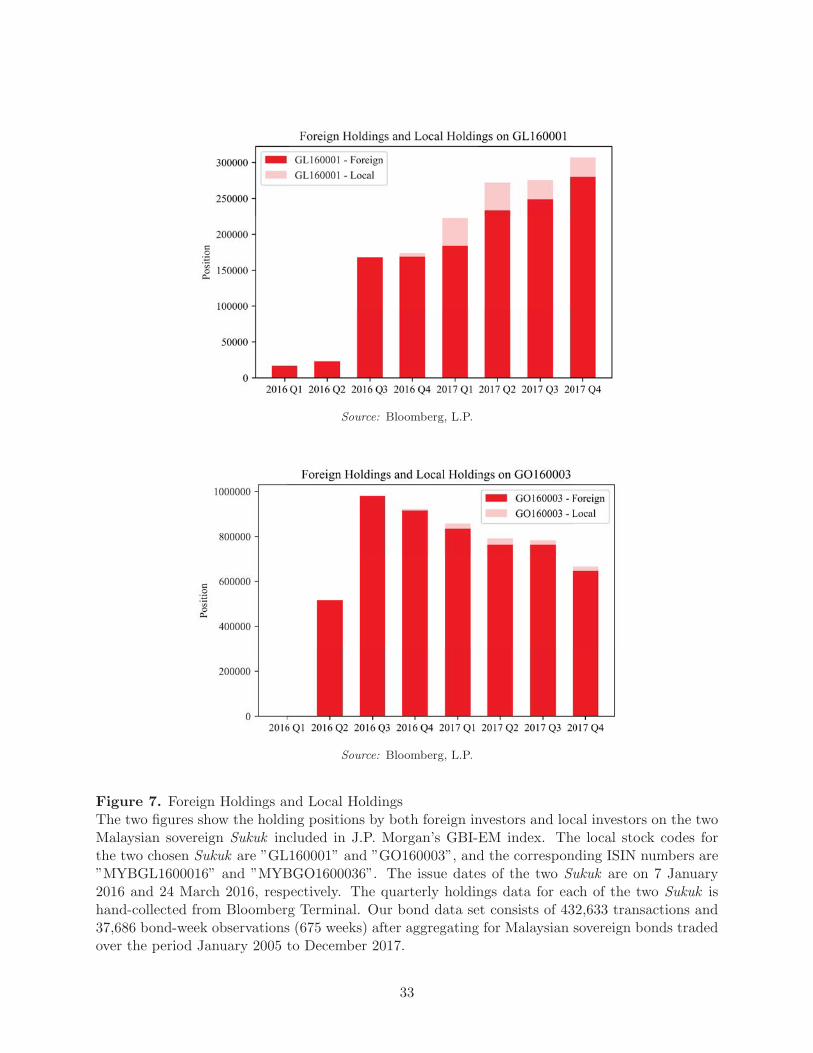
dramatically from the second quarter to third quarter of 2016. As shown in Figure 7, the holdings
position by foreigners on one Sukuk “GL160001” increases to 168,644 units in the third quarter of
2016, which is over 7 times the foreign holdings of 23,200 units in the second quarter, while that
on the other Sukuk “GO160003” increases to 979,880 units, about 2 times the foreign holdings of
515,518 units in the previous quarter. The results are supportive of our hypothesis that foreign
holdings on the two Malaysian Sukuk increase after their inclusion in the global bond index, which
would, in turn, reduce the clientele effect differentials, and thus narrow the yield spread between
the two Sukuk and their conventional counterparts.
[Insert Figure 7 about here]
5. Conclusion
In this paper, we use a unique transaction-level database that contains both government-issued
Sukuk and conventional sovereign bonds in the Malaysian bond market and examine whether there
23
is a yield spread between the two. We are among the first to investigate the pricing of Islamic
(Sukuk) versus conventional bonds by using a comprehensive research-quality database and rigorous
academic methodologies. We find that, on average, Islamic sovereign bonds (government-issued
Sukuk) have a 4.8 to 9.8 bps higher yield than conventional sovereign bonds, ceteris paribus. In
this sense, Sukuk appear to be a “good deal” for investors.
In addition, we quantify and attempt to explain the higher yields of Sukuk as compared with
their conventional counterparts. The unique setting of the Malaysian sovereign bond market allows
us to study the yield difference between the two bond subsets without worrying about credit risk
differentials. We find that the yield spread between government-issued Sukuk and conventional
sovereign bonds cannot be fully explained by liquidity effects, as the yield spread survives after
controlling for liquidity differences. The evidence therefore suggests that the residual yield spread
of up to 9.8 bps has to be attributed to clientele effects.
However, we cannot come to a firm conclusion as to what kind of clientele effects lead to such
an economically-significant yield spread. It seems unlikely to be due to tax reasons, as we do not
find any significant difference in the tax treatment between the two bond subsets. One piece of
anecdotal evidence from industry practitioners is that foreign institutional investors participate
actively in the Malaysian conventional sovereign bond market, while the Islamic sovereign bond
market is still heavily dominated by domestic institutional investors, due to “familiarity” reasons.
This implies that the yield spread could be partially explained by demand/supply factors. In
any case, the clientele effect that potentially explains the yield difference between the two bond
subsets needs to be further explored and taken into consideration along with holdings information,
ownership structure, and other granular data regarding the key participants in the Malaysian
financial system.
This paper improves our understanding of how the Islamic bond market works, what affects
the pricing of Islamic bonds (Sukuk), and whether they are priced efficiently as compared to con-
ventional bonds. This is imperative since the Islamic bond market is a nascent and fast-growing
financial sector. Our analysis also has implications for industry practitioners, who are interested
in reducing their liquidity risks and transaction costs. Finally, we hope our study will inform
regulators in their efforts to develop a healthier and more efficient Islamic bond market.
24
References
Alam, N., M. K. Hassan, and M. A. Haque. 2013. Are Islamic bonds different from conventionalbonds? International evidence from capital market tests. Borsa Istanbul Review 13:22–29.
Amihud, Y. 2002. Illiquidity and stock returns: cross-section and time-series effects. Journal offinancial markets 5:31–56.
Andrews, D. W., and W. Ploberger. 1994. Optimal tests when a nuisance parameter is present onlyunder the alternative. Econometrica: Journal of the Econometric Society pp. 1383–1414.
Ariff, M., and M. Safari. 2012. Are Sukuk securities the same as conventional bonds?
Azmat, S., M. Skully, and K. Brown. 2017. The (little) difference that makes all the differencebetween Islamic and conventional bonds. Pacific-Basin Finance Journal 42:46–59.
Bai, J., and P. Perron. 1998. Estimating and testing linear models with multiple structural changes.Econometrica pp. 47–78.
Bai, J., and P. Perron. 2003. Computation and analysis of multiple structural change models.Journal of applied econometrics 18:1–22.
Bena, J., M. A. Ferreira, P. Matos, and P. Pires. 2017. Are foreign investors locusts? The long-termeffects of foreign institutional ownership. Journal of Financial Economics 126:122–146.
Bessembinder, H., W. Maxwell, and K. Venkataraman. 2006. Market transparency, liquidity ex-ternalities, and institutional trading costs in corporate bonds. Journal of Financial Economics82:251–288.
Chakravarty, S., and A. Sarkar. 1999. Liquidity in US fixed income markets: A comparison of thebid-ask spread in corporate, government and municipal bond markets.
Chen, L., D. A. Lesmond, and J. Wei. 2007. Corporate yield spreads and bond liquidity. TheJournal of Finance 62:119–149.
Cherian, J. A., E. Jacquier, and R. A. Jarrow. 2004. A Model of the Convenience Yields in On-the-run Treasuries. Review of Derivatives Research 7:79–97.
Chow, G. C. 1960. Tests of equality between sets of coefficients in two linear regressions. Econo-metrica: Journal of the Econometric Society pp. 591–605.
Dick-Nielsen, J., P. Feldhutter, and D. Lando. 2012. Corporate bond liquidity before and after theonset of the subprime crisis. Journal of Financial Economics 103:471–492.
Diebold, F. X., and C. Li. 2006. Forecasting the term structure of government bond yields. Journalof econometrics 130:337–364.
Edwards, A. K., L. E. Harris, and M. S. Piwowar. 2007. Corporate bond market transaction costsand transparency. The Journal of Finance 62:1421–1451.
Fleming, M. 2003. Measuring Treasury Market Liquidity. FRBNY Economic Policy ReviewSeptember:83–108.
25
Friewald, N., R. Jankowitsch, and M. G. Subrahmanyam. 2012. Illiquidity or credit deterioration:A study of liquidity in the US corporate bond market during financial crises. Journal of FinancialEconomics 105:18–36.
Friewald, N., R. Jankowitsch, and M. G. Subrahmanyam. 2017. Transparency and liquidity in thestructured product market. The Review of Asset Pricing Studies p. 010.
Henrard, M. 2013. Bond Pricing.
Hrnjic, E., H. Kapetanovic, and D. Reeb. 2014. Emirates Airline: A Billion-Dollar Sukuk BondIssue.
Jankowitsch, R., F. Nagler, and M. G. Subrahmanyam. 2014. The determinants of recovery ratesin the US corporate bond market. Journal of Financial Economics 114:155–177.
Jankowitsch, R., A. Nashikkar, and M. G. Subrahmanyam. 2011. Price dispersion in OTC markets:A new measure of liquidity. Journal of Banking & Finance 35:343–357.
Lynch, A. W., and R. R. Mendenhall. 1997. New evidence on stock price effects associated withchanges in the S&P 500 index. The Journal of Business 70:351–383.
Newey, W. K., and K. D. West. 1987. Hypothesis testing with efficient method of moments esti-mation. International Economic Review pp. 777–787.
Pelizzon, L., M. G. Subrahmanyam, D. Tomio, and J. Uno. 2016. Sovereign credit risk, liquidity,and European Central Bank intervention: Deus ex machina? Journal of Financial Economics122:86–115.
Raei, F., and S. Cakir. 2007. Sukuk vs. Eurobonds: Is There a Difference in Value-at-Risk? (EPub).
Roll, R. 1984. A simple implicit measure of the effective bid-ask spread in an efficient market. TheJournal of finance 39:1127–1139.
Wilson, R. 2008. Innovation in the structuring of Islamic sukuk securities. Humanomics 24:170–181.
Zeileis, A., C. Kleiber, W. Kramer, and K. Hornik. 2003. Testing and dating of structural changesin practice. Computational Statistics & Data Analysis 44:109–123.
26
Figuresand
Tables
Figure
1.
EventTim
eline
Tim
elineshow
snotable
events
intheMalaysiansovereignbon
dmarket
since
January
2005.Basedontheseevents,weidentified
threedifferentregim
es:thepre-crisisperiodbetweenJanuary
2005andMarch2008,theperiodwhen
Malaysiais
influen
cedbythe
2007-2008GlobalFinancialCrisis(G
FC)from
June2009to
June2010,andthepost-crisis
periodthatstarted
inJune2010.
27
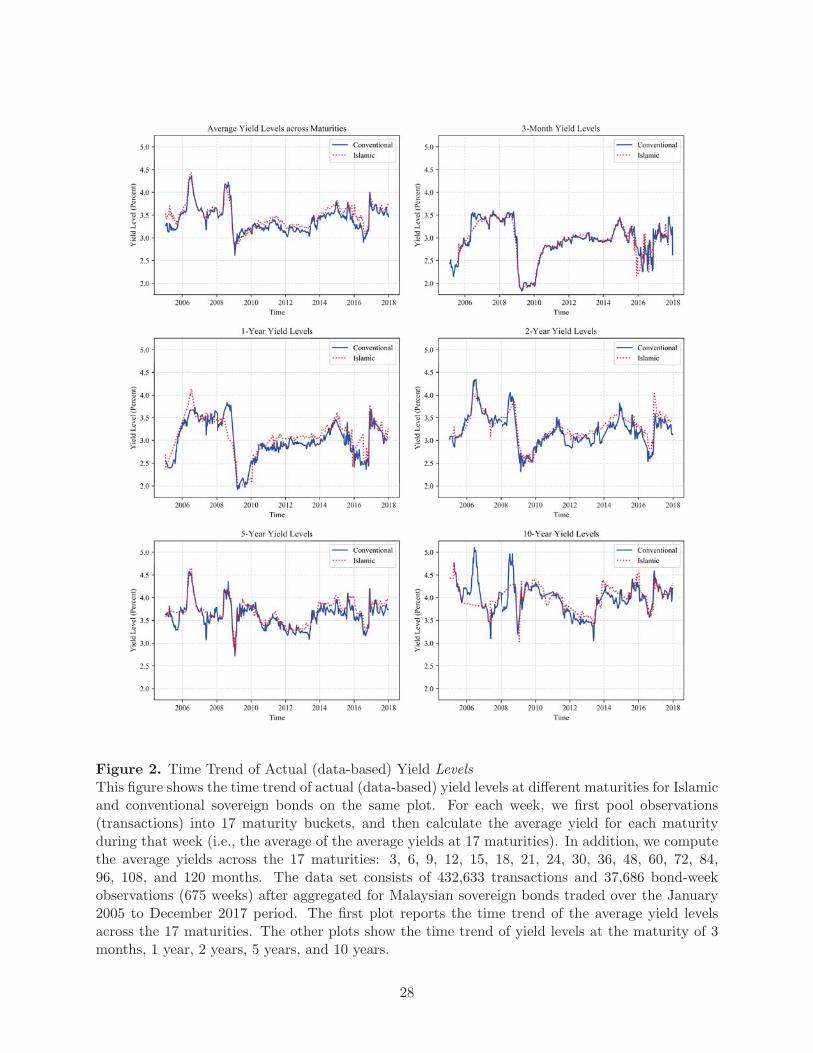
Figure 2. Time Trend of Actual (data-based) Yield LevelsThis figure shows the time trend of actual (data-based) yield levels at different maturities for Islamicand conventional sovereign bonds on the same plot. For each week, we first pool observations(transactions) into 17 maturity buckets, and then calculate the average yield for each maturityduring that week (i.e., the average of the average yields at 17 maturities). In addition, we computethe average yields across the 17 maturities: 3, 6, 9, 12, 15, 18, 21, 24, 30, 36, 48, 60, 72, 84,96, 108, and 120 months. The data set consists of 432,633 transactions and 37,686 bond-weekobservations (675 weeks) after aggregated for Malaysian sovereign bonds traded over the January2005 to December 2017 period. The first plot reports the time trend of the average yield levelsacross the 17 maturities. The other plots show the time trend of yield levels at the maturity of 3months, 1 year, 2 years, 5 years, and 10 years.
28
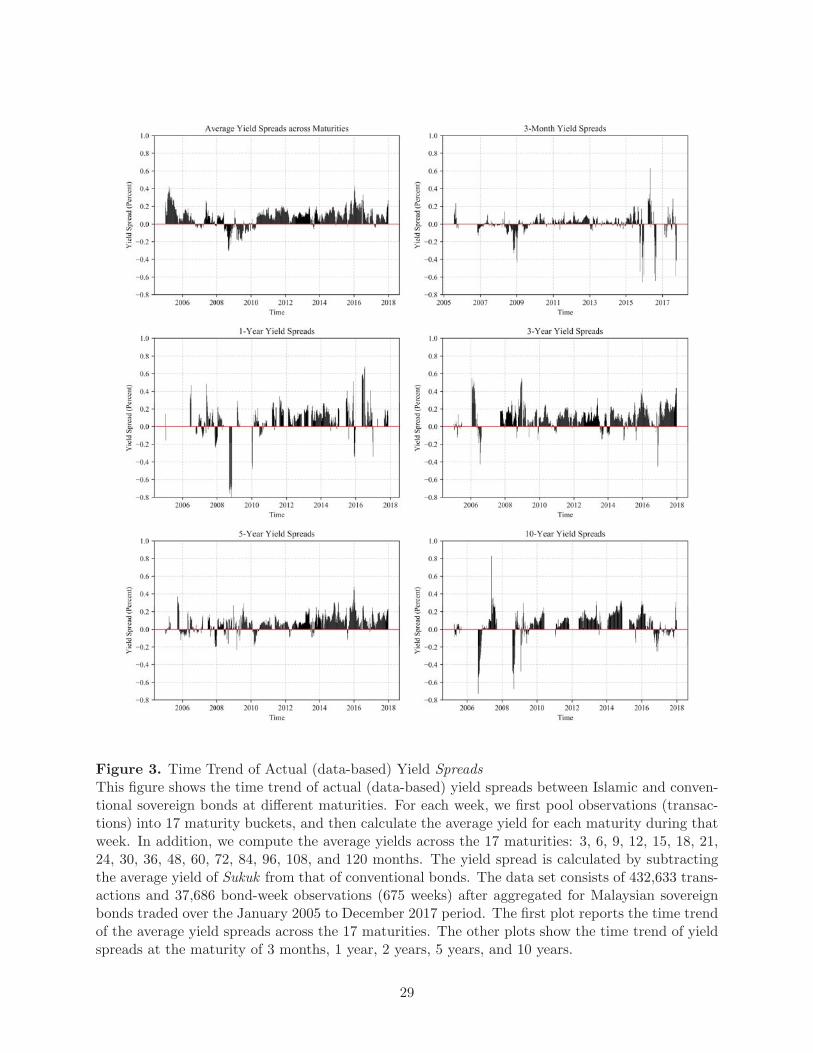
Figure 3. Time Trend of Actual (data-based) Yield SpreadsThis figure shows the time trend of actual (data-based) yield spreads between Islamic and conven-tional sovereign bonds at different maturities. For each week, we first pool observations (transac-tions) into 17 maturity buckets, and then calculate the average yield for each maturity during thatweek. In addition, we compute the average yields across the 17 maturities: 3, 6, 9, 12, 15, 18, 21,24, 30, 36, 48, 60, 72, 84, 96, 108, and 120 months. The yield spread is calculated by subtractingthe average yield of Sukuk from that of conventional bonds. The data set consists of 432,633 trans-actions and 37,686 bond-week observations (675 weeks) after aggregated for Malaysian sovereignbonds traded over the January 2005 to December 2017 period. The first plot reports the time trendof the average yield spreads across the 17 maturities. The other plots show the time trend of yieldspreads at the maturity of 3 months, 1 year, 2 years, 5 years, and 10 years.
29
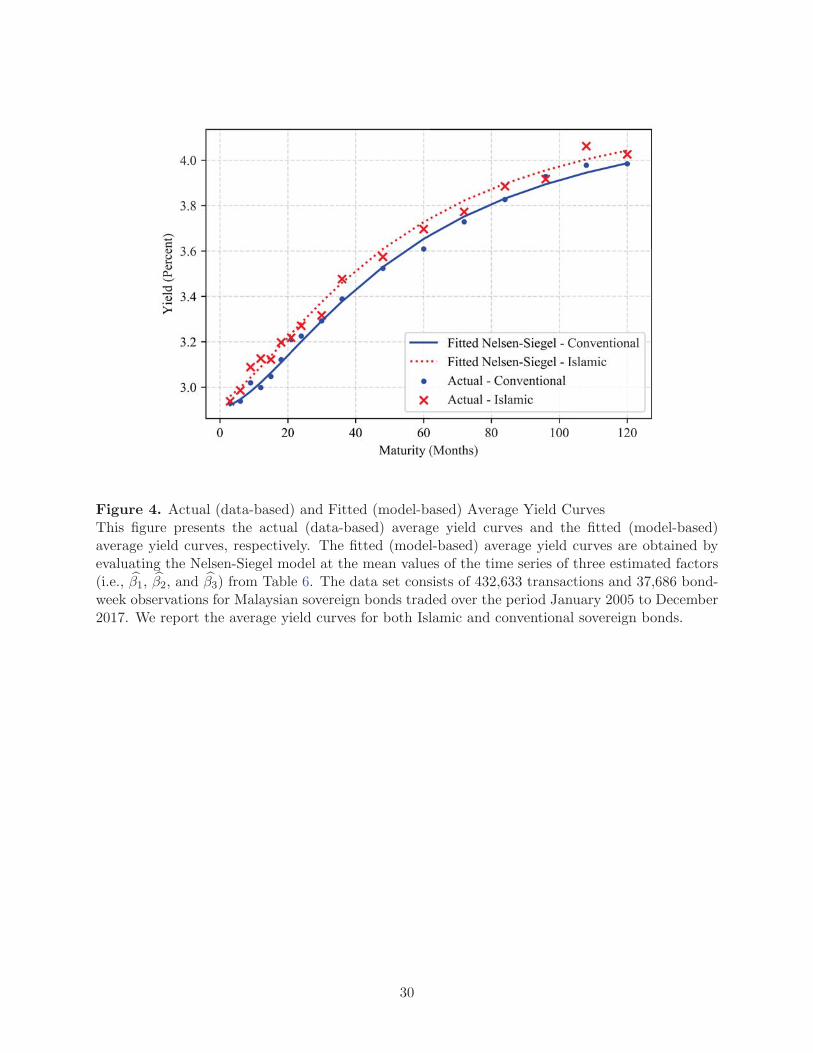
Figure 4. Actual (data-based) and Fitted (model-based) Average Yield CurvesThis figure presents the actual (data-based) average yield curves and the fitted (model-based)average yield curves, respectively. The fitted (model-based) average yield curves are obtained byevaluating the Nelsen-Siegel model at the mean values of the time series of three estimated factors(i.e., β1, β2, and β3) from Table 6. The data set consists of 432,633 transactions and 37,686 bond-week observations for Malaysian sovereign bonds traded over the period January 2005 to December2017. We report the average yield curves for both Islamic and conventional sovereign bonds.
30
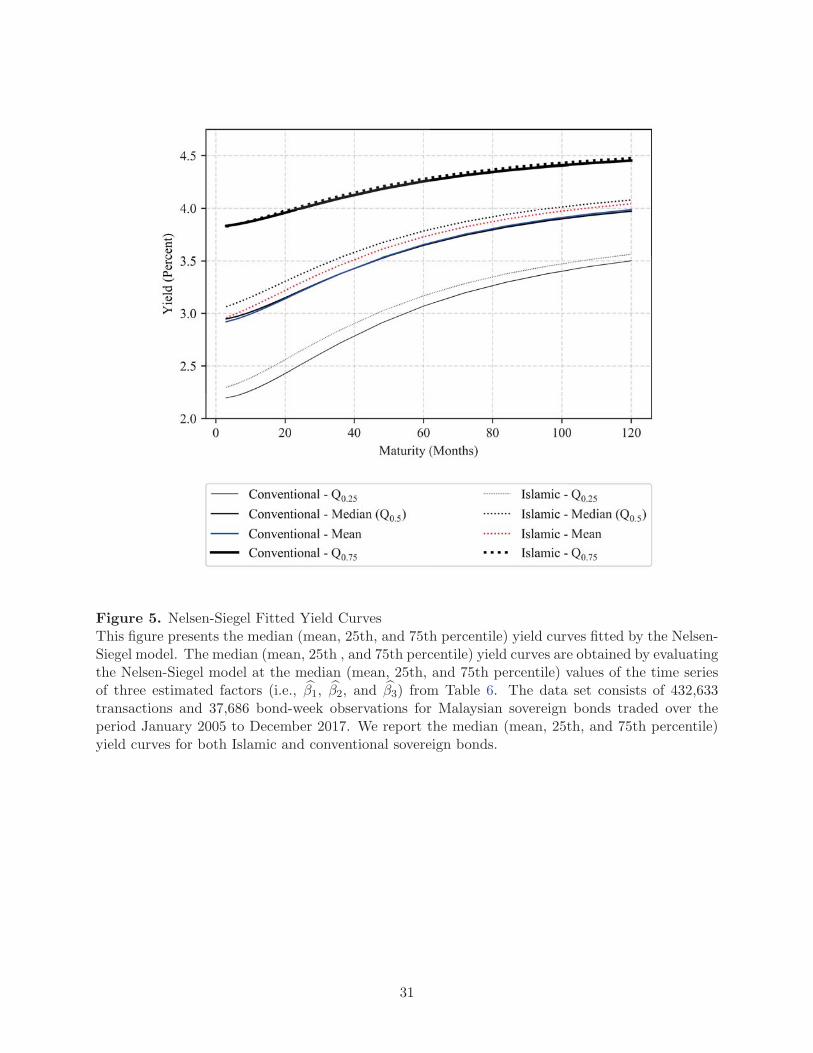
Figure 5. Nelsen-Siegel Fitted Yield CurvesThis figure presents the median (mean, 25th, and 75th percentile) yield curves fitted by the Nelsen-Siegel model. The median (mean, 25th , and 75th percentile) yield curves are obtained by evaluatingthe Nelsen-Siegel model at the median (mean, 25th, and 75th percentile) values of the time seriesof three estimated factors (i.e., β1, β2, and β3) from Table 6. The data set consists of 432,633transactions and 37,686 bond-week observations for Malaysian sovereign bonds traded over theperiod January 2005 to December 2017. We report the median (mean, 25th, and 75th percentile)yield curves for both Islamic and conventional sovereign bonds.
31
Figure
6.Multiple
StructuralBreakTeston
theCoeffi
cients
ofIslamic
Dummy
Thisfigure
show
sthestructuralbreaktest
resultson
thecoeffi
cients
onIslamic
Dummy,
whichweobtained
byrunningFama-M
acB
eth
regressionsin
Table
4Model
6.Weadoptthemultiple
structuralbreakframew
ork
byZeileis
etal.(200
3).
Thedata
setconsists
of432,633transactionsand37,686bon
d-w
eekobservations(675weeks)
after
aggregatingforMalaysiansovereignbondstraded
over
theperiodJanuary
2005to
Decem
ber
2017.
32
Source: Bloomberg, L.P.
Source: Bloomberg, L.P.
Figure 7. Foreign Holdings and Local HoldingsThe two figures show the holding positions by both foreign investors and local investors on the twoMalaysian sovereign Sukuk included in J.P. Morgan’s GBI-EM index. The local stock codes forthe two chosen Sukuk are ”GL160001” and ”GO160003”, and the corresponding ISIN numbers are”MYBGL1600016” and ”MYBGO1600036”. The issue dates of the two Sukuk are on 7 January2016 and 24 March 2016, respectively. The quarterly holdings data for each of the two Sukuk ishand-collected from Bloomberg Terminal. Our bond data set consists of 432,633 transactions and37,686 bond-week observations (675 weeks) after aggregating for Malaysian sovereign bonds tradedover the period January 2005 to December 2017.
33
Table
1.Descriptive
Statistics
This
table
reportsthecross-sectionaldescriptive
statistics(number
ofob
servations,
mean,med
ian,standard
deviation,10th,25th,
75th
and
90th
percentiles)
fortheprice,yield,bond
characteristics
and
liquidityproxies.
Price
istheclean
price
ofthetrades
reportedin
Malaysianringgit
(MYR)byBankNegara
Malaysia.Yield
istheyield
tomaturity
andis
given
inpercentagepoints.
For
bondshavingmultiple
trades
inaweek,weestimate
theyield
from
individualtrades
bycalculatingavo
lume-weightedaverage
fortheweek.Thebon
dcharacteristics
includeMaturity,Duration,AgeandCoupon
Rate.Theliquidityproxiesare
classified
into
threegroups:
tradingactivityvariables(N
umberofTrades,AmountTraded
andTim
eIntervalbetweentrades),
liquiditymeasures
(AmihudRatio,Price
DispersionMeasure
andZeroReturn
Dummy)an
dthefirstprinciplecomponent(1
stPC
ofLiquidity)ofallthe
liquidityproxies.
Wefirstcalculate
thedescriptive
statisticscross-sectionallyin
each
weekandthen
report
thetimeseries
averageof
each
statistic.Thedata
setconsistsof432,633transactionsand37,686bon
d-w
eekobservationsforMalaysiansovereignbondstraded
over
theperiodJanuary
2005to
Decem
ber
2017.Pan
elA
reports
thedescriptive
statisticsofthecombined
sample
ofConventional
andIslamic
trades,whilePanelsB
andC
report
them
separately.
Panel
A:Combined
#of
obs
Mean
Med
ian
Std.dev.
Q0.10
Q0.25
Q0.75
Q0.90
Price
(MYR)
55.801
100.536
99.987
2.720
98.263
99.272
101.412
103.559
Yield
(%)
55.807
3.375
3.252
0.453
2.905
3.024
3.675
4.037
Maturity
(year)
55.831
3.720
1.796
4.664
0.227
0.645
5.152
10.116
Duration(year)
55.397
2.992
1.651
3.288
0.219
0.612
4.498
7.967
Age(year)
55.831
2.447
1.078
3.340
0.132
0.403
3.130
7.255
CouponRate
(%)
55.403
2.595
2.319
1.936
0.619
0.901
4.195
4.876
#of
Trades
55.831
12.452
4.387
24.663
1.067
1.850
10.859
29.723
AmountTraded
(millionMYR)
55.807
284.120
124.060
433.890
9.445
36.417
344.110
772.690
Tim
eInterval(day)
55.327
5.911
1.801
12.845
0.224
0.620
5.463
14.510
AmihudRatio(bpsper
hundredmillionMYR)
55.311
1912.210
115.020
7390.370
4.632
20.008
618.540
3283.030
Price
DispersionMeasure
(MYR)
43.064
0.065
0.032
0.093
0.003
0.010
0.082
0.173
ZeroReturn
Dummy
54.538
0.487
0.535
0.293
0.037
0.252
0.749
0.798
1stPC
ofLiquidity
42.071
0.016
-0.300
1.467
-1.296
-0.903
0.576
1.740
34
Panel
B:Convention
al
#of
obs
Mean
Med
ian
Std.dev.
Q0.10
Q0.25
Q0.75
Q0.90
Price
(MYR)
35.530
100.712
100.110
3.146
97.904
99.145
101.814
104.372
Yield
(%)
35.536
3.396
3.280
0.474
2.897
3.023
3.716
4.090
Maturity
(year)
35.559
4.224
2.137
5.139
0.261
0.743
5.902
11.530
Duration(year)
35.530
3.333
1.963
3.523
0.253
0.709
5.049
8.766
Age(year)
35.559
2.937
1.380
3.702
0.173
0.526
4.112
8.754
CouponRate
(%)
35.536
2.780
2.851
2.002
0.570
0.909
4.301
5.094
#of
Trades
35.559
13.788
5.373
25.128
1.193
2.344
12.799
34.644
AmountTraded
(millionMYR)
35.536
313.592
146.714
456.110
8.558
38.261
395.330
860.150
Tim
eInterval(day)
35.381
4.619
1.512
9.190
0.226
0.572
4.402
11.934
AmihudRatio(bpsper
hundredmillionMYR)
35.364
2670.990
237.210
8686.240
14.049
55.870
1142.730
5599.800
Price
DispersionMeasure
(MYR)
28.747
0.079
0.043
0.101
0.007
0.017
0.103
0.201
ZeroReturn
Dummy
35.040
0.429
0.459
0.287
0.026
0.180
0.683
0.770
1stPC
ofLiquidity
28.333
0.212
-0.086
1.427
-1.107
-0.699
0.750
1.910
Panel
C:Islamic
#of
obs
Mean
Med
ian
Std.dev.
Q0.10
Q0.25
Q0.75
Q0.90
Price
(MYR)
20.301
100.106
99.914
1.244
98.925
99.424
100.633
101.643
Yield
(%)
20.301
3.361
3.261
0.388
2.983
3.085
3.589
3.921
Maturity
(year)
20.303
2.939
1.723
3.299
0.420
0.785
4.084
7.623
Duration(year)
19.896
2.733
1.849
2.579
0.827
1.092
3.739
6.247
Age(year)
20.303
1.291
0.783
1.459
0.139
0.327
1.777
3.486
CouponRate
(%)
19.896
2.317
1.914
1.439
1.152
1.324
3.366
4.016
#of
Trades
20.303
11.418
5.818
17.904
1.935
2.447
14.137
26.812
AmountTraded
(millionMYR)
20.301
239.450
136.460
311.670
25.830
51.350
321.830
606.450
Tim
eInterval(day)
19.976
7.974
3.029
13.999
0.330
0.907
8.967
21.938
AmihudRatio(bpsper
hundredmillionMYR)
19.976
437.620
38.340
1205.630
3.287
8.591
261.600
1131.050
Price
DispersionMeasure
(MYR)
14.338
0.037
0.019
0.051
0.003
0.006
0.050
0.105
ZeroReturn
Dummy
19.527
0.595
0.679
0.262
0.208
0.447
0.789
0.809
1stPC
ofLiquidity
13.758
-0.373
-0.602
1.273
-1.520
-1.147
0.208
1.151
35
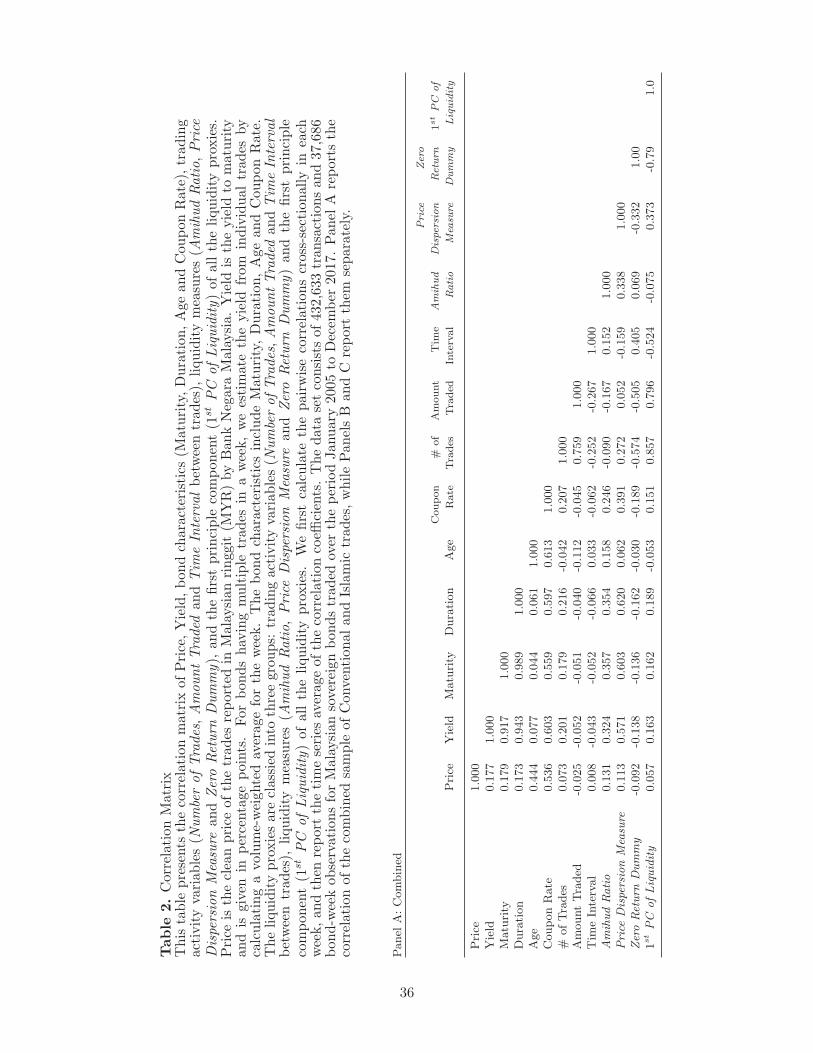
Table
2.CorrelationMatrix
Thistable
presents
thecorrelationmatrix
ofPrice,Yield,bon
dcharacteristics
(Maturity,Duration,AgeandCouponRate),trading
activityvariables(N
umberofTrades,AmountTraded
andTim
eIntervalbetweentrades),
liquiditymeasures(A
mihudRatio,Price
DispersionMeasure
andZeroReturn
Dummy),
andthefirstprinciple
compon
ent(1
stPC
ofLiquidity)ofalltheliquidityproxies.
Price
isthecleanprice
ofthetrades
reported
inMalaysianringgit
(MYR)byBankNegara
Malaysia.Yield
istheyield
tomaturity
andis
given
inpercentagepoints.
Forbon
dshavingmultiple
trades
inaweek,weestimate
theyield
from
individualtrades
by
calculatingavolume-weightedaveragefortheweek.Thebon
dcharacteristics
includeMaturity,Duration,AgeandCouponRate.
Theliquidityproxiesareclassiedinto
threegroups:
tradingactivityvariables(N
umberofTrades,AmountTraded
andTim
eInterval
between
trades),
liquiditymeasures(A
mihudRatio,Price
Dispersion
Measure
and
ZeroReturn
Dummy)and
thefirstprinciple
component(1
stPC
ofLiquidity)ofalltheliquidityproxies.
Wefirstcalculate
thepairwisecorrelationscross-sectionallyin
each
week,an
dthen
report
thetimeseries
averageofthecorrelationcoeffi
cients.Thedata
setconsistsof432,633transactionsand37,686
bond-w
eekobservationsforMalaysiansovereignbon
dstraded
over
theperiodJanuary
2005to
Decem
ber
2017.Panel
Areportsthe
correlationofthecombined
sample
ofConventionalan
dIslamic
trades,whilePan
elsB
andC
report
them
separately.
Panel
A:Combined
Price
Yield
Maturity
Duration
Age
Coupon
Rate
#of
Trades
Amount
Traded
Tim
e
Interval
Amihud
Ratio
Price
Dispersion
Measu
re
Zero
Return
Dummy
1stPC
of
Liquidity
Price
1.000
Yield
0.177
1.000
Maturity
0.179
0.917
1.000
Duration
0.173
0.943
0.989
1.000
Age
0.444
0.077
0.044
0.061
1.000
CouponRate
0.536
0.603
0.559
0.597
0.613
1.000
#ofTrades
0.073
0.201
0.179
0.216
-0.042
0.207
1.000
AmountTraded
-0.025
-0.052
-0.051
-0.040
-0.112
-0.045
0.759
1.000
Tim
eInterval
0.008
-0.043
-0.052
-0.066
0.033
-0.062
-0.252
-0.267
1.000
AmihudRatio
0.131
0.324
0.357
0.354
0.158
0.246
-0.090
-0.167
0.152
1.000
Price
DispersionMeasure
0.113
0.571
0.603
0.620
0.062
0.391
0.272
0.052
-0.159
0.338
1.000
ZeroReturn
Dummy
-0.092
-0.138
-0.136
-0.162
-0.030
-0.189
-0.574
-0.505
0.405
0.069
-0.332
1.00
1stPC
ofLiquidity
0.057
0.163
0.162
0.189
-0.053
0.151
0.857
0.796
-0.524
-0.075
0.373
-0.79
1.0
36
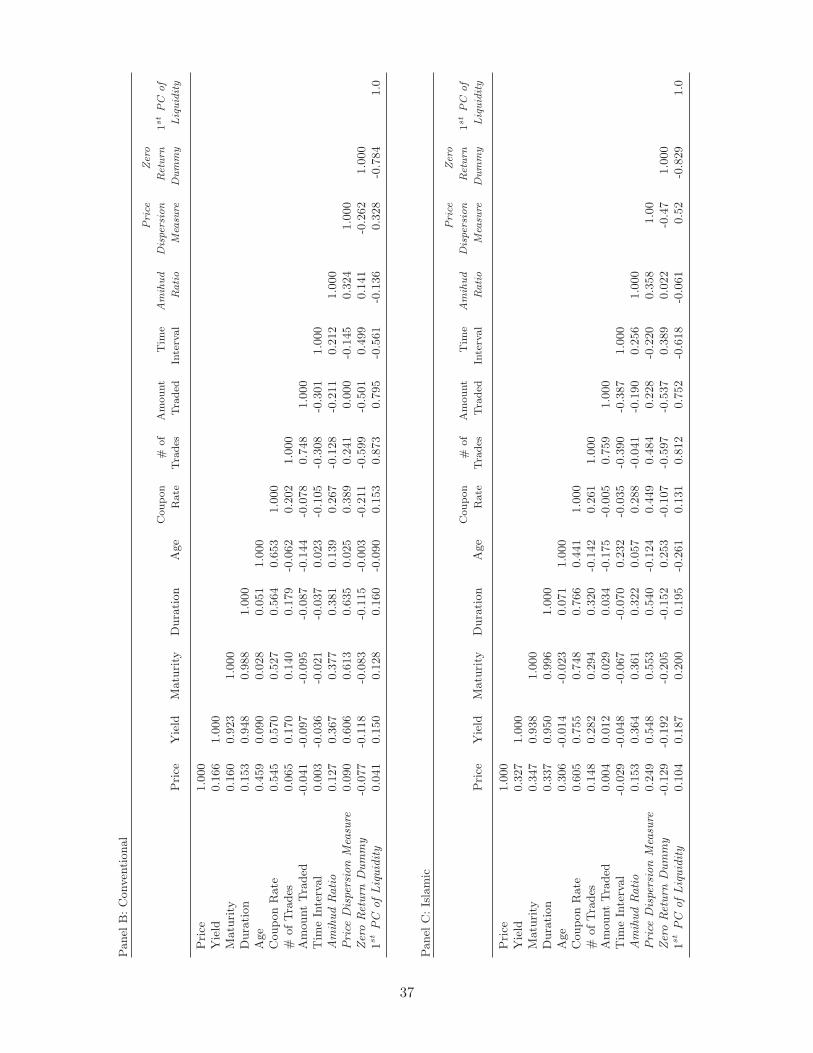
Panel
B:Conven
tional
Price
Yield
Maturity
Duration
Age
Coupon
Rate
#of
Trades
Amount
Traded
Tim
e
Interval
Amihud
Ratio
Price
Dispersion
Measu
re
Zero
Return
Dummy
1stPC
of
Liquidity
Price
1.000
Yield
0.166
1.000
Maturity
0.160
0.923
1.000
Duration
0.153
0.948
0.988
1.000
Age
0.459
0.090
0.028
0.051
1.000
CouponRate
0.545
0.570
0.527
0.564
0.653
1.000
#ofTrades
0.065
0.170
0.140
0.179
-0.062
0.202
1.000
AmountTraded
-0.041
-0.097
-0.095
-0.087
-0.144
-0.078
0.748
1.000
Tim
eInterval
0.003
-0.036
-0.021
-0.037
0.023
-0.105
-0.308
-0.301
1.000
AmihudRatio
0.127
0.367
0.377
0.381
0.139
0.267
-0.128
-0.211
0.212
1.000
Price
DispersionMeasure
0.090
0.606
0.613
0.635
0.025
0.389
0.241
0.000
-0.145
0.324
1.000
ZeroReturn
Dummy
-0.077
-0.118
-0.083
-0.115
-0.003
-0.211
-0.599
-0.501
0.499
0.141
-0.262
1.000
1stPC
ofLiquidity
0.041
0.150
0.128
0.160
-0.090
0.153
0.873
0.795
-0.561
-0.136
0.328
-0.784
1.0
Panel
C:Islamic
Price
Yield
Maturity
Duration
Age
Coupon
Rate
#of
Trades
Amount
Traded
Tim
e
Interval
Amihud
Ratio
Price
Dispersion
Measu
re
Zero
Return
Dummy
1stPC
of
Liquidity
Price
1.000
Yield
0.327
1.000
Maturity
0.347
0.938
1.000
Duration
0.337
0.950
0.996
1.000
Age
0.306
-0.014
-0.023
0.071
1.000
CouponRate
0.605
0.755
0.748
0.766
0.441
1.000
#ofTrades
0.148
0.282
0.294
0.320
-0.142
0.261
1.000
AmountTraded
0.004
0.012
0.029
0.034
-0.175
-0.005
0.759
1.000
Tim
eInterval
-0.029
-0.048
-0.067
-0.070
0.232
-0.035
-0.390
-0.387
1.000
AmihudRatio
0.153
0.364
0.361
0.322
0.057
0.288
-0.041
-0.190
0.256
1.000
Price
DispersionMeasure
0.249
0.548
0.553
0.540
-0.124
0.449
0.484
0.228
-0.220
0.358
1.00
ZeroReturn
Dummy
-0.129
-0.192
-0.205
-0.152
0.253
-0.107
-0.597
-0.537
0.389
0.022
-0.47
1.000
1stPC
ofLiquidity
0.104
0.187
0.200
0.195
-0.261
0.131
0.812
0.752
-0.618
-0.061
0.52
-0.829
1.0
37
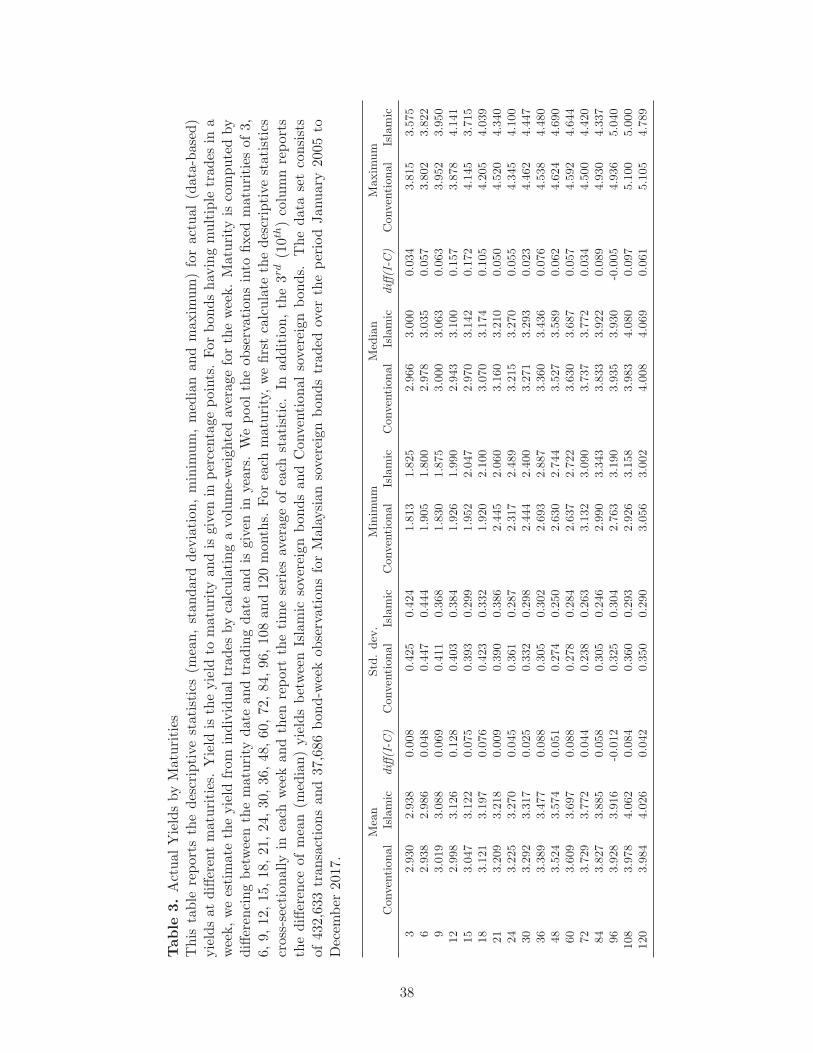
Table
3.ActualYieldsbyMaturities
This
table
reportsthedescriptive
statistics(m
ean,standard
deviation,minim
um,med
ianandmaxim
um)foractual(data-based)
yieldsat
differentmaturities.Yield
istheyield
tomaturity
andisgivenin
percentagepoints.Forbondshavingmultiple
trades
ina
week,weestimate
theyield
from
individualtrades
bycalculatingavo
lume-weightedaveragefortheweek.Maturity
iscomputedby
differen
cingbetweenthematurity
date
andtradingdate
andis
given
inyears.Wepool
theobservationsinto
fixed
maturities
of3,
6,9,12,15,18,21,24,30,36,48,60,72,84,96,108and120months.
Foreach
maturity,wefirstcalculate
thedescriptive
statistics
cross-sectionallyin
each
weekandthen
report
thetimeseries
averageofeach
statistic.In
addition,the3r
d(10t
h)columnreports
thedifferen
ceofmean(m
edian)yieldsbetweenIslamic
sovereignbon
dsandConventionalsovereignbonds.
Thedata
setconsists
of432,633transactionsand37,686bon
d-w
eekobservationsforMalaysiansovereignbon
dstraded
over
theperiodJanuary
2005to
Decem
ber
2017.
Mean
Std.dev
.Minim
um
Med
ian
Maxim
um
Conventional
Islamic
diff(I-C
)Conventional
Islamic
Conventional
Islamic
Conven
tional
Islamic
diff(I-C
)Conventional
Islamic
32.930
2.938
0.008
0.425
0.424
1.813
1.825
2.966
3.000
0.034
3.815
3.575
62.938
2.986
0.048
0.447
0.444
1.905
1.800
2.978
3.035
0.057
3.802
3.822
93.019
3.088
0.069
0.411
0.368
1.830
1.875
3.000
3.063
0.063
3.952
3.950
12
2.998
3.126
0.128
0.403
0.384
1.926
1.990
2.943
3.100
0.157
3.878
4.141
15
3.047
3.122
0.075
0.393
0.299
1.952
2.047
2.970
3.142
0.172
4.145
3.715
18
3.121
3.197
0.076
0.423
0.332
1.920
2.100
3.070
3.174
0.105
4.205
4.039
21
3.209
3.218
0.009
0.390
0.386
2.445
2.060
3.160
3.210
0.050
4.520
4.340
24
3.225
3.270
0.045
0.361
0.287
2.317
2.489
3.215
3.270
0.055
4.345
4.100
30
3.292
3.317
0.025
0.332
0.298
2.444
2.400
3.271
3.293
0.023
4.462
4.447
36
3.389
3.477
0.088
0.305
0.302
2.693
2.887
3.360
3.436
0.076
4.538
4.480
48
3.524
3.574
0.051
0.274
0.250
2.630
2.744
3.527
3.589
0.062
4.624
4.690
60
3.609
3.697
0.088
0.278
0.284
2.637
2.722
3.630
3.687
0.057
4.592
4.644
72
3.729
3.772
0.044
0.238
0.263
3.132
3.090
3.737
3.772
0.034
4.500
4.420
84
3.827
3.885
0.058
0.305
0.246
2.990
3.343
3.833
3.922
0.089
4.930
4.337
96
3.928
3.916
-0.012
0.325
0.304
2.763
3.190
3.935
3.930
-0.005
4.936
5.040
108
3.978
4.062
0.084
0.360
0.293
2.926
3.158
3.983
4.080
0.097
5.100
5.000
120
3.984
4.026
0.042
0.350
0.290
3.056
3.002
4.008
4.069
0.061
5.105
4.789
38
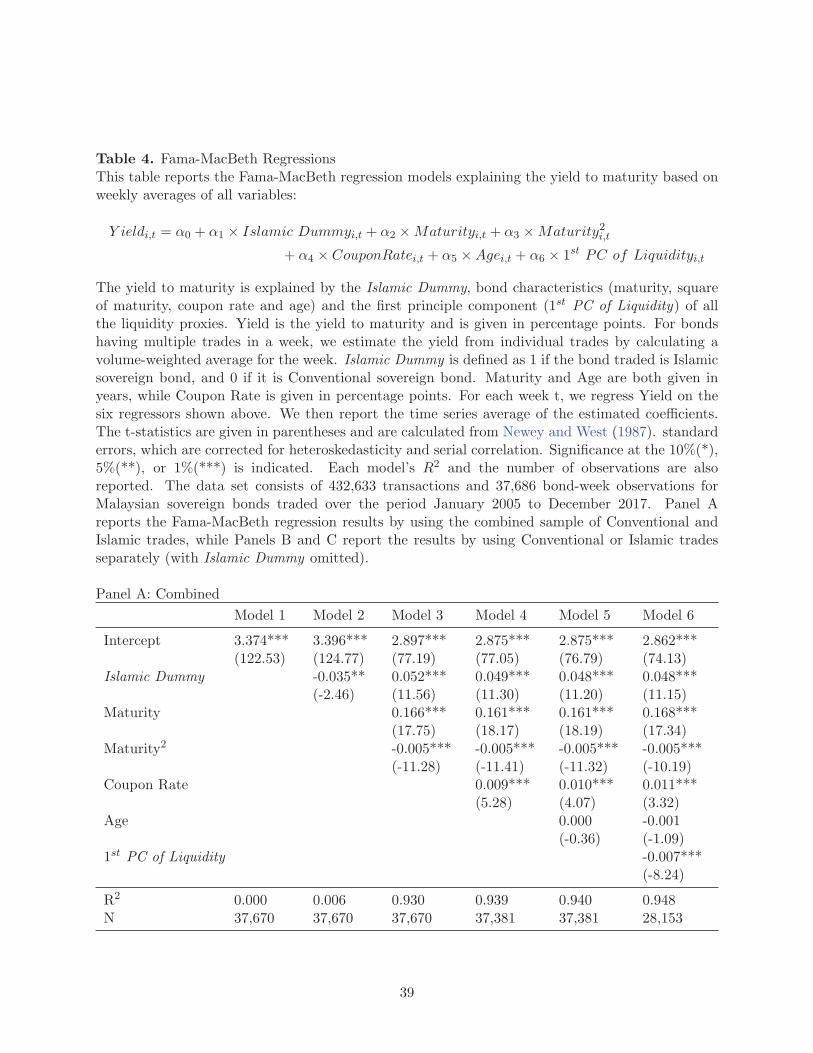
Table 4. Fama-MacBeth RegressionsThis table reports the Fama-MacBeth regression models explaining the yield to maturity based onweekly averages of all variables:
Y ieldi,t = α0 + α1 × Islamic Dummyi,t + α2 ×Maturityi,t + α3 ×Maturity2i,t
+ α4 × CouponRatei,t + α5 ×Agei,t + α6 × 1st PC of Liquidityi,t
The yield to maturity is explained by the Islamic Dummy, bond characteristics (maturity, squareof maturity, coupon rate and age) and the first principle component (1st PC of Liquidity) of allthe liquidity proxies. Yield is the yield to maturity and is given in percentage points. For bondshaving multiple trades in a week, we estimate the yield from individual trades by calculating avolume-weighted average for the week. Islamic Dummy is defined as 1 if the bond traded is Islamicsovereign bond, and 0 if it is Conventional sovereign bond. Maturity and Age are both given inyears, while Coupon Rate is given in percentage points. For each week t, we regress Yield on thesix regressors shown above. We then report the time series average of the estimated coefficients.The t-statistics are given in parentheses and are calculated from Newey and West (1987). standarderrors, which are corrected for heteroskedasticity and serial correlation. Significance at the 10%(*),5%(**), or 1%(***) is indicated. Each model’s R2 and the number of observations are alsoreported. The data set consists of 432,633 transactions and 37,686 bond-week observations forMalaysian sovereign bonds traded over the period January 2005 to December 2017. Panel Areports the Fama-MacBeth regression results by using the combined sample of Conventional andIslamic trades, while Panels B and C report the results by using Conventional or Islamic tradesseparately (with Islamic Dummy omitted).
Panel A: Combined
Model 1 Model 2 Model 3 Model 4 Model 5 Model 6
Intercept 3.374*** 3.396*** 2.897*** 2.875*** 2.875*** 2.862***(122.53) (124.77) (77.19) (77.05) (76.79) (74.13)
Islamic Dummy -0.035** 0.052*** 0.049*** 0.048*** 0.048***(-2.46) (11.56) (11.30) (11.20) (11.15)
Maturity 0.166*** 0.161*** 0.161*** 0.168***(17.75) (18.17) (18.19) (17.34)
Maturity2 -0.005*** -0.005*** -0.005*** -0.005***(-11.28) (-11.41) (-11.32) (-10.19)
Coupon Rate 0.009*** 0.010*** 0.011***(5.28) (4.07) (3.32)
Age 0.000 -0.001(-0.36) (-1.09)
1st PC of Liquidity -0.007***(-8.24)
R2 0.000 0.006 0.930 0.939 0.940 0.948N 37,670 37,670 37,670 37,381 37,381 28,153
39
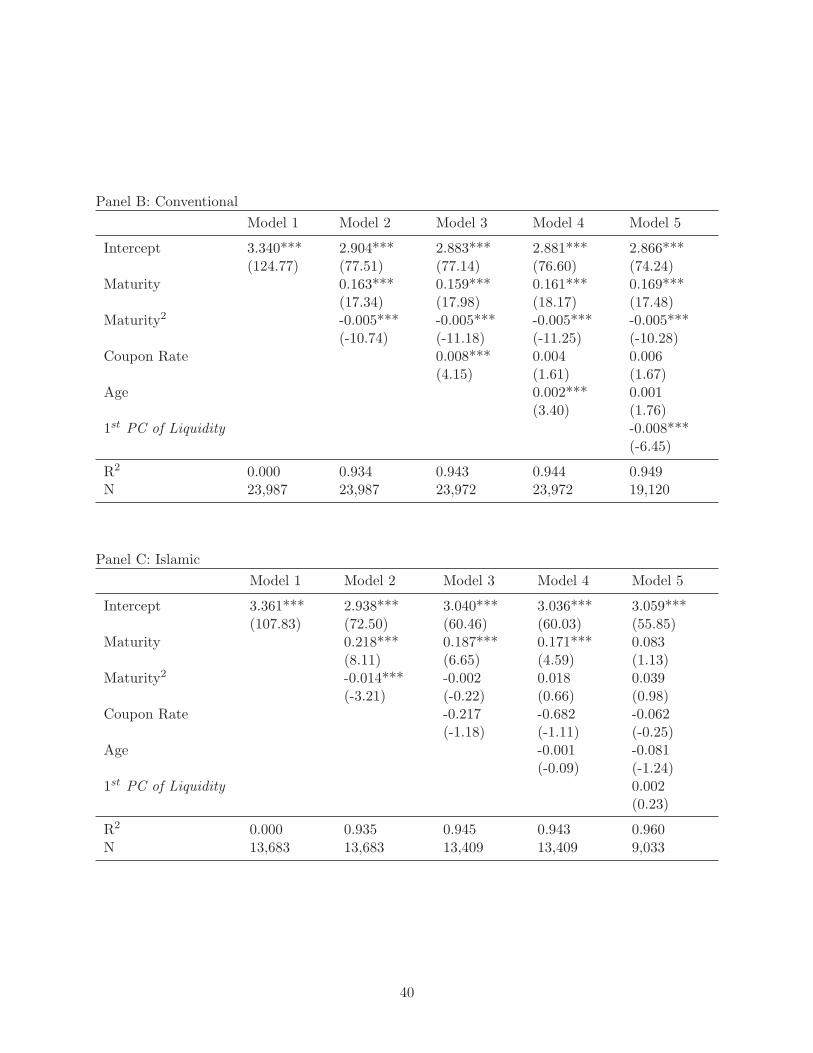
Panel B: Conventional
Model 1 Model 2 Model 3 Model 4 Model 5
Intercept 3.340*** 2.904*** 2.883*** 2.881*** 2.866***(124.77) (77.51) (77.14) (76.60) (74.24)
Maturity 0.163*** 0.159*** 0.161*** 0.169***(17.34) (17.98) (18.17) (17.48)
Maturity2 -0.005*** -0.005*** -0.005*** -0.005***(-10.74) (-11.18) (-11.25) (-10.28)
Coupon Rate 0.008*** 0.004 0.006(4.15) (1.61) (1.67)
Age 0.002*** 0.001(3.40) (1.76)
1st PC of Liquidity -0.008***(-6.45)
R2 0.000 0.934 0.943 0.944 0.949N 23,987 23,987 23,972 23,972 19,120
Panel C: Islamic
Model 1 Model 2 Model 3 Model 4 Model 5
Intercept 3.361*** 2.938*** 3.040*** 3.036*** 3.059***(107.83) (72.50) (60.46) (60.03) (55.85)
Maturity 0.218*** 0.187*** 0.171*** 0.083(8.11) (6.65) (4.59) (1.13)
Maturity2 -0.014*** -0.002 0.018 0.039(-3.21) (-0.22) (0.66) (0.98)
Coupon Rate -0.217 -0.682 -0.062(-1.18) (-1.11) (-0.25)
Age -0.001 -0.081(-0.09) (-1.24)
1st PC of Liquidity 0.002(0.23)
R2 0.000 0.935 0.945 0.943 0.960N 13,683 13,683 13,409 13,409 9,033
40
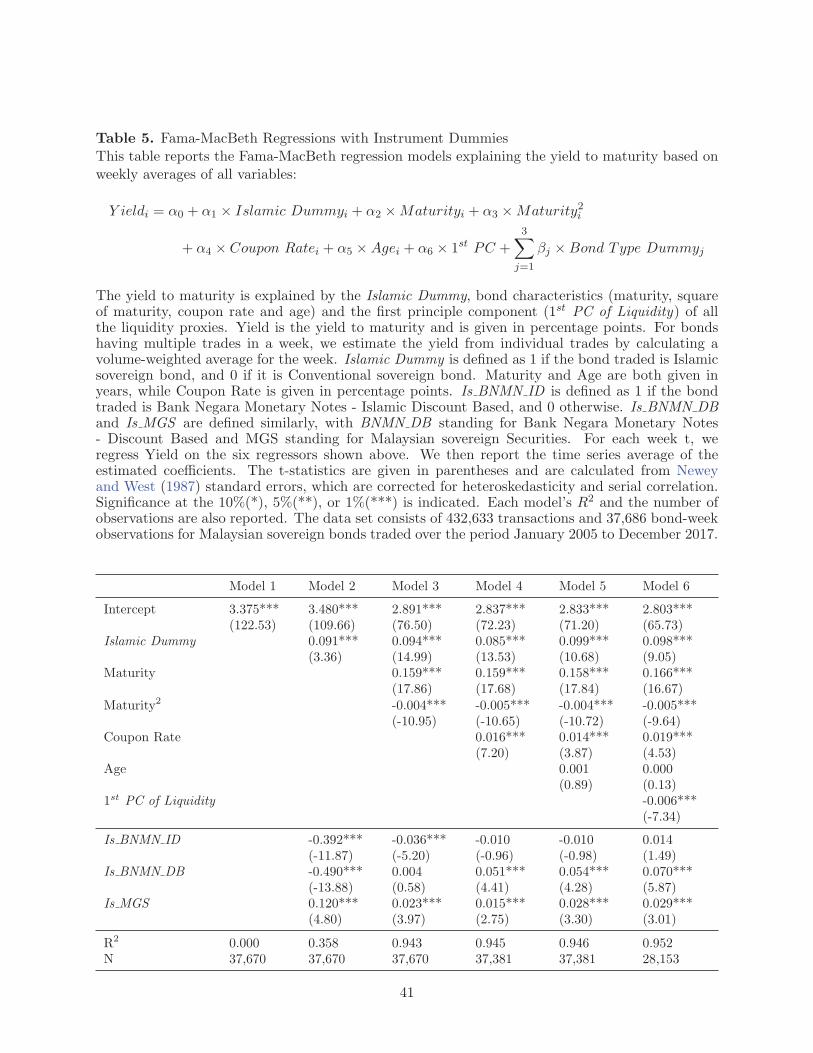
Table 5. Fama-MacBeth Regressions with Instrument DummiesThis table reports the Fama-MacBeth regression models explaining the yield to maturity based onweekly averages of all variables:
Y ieldi = α0 + α1 × Islamic Dummyi + α2 ×Maturityi + α3 ×Maturity2i
+ α4 × Coupon Ratei + α5 ×Agei + α6 × 1st PC +
3∑j=1
βj ×Bond Type Dummyj
The yield to maturity is explained by the Islamic Dummy, bond characteristics (maturity, squareof maturity, coupon rate and age) and the first principle component (1st PC of Liquidity) of allthe liquidity proxies. Yield is the yield to maturity and is given in percentage points. For bondshaving multiple trades in a week, we estimate the yield from individual trades by calculating avolume-weighted average for the week. Islamic Dummy is defined as 1 if the bond traded is Islamicsovereign bond, and 0 if it is Conventional sovereign bond. Maturity and Age are both given inyears, while Coupon Rate is given in percentage points. Is BNMN ID is defined as 1 if the bondtraded is Bank Negara Monetary Notes - Islamic Discount Based, and 0 otherwise. Is BNMN DBand Is MGS are defined similarly, with BNMN DB standing for Bank Negara Monetary Notes- Discount Based and MGS standing for Malaysian sovereign Securities. For each week t, weregress Yield on the six regressors shown above. We then report the time series average of theestimated coefficients. The t-statistics are given in parentheses and are calculated from Neweyand West (1987) standard errors, which are corrected for heteroskedasticity and serial correlation.Significance at the 10%(*), 5%(**), or 1%(***) is indicated. Each model’s R2 and the number ofobservations are also reported. The data set consists of 432,633 transactions and 37,686 bond-weekobservations for Malaysian sovereign bonds traded over the period January 2005 to December 2017.
Model 1 Model 2 Model 3 Model 4 Model 5 Model 6
Intercept 3.375*** 3.480*** 2.891*** 2.837*** 2.833*** 2.803***(122.53) (109.66) (76.50) (72.23) (71.20) (65.73)
Islamic Dummy 0.091*** 0.094*** 0.085*** 0.099*** 0.098***(3.36) (14.99) (13.53) (10.68) (9.05)
Maturity 0.159*** 0.159*** 0.158*** 0.166***(17.86) (17.68) (17.84) (16.67)
Maturity2 -0.004*** -0.005*** -0.004*** -0.005***(-10.95) (-10.65) (-10.72) (-9.64)
Coupon Rate 0.016*** 0.014*** 0.019***(7.20) (3.87) (4.53)
Age 0.001 0.000(0.89) (0.13)
1st PC of Liquidity -0.006***(-7.34)
Is BNMN ID -0.392*** -0.036*** -0.010 -0.010 0.014(-11.87) (-5.20) (-0.96) (-0.98) (1.49)
Is BNMN DB -0.490*** 0.004 0.051*** 0.054*** 0.070***(-13.88) (0.58) (4.41) (4.28) (5.87)
Is MGS 0.120*** 0.023*** 0.015*** 0.028*** 0.029***(4.80) (3.97) (2.75) (3.30) (3.01)
R2 0.000 0.358 0.943 0.945 0.946 0.952N 37,670 37,670 37,670 37,381 37,381 28,153
41
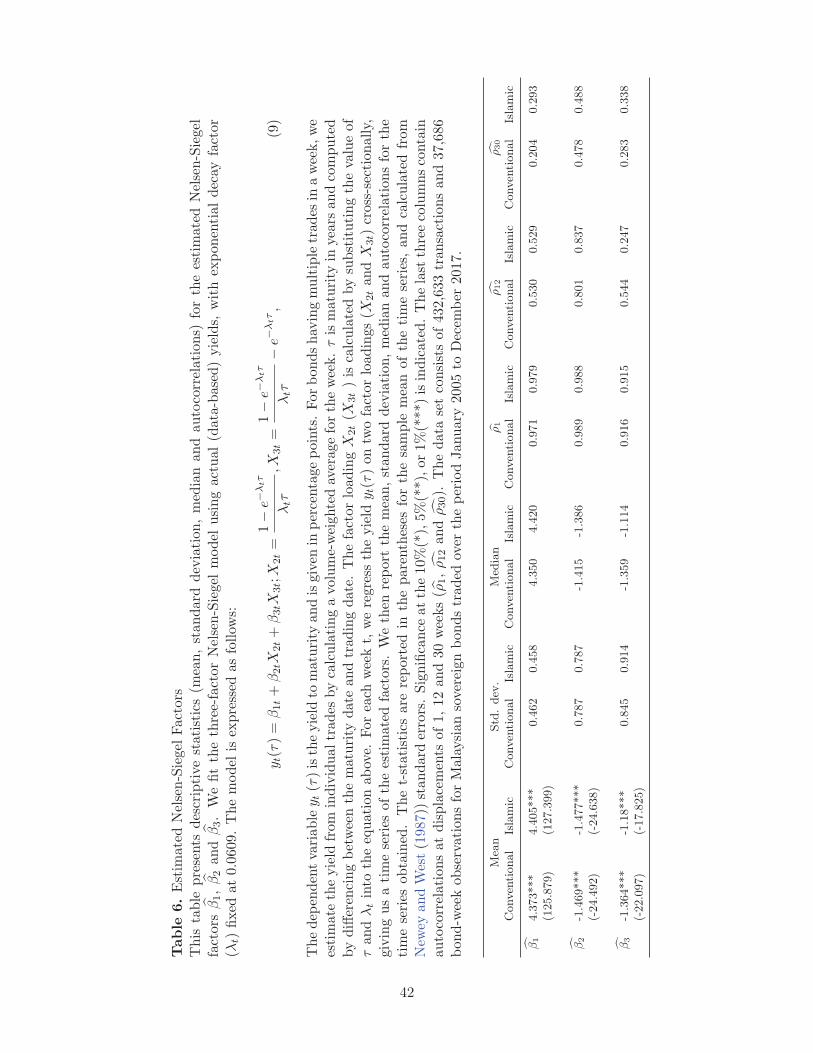
Table
6.Estim
atedNelsen-Siegel
Factors
This
table
presents
descriptive
statistics(m
ean,standard
deviation,med
ianan
dautocorrelations)
fortheestimatedNelsen-Siegel
factors
β1,β2andβ3.Wefitthethree-factorNelsen-Siegel
model
usingactual(data-based)yields,
withexponentialdecay
factor
(λt)
fixed
at0.0609.Themodel
isexpressed
asfollow
s:
y t(τ)=
β1t+
β2tX
2t+
β3tX
3t;X
2t=
1−
e−λtτ
λtτ
,X3t=
1−
e−λtτ
λtτ
−e−
λtτ,
(9)
Thedep
endentvariabley t
(τ)istheyield
tomaturity
andisgivenin
percentagepoints.Forbon
dshavingmultipletrades
inaweek,we
estimate
theyield
from
individualtrades
bycalculatingavo
lume-weightedaveragefortheweek.τismaturity
inyears
andcomputed
bydifferen
cingbetweenthematurity
date
andtradingdate.ThefactorloadingX
2t(X
3t)is
calculatedbysubstitutingthevalueof
τandλtinto
theequationabove.
Foreach
weekt,weregress
theyield
y t(τ)on
twofactorloadings(X
2tandX
3t)
cross-sectionally,
givingusatimeseries
oftheestimatedfactors.Wethen
reportthemean,standard
deviation,med
ianandautocorrelationsforthe
timeseries
obtained
.Thet-statisticsarereportedin
theparentheses
forthesample
meanofthetimeseries,andcalculatedfrom
New
eyan
dWest(198
7))
standard
errors.Significance
atthe10%(*),5%(**),or
1%(***)isindicated.Thelast
threecolumnscontain
autocorrelationsat
displacements
of1,12and30
weeks(ρ
1,ρ12andρ30).
Thedata
setconsistsof432,633transactionsand37,686
bon
d-w
eekobservationsforMalaysiansovereignbon
dstraded
over
theperiodJanuary
2005to
Decem
ber
2017.
Mean
Std.dev
.Med
ian
ρ1
ρ12
ρ30
Conventional
Islamic
Conven
tional
Islamic
Conven
tional
Islamic
Conventional
Islamic
Conventional
Islamic
Conventional
Islamic
β1
4.373***
4.405***
0.462
0.458
4.350
4.420
0.971
0.979
0.530
0.529
0.204
0.293
(125.879)
(127.399)
β2
-1.469***
-1.477***
0.787
0.787
-1.415
-1.386
0.989
0.988
0.801
0.837
0.478
0.488
(-24.492)
(-24.638)
β3
-1.364***
-1.18***
0.845
0.914
-1.359
-1.114
0.916
0.915
0.544
0.247
0.283
0.338
(-22.097)
(-17.825)
42
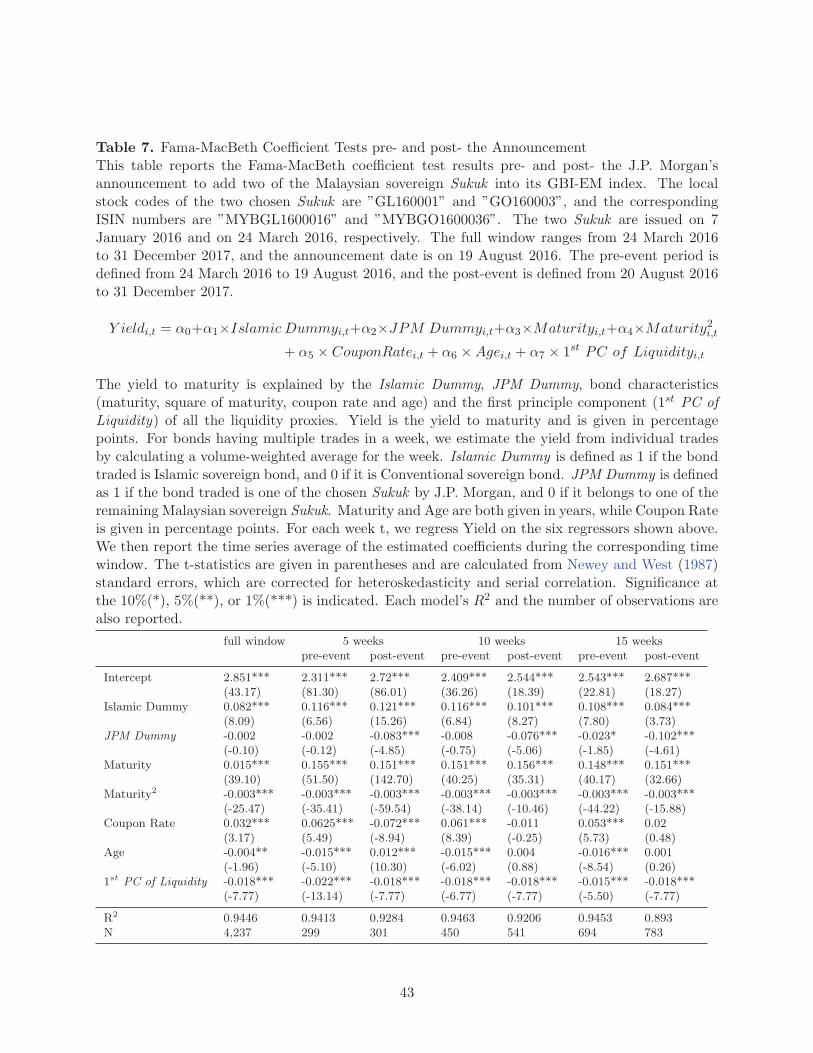
Table 7. Fama-MacBeth Coefficient Tests pre- and post- the AnnouncementThis table reports the Fama-MacBeth coefficient test results pre- and post- the J.P. Morgan’sannouncement to add two of the Malaysian sovereign Sukuk into its GBI-EM index. The localstock codes of the two chosen Sukuk are ”GL160001” and ”GO160003”, and the correspondingISIN numbers are ”MYBGL1600016” and ”MYBGO1600036”. The two Sukuk are issued on 7January 2016 and on 24 March 2016, respectively. The full window ranges from 24 March 2016to 31 December 2017, and the announcement date is on 19 August 2016. The pre-event period isdefined from 24 March 2016 to 19 August 2016, and the post-event is defined from 20 August 2016to 31 December 2017.
Y ieldi,t = α0+α1×Islamic Dummyi,t+α2×JPM Dummyi,t+α3×Maturityi,t+α4×Maturity2i,t
+ α5 × CouponRatei,t + α6 ×Agei,t + α7 × 1st PC of Liquidityi,t
The yield to maturity is explained by the Islamic Dummy, JPM Dummy, bond characteristics(maturity, square of maturity, coupon rate and age) and the first principle component (1st PC ofLiquidity) of all the liquidity proxies. Yield is the yield to maturity and is given in percentagepoints. For bonds having multiple trades in a week, we estimate the yield from individual tradesby calculating a volume-weighted average for the week. Islamic Dummy is defined as 1 if the bondtraded is Islamic sovereign bond, and 0 if it is Conventional sovereign bond. JPM Dummy is definedas 1 if the bond traded is one of the chosen Sukuk by J.P. Morgan, and 0 if it belongs to one of theremaining Malaysian sovereign Sukuk. Maturity and Age are both given in years, while Coupon Rateis given in percentage points. For each week t, we regress Yield on the six regressors shown above.We then report the time series average of the estimated coefficients during the corresponding timewindow. The t-statistics are given in parentheses and are calculated from Newey and West (1987)standard errors, which are corrected for heteroskedasticity and serial correlation. Significance atthe 10%(*), 5%(**), or 1%(***) is indicated. Each model’s R2 and the number of observations arealso reported.
full window 5 weeks 10 weeks 15 weekspre-event post-event pre-event post-event pre-event post-event
Intercept 2.851*** 2.311*** 2.72*** 2.409*** 2.544*** 2.543*** 2.687***(43.17) (81.30) (86.01) (36.26) (18.39) (22.81) (18.27)
Islamic Dummy 0.082*** 0.116*** 0.121*** 0.116*** 0.101*** 0.108*** 0.084***(8.09) (6.56) (15.26) (6.84) (8.27) (7.80) (3.73)
JPM Dummy -0.002 -0.002 -0.083*** -0.008 -0.076*** -0.023* -0.102***(-0.10) (-0.12) (-4.85) (-0.75) (-5.06) (-1.85) (-4.61)
Maturity 0.015*** 0.155*** 0.151*** 0.151*** 0.156*** 0.148*** 0.151***(39.10) (51.50) (142.70) (40.25) (35.31) (40.17) (32.66)
Maturity2 -0.003*** -0.003*** -0.003*** -0.003*** -0.003*** -0.003*** -0.003***(-25.47) (-35.41) (-59.54) (-38.14) (-10.46) (-44.22) (-15.88)
Coupon Rate 0.032*** 0.0625*** -0.072*** 0.061*** -0.011 0.053*** 0.02(3.17) (5.49) (-8.94) (8.39) (-0.25) (5.73) (0.48)
Age -0.004** -0.015*** 0.012*** -0.015*** 0.004 -0.016*** 0.001(-1.96) (-5.10) (10.30) (-6.02) (0.88) (-8.54) (0.26)
1st PC of Liquidity -0.018*** -0.022*** -0.018*** -0.018*** -0.018*** -0.015*** -0.018***(-7.77) (-13.14) (-7.77) (-6.77) (-7.77) (-5.50) (-7.77)
R2 0.9446 0.9413 0.9284 0.9463 0.9206 0.9453 0.893N 4,237 299 301 450 541 694 783
43
A. Appendix: Data Cleaning and Sample Construction Process
To make our price/yield estimation as accurate as possible, we further restrict our sample to fixed-rate “straight” instruments without optionality, and drop suspicious data points by implementingthe following six steps. Table A-1 presents the number (share) of observations left after each stepof filtering steps.
[Insert Table A-1 about here]
• Removing errors : We delete the observation if its instrument type, stock description, issuerand maturity date are all missing.
• Removing missing yields : The purpose of applying this filter is to make sure the price/yieldinformation is available and accurate to the best of our knowledge.
• Removing extreme values : We omit outliers, which we define as price, yield and volumeobservations which below the 0.1th percentile or above the 99.9th percentile, considering allobservations.
• Removing duplicated reporting : We remove duplicated reports of which the bond code, bonddescription, trade date, trade time, price, yield and amount are all identical. We believe theseobservations are real duplicates other than that these reports just randomly happened to bethe same, because we could observe such cases repeatedly for some specific bonds
• Price filtering : We apply both price median filter and price reversal filter. The median filtereliminates any transaction where the price deviates by more than 10% from the daily median,or from a nine-day median centered at the trading day. The price reversal filter eliminates anytransaction with an absolute price change deviating from the lead, lag and average lead/lagprice change by at least 10%.
• Six instruments : The instruments in our database can be grouped into asset backed securi-ties (ABS), corporate bonds, sovereign securities, commercial paper, Bank Negara Malaysiasecurities and medium-term notes. To exclude the impact of differential credit risks, we willfocus only on the Malaysian sovereign bonds and restrict our sample to 6 types of security:BNB, BNMN-DB, BNMN-IDB, BNMN-IDM, GII, and MGS.
44

Appendix Figures and Tables
45
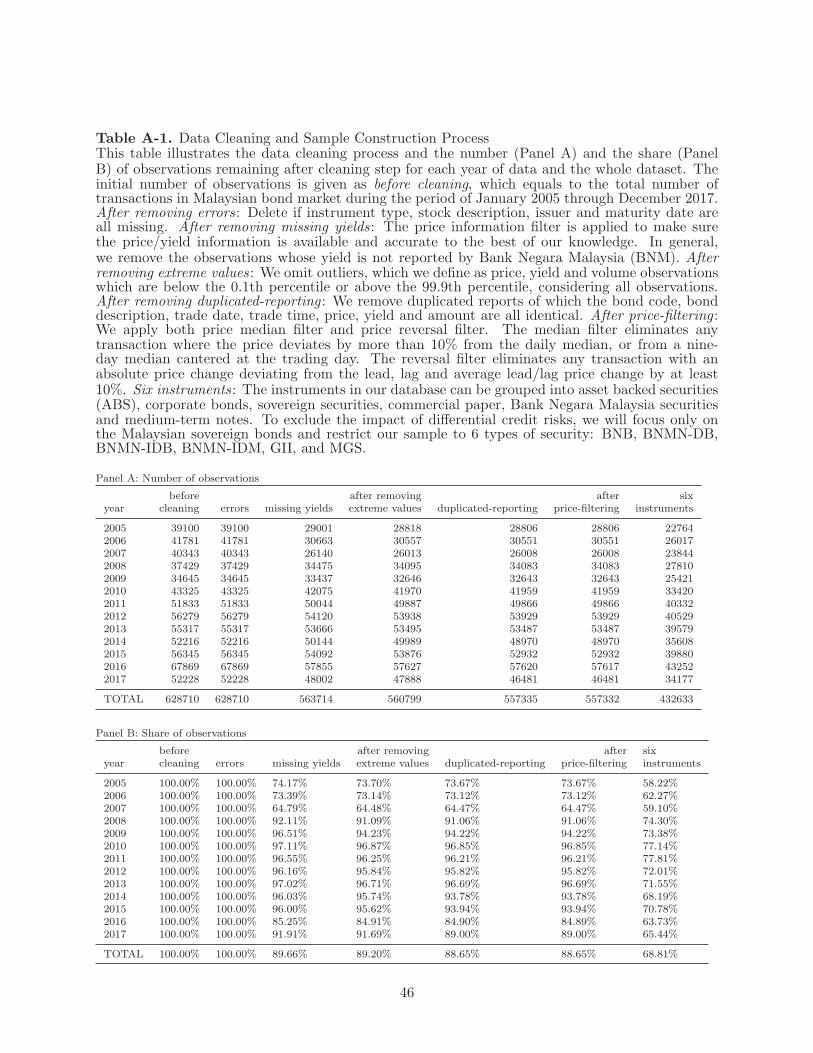
Table A-1. Data Cleaning and Sample Construction ProcessThis table illustrates the data cleaning process and the number (Panel A) and the share (PanelB) of observations remaining after cleaning step for each year of data and the whole dataset. Theinitial number of observations is given as before cleaning, which equals to the total number oftransactions in Malaysian bond market during the period of January 2005 through December 2017.After removing errors: Delete if instrument type, stock description, issuer and maturity date areall missing. After removing missing yields: The price information filter is applied to make surethe price/yield information is available and accurate to the best of our knowledge. In general,we remove the observations whose yield is not reported by Bank Negara Malaysia (BNM). Afterremoving extreme values : We omit outliers, which we define as price, yield and volume observationswhich are below the 0.1th percentile or above the 99.9th percentile, considering all observations.After removing duplicated-reporting : We remove duplicated reports of which the bond code, bonddescription, trade date, trade time, price, yield and amount are all identical. After price-filtering :We apply both price median filter and price reversal filter. The median filter eliminates anytransaction where the price deviates by more than 10% from the daily median, or from a nine-day median cantered at the trading day. The reversal filter eliminates any transaction with anabsolute price change deviating from the lead, lag and average lead/lag price change by at least10%. Six instruments : The instruments in our database can be grouped into asset backed securities(ABS), corporate bonds, sovereign securities, commercial paper, Bank Negara Malaysia securitiesand medium-term notes. To exclude the impact of differential credit risks, we will focus only onthe Malaysian sovereign bonds and restrict our sample to 6 types of security: BNB, BNMN-DB,BNMN-IDB, BNMN-IDM, GII, and MGS.
Panel A: Number of observations
before after removing after sixyear cleaning errors missing yields extreme values duplicated-reporting price-filtering instruments
2005 39100 39100 29001 28818 28806 28806 227642006 41781 41781 30663 30557 30551 30551 260172007 40343 40343 26140 26013 26008 26008 238442008 37429 37429 34475 34095 34083 34083 278102009 34645 34645 33437 32646 32643 32643 254212010 43325 43325 42075 41970 41959 41959 334202011 51833 51833 50044 49887 49866 49866 403322012 56279 56279 54120 53938 53929 53929 405292013 55317 55317 53666 53495 53487 53487 395792014 52216 52216 50144 49989 48970 48970 356082015 56345 56345 54092 53876 52932 52932 398802016 67869 67869 57855 57627 57620 57617 432522017 52228 52228 48002 47888 46481 46481 34177
TOTAL 628710 628710 563714 560799 557335 557332 432633
Panel B: Share of observations
before after removing after sixyear cleaning errors missing yields extreme values duplicated-reporting price-filtering instruments
2005 100.00% 100.00% 74.17% 73.70% 73.67% 73.67% 58.22%2006 100.00% 100.00% 73.39% 73.14% 73.12% 73.12% 62.27%2007 100.00% 100.00% 64.79% 64.48% 64.47% 64.47% 59.10%2008 100.00% 100.00% 92.11% 91.09% 91.06% 91.06% 74.30%2009 100.00% 100.00% 96.51% 94.23% 94.22% 94.22% 73.38%2010 100.00% 100.00% 97.11% 96.87% 96.85% 96.85% 77.14%2011 100.00% 100.00% 96.55% 96.25% 96.21% 96.21% 77.81%2012 100.00% 100.00% 96.16% 95.84% 95.82% 95.82% 72.01%2013 100.00% 100.00% 97.02% 96.71% 96.69% 96.69% 71.55%2014 100.00% 100.00% 96.03% 95.74% 93.78% 93.78% 68.19%2015 100.00% 100.00% 96.00% 95.62% 93.94% 93.94% 70.78%2016 100.00% 100.00% 85.25% 84.91% 84.90% 84.89% 63.73%2017 100.00% 100.00% 91.91% 91.69% 89.00% 89.00% 65.44%
TOTAL 100.00% 100.00% 89.66% 89.20% 88.65% 88.65% 68.81%
46
Internet Appendix
for
“Is there a clientele effect in Islamic bonds? Evidencefrom the Malaysian sovereign bond market”
This Internet Appendix reports the supplementary results and institutional backgroundas described below:
• Internet Appendix A: Supplementary Results of Nelsen-Siegel Three-Factor Model
• Internet Appendix B: Islamic Bonds (Sukuk) and Malaysian Bond Market
• Internet Appendix C: List of Bond Instruments
A. Internet Appendix: Supplementary Results of Nelsen-SiegelThree-Factor Model
In this internet appendix reports some supplementary results of Nelsen-Siegel Three-Factor Model.In Figure IA-1, we plot the time trend of the three estimated factors, based on which we computethe time series mean (median, 25th and 75th of β1t, β2t and β3t from Table 5. In Figure IA-2,we show the fitted yield surfaces (i.e., the collection of the weekly yield curves) for both subsetsof bonds. To clearly differentiate the yield surfaces, in Figure IA-3, we project the yield surfaceonto the “Yield-Time” panel (i.e., by shrinking the “Maturity” axis), which turns out as an areaplot in Figure IA-3. Figure IA-4 takes the difference between the two area plots of the Islamic(Sukuk) and conventional sovereign bonds in Figure IA-3. We can see from Figure IA-4 that duringthe first half of our sample period, both bond subsets show a balanced pattern in terms of theyield spread. However, the Islamic sovereign bonds show consistently higher yields than theirconventional counterparts during the second half of the sample period.
[Insert Figures IA-1 to IA-4 about here]
1
B. Internet Appendix: Islamic Bonds (Sukuk) and Malaysian BondMarket
In contrast to conventional bonds, Islamic bonds have often been referred to as sukuk, an Arabicterm for financial certificates. The objective of Islamic and conventional bond issuance remainsthe same, i.e. to raise the necessary financing for projects. However, as an Islamic finance prod-uct, Sukuk must comply with certain underlying Shariah principles. That is, the funds raised byissuing Sukuk cannot be involved in non-Shariah compliant activities (e.g., gambling, alcohol, porkproduction, etc.) Sukuk are one of the most successful, visible, internationally-issued and acceptedIslamic finance products. Malaysia issued the world’s first Sukuk in 2000 and is currently the largestglobal issuer, with more than half of Sukuk issued worldwide being dominated in Malaysian ringgit(MYR). As shown in Figure IA-5, during the time period from 2001 through 2016, 61% of Sukukissued was dominated in MYR.
[Insert Figure IA-5 about here]
The Malaysian bond market is predominantly traded by institutional investors. Both Islamicand conventional bonds are open to foreign investors, who serve as important players in theMalaysian bond market. Figure IA-6 shows a significant increase in foreign holdings relative tothe total amount outstanding in the Malaysian sovereign bond market. The foreign holdings areat the same level with the holdings of domestic financial and social security institutions.
[Insert Figure IA-6 about here]
According to AsianBondsOnline, the Malaysian bond market is the third largest bond market inthe Asia-Pacific region (ex-Japan). This is due to its increasing issuance volume, growing marketsize, and active trading activities. As can be seen from Figure IA-7, the issuance of Malaysianlocal currency (LCY) sovereign bonds increased steadily increased from US$4.75 billion in 2000 toUS$156.46 billion in 2012. As of the end-March 2017, the total size of the Malaysian bond marketwas US$273 billion, peaking at US$329 billion in September 2014, which is close to 100% of theGDP of Malaysia. Figure IA-8 presents the yearly average of outstanding Malaysian LCY bonds inUSD billions and a percentage of national GDP, respectively. As seen from Figure IA-9, Malaysiahas progressively developed into an active Asian bond market since 2000. It witnessed its mostdynamic year in 2011 with sovereign bond trading volumes reaching USD$553.64 billion in total,and achieving an average turnover ratio of 0.83. The latter is a form of activity or liquidity measure,reflecting the frequency at which outstanding issues are traded in the market, i.e., the traded bondvalue divided by the outstanding bond value. In general, Malaysian sovereign bonds dominate thelocal currency bond market.
[Insert Figures IA-7 to IA-9 about here]
Nevertheless, the Malaysian sovereign bond market is active in both Islamic and conventionalbonds. According to the Malaysian International Islamic Financial Centre (MIFC), Sukuk bondsrepresent a substantial portion (around 50%) of sovereign new issuance. In Malaysia, Islamicsovereign bonds are similar to conventional sovereign bonds in terms of the effective cash flows,issuance structure and legal status. Table IA-1 provides a comparison between two specific typesof Islamic and conventional sovereign bonds. Malaysian Government Securities (MGS), which are
2
conventional bond issues, and its Islamic principles variant, Government Investment Issue (GII),are both long-term bonds issued by the government of Malaysia. According to local financialinstitutions, there are no substantial tax differences between them. However, GII, which are cappedat 10 years, have relatively shorter maturities than MGS, which are capped at 20 years. In addition,GII (MYR1000 million) also have a higher threshold for the minimal issuance amount than MGS(MYR500 million).
[Insert Table IA-1 about here]
Although GII is defined by Bank Negara Malaysia (BNM) as “long-term non-interest-bearingGovernment securities based on Islamic principles issued by the Government of Malaysia for fundingdevelopmental expenditure,” the cash flow structure is indeed the same as that of MGS. Oneimportant concept in Islamic finance is the “sell and buy back” agreement, based on which “theGovernment will sell specified nominal value of its assets and subsequently will buy back the assetsat its nominal value plus profit through a tender process.” The “profit” in GII is, economically, nodifferent than the “interest” in MGS when viewed in terms of repaying money to investors. As aconsequence, MGS and GII are two specific types of sovereign bond instruments.
3

C.
Intern
etAppendix:ListofBond
Instru
ments
4
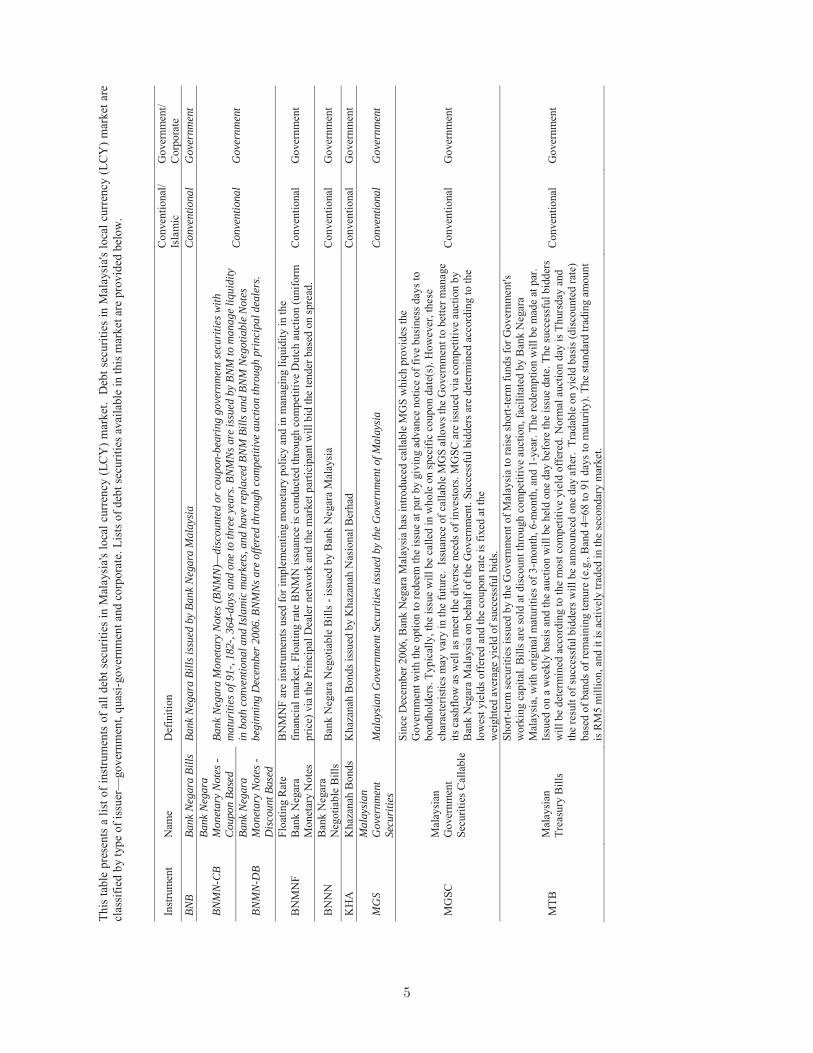
This
tabl
e pr
esen
ts a
list
of i
nstru
men
ts o
f all
debt
sec
uriti
es in
Mal
aysi
a's lo
cal c
urre
ncy
(LC
Y) m
arke
t. D
ebt s
ecur
ities
in M
alay
sia's
loca
l cur
renc
y (L
CY
) mar
ket a
re
clas
sifie
d by
type
of i
ssue
r—go
vern
men
t, qu
asi-g
over
nmen
t and
cor
pora
te. L
ists
of d
ebt s
ecur
ities
ava
ilabl
e in
this
mar
ket a
re p
rovi
ded
belo
w.
Inst
rum
ent
Nam
e D
efin
ition
C
onve
ntio
nal/
Isla
mic
G
over
nmen
t/ C
orpo
rate
BN
B Ba
nk N
egar
a Bi
lls
Bank
Neg
ara
Bills
issu
ed b
y Ba
nk N
egar
a M
alay
sia
Con
vent
iona
l G
over
nmen
t
BNM
N-C
B Ba
nk N
egar
a M
onet
ary
Not
es -
Cou
pon
Base
d Ba
nk N
egar
a M
onet
ary
Not
es (B
NM
N)—
disc
ount
ed o
r cou
pon-
bear
ing
gove
rnm
ent s
ecur
ities
with
m
atur
ities
of 9
1-, 1
82-,
364-
days
and
one
to th
ree
year
s. BN
MN
s are
issu
ed b
y BN
M to
man
age
liqui
dity
in
bot
h co
nven
tiona
l and
Isla
mic
mar
kets
, and
hav
e re
plac
ed B
NM
Bill
s and
BNM
Neg
otia
ble
Not
es
begi
nnin
g D
ecem
ber 2
006.
BN
MN
s are
offe
red
thro
ugh
com
petit
ive
auct
ion
thro
ugh
prin
cipa
l dea
lers
.
Con
vent
iona
l G
over
nmen
t
BNM
N-D
B Ba
nk N
egar
a M
onet
ary
Not
es -
Dis
coun
t Bas
ed
BN
MN
F Fl
oatin
g R
ate
Ban
k N
egar
a M
onet
ary
Not
es
BN
MN
F ar
e in
stru
men
ts u
sed
for i
mpl
emen
ting
mon
etar
y po
licy
and
in m
anag
ing
liqui
dity
in th
e fin
anci
al m
arke
t. Fl
oatin
g ra
te B
NM
N is
suan
ce is
con
duct
ed th
roug
h co
mpe
titiv
e D
utch
auc
tion
(uni
form
pr
ice)
via
the
Prin
cipa
l Dea
ler n
etw
ork
and
the
mar
ket p
artic
ipan
t will
bid
the
tend
er b
ased
on
spre
ad.
Con
vent
iona
l G
over
nmen
t
BN
NN
B
ank
Neg
ara
Neg
otia
ble
Bill
s B
ank
Neg
ara
Neg
otia
ble
Bill
s - is
sued
by
Ban
k N
egar
a M
alay
sia
Con
vent
iona
l G
over
nmen
t
KH
A
Kha
zana
h B
onds
K
haza
nah
Bon
ds is
sued
by
Kha
zana
h N
asio
nal B
erha
d C
onve
ntio
nal
Gov
ernm
ent
MG
S M
alay
sian
G
over
nmen
t Se
curi
ties
Mal
aysi
an G
over
nmen
t Sec
uriti
es is
sued
by
the
Gov
ernm
ent o
f Mal
aysi
a C
onve
ntio
nal
Gov
ernm
ent
MG
SC
Mal
aysi
an
Gov
ernm
ent
Secu
ritie
s Cal
labl
e
Sinc
e D
ecem
ber 2
006,
Ban
k N
egar
a M
alay
sia
has i
ntro
duce
d ca
llabl
e M
GS
whi
ch p
rovi
des t
he
Gov
ernm
ent w
ith th
e op
tion
to re
deem
the
issu
e at
par
by
givi
ng a
dvan
ce n
otic
e of
five
bus
ines
s day
s to
bond
hold
ers.
Typi
cally
, the
issu
e w
ill b
e ca
lled
in w
hole
on
spec
ific
coup
on d
ate(
s). H
owev
er, t
hese
ch
arac
teris
tics m
ay v
ary
in th
e fu
ture
. Is
suan
ce o
f cal
labl
e M
GS
allo
ws t
he G
over
nmen
t to
bette
r man
age
its c
ashf
low
as w
ell a
s mee
t the
div
erse
nee
ds o
f inv
esto
rs. M
GSC
are
issu
ed v
ia c
ompe
titiv
e au
ctio
n by
B
ank
Neg
ara
Mal
aysi
a on
beh
alf o
f the
Gov
ernm
ent.
Succ
essf
ul b
idde
rs a
re d
eter
min
ed a
ccor
ding
to th
e lo
wes
t yie
lds o
ffer
ed a
nd th
e co
upon
rate
is fi
xed
at th
e w
eigh
ted
aver
age
yiel
d of
succ
essf
ul b
ids.
Con
vent
iona
l G
over
nmen
t
MTB
M
alay
sian
Tr
easu
ry B
ills
Shor
t-ter
m se
curit
ies i
ssue
d by
the
Gov
ernm
ent o
f Mal
aysi
a to
rais
e sh
ort-t
erm
fund
s for
Gov
ernm
ent's
w
orki
ng c
apita
l. Bi
lls a
re so
ld a
t dis
coun
t thr
ough
com
petit
ive
auct
ion,
faci
litat
ed b
y B
ank
Neg
ara
Mal
aysi
a, w
ith o
rigin
al m
atur
ities
of 3
-mon
th, 6
-mon
th, a
nd 1
-yea
r. Th
e re
dem
ptio
n w
ill b
e m
ade
at p
ar.
Issu
ed o
n a
wee
kly
basi
s and
the
auct
ion
will
be
held
one
day
bef
ore
the
issu
e da
te. T
he su
cces
sful
bid
ders
w
ill b
e de
term
ined
acc
ordi
ng to
the
mos
t com
petit
ive
yiel
d of
fere
d. N
orm
al a
uctio
n da
y is
Thu
rsda
y an
d th
e re
sult
of su
cces
sful
bid
ders
will
be
anno
unce
d on
e da
y af
ter.
Tra
dabl
e on
yie
ld b
asis
(disc
ount
ed ra
te)
base
d of
ban
ds o
f rem
aini
ng te
nure
(e.g
., B
and
4=68
to 9
1 da
ys to
mat
urity
). Th
e st
anda
rd tr
adin
g am
ount
is
RM
5 m
illio
n, a
nd it
is a
ctiv
ely
trade
d in
the
seco
ndar
y m
arke
t.
Con
vent
iona
l G
over
nmen
t
5
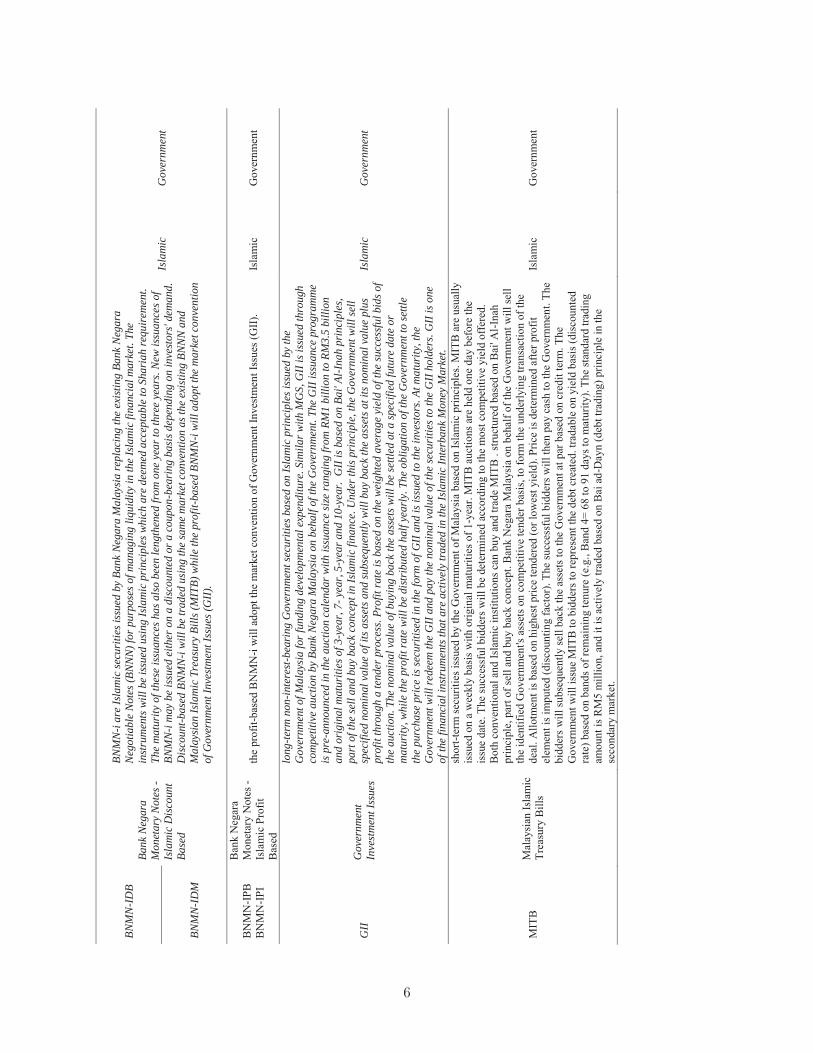
BNM
N-I
DB
Ba
nk N
egar
a M
onet
ary
Not
es -
Isla
mic
Dis
coun
t Ba
sed
BNM
N-i
are
Isla
mic
secu
ritie
s iss
ued
by B
ank
Nega
ra M
alay
sia
repl
acin
g th
e ex
istin
g Ba
nk N
egar
a N
egot
iabl
e N
otes
(BN
NN
) for
pur
pose
s of m
anag
ing
liqui
dity
in th
e Is
lam
ic fi
nanc
ial m
arke
t. Th
e in
stru
men
ts w
ill b
e iss
ued
usin
g Is
lam
ic p
rinc
iple
s whi
ch a
re d
eem
ed a
ccep
tabl
e to
Sha
riah
requ
irem
ent.
The
mat
urity
of t
hese
issu
ance
s has
als
o be
en le
ngth
ened
from
one
yea
r to
thre
e ye
ars.
New
issu
ance
s of
BNM
N-i
may
be
issue
d ei
ther
on
a di
scou
nted
or a
cou
pon-
bear
ing
basi
s dep
endi
ng o
n in
vest
ors'
dem
and.
D
isco
unt -b
ased
BN
MN
-i w
ill b
e tr
aded
usi
ng th
e sa
me
mar
ket c
onve
ntio
n as
the
exis
ting
BNN
N a
nd
Mal
aysi
an Is
lam
ic T
reas
ury
Bills
(MIT
B) w
hile
the
prof
it-ba
sed
BNM
N-i
will
ado
pt th
e m
arke
t con
vent
ion
of G
over
nmen
t Inv
estm
ent I
ssue
s (G
II).
Isla
mic
G
over
nmen
t
BNM
N-I
DM
BN
MN
-IPB
B
NM
N-IP
I
Ban
k N
egar
a M
onet
ary
Not
es -
Isla
mic
Pro
fit
Bas
ed
the
prof
it-ba
sed
BN
MN
-i w
ill a
dopt
the
mar
ket c
onve
ntio
n of
Gov
ernm
ent I
nves
tmen
t Iss
ues (
GII)
. Is
lam
ic
Gov
ernm
ent
GII
G
over
nmen
t In
vest
men
t Iss
ues
long
-term
non
-inte
rest
-bea
ring
Gov
ernm
ent s
ecur
ities
bas
ed o
n Is
lam
ic p
rinc
iple
s iss
ued
by th
e G
over
nmen
t of M
alay
sia
for f
undi
ng d
evel
opm
enta
l exp
endi
ture
. Sim
ilar w
ith M
GS,
GII
is is
sued
thro
ugh
com
petit
ive
auct
ion
by B
ank
Neg
ara
Mal
aysi
a on
beh
alf o
f the
Gov
ernm
ent.
The
GII
issu
ance
pro
gram
me
is p
re-a
nnou
nced
in th
e au
ctio
n ca
lend
ar w
ith is
suan
ce si
ze ra
ngin
g fr
om R
M1
billi
on to
RM
3.5
billi
on
and
orig
inal
mat
uriti
es o
f 3-y
ear,
7- y
ear,
5-ye
ar a
nd 1
0-ye
ar.
GII
is b
ased
on
Bai'
Al-I
nah
prin
cipl
es,
part
of t
he se
ll an
d bu
y ba
ck c
once
pt in
Isla
mic
fina
nce.
Und
er th
is p
rinc
iple
, the
Gov
ernm
ent w
ill se
ll sp
ecifi
ed n
omin
al v
alue
of i
ts a
sset
s and
subs
eque
ntly
will
buy
bac
k th
e as
sets
at i
ts n
omin
al v
alue
plu
s pr
ofit
thro
ugh
a te
nder
pro
cess
. Pro
fit ra
te is
bas
ed o
n th
e w
eigh
ted
aver
age
yiel
d of
the
succ
essf
ul b
ids o
f th
e au
ctio
n. T
he n
omin
al v
alue
of b
uyin
g ba
ck th
e as
sets
will
be
settl
ed a
t a sp
ecifi
ed fu
ture
dat
e or
m
atur
ity, w
h ile
the
prof
it ra
te w
ill b
e di
stri
bute
d ha
lf ye
arly
. The
obl
igat
ion
of th
e G
over
nmen
t to
settl
e th
e pu
rcha
se p
rice
is se
curit
ised
in th
e fo
rm o
f GII
and
is is
sued
to th
e in
vest
ors.
At m
atur
ity, t
he
Gov
ernm
ent w
ill re
deem
the
GII
and
pay
the
nom
inal
val
ue o
f the
secu
ritie
s to
the
GII
hol
ders
. GII
is o
ne
of th
e fin
anci
al in
stru
men
ts th
at a
re a
ctiv
ely
trade
d in
the
Isla
mic
Inte
rban
k M
oney
Mar
ket.
Isla
mic
G
over
nmen
t
MIT
B
Mal
aysi
an Is
lam
ic
Trea
sury
Bill
s
shor
t-ter
m se
curit
ies i
ssue
d by
the
Gov
ernm
ent o
f Mal
aysi
a ba
sed
on Is
lam
ic p
rinci
ples
. MIT
B a
re u
sual
ly
issu
ed o
n a
wee
kly
basi
s with
orig
inal
mat
uriti
es o
f 1-y
ear.
MIT
B a
uctio
ns a
re h
eld
one
day
befo
re th
e is
sue
date
. The
succ
essf
ul b
idde
rs w
ill b
e de
term
ined
acc
ordi
ng to
the
mos
t com
petit
ive
yiel
d of
fere
d.
Bo t
h co
nven
tiona
l and
Isla
mic
inst
itutio
ns c
an b
uy a
nd tr
ade
MIT
B .
stru
ctur
ed b
ased
on
Bai
' Al-I
nah
prin
cipl
e, p
art o
f sel
l and
buy
bac
k co
ncep
t. B
ank
Neg
ara
Mal
aysi
a on
beh
alf o
f the
Gov
ernm
ent w
ill se
ll th
e id
entif
ied
Gov
ernm
ent's
ass
ets o
n co
mpe
titiv
e te
nder
bas
is, t
o fo
rm th
e un
derly
ing
trans
actio
n of
the
deal
. Allo
tmen
t is b
ased
on
high
est p
rice
tend
ered
(or l
owes
t yie
ld).
Pric
e is
det
erm
ined
afte
r pro
fit
elem
ent i
s im
pute
d (d
isco
untin
g fa
ctor
). Th
e su
cces
sful
bid
ders
will
then
pay
cas
h to
the
Gov
ernm
ent.
The
bidd
ers w
ill su
bseq
uent
ly se
ll ba
ck th
e as
sets
to th
e G
over
nmen
t at p
ar b
ased
on
cred
it te
rm. T
he
Gov
ernm
ent w
ill is
sue
MIT
B to
bid
ders
to re
pres
ent t
he d
ebt c
reat
ed. t
rada
ble
on y
ield
bas
is (d
isco
unte
d ra
te) b
ased
on
band
s of r
emai
ning
tenu
re (e
.g.,
Ban
d 4=
68
to 9
1 da
ys to
mat
urity
). Th
e st
anda
rd tr
adin
g am
ount
is R
M5
mill
ion,
and
it is
act
ivel
y tra
ded
base
d on
Bai
ad -
Day
n (d
ebt t
radi
ng) p
rinci
ple
in th
e se
cond
ary
mar
ket.
Isla
mic
G
over
nmen
t
6
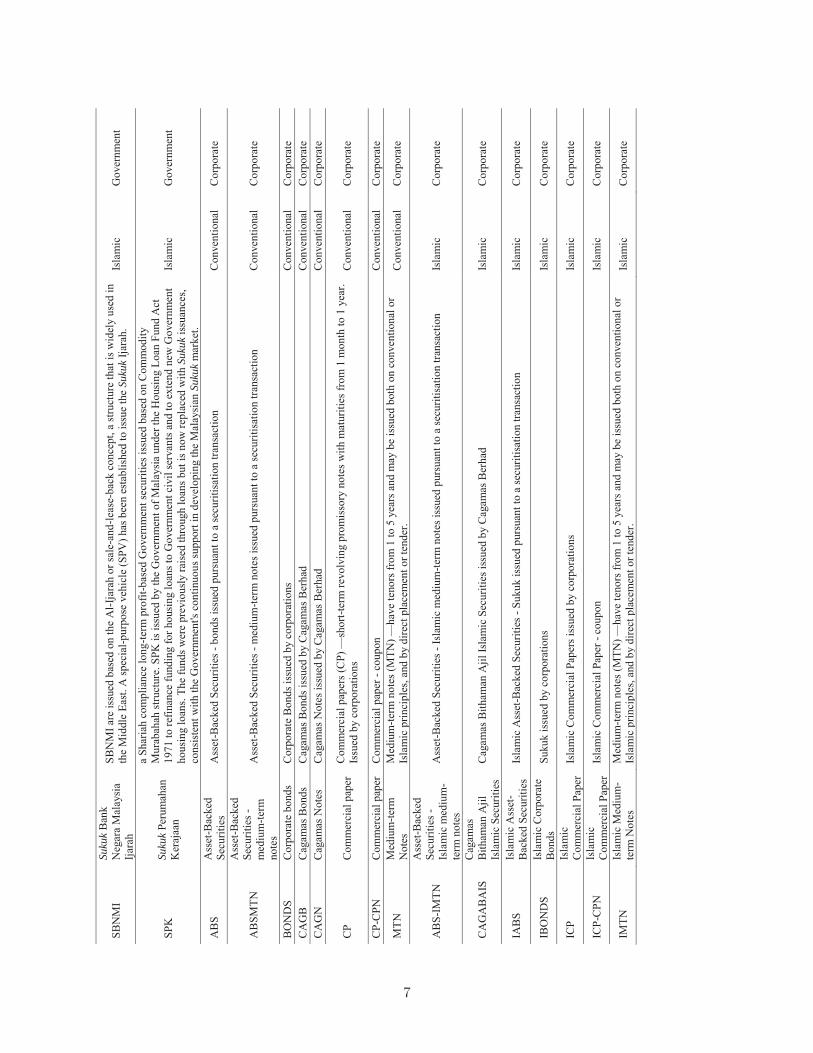
SBN
MI
Suku
k B
ank
Neg
ara
Mal
aysi
a Ija
rah
SBN
MI a
re is
sued
bas
ed o
n th
e A
l-Ija
rah
or sa
le-a
nd-le
ase-
back
con
cept
, a st
ruct
ure
that
is w
idel
y us
ed in
th
e M
iddl
e Ea
st. A
spec
ial -p
urpo
se v
ehic
le (S
PV) h
as b
een
esta
blis
hed
to is
sue
the
Suku
k Ija
rah.
Is
lam
ic
Gov
ernm
ent
SPK
Su
kuk
Peru
mah
an
Ker
ajaa
n
a Sh
aria
h co
mpl
ianc
e lo
ng-te
rm p
rofit
-bas
ed G
over
nmen
t sec
uriti
es is
sued
bas
ed o
n C
omm
odity
M
urab
ahah
stru
ctur
e. S
PK is
issu
ed b
y th
e G
over
nmen
t of M
alay
sia u
nder
the
Hou
sing
Loa
n Fu
nd A
ct
1971
to re
finan
ce fu
ndin
g fo
r hou
sing
loan
s to
Gov
ernm
ent c
ivil
serv
ants
and
to e
xten
d ne
w G
over
nmen
t ho
usin
g lo
ans.
The
fund
s wer
e pr
evio
usly
rais
ed th
roug
h lo
ans b
ut is
now
repl
aced
with
Suk
uk is
suan
ces,
cons
iste
nt w
ith th
e G
over
nmen
t's c
ontin
uous
supp
ort i
n de
velo
ping
the
Mal
aysi
an S
ukuk
mar
ket.
Isla
mic
G
over
nmen
t
AB
S A
sset
-Bac
ked
Secu
ritie
s A
sset
-Bac
ked
Secu
ritie
s - b
onds
issu
ed p
ursu
ant t
o a
secu
ritis
atio
n tra
nsac
tion
Con
vent
iona
l C
orpo
rate
AB
SMTN
Ass
et-B
acke
d Se
curit
ies -
m
ediu
m-te
rm
note
s
Ass
et-B
acke
d Se
curit
ies -
med
ium
-term
not
es is
sued
pur
suan
t to
a se
curit
isat
ion
trans
actio
n C
onve
ntio
nal
Cor
pora
te
BO
ND
S C
orpo
rate
bon
ds
Cor
pora
te B
onds
issu
ed b
y co
rpor
atio
ns
Con
vent
iona
l C
orpo
rate
C
AG
B
Cag
amas
Bon
ds
Cag
amas
Bon
ds is
sued
by
Cag
amas
Ber
had
Con
vent
iona
l C
orpo
rate
C
AG
N
Cag
amas
Not
es
Cag
amas
Not
es is
sued
by
Cag
amas
Ber
had
Con
vent
iona
l C
orpo
rate
CP
Com
mer
cial
pap
er
Com
mer
cial
pap
ers (
CP)
—sh
ort-t
erm
revo
lvin
g pr
omis
sory
not
es w
ith m
atur
ities
from
1 m
onth
to 1
yea
r. Is
sued
by
corp
orat
ions
C
onve
ntio
nal
Cor
pora
te
CP-
CPN
C
omm
erci
al p
aper
C
omm
erci
al p
aper
- co
upon
C
onve
ntio
nal
Cor
pora
te
MTN
M
ediu
m-te
rm
Not
es
Med
ium
-term
not
es (M
TN) —
have
teno
rs fr
om 1
to 5
yea
rs a
nd m
ay b
e is
sued
bot
h on
con
vent
iona
l or
Isla
mic
prin
cipl
es, a
nd b
y di
rect
pla
cem
ent o
r ten
der.
Con
vent
iona
l C
orpo
rate
AB
S-IM
TN
Ass
et-B
acke
d Se
curit
ies -
Is
lam
ic m
ediu
m-
term
not
es
Ass
et-B
acke
d Se
curit
ies -
Isla
mic
med
ium
-term
not
es is
sued
pur
suan
t to
a se
curit
isat
ion
trans
actio
n Is
lam
ic
Cor
pora
te
CA
GA
BA
IS
Cag
amas
B
itham
an A
jil
Isla
mic
Sec
uriti
es
Cag
amas
Bith
aman
Ajil
Isla
mic
Sec
uriti
es is
sued
by
Cag
amas
Ber
had
Is
lam
ic
Cor
pora
te
IAB
S Is
lam
ic A
sset
-B
acke
d Se
curit
ies
Isla
mic
Ass
et-B
acke
d Se
curit
ies -
Suk
uk is
sued
pur
suan
t to
a se
curit
isat
ion
trans
actio
n Is
lam
ic
Cor
pora
te
IBO
ND
S Is
lam
ic C
orpo
rate
B
onds
Su
kuk
issu
ed b
y co
rpor
atio
ns
Isla
mic
C
orpo
rate
ICP
Isla
mic
C
omm
erci
al P
aper
Is
lam
ic C
omm
erci
al P
aper
s iss
ued
by c
orpo
ratio
ns
Isla
mic
C
orpo
rate
ICP-
CPN
Is
lam
ic
Com
mer
cial
Pap
er
Isla
mic
Com
mer
cial
Pap
er -
coup
on
Isla
mic
C
orpo
rate
IMTN
Is
lam
ic M
ediu
m-
term
Not
es
Med
ium
-term
not
es (M
TN) —
have
teno
rs fr
om 1
to 5
yea
rs a
nd m
ay b
e is
sued
bot
h on
con
vent
iona
l or
Isla
mic
prin
cipl
es, a
nd b
y di
rect
pla
cem
ent o
r ten
der.
Isla
mic
C
orpo
rate
7
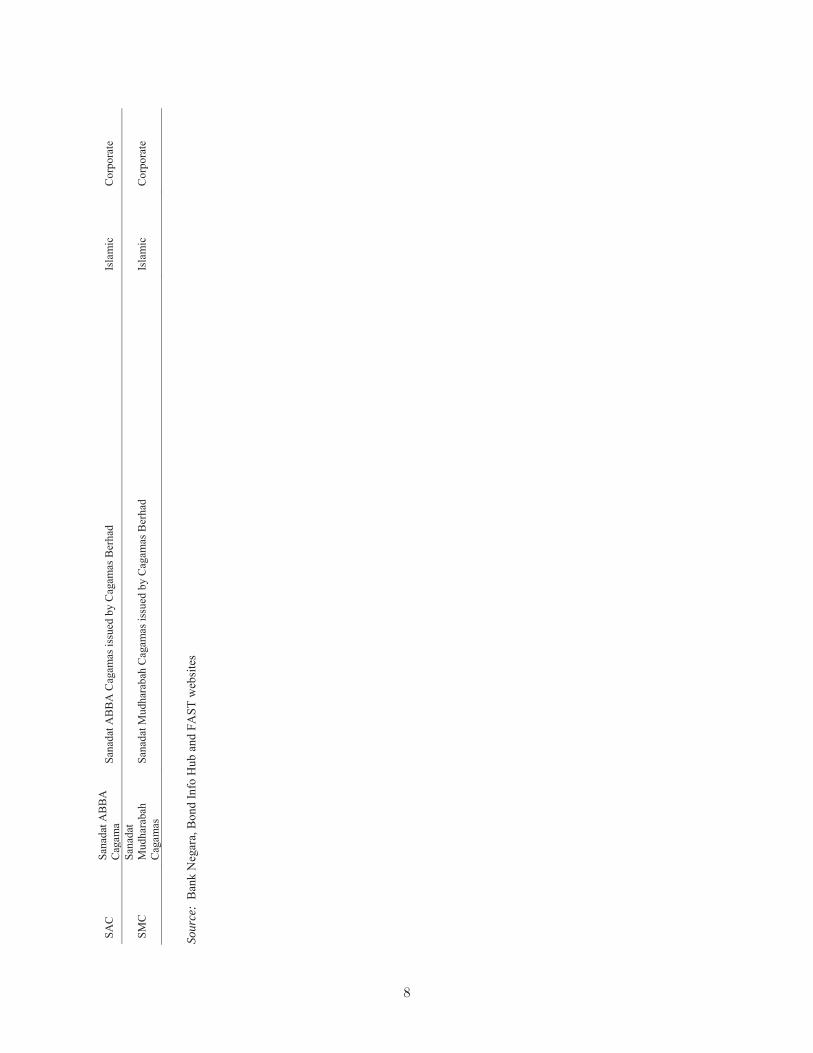
SAC
Sa
nada
t AB
BA
C
agam
a Sa
nada
t AB
BA
Cag
amas
issu
ed b
y C
agam
as B
erha
d
Isla
mic
C
orpo
rate
SMC
Sa
nada
t M
udha
raba
h C
agam
as
Sana
dat M
udha
raba
h C
agam
as is
sued
by
Cag
amas
Ber
had
Isla
mic
C
orpo
rate
Sour
ce:
Ban
k N
egar
a, B
ond
Info
Hub
and
FA
ST w
ebsi
tes
8

Internet Appendix Figures and Tables
9
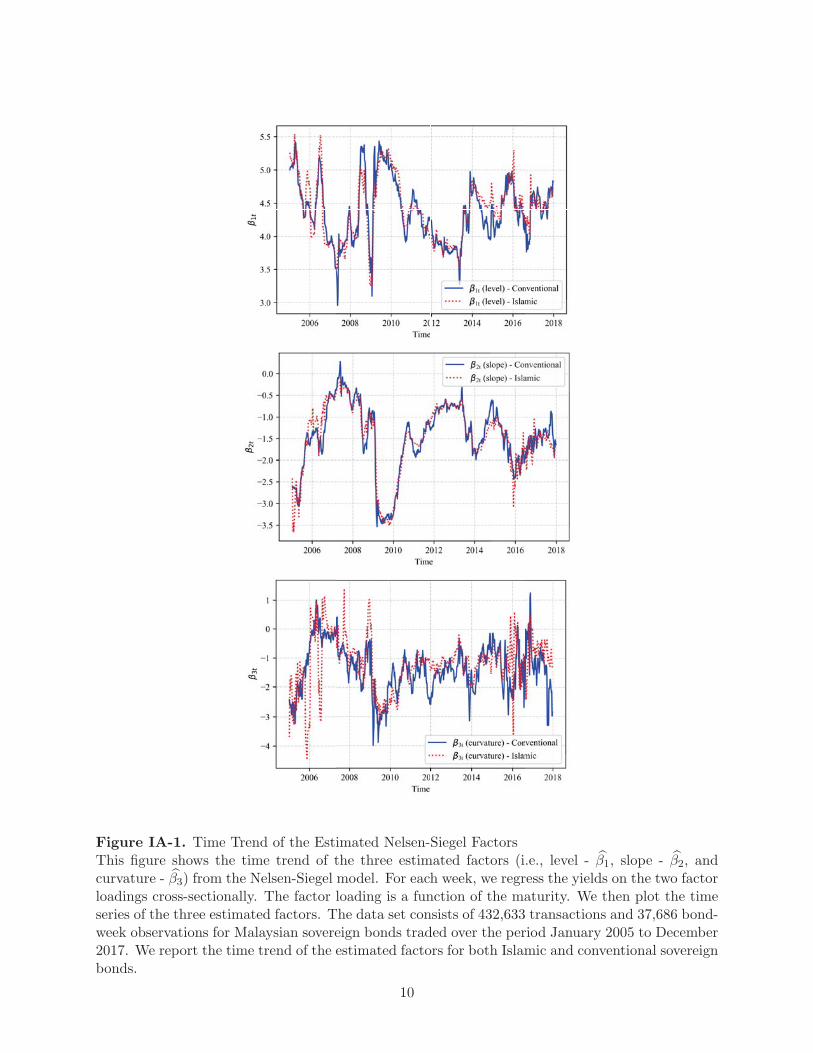
Figure IA-1. Time Trend of the Estimated Nelsen-Siegel FactorsThis figure shows the time trend of the three estimated factors (i.e., level - β1, slope - β2, andcurvature - β3) from the Nelsen-Siegel model. For each week, we regress the yields on the two factorloadings cross-sectionally. The factor loading is a function of the maturity. We then plot the timeseries of the three estimated factors. The data set consists of 432,633 transactions and 37,686 bond-week observations for Malaysian sovereign bonds traded over the period January 2005 to December2017. We report the time trend of the estimated factors for both Islamic and conventional sovereignbonds.
10
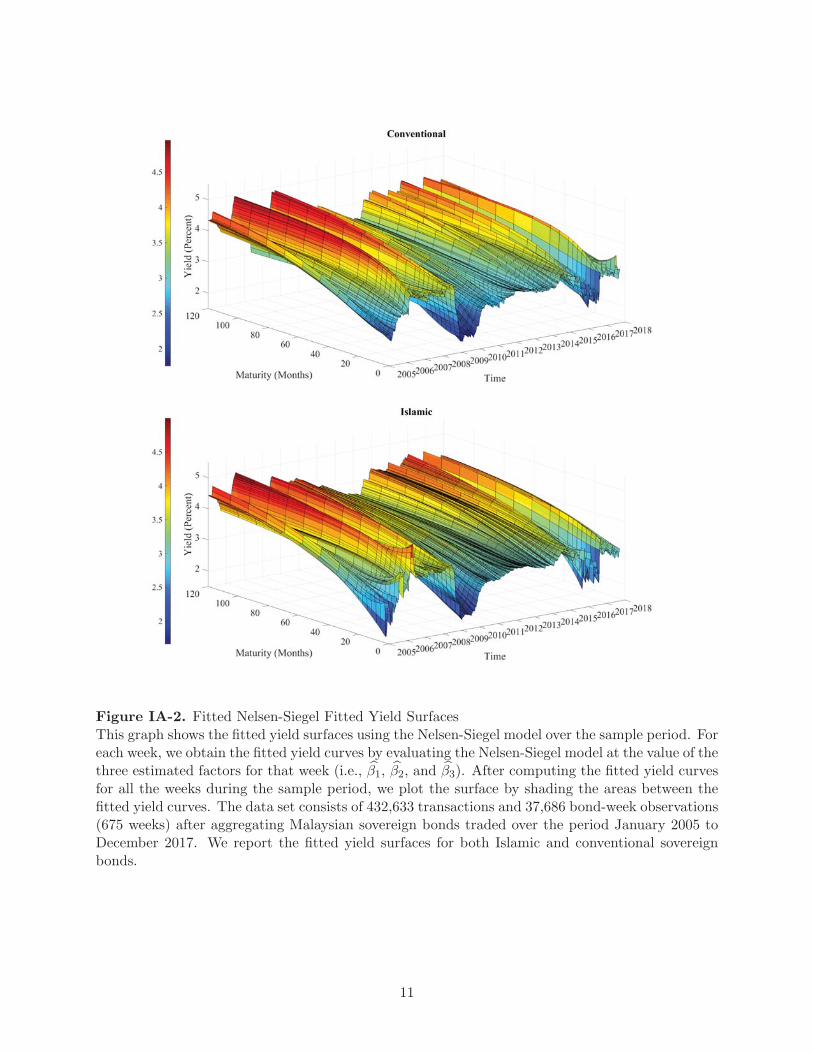
Figure IA-2. Fitted Nelsen-Siegel Fitted Yield SurfacesThis graph shows the fitted yield surfaces using the Nelsen-Siegel model over the sample period. Foreach week, we obtain the fitted yield curves by evaluating the Nelsen-Siegel model at the value of thethree estimated factors for that week (i.e., β1, β2, and β3). After computing the fitted yield curvesfor all the weeks during the sample period, we plot the surface by shading the areas between thefitted yield curves. The data set consists of 432,633 transactions and 37,686 bond-week observations(675 weeks) after aggregating Malaysian sovereign bonds traded over the period January 2005 toDecember 2017. We report the fitted yield surfaces for both Islamic and conventional sovereignbonds.
11
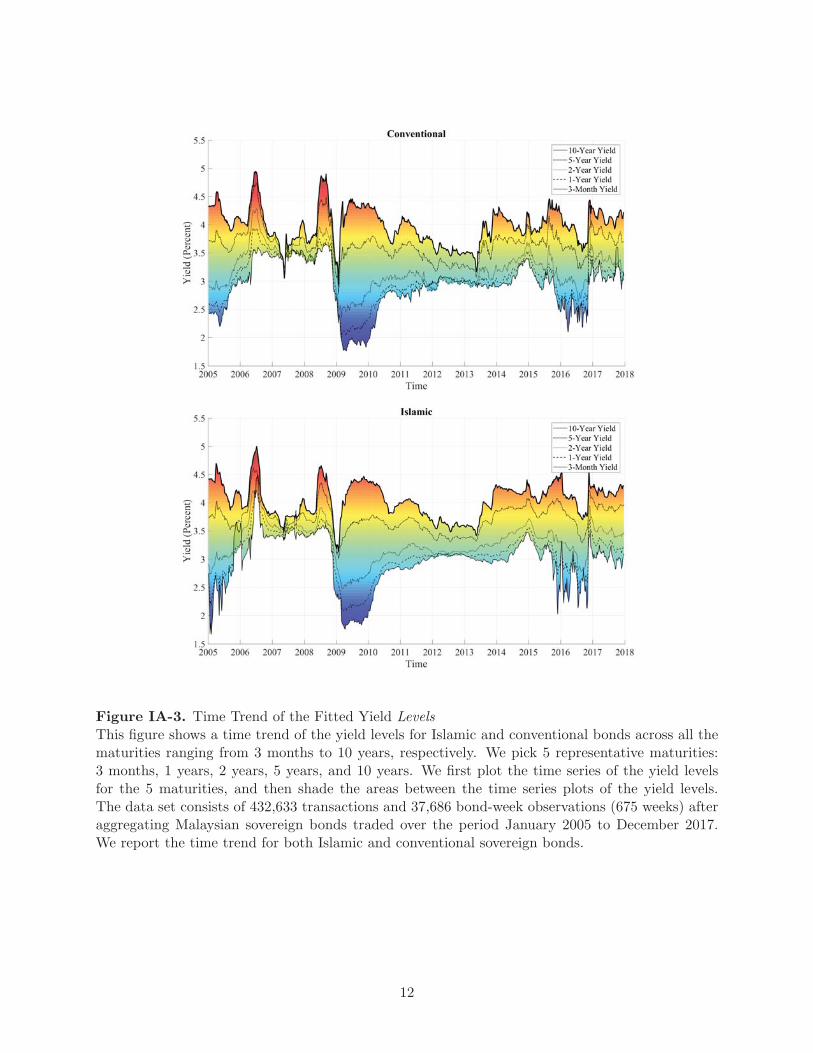
Figure IA-3. Time Trend of the Fitted Yield LevelsThis figure shows a time trend of the yield levels for Islamic and conventional bonds across all thematurities ranging from 3 months to 10 years, respectively. We pick 5 representative maturities:3 months, 1 years, 2 years, 5 years, and 10 years. We first plot the time series of the yield levelsfor the 5 maturities, and then shade the areas between the time series plots of the yield levels.The data set consists of 432,633 transactions and 37,686 bond-week observations (675 weeks) afteraggregating Malaysian sovereign bonds traded over the period January 2005 to December 2017.We report the time trend for both Islamic and conventional sovereign bonds.
12
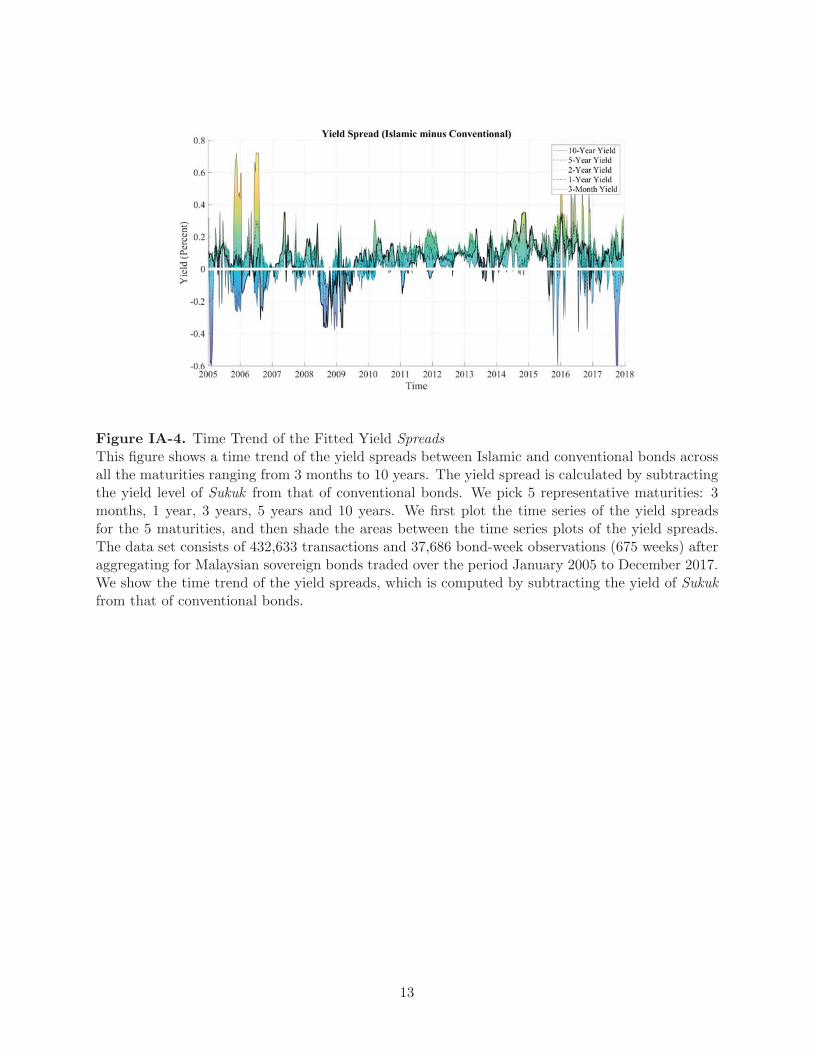
Figure IA-4. Time Trend of the Fitted Yield SpreadsThis figure shows a time trend of the yield spreads between Islamic and conventional bonds acrossall the maturities ranging from 3 months to 10 years. The yield spread is calculated by subtractingthe yield level of Sukuk from that of conventional bonds. We pick 5 representative maturities: 3months, 1 year, 3 years, 5 years and 10 years. We first plot the time series of the yield spreadsfor the 5 maturities, and then shade the areas between the time series plots of the yield spreads.The data set consists of 432,633 transactions and 37,686 bond-week observations (675 weeks) afteraggregating for Malaysian sovereign bonds traded over the period January 2005 to December 2017.We show the time trend of the yield spreads, which is computed by subtracting the yield of Sukukfrom that of conventional bonds.
13

Figure
IA-5.SukukIssuance
byCurrency
andMarket
SizebyRegion
Thesetw
opie
chartsshow
thehistoricalSukukissuance
volumebycu
rren
cyandSukukoutstandingbyregion,respectively.
The
periodcovers
threeyears
from
2001through2016.
14
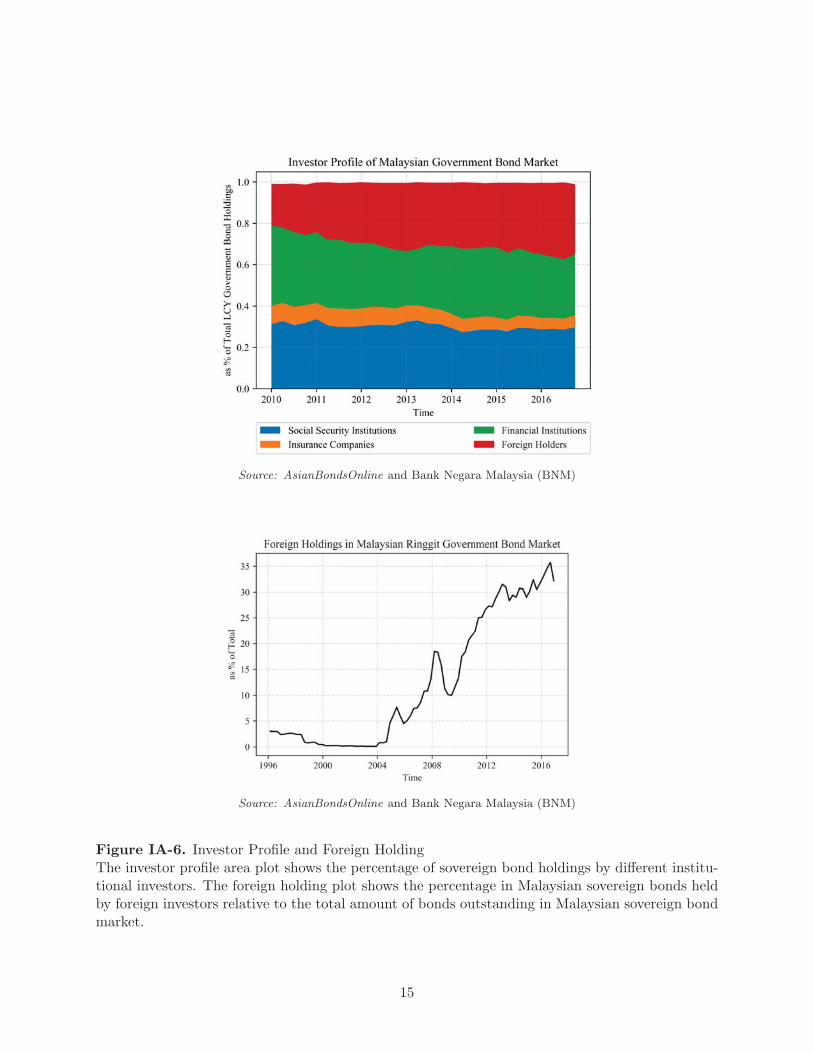
Source: AsianBondsOnline and Bank Negara Malaysia (BNM)
Source: AsianBondsOnline and Bank Negara Malaysia (BNM)
Figure IA-6. Investor Profile and Foreign HoldingThe investor profile area plot shows the percentage of sovereign bond holdings by different institu-tional investors. The foreign holding plot shows the percentage in Malaysian sovereign bonds heldby foreign investors relative to the total amount of bonds outstanding in Malaysian sovereign bondmarket.
15
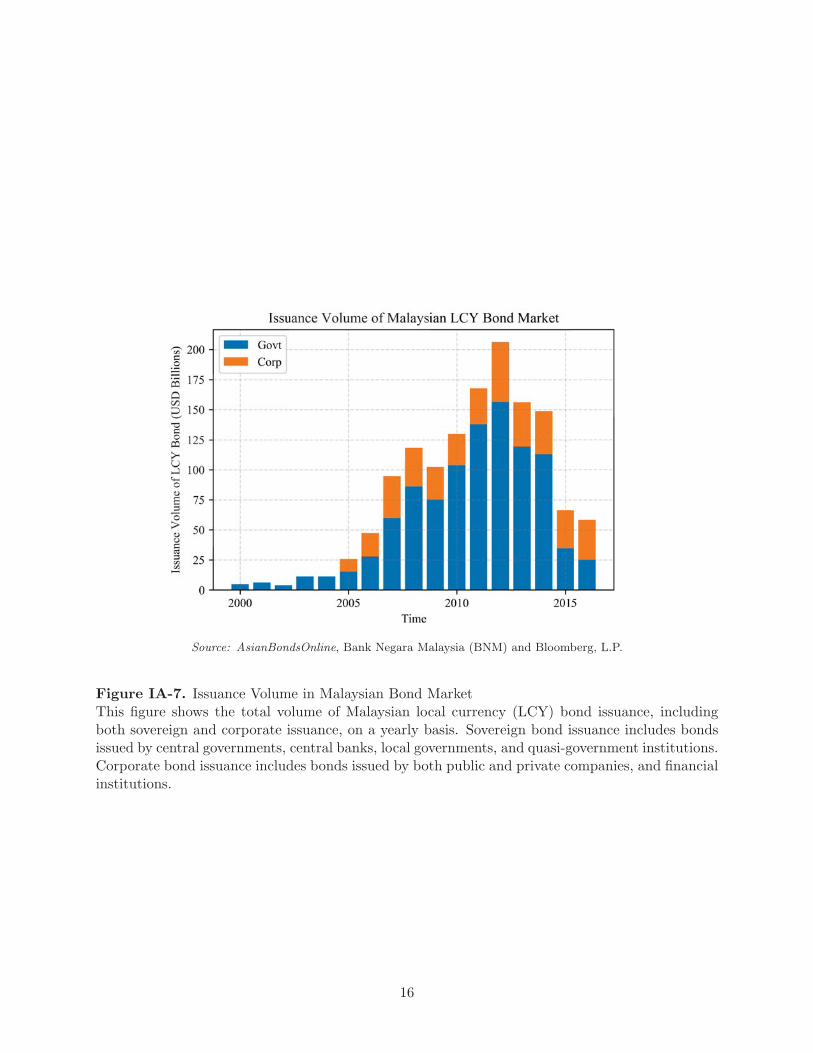
Source: AsianBondsOnline, Bank Negara Malaysia (BNM) and Bloomberg, L.P.
Figure IA-7. Issuance Volume in Malaysian Bond MarketThis figure shows the total volume of Malaysian local currency (LCY) bond issuance, includingboth sovereign and corporate issuance, on a yearly basis. Sovereign bond issuance includes bondsissued by central governments, central banks, local governments, and quasi-government institutions.Corporate bond issuance includes bonds issued by both public and private companies, and financialinstitutions.
16
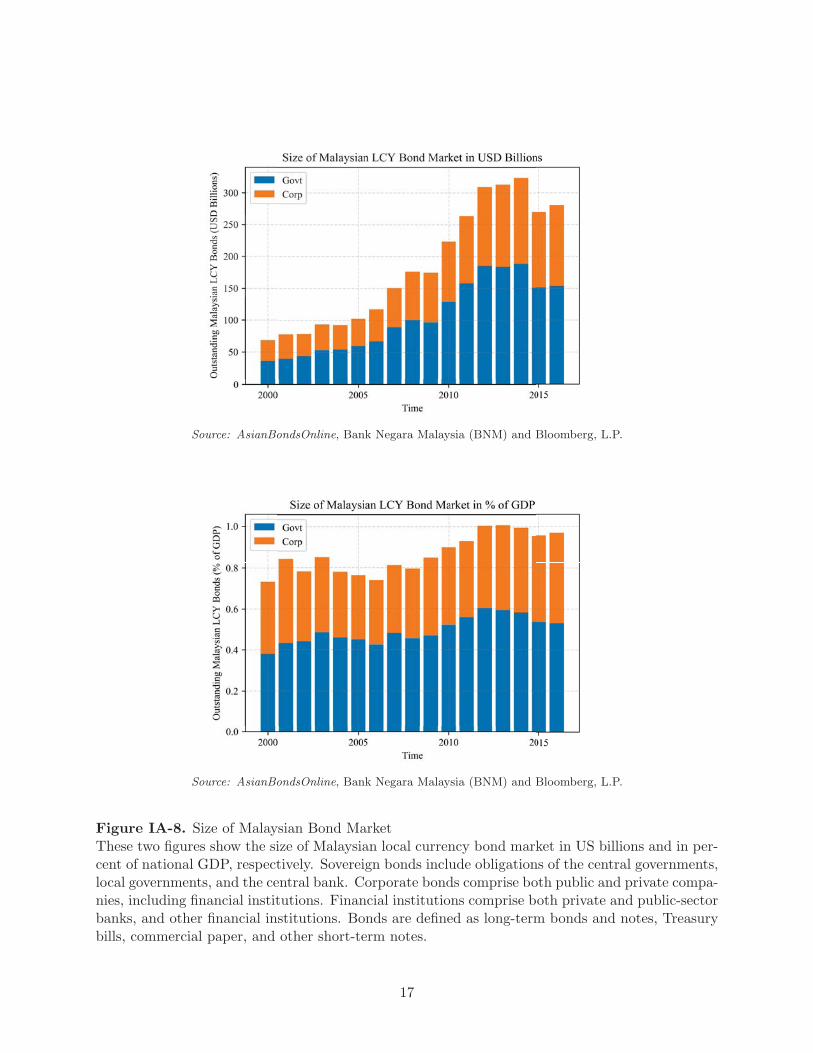
Source: AsianBondsOnline, Bank Negara Malaysia (BNM) and Bloomberg, L.P.
Source: AsianBondsOnline, Bank Negara Malaysia (BNM) and Bloomberg, L.P.
Figure IA-8. Size of Malaysian Bond MarketThese two figures show the size of Malaysian local currency bond market in US billions and in per-cent of national GDP, respectively. Sovereign bonds include obligations of the central governments,local governments, and the central bank. Corporate bonds comprise both public and private compa-nies, including financial institutions. Financial institutions comprise both private and public-sectorbanks, and other financial institutions. Bonds are defined as long-term bonds and notes, Treasurybills, commercial paper, and other short-term notes.
17
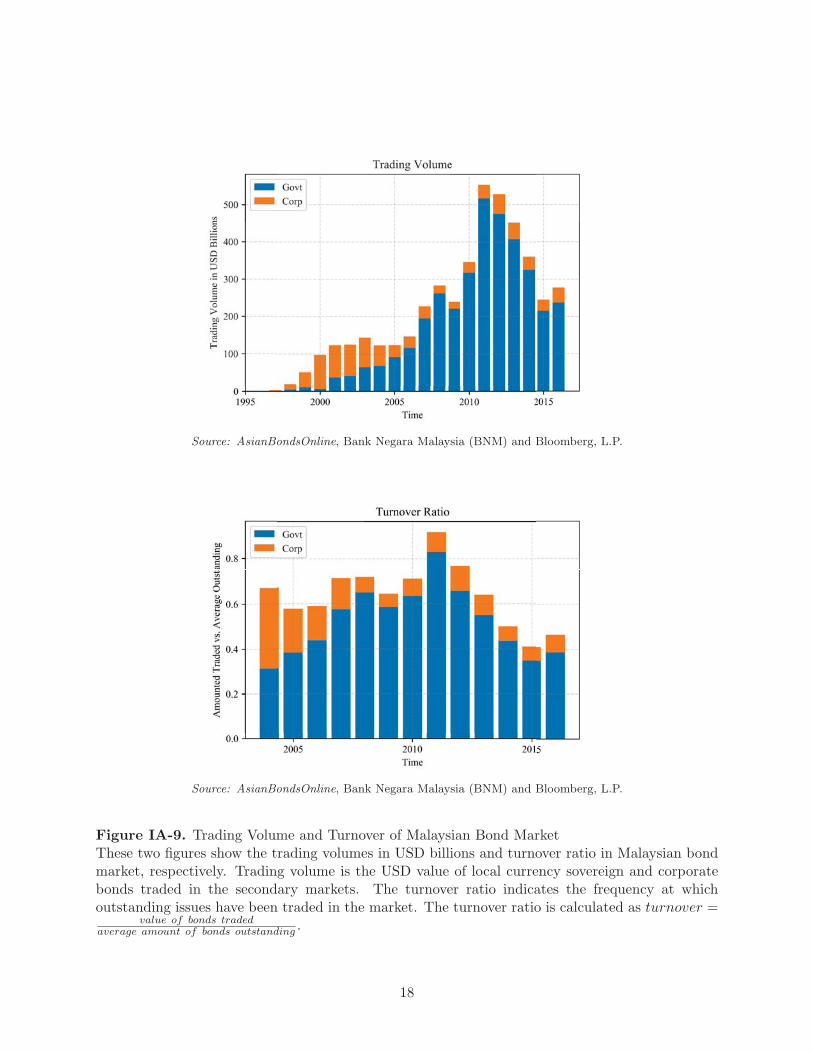
Source: AsianBondsOnline, Bank Negara Malaysia (BNM) and Bloomberg, L.P.
Source: AsianBondsOnline, Bank Negara Malaysia (BNM) and Bloomberg, L.P.
Figure IA-9. Trading Volume and Turnover of Malaysian Bond MarketThese two figures show the trading volumes in USD billions and turnover ratio in Malaysian bondmarket, respectively. Trading volume is the USD value of local currency sovereign and corporatebonds traded in the secondary markets. The turnover ratio indicates the frequency at whichoutstanding issues have been traded in the market. The turnover ratio is calculated as turnover =
value of bonds tradedaverage amount of bonds outstanding .
18
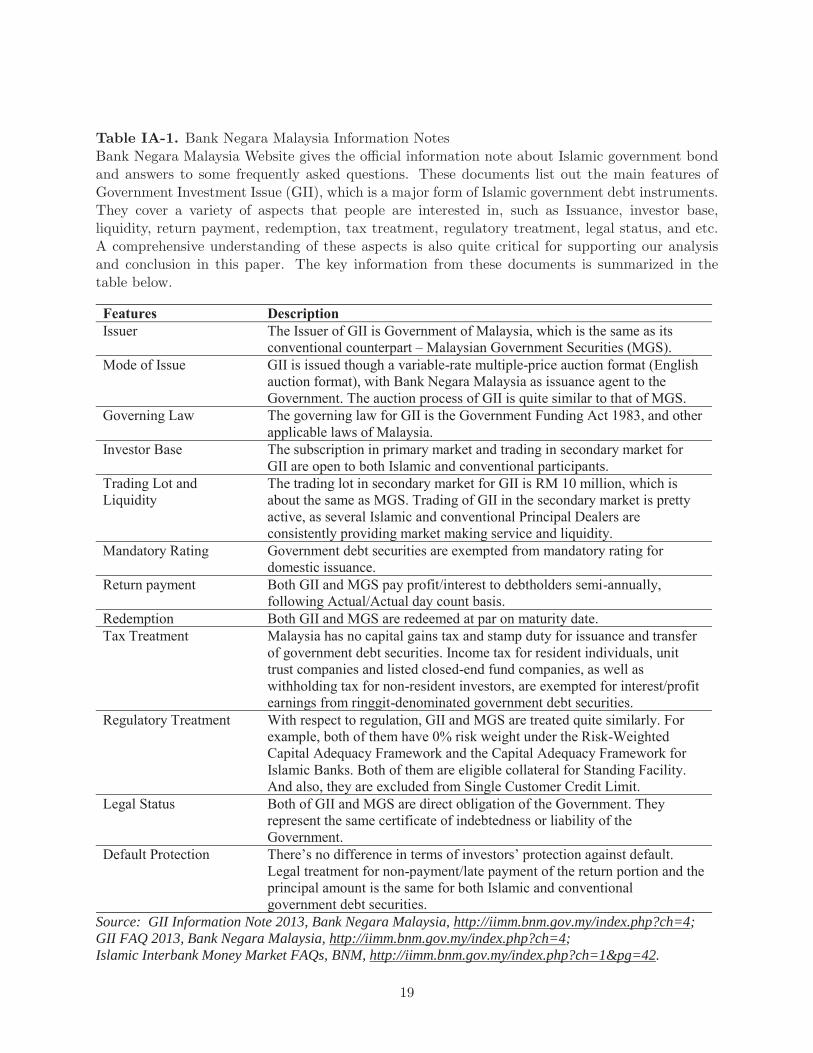
Table IA-1. Bank Negara Malaysia Information NotesBank Negara Malaysia Website gives the official information note about Islamic government bondand answers to some frequently asked questions. These documents list out the main features ofGovernment Investment Issue (GII), which is a major form of Islamic government debt instruments.They cover a variety of aspects that people are interested in, such as Issuance, investor base,liquidity, return payment, redemption, tax treatment, regulatory treatment, legal status, and etc.A comprehensive understanding of these aspects is also quite critical for supporting our analysisand conclusion in this paper. The key information from these documents is summarized in thetable below.
Features Description Issuer The Issuer of GII is Government of Malaysia, which is the same as its
conventional counterpart – Malaysian Government Securities (MGS). Mode of Issue GII is issued though a variable-rate multiple-price auction format (English
auction format), with Bank Negara Malaysia as issuance agent to the Government. The auction process of GII is quite similar to that of MGS.
Governing Law The governing law for GII is the Government Funding Act 1983, and other applicable laws of Malaysia.
Investor Base The subscription in primary market and trading in secondary market for GII are open to both Islamic and conventional participants.
Trading Lot and Liquidity
The trading lot in secondary market for GII is RM 10 million, which is about the same as MGS. Trading of GII in the secondary market is pretty active, as several Islamic and conventional Principal Dealers are consistently providing market making service and liquidity.
Mandatory Rating Government debt securities are exempted from mandatory rating for domestic issuance.
Return payment Both GII and MGS pay profit/interest to debtholders semi-annually, following Actual/Actual day count basis.
Redemption Both GII and MGS are redeemed at par on maturity date. Tax Treatment Malaysia has no capital gains tax and stamp duty for issuance and transfer
of government debt securities. Income tax for resident individuals, unit trust companies and listed closed-end fund companies, as well as withholding tax for non-resident investors, are exempted for interest/profit earnings from ringgit-denominated government debt securities.
Regulatory Treatment With respect to regulation, GII and MGS are treated quite similarly. For example, both of them have 0% risk weight under the Risk-Weighted Capital Adequacy Framework and the Capital Adequacy Framework for Islamic Banks. Both of them are eligible collateral for Standing Facility. And also, they are excluded from Single Customer Credit Limit.
Legal Status Both of GII and MGS are direct obligation of the Government. They represent the same certificate of indebtedness or liability of the Government.
Default Protection There’s no difference in terms of investors’ protection against default. Legal treatment for non-payment/late payment of the return portion and the principal amount is the same for both Islamic and conventional government debt securities.
Source: GII Information Note 2013, Bank Negara Malaysia, http://iimm.bnm.gov.my/index.php?ch=4; GII FAQ 2013, Bank Negara Malaysia, http://iimm.bnm.gov.my/index.php?ch=4; Islamic Interbank Money Market FAQs, BNM, http://iimm.bnm.gov.my/index.php?ch=1&pg=42.
19