Embed Size (px)
Citation preview
DISCLOSURE APPENDIX CONTAINS ANALYST CERTIFICATIONS AND THE STATUS OF NON-US ANALYSTS. FOR OTHER IMPORTANT DISCLOSURES, visit www.credit-suisse.com/ researchdisclosures or call +1 (877) 291-2683. U.S. Disclosure: Credit Suisse does and seeks to do business with companies covered in its research reports. As a result, investors should be aware that the Firm may have a conflict of interest that could affect the objectivity of this report. Investors should consider this report as only a single factor in making their investment decision.
CREDIT SUISSE SECURITIES RESEARCH & ANALYTICS BEYOND INFORMATION®
Client-Driven Solutions, Insights, and Access
15 May 2012Global
Equity ResearchTelecommunications Equipment (Telecommunications Equipment/IT Hardware)
IT Hardware / Telco. EquipmentCOMMENT
Huawei: The start of a new strategy ■ 2011 a transition year…the start of a new strategy. Huawei’s financial
performance in 2011 was weak with revenue growth slowing to 12% yoy and OMs dropping by 770bp yoy to 9.1%. This reflects to us a clear transitional outlook as the company adopts a new strategy targeting a revenue shift away from telecom infrastructure toward enterprise and consumer businesses. We believe that success in these newer markets will take some time; however, given the deflationary effect Huawei has had on telecom infrastructure (margins halved over a decade), we believe companies here should be warned.
■ A good thing for wireless infrastructure…probably not. After seeing group sales grow at a CAGR of 34% between 2006-2010 mainly driven by telecom infrastructure, the company reported only 3% top-line growth in its Carrier Networks business in 2011 and sees limited growth potential in this end-market long term. Within the wireless infrastructure market, Huawei now has a 15% share and a respectable #3 position, along with strong positioning in certain wireline areas like optical networking. We believe the move away from an ambitious share strategy in infrastructure is more a reflection of weak industry fundamentals, as carrier customers continue to see muted revenue growth.
■ Smartphones…ambitious strategy. Last year, Huawei shipped some 20mn smartphones (~4% global share) and are targeting 60mn units for 2012. The ambitions for strong growth in mobile phones are also evident from the 30%+ sales growth Huawei is targeting for its Consumer Business segment in 2012. Here we believe the company will gain share as it prices smartphones aggressively (GMs are 15-20% per our estimates compared with the industry at an average of 25% excluding Apple) and leverages its own chipsets (from HiSilicon). However, we still believe that building brand awareness and distribution will take some time, and hence a double digit market share in smartphones may several few years.
■ The Enterprise has a target on its back. Last year, Enterprise revenues for Huawei grew some 57%, to $1.5bn, and even longer term, the company aims to leverage its telecom relationships while offering a portfolio of enterprise products (not just routers, but also servers and storage). With significant headcount (30K employees targeted in Enterprise by the end of 2012) and an aggressive pricing strategy over time, we believe they can prove to be disruptive in this end market.
■ Who is exposed? Anyone without differentiation. Success in consumer and enterprise markets will not come overnight. On a global basis within our coverage universe, we see vendors like HP and Dell facing risks from Huawei’s potential effect and even Nokia longer term. We believe that vendors who may be better positioned are those that offer some sort of differentiation: for example, EMC given its broad portfolio and R&D strength; Apple given its own operating system and advantages in the compute market; and Qualcomm given its scale, customer exposure and also being well aligned with Huawei’s smartphone ambitions.
Research Analysts
Kulbinder Garcha 212 325 4795
Deepak Sitaraman, CFA 212 325 5808
Achal Sultania 44 20 7883 6884
Vlad Rom 212 325 5442
Alban Gashi 212 538 3033
Talal Khan 212 325 8603
Matthew Cabral 212 538 6260
Asia Team: Yan Taw Boon 852 2101 7039
15 May 2012
IT Hardware / Telco. Equipment 2
Executive summary We recently attended Huawei 9th Global Analyst summit in Shenzhen (China), which also provided us with a rare opportunity to meet with senior managers of the company. We come away with a view that Huawei’s strategy is changing rapidly, with its sights moving well beyond the telecom infrastructure markets towards smartphones, as well as the enterprise. Success in these markets will not come overnight; however, we do believe that the company’s undeniable deflationary impact in the telecom infrastructure market means that we see an increasingly challenging outlook for many of the companies in our combined coverage of the Global Telecom Equipment and IT Hardware sectors.
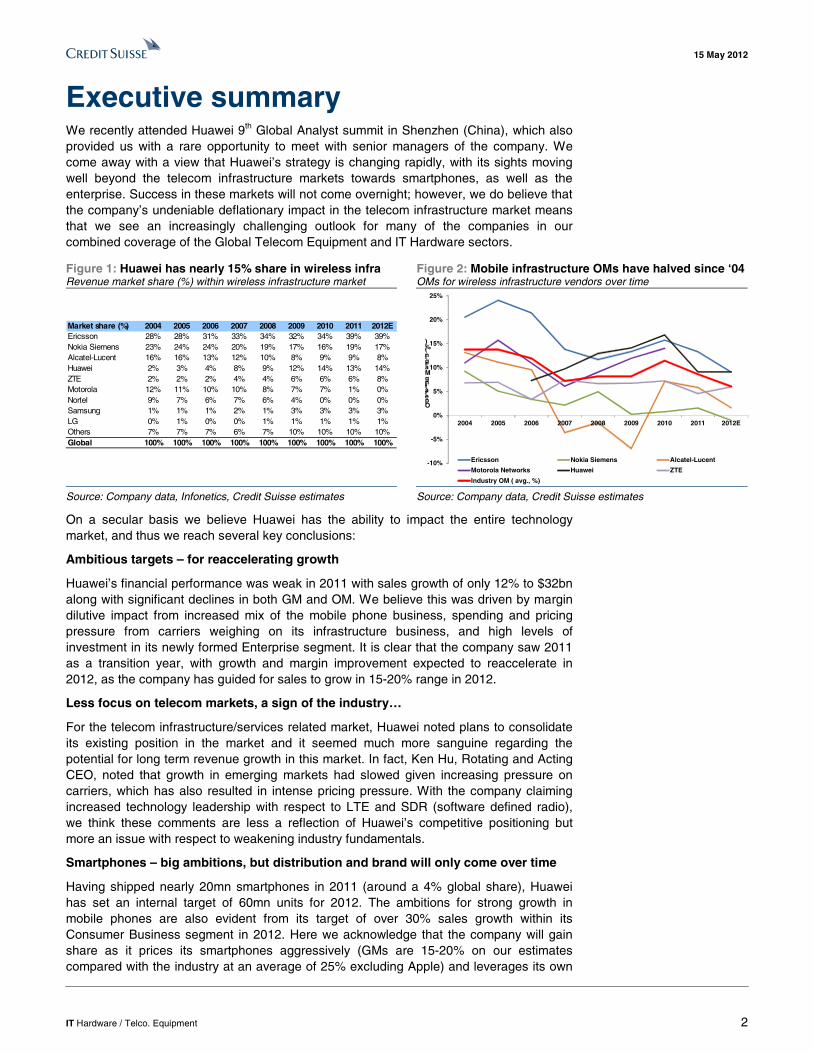
Figure 1: Huawei has nearly 15% share in wireless infra Revenue market share (%) within wireless infrastructure market
Figure 2: Mobile infrastructure OMs have halved since ‘04OMs for wireless infrastructure vendors over time
Market share (%) 2004 2005 2006 2007 2008 2009 2010 2011 2012EEricsson 28% 28% 31% 33% 34% 32% 34% 39% 39%Nokia Siemens 23% 24% 24% 20% 19% 17% 16% 19% 17%Alcatel-Lucent 16% 16% 13% 12% 10% 8% 9% 9% 8%Huawei 2% 3% 4% 8% 9% 12% 14% 13% 14%ZTE 2% 2% 2% 4% 4% 6% 6% 6% 8%Motorola 12% 11% 10% 10% 8% 7% 7% 1% 0%Nortel 9% 7% 6% 7% 6% 4% 0% 0% 0%Samsung 1% 1% 1% 2% 1% 3% 3% 3% 3%LG 0% 1% 0% 0% 1% 1% 1% 1% 1%Others 7% 7% 7% 6% 7% 10% 10% 10% 10%Global 100% 100% 100% 100% 100% 100% 100% 100% 100%
-10%
-5%
0%
5%
10%
15%
20%
25%
2004 2005 2006 2007 2008 2009 2010 2011 2012E
Ericsson Nokia Siemens Alcatel-Lucent
Motorola Networks Huawei ZTE
Industry OM ( avg., %)
OperatingMargin (%)
Source: Company data, Infonetics, Credit Suisse estimates Source: Company data, Credit Suisse estimates
On a secular basis we believe Huawei has the ability to impact the entire technology market, and thus we reach several key conclusions:
Ambitious targets – for reaccelerating growth
Huawei’s financial performance was weak in 2011 with sales growth of only 12% to $32bn along with significant declines in both GM and OM. We believe this was driven by margin dilutive impact from increased mix of the mobile phone business, spending and pricing pressure from carriers weighing on its infrastructure business, and high levels of investment in its newly formed Enterprise segment. It is clear that the company saw 2011 as a transition year, with growth and margin improvement expected to reaccelerate in 2012, as the company has guided for sales to grow in 15-20% range in 2012.
Less focus on telecom markets, a sign of the industry…
For the telecom infrastructure/services related market, Huawei noted plans to consolidate its existing position in the market and it seemed much more sanguine regarding the potential for long term revenue growth in this market. In fact, Ken Hu, Rotating and Acting CEO, noted that growth in emerging markets had slowed given increasing pressure on carriers, which has also resulted in intense pricing pressure. With the company claiming increased technology leadership with respect to LTE and SDR (software defined radio), we think these comments are less a reflection of Huawei’s competitive positioning but more an issue with respect to weakening industry fundamentals.
Smartphones – big ambitions, but distribution and brand will only come over time
Having shipped nearly 20mn smartphones in 2011 (around a 4% global share), Huawei has set an internal target of 60mn units for 2012. The ambitions for strong growth in mobile phones are also evident from its target of over 30% sales growth within its Consumer Business segment in 2012. Here we acknowledge that the company will gain share as it prices its smartphones aggressively (GMs are 15-20% on our estimates compared with the industry at an average of 25% excluding Apple) and leverages its own
15 May 2012
IT Hardware / Telco. Equipment 3
chipsets (from HiSilicon). However, we still believe that building brand awareness and distribution will take some time, and hence a double digit market share in smartphones may take several years.
Enterprise initially focused on networking, but probably more to come
Huawei’s business in the Enterprise segment was some $1.5bn in revenue terms in 2011 (up 57% yoy). Although the company has not divulged details for 2012 Enterprise revenue targets, longer term the company has indicated a revenue target of $15bn by 2015. Clearly success in the Enterprise segment will take some time as the company initially appears to be focused mainly on networking in the initial stages. However we do believe it has ambitions in the server and storage markets as well. The strategy here is to grow within the telecom related verticals and then expand to government, education and transportation verticals. Given the company’s margin structure is significantly lower than typical enterprise players (like Cisco and IBM), we believe this adds risk to enterprise exposed companies over time.
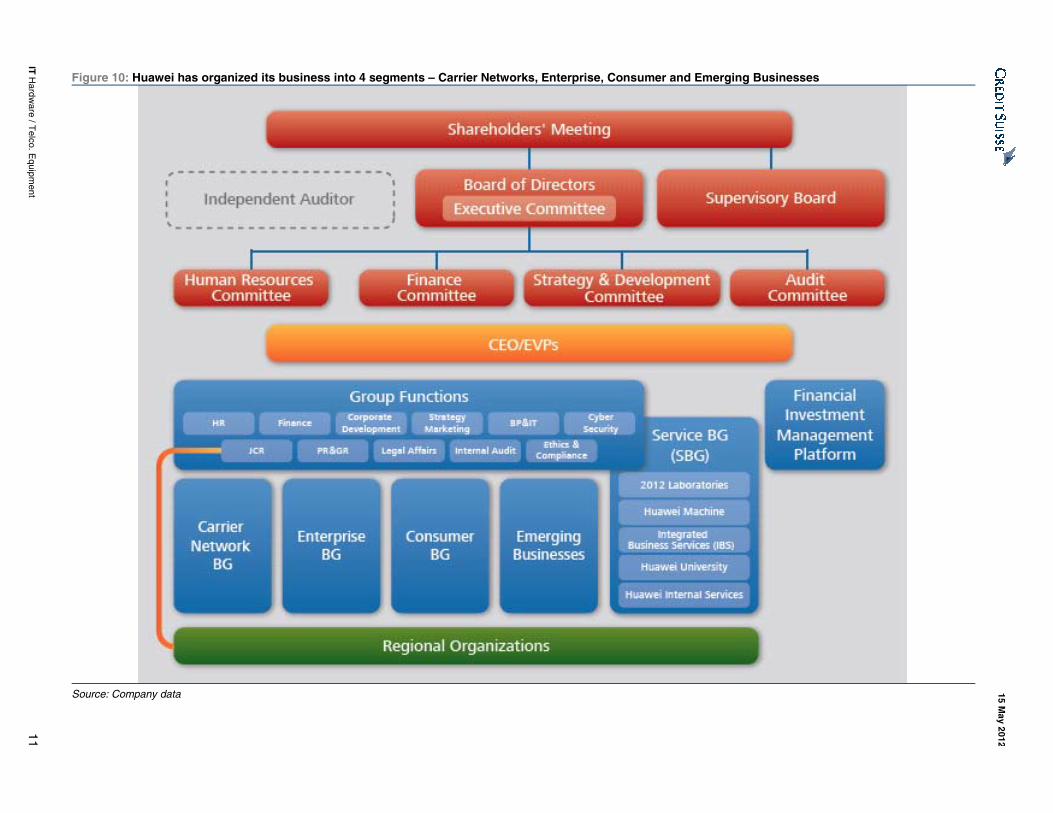
A new organizational structure and R&D force to be reckoned with
In 2011, Huawei reorganized its business into 4 main business units – Carrier Networks, Consumer, Enterprise and Emerging Businesses. This is aimed to allow an increasing level of focus on both its Consumer and Enterprise businesses, which are seen as the growth engines for the group going forward. At the end of 2011, Huawei had 140K employees with around 44% of the total or 62K staff engaged in R&D activities. This is significantly higher than 34% at ZTE (some 30K R&D staff), 27% at Nokia (35K R&D engineers including Nokia Siemens) and 21% at Ericsson (around 22K R&D employees). In addition, R&D cost per R&D employee for Huawei is $61K versus Ericsson at $185K and Nokia at $180K, with only ZTE operating at a lower R&D cost per R&D head (at around $45K). In addition to higher level of R&D headcount, we believe this lower cost per employee in R&D continues to give Huawei a material cost advantage versus peers.
Who is exposed? Anyone without differentiation in mobile phones and enterprise
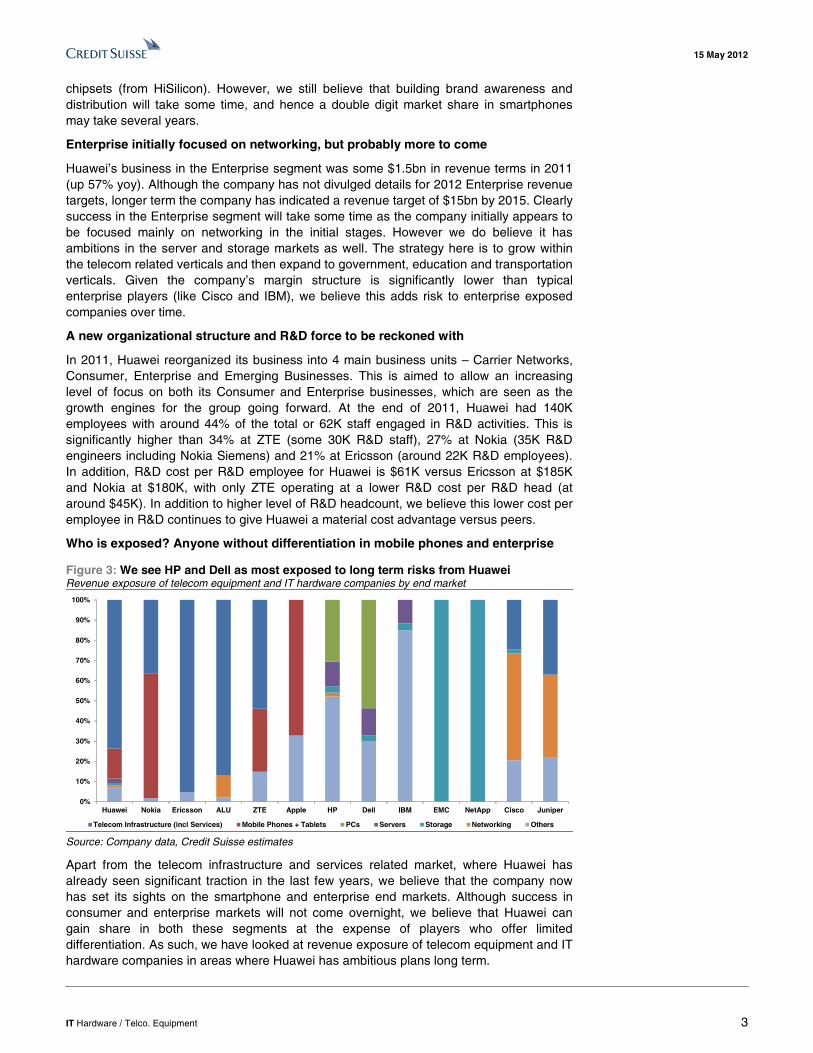
Figure 3: We see HP and Dell as most exposed to long term risks from Huawei Revenue exposure of telecom equipment and IT hardware companies by end market
0%
10%
20%
30%
40%
50%
60%
70%
80%
90%
100%
Huawei Nokia Ericsson ALU ZTE Apple HP Dell IBM EMC NetApp Cisco Juniper
Telecom Infrastructure (incl Services) Mobile Phones + Tablets PCs Servers Storage Networking Others Source: Company data, Credit Suisse estimates
Apart from the telecom infrastructure and services related market, where Huawei has already seen significant traction in the last few years, we believe that the company now has set its sights on the smartphone and enterprise end markets. Although success in consumer and enterprise markets will not come overnight, we believe that Huawei can gain share in both these segments at the expense of players who offer limited differentiation. As such, we have looked at revenue exposure of telecom equipment and IT hardware companies in areas where Huawei has ambitious plans long term.
15 May 2012
IT Hardware / Telco. Equipment 4
Ericsson (Neutral, TP SKr57.50): With telecom infrastructure and services accounting for 74% of Huawei’s sales, and the company having close to 15% share in wireless infrastructure market, we acknowledge that Huawei remains a major force to reckon with in the telecom infrastructure market in all regions except the US along with having a deflationary impact on the overall market.
For Ericsson specifically, although the company has gained market share in the last 12 months (we estimate 39% share in 2011, up 5pp yoy) driven by network modernisation contracts, we believe that ongoing macro impact along with our view on wireless CapEx to come under pressure (esp. in EMs like China, India, and LatAm) means that Ericsson’s top-line stays flat yoy in 2012 following 12% growth in 2011, with only a muted recovery expected in 2013. In addition to near term top-line pressure, we see several negative drivers for gross margins going forward, which are i) ongoing EU modernisation contracts likely to continue through 2012, ii) aggressive LTE rollout plans from carriers in the US resulting in lower HSPA and CDMA upgrade business, and iii) mix shift in China away from high margin 2G business towards 3G/4G coverage projects. As such, we assume GMs (ex rest.) of 33.3%/33.8% for 2012/2013 (down from 34.3% in Q112). With a clean opex of SKr56.4bn/SKr55.6bn in 2012/2013 (down from SKr57.4bn in 2011), we believe Ericsson will deliver EBIT (ex rest., capital gains and JV) margins of 9.0%/10.4% (vs. 11.0% in 2011). Our TP of SKr57.50 is based on applying a P/E multiple of 11x to our 2013 EPS estimate of SKr5.20.
Alcatel-Lucent (Underperform, TP €€ 1.20): Besides the ongoing threat from Huawei, we believe that Alcatel-Lucent’s positioning within the industry remains structurally challenged given its sub-scale position in the wireless space (<10% global share) and high exposure to the declining CDMA business. Although the company is aiming for OMs of >3.9% in 2012, we maintain our view that this may prove challenging given the top-line pressures, an ongoing technology shift towards 4G in the US and the impact from the recent sale of the high margin Genesys business (note we assume group OMs of 1.7%/2.6% for 2012/2013). With the stock trading at 2013 EV/sales of 0.14x, valuation continues to look inexpensive. However, given the lack of visibility on carrier spending environment and scope for OM improvements, we maintain our view that Alcatel-Lucent remains a relative Underperform in the sector.
Nokia (Outperform, TP €€ 4.50): Although we expect Huawei to gain share in the smartphone market as it invests in its Consumer Business (note in our smartphone model, we assume Huawei’s smartphone share to rise from 3% in 2011 to over 8% in 2012, implying 55mn units), we still believe that building brand awareness and distribution will take some time, and hence a double digit market share in smartphones may take a few years.
For Nokia specifically, we remain of the view that the shift toward Microsoft is the right strategy which will allow the company to drive a recovery through 2012 in both its top-line and earnings as we expect Nokia to command 12% market share within smartphones driven by Windows Phone platform. Following a difficult 1H12, we believe that the crossover point in Nokia’s smartphone business will occur in Q312 with Windows Phone outselling Symbian. From 2H12, we expect D&S revenues to grow, increasing from €€ 17.2bn in 2012 to €€ 25.6bn in 2013 as Windows Phone portfolio expands to newer geographies and lower price points. Allowing for €€ 1.4bn of opex reduction (2010-2013), we believe that D&S OMs can expand to 10% by 2013 (vs. 7% in 2011). With Nokia trading on P/E of 5.9x our 2013 estimate of €€ 0.42, which we believe the risk/reward remains compelling at these levels.
Qualcomm (Outperform, TP $75): Even though Huawei is experimenting with the use of apps processors designed by HiSilicon (in its new smartphone Ascend D quad), we would view this is as only a slight negative for Qualcomm’s chipset business longer term from a competitive viewpoint. However, even if Qualcomm’s share shifts within Huawei, it could still be a net benefactor given Huawei’s growth ambitions within the smartphone market (targeting 60mn units in 2012, up from 20mn in 2011). In addition, earlier this year, Huawei
15 May 2012
IT Hardware / Telco. Equipment 5
also announced its continued commitment to Qualcomm with a $6bn contract over the next three years to be split between Qualcomm, Broadcom and Avago (for details, see our Feb 17th email ‘Qualcomm: Continued chipset traction with Chinese vendors (Huawei and ZTE) reaffirms its competitive advantage in 3G’.
We believe Qualcomm remains well positioned with multiple OS platforms (iOS, Android, Windows Phone and BlackBerry), which means that the company will benefit from strong smartphone market growth. As such, Qualcomm’s WCDMA chipset share will rise from 43% in FY11 to around 53% by FY13. In addition, continued robust growth in smartphones means that we could see support for device ASPs in its licensing business, as smartphones and tablets rise in the mix at the expense of feature phones and low-end CDMA handsets. As such, we expect Qualcomm's group earnings to grow at a CAGR of 14% driving EPS of $3.68/$4.24 in FY12/FY13. On our FY13 EPS estimate, Qualcomm is trading at 13.3x (ex cash), and we believe the stock deserves to trade at a premium multiple given its unique business model, revenue/earnings CAGR of 20%/14% between FY11-FY13 as well as a robust balance sheet (~$12 fully taxed net cash per share).
Apple (Outperform, TP $750): With Huawei having aggressive plans for its Consumer Business, it is worth noting that Apple derives around 65% of its total revenues from smartphone and tablet products. However, with Apple having a strong software and services offering which puts it in an advantageous position in the overall compute market (for details, please refer our April 12th smartphone note titled ‘Smartphones 2012 – Growth robust…time to think compute’), we believe that Huawei will pose a limited threat to Apple.
As Apple continues to expand its iPhone distribution, we estimate that iPhone volumes will see strong growth rising from 93mn units in CY11 to 140mn/187mn in CY12/CY13 (implying global share of 22% by 2013 vs. 19% in 2011). For iPad, we forecast units of 66mn/92mn (implying global share of 63%/60%) in CY12/CY13. We estimate that the addressable market for tablets will grow to ~$120bn by 2015 and expect Apple's share with the iPad to remain as high as 55% long term (compared to 65% currently). In addition, we believe Apple has significant emerging market potential, which could result in a very substantial extra $87bn in sales (+65% from CY11 base) and ~$22 in EPS (60%+ increase from CY11 levels) by 2015. Apple currently trades at 9.6x our CY13 EPS of $59.15, which is inexpensive given our expectations for earnings to grow at a CAGR of 30% between CY11–CY13 and net cash per share of $117.
Hewlett-Packard (Neutral, TP $30): HP generates 17% of its revenues and 22% of its operating profits from its ESSN (Enterprise, Servers, Storage and Networking) business. Huawei's more aggressive stance in the data center is somewhat concerning given HP's strength in the segment. In spite of the company's transition toward more software, the bulk of enterprise revenue still comes from hardware oriented products.
Longer term, we believe HP’s transition from a hardware-centric business model continues, with services, storage, and networking rising in the mix; however given recent execution issues and underinvestment it may take some time. We believe that with so many headwinds (IPG, ESSN) and secular issues (Services margins, PC growth), fundamentals may only gradually improve over the next 12 months. Our EPS estimates of $4.00/$4.31 for FY12/FY13 remain in-line to slightly below consensus estimates of $4.04/$4.42.
Dell (Underperform, TP $16): Dell currently generates 13% of its revenues from Servers and Networking which we expect to remain flat owing to virtualization and increasing competition. Even allowing for growth in Storage and Services segments, we expect Dell's top-line to remain flat to slightly down over the next five years. With Huawei having ambitions in the enterprise, particularly in the server space, we believe this could pose a long term issue.
With limited structural organic revenue growth and limited margin upside (we expect improved business mix to drive long-term GMs to close to 21% from current levels of 19%), we see a lack of bottom-line growth for the company as we estimate EPS of $2.06/$1.90 for FY13/FY14 (year ending Jan), respectively. With the stock trading on 8.1x our CY13
15 May 2012
IT Hardware / Telco. Equipment 6
estimate of $1.91, we acknowledge limited absolute downside from current levels, however, we maintain our relative Underperform rating and TP of $16.
IBM (Neutral, TP $200): While Huawei clearly has ambitions in the enterprise market, we believe it will do so with a lower end server and storage offering. As a result we see the impact to IBM as limited. As a reference, IBM currently generates well over 80% of its pre-tax income from software and services, which requires core IP and a proven track record.
Although IBM continues to successfully pursue a combined hardware, software and services strategy, which should drive aggregate share gains with EPS of $22.18 by 2015 (above company guidance), shares already reflect this potential growth. We believe the company warrants a market multiple given the quality of earnings growth, with over 50% of incremental EPS coming from M&A and buybacks. Our EPS estimates for 2012/2013 stand at $15.25/$17.10 for 2012/2013.
EMC (Outperform, TP $35): Within storage specifically, we believe that Huawei faces entrenched competitors (EMC’s overall storage share is ~30%) with strong offerings in mid and high end markets. The storage industry also typically has higher switching costs and is bundled with software and services, which make up ~50% of EMC’s Information Storage segment. Longer term, given end market growth within network attached storage, we believe EMC will continue to be a share gainer given its broad product portfolio and market positioning.
Based on our recent detailed bottom up and top down analysis of EMC’s Information Storage segment (74% of revenue in 2011), we forecast revenue growth of 13.5%/13.6% in 2012/2013. Further, our analysis suggests that EMC can continue to expand gross margins toward 66% long term as higher margin mid-range product offerings and Vmware revenue grows within the revenue mix. This top-line growth and margin expansion drives our EPS to $1.82/$2.17 for 2012/2013 (5%/9% above consensus). We see mid to-high teens EPS growth as sustainable for several years, and note that this provides line of sight toward EPS of $3 in 2015. EMC remains a preferred IT hardware pick as our $35 TP suggests over 30% upside from current levels.
NetApp (Neutral, TP $45): Similar to EMC, we believe Huawei’s threat to NetApp remains limited given customer stickiness and bundling of software and services (which make up about half of NetApp’s revenues). NetApp currently generates about less than 70% of its revenues from the fast growing mid-range segment and the remaining from low end systems, which longer term could see some pressure.
Given uncertainties around a gross margin recovery, the competitive dynamic, and a muted revenue growth outlook, we maintain our Neutral rating. While NetApp deserves a premium multiple owing to its solid positioning and strong cash flow generation, we believe decelerating revenue growth and GM pressures will limit multiple expansion. We forecast revenue growth of 15.5%/15.0% and EPS of $2.63/$3.08 in CY12/13, respectively. Our $45 TP implies that shares can trade at a 14.6x multiple on our 2013 EPS estimate.

15 May 2012
IT Hardware / Telco. Equipment 7
Huawei transitions strategy 1) An evolving strategy Historically, Huawei as a company has been focused on the telecom infrastructure market. The company has seen continuous levels of market share gains in both the wireless and wireline infrastructure markets, with its Telecom Networks (including Global Services) business segment accounting for nearly 85%/80% of group revenue in 2009/2010. This strong focus on the telecom infrastructure and services related markets so far has allowed the company to drive sales CAGR of 31% over the last 5 years reaching $32.4bn of sales in 2011, as shown in Figure 4. However, based on recent commentary from Huawei along with management presentations at its Analyst Day, we believe that the company’s strategy is now evolving with a significant focus on the smartphone and enterprise segments.
Figure 4: Huawei has seen its top-line grow at a CAGR of 31% over the last 5 years, guiding for 15-20% growth in 2012 US$ in millions, unless otherwise stated P&L (US$ mn) 2006 2007 2008 2009 2010 2011 2012E 2012 guidance
Sales 8,504 12,840 18,071 21,839 27,629 32,396 38,065 15-20% growth
% change 51% 41% 21% 27% 17% 18%
Cost of sales -5,424 -7,937 -10,890 -13,199 -15,468 -20,251
Gross profit 3,080 4,903 7,181 8,640 12,162 12,144
Gross margin (%) 36.2% 38.2% 39.7% 39.6% 44.0% 37.5%
R&D expenses 1,511 1,954 2,672 3,764 $4.5bn of R&D
R&D/Sales (%) 8.4% 8.9% 9.7% 11.6%
SG&A expenses 3,236 3,541 4,758 5,365
SG&A/Sales (%) 17.9% 16.2% 17.2% 16.6%
Other operating expenses, net 97 60 89 64
Total Operating expenses 2,353 3,578 4,843 5,555 7,519 9,193
Income from operations 621 1,248 2,337 3,084 4,643 2,952
Operating margin (%) 7.3% 9.7% 12.9% 14.1% 16.8% 9.1%
Net financing cost -39 -199 -956 184 -321 -937
Share of losses of associates/jointly controlled entities -15 -7 -28 -24 -2 -36
Profit before income tax and minority interests 567 1,042 1,354 3,244 4,321 1,979
Income taxes -55 -85 -221 -567 -580 -129
Net income for the year 512 957 1,133 2,677 3,741 1,850
Net margin (%) 6.0% 7.5% 6.3% 12.3% 13.5% 5.7%
Source: Company data, Credit Suisse research
Financial performance in 2011 shows the company is in transition. In 2011, Huawei reported top-line growth of only 12% in Rmb terms (17% in USD terms) vs. 22% in 2010. This was driven mainly by the slowdown in its Carrier Networks business, which accounted for 74% of group sales but saw only 3% revenue growth in Rmb terms. In addition, Huawei saw a sharp decline in GMs/OMs which fell from 44.0%/16.8% in 2010 to 37.5%/9.1% in 2011, which is significant especially after several years of margin improvement. The drivers for this level of margin pressure were multi-fold in our view, as discussed below.
Finally maturing within its telecom infrastructure business. During the Analyst Day, management highlighted that its Carrier Networks business saw muted growth in 2011 (up only 3% in 2011). Ken Hu, Rotating and Acting CEO, specifically noted that the company saw a significant slowdown within the telecom infrastructure business especially within emerging markets, which was also impacted by economic and political instability. Further, management acknowledged that it continues to see signs of stringent CapEx budgets at wireless carriers going forward, while also acknowledging a degree of increased pricing
15 May 2012
IT Hardware / Telco. Equipment 8
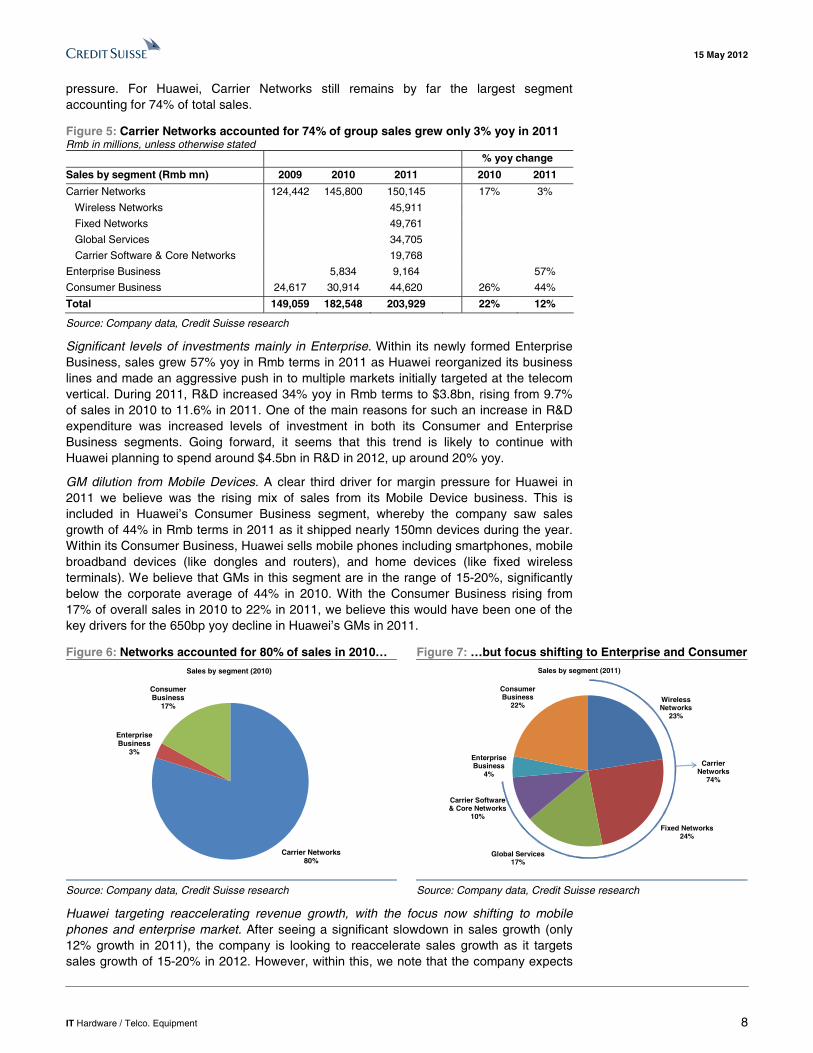
pressure. For Huawei, Carrier Networks still remains by far the largest segment accounting for 74% of total sales.
Figure 5: Carrier Networks accounted for 74% of group sales grew only 3% yoy in 2011 Rmb in millions, unless otherwise stated % yoy change
Sales by segment (Rmb mn) 2009 2010 2011 2010 2011
Carrier Networks 124,442 145,800 150,145 17% 3%
Wireless Networks 45,911
Fixed Networks 49,761
Global Services 34,705
Carrier Software & Core Networks 19,768
Enterprise Business 5,834 9,164 57%
Consumer Business 24,617 30,914 44,620 26% 44%
Total 149,059 182,548 203,929 22% 12%
Source: Company data, Credit Suisse research
Significant levels of investments mainly in Enterprise. Within its newly formed Enterprise Business, sales grew 57% yoy in Rmb terms in 2011 as Huawei reorganized its business lines and made an aggressive push in to multiple markets initially targeted at the telecom vertical. During 2011, R&D increased 34% yoy in Rmb terms to $3.8bn, rising from 9.7% of sales in 2010 to 11.6% in 2011. One of the main reasons for such an increase in R&D expenditure was increased levels of investment in both its Consumer and Enterprise Business segments. Going forward, it seems that this trend is likely to continue with Huawei planning to spend around $4.5bn in R&D in 2012, up around 20% yoy.
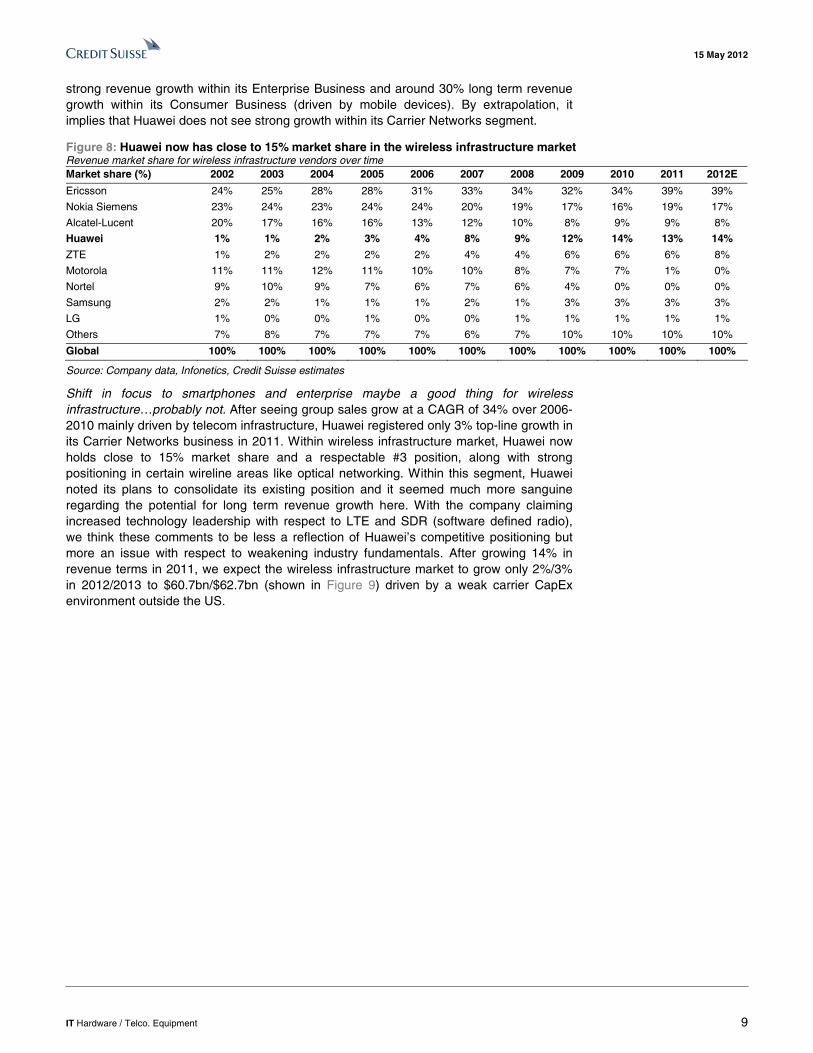
GM dilution from Mobile Devices. A clear third driver for margin pressure for Huawei in 2011 we believe was the rising mix of sales from its Mobile Device business. This is included in Huawei’s Consumer Business segment, whereby the company saw sales growth of 44% in Rmb terms in 2011 as it shipped nearly 150mn devices during the year. Within its Consumer Business, Huawei sells mobile phones including smartphones, mobile broadband devices (like dongles and routers), and home devices (like fixed wireless terminals). We believe that GMs in this segment are in the range of 15-20%, significantly below the corporate average of 44% in 2010. With the Consumer Business rising from 17% of overall sales in 2010 to 22% in 2011, we believe this would have been one of the key drivers for the 650bp yoy decline in Huawei’s GMs in 2011.
Figure 6: Networks accounted for 80% of sales in 2010… Figure 7: …but focus shifting to Enterprise and Consumer
Carrier Networks80%
Enterprise Business
3%
Consumer Business
17%
Sales by segment (2010)
Wireless Networks
23%
Fixed Networks24%
Global Services17%
Carrier Software & Core Networks
10%
Enterprise Business
4%
Consumer Business
22%
Sales by segment (2011)
Carrier Networks
74%
Source: Company data, Credit Suisse research Source: Company data, Credit Suisse research
Huawei targeting reaccelerating revenue growth, with the focus now shifting to mobile phones and enterprise market. After seeing a significant slowdown in sales growth (only 12% growth in 2011), the company is looking to reaccelerate sales growth as it targets sales growth of 15-20% in 2012. However, within this, we note that the company expects
15 May 2012
IT Hardware / Telco. Equipment 9
strong revenue growth within its Enterprise Business and around 30% long term revenue growth within its Consumer Business (driven by mobile devices). By extrapolation, it implies that Huawei does not see strong growth within its Carrier Networks segment.
Figure 8: Huawei now has close to 15% market share in the wireless infrastructure market Revenue market share for wireless infrastructure vendors over time Market share (%) 2002 2003 2004 2005 2006 2007 2008 2009 2010 2011 2012E
Ericsson 24% 25% 28% 28% 31% 33% 34% 32% 34% 39% 39%
Nokia Siemens 23% 24% 23% 24% 24% 20% 19% 17% 16% 19% 17%
Alcatel-Lucent 20% 17% 16% 16% 13% 12% 10% 8% 9% 9% 8%
Huawei 1% 1% 2% 3% 4% 8% 9% 12% 14% 13% 14%
ZTE 1% 2% 2% 2% 2% 4% 4% 6% 6% 6% 8%
Motorola 11% 11% 12% 11% 10% 10% 8% 7% 7% 1% 0%
Nortel 9% 10% 9% 7% 6% 7% 6% 4% 0% 0% 0%
Samsung 2% 2% 1% 1% 1% 2% 1% 3% 3% 3% 3%
LG 1% 0% 0% 1% 0% 0% 1% 1% 1% 1% 1%
Others 7% 8% 7% 7% 7% 6% 7% 10% 10% 10% 10%
Global 100% 100% 100% 100% 100% 100% 100% 100% 100% 100% 100%
Source: Company data, Infonetics, Credit Suisse estimates
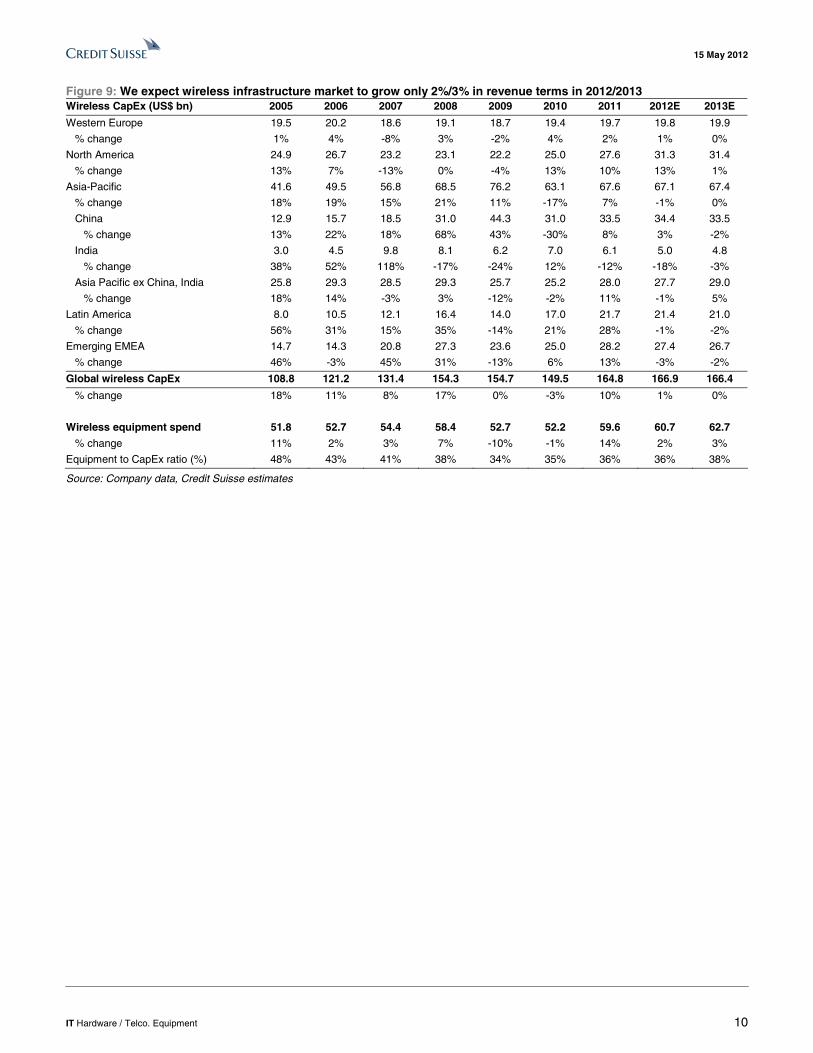
Shift in focus to smartphones and enterprise maybe a good thing for wireless infrastructure…probably not. After seeing group sales grow at a CAGR of 34% over 2006-2010 mainly driven by telecom infrastructure, Huawei registered only 3% top-line growth in its Carrier Networks business in 2011. Within wireless infrastructure market, Huawei now holds close to 15% market share and a respectable #3 position, along with strong positioning in certain wireline areas like optical networking. Within this segment, Huawei noted its plans to consolidate its existing position and it seemed much more sanguine regarding the potential for long term revenue growth here. With the company claiming increased technology leadership with respect to LTE and SDR (software defined radio), we think these comments to be less a reflection of Huawei’s competitive positioning but more an issue with respect to weakening industry fundamentals. After growing 14% in revenue terms in 2011, we expect the wireless infrastructure market to grow only 2%/3% in 2012/2013 to $60.7bn/$62.7bn (shown in Figure 9) driven by a weak carrier CapEx environment outside the US.
15 May 2012
IT Hardware / Telco. Equipment 10
Figure 9: We expect wireless infrastructure market to grow only 2%/3% in revenue terms in 2012/2013 Wireless CapEx (US$ bn) 2005 2006 2007 2008 2009 2010 2011 2012E 2013E
Western Europe 19.5 20.2 18.6 19.1 18.7 19.4 19.7 19.8 19.9
% change 1% 4% -8% 3% -2% 4% 2% 1% 0%
North America 24.9 26.7 23.2 23.1 22.2 25.0 27.6 31.3 31.4
% change 13% 7% -13% 0% -4% 13% 10% 13% 1%
Asia-Pacific 41.6 49.5 56.8 68.5 76.2 63.1 67.6 67.1 67.4
% change 18% 19% 15% 21% 11% -17% 7% -1% 0%
China 12.9 15.7 18.5 31.0 44.3 31.0 33.5 34.4 33.5
% change 13% 22% 18% 68% 43% -30% 8% 3% -2%
India 3.0 4.5 9.8 8.1 6.2 7.0 6.1 5.0 4.8
% change 38% 52% 118% -17% -24% 12% -12% -18% -3%
Asia Pacific ex China, India 25.8 29.3 28.5 29.3 25.7 25.2 28.0 27.7 29.0
% change 18% 14% -3% 3% -12% -2% 11% -1% 5%
Latin America 8.0 10.5 12.1 16.4 14.0 17.0 21.7 21.4 21.0
% change 56% 31% 15% 35% -14% 21% 28% -1% -2%
Emerging EMEA 14.7 14.3 20.8 27.3 23.6 25.0 28.2 27.4 26.7
% change 46% -3% 45% 31% -13% 6% 13% -3% -2%
Global wireless CapEx 108.8 121.2 131.4 154.3 154.7 149.5 164.8 166.9 166.4
% change 18% 11% 8% 17% 0% -3% 10% 1% 0%
Wireless equipment spend 51.8 52.7 54.4 58.4 52.7 52.2 59.6 60.7 62.7
% change 11% 2% 3% 7% -10% -1% 14% 2% 3%
Equipment to CapEx ratio (%) 48% 43% 41% 38% 34% 35% 36% 36% 38%
Source: Company data, Credit Suisse estimates
15 May 2012
IT H
ardware / T
elco. Equipm
ent 11
Figure 10: Huawei has organized its business into 4 segments – Carrier Networks, Enterprise, Consumer and Emerging Businesses
Source: Company data
15 May 2012
IT Hardware / Telco. Equipment 12
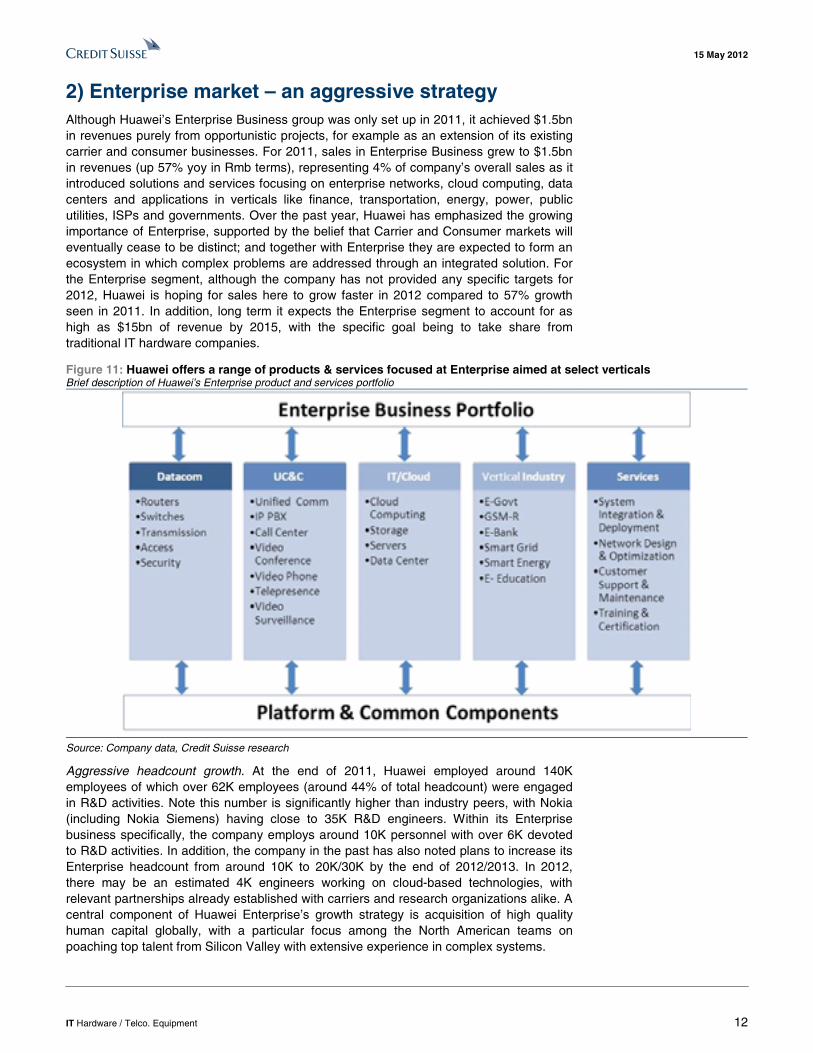
2) Enterprise market – an aggressive strategy Although Huawei’s Enterprise Business group was only set up in 2011, it achieved $1.5bn in revenues purely from opportunistic projects, for example as an extension of its existing carrier and consumer businesses. For 2011, sales in Enterprise Business grew to $1.5bn in revenues (up 57% yoy in Rmb terms), representing 4% of company’s overall sales as it introduced solutions and services focusing on enterprise networks, cloud computing, data centers and applications in verticals like finance, transportation, energy, power, public utilities, ISPs and governments. Over the past year, Huawei has emphasized the growing importance of Enterprise, supported by the belief that Carrier and Consumer markets will eventually cease to be distinct; and together with Enterprise they are expected to form an ecosystem in which complex problems are addressed through an integrated solution. For the Enterprise segment, although the company has not provided any specific targets for 2012, Huawei is hoping for sales here to grow faster in 2012 compared to 57% growth seen in 2011. In addition, long term it expects the Enterprise segment to account for as high as $15bn of revenue by 2015, with the specific goal being to take share from traditional IT hardware companies.
Figure 11: Huawei offers a range of products & services focused at Enterprise aimed at select verticals Brief description of Huawei’s Enterprise product and services portfolio
Source: Company data, Credit Suisse research
Aggressive headcount growth. At the end of 2011, Huawei employed around 140K employees of which over 62K employees (around 44% of total headcount) were engaged in R&D activities. Note this number is significantly higher than industry peers, with Nokia (including Nokia Siemens) having close to 35K R&D engineers. Within its Enterprise business specifically, the company employs around 10K personnel with over 6K devoted to R&D activities. In addition, the company in the past has also noted plans to increase its Enterprise headcount from around 10K to 20K/30K by the end of 2012/2013. In 2012, there may be an estimated 4K engineers working on cloud-based technologies, with relevant partnerships already established with carriers and research organizations alike. A central component of Huawei Enterprise’s growth strategy is acquisition of high quality human capital globally, with a particular focus among the North American teams on poaching top talent from Silicon Valley with extensive experience in complex systems.
15 May 2012
IT Hardware / Telco. Equipment 13
Leveraging Huawei’s broader strengths for growth within the Enterprise. To support its growth, the Enterprise business is also looking to tap into the company’s broader portfolio of nearly 60K patent applications (including patent applications in China, patents under patent cooperation treaties and patent applications overseas), which Huawei continues to focus on expanding. With regard to geographic presence, the bulk of its Enterprise Business today comes from Asia – specifically within China, somewhere in the range of 30-50%. The remainder of revenue comes from Africa and Europe, with a small portion from Latin America and almost zero revenue from North America. Within these markets, the primary verticals are government, education and infrastructure (transportation). Interestingly, for its Enterprise business, Huawei has adopted the same “outside in” strategy as the broader company, focusing first on penetrating relatively untapped markets (rural China, Eastern Europe and Canada).
Huawei Enterprise more comfortably positioned in NA than the Carrier Networks business. Moving forward, the company expects robust performance from the Enterprise Business given its extensive supply chain and sheer economies of scale as this business grows. In addition, unlike the Carrier Networks segment, Huawei’s Enterprise Business does not suffer from a significant political overhang in the US as the government tends to have less influence over the enterprise market and the level of government sensitivity varies widely in different enterprise verticals. This obviously creates further opportunity for Huawei to grow its Enterprise Business rapidly. That being said, Huawei still does not see the NA market as critical to its Enterprise expansion strategy. The primary challenge facing Huawei’s Enterprise Business today is building a channel model that will support scalable, go-to-market indirect distribution – this, in contrast to its current model of large, strategic deals to major customers.
Margin structure conducive to Huawei’s strategy on Enterprise side. Compared to some of the major players in the infrastructure space, Huawei commands gross margins in the range of 35-40% and operating margins of around 10% (as per Huawei’s 2011 annual report). This compares to Cisco and IBM’s gross/operating margins, which range around 60%/25% and 46%/20% respectively. While Huawei’s margins are considerably lower than those of its IT/Enterprise competitors, it is worth noting that despite a lower gross margin profile, Huawei continues to be an operationally well run organization. A close parallel has been drawn between Huawei’s approach to enterprise and its history of margin deflation tactics. Just as Huawei has built products at lower cost in the wireless infrastructure and smartphone markets, it intends to compete in enterprise by building channel programs that, from the outset, allow for better margins – a threatening strategy to competitors with higher margin structures firmly in place. The company in the past has noted that there has been significant consolidation and only a handful of new entrants into the IT market over the last decade. It increasingly believes that by offering a broad portfolio it can significantly shake up the competitive dynamics.
3) Ambitious plans in mobile phones/smartphones Within its Consumer segment, Huawei has seen significant traction within its mobile phone/smartphone business, which has resulted in sales of around US$7bn in 2011 for the Consumer Business (up 44% yoy in Rmb terms). Note this Consumer Business sales number also includes datacards, dongles, and other wireless and fixed network access terminals. In fact, the company noted that it shipped a total of 55mn mobile phones in 2011 (including nearly 20mn smartphones, up over 500% yoy). Even going forward, we believe that Huawei is poised to capture incremental smartphone share, and expect the company to grow its share to close to 9% in 2013, up from 3% in 2011 (Figure 13), given several factors:
15 May 2012
IT Hardware / Telco. Equipment 14
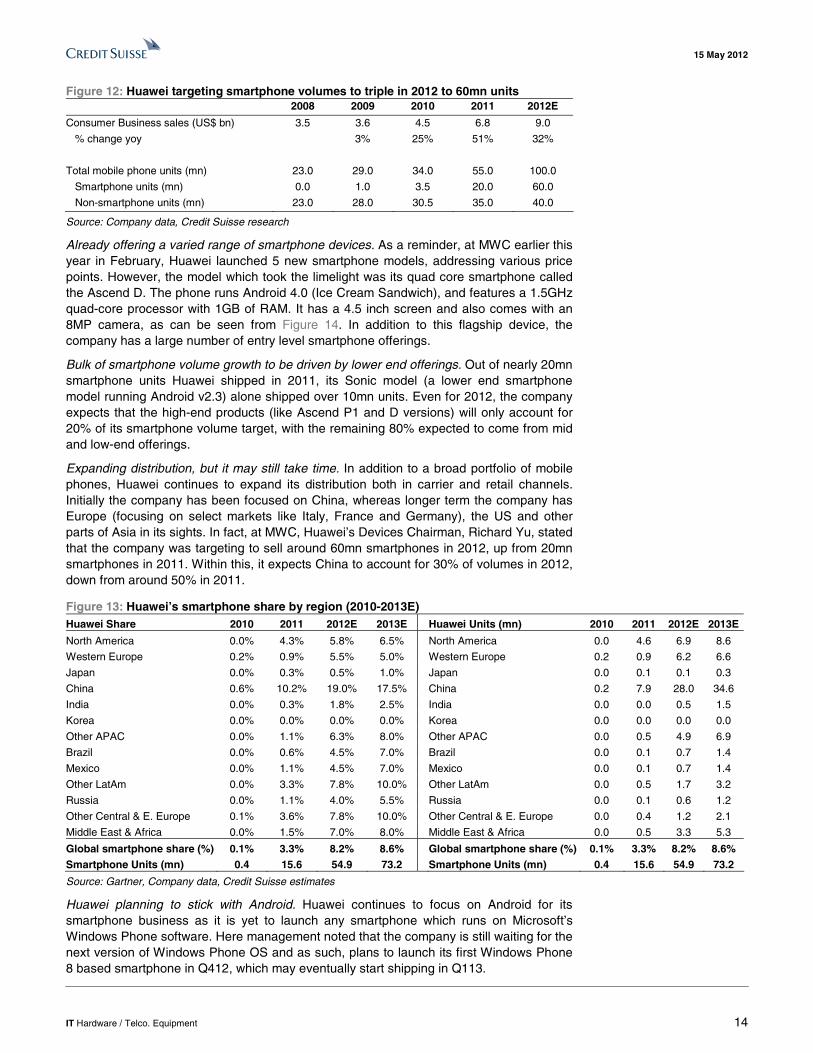
Figure 12: Huawei targeting smartphone volumes to triple in 2012 to 60mn units 2008 2009 2010 2011 2012E
Consumer Business sales (US$ bn) 3.5 3.6 4.5 6.8 9.0
% change yoy 3% 25% 51% 32%
Total mobile phone units (mn) 23.0 29.0 34.0 55.0 100.0
Smartphone units (mn) 0.0 1.0 3.5 20.0 60.0
Non-smartphone units (mn) 23.0 28.0 30.5 35.0 40.0
Source: Company data, Credit Suisse research
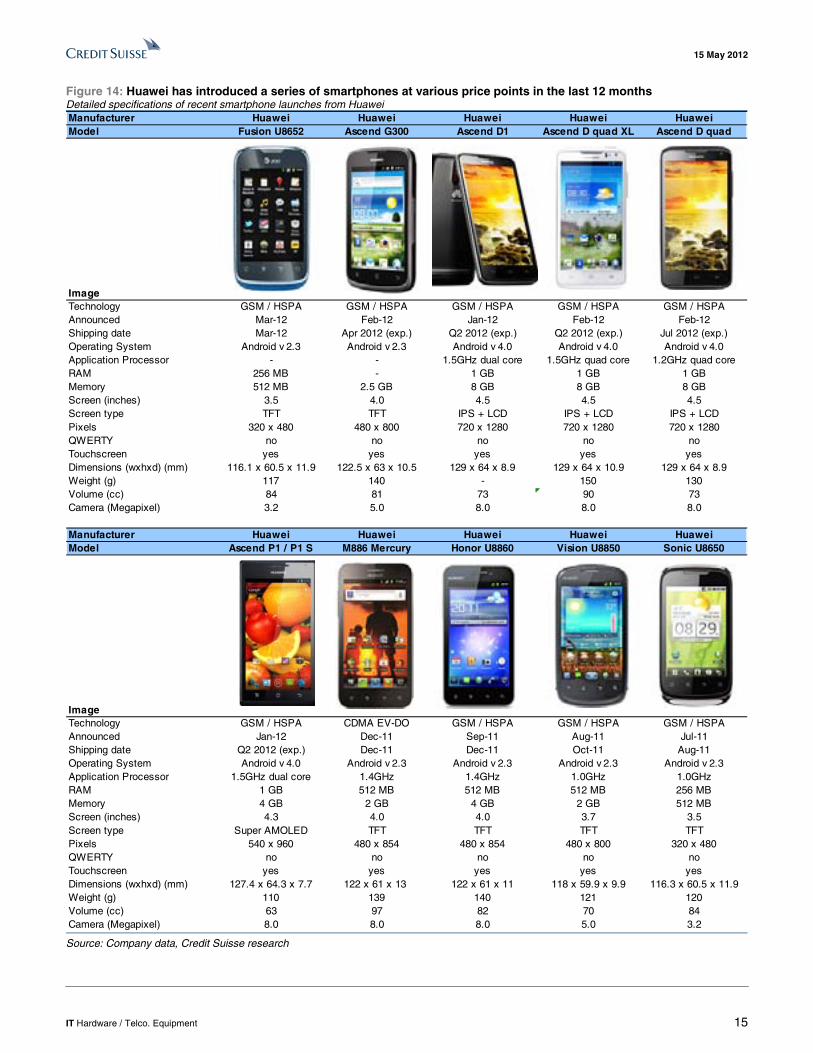
Already offering a varied range of smartphone devices. As a reminder, at MWC earlier this year in February, Huawei launched 5 new smartphone models, addressing various price points. However, the model which took the limelight was its quad core smartphone called the Ascend D. The phone runs Android 4.0 (Ice Cream Sandwich), and features a 1.5GHz quad-core processor with 1GB of RAM. It has a 4.5 inch screen and also comes with an 8MP camera, as can be seen from Figure 14. In addition to this flagship device, the company has a large number of entry level smartphone offerings.
Bulk of smartphone volume growth to be driven by lower end offerings. Out of nearly 20mn smartphone units Huawei shipped in 2011, its Sonic model (a lower end smartphone model running Android v2.3) alone shipped over 10mn units. Even for 2012, the company expects that the high-end products (like Ascend P1 and D versions) will only account for 20% of its smartphone volume target, with the remaining 80% expected to come from mid and low-end offerings.
Expanding distribution, but it may still take time. In addition to a broad portfolio of mobile phones, Huawei continues to expand its distribution both in carrier and retail channels. Initially the company has been focused on China, whereas longer term the company has Europe (focusing on select markets like Italy, France and Germany), the US and other parts of Asia in its sights. In fact, at MWC, Huawei’s Devices Chairman, Richard Yu, stated that the company was targeting to sell around 60mn smartphones in 2012, up from 20mn smartphones in 2011. Within this, it expects China to account for 30% of volumes in 2012, down from around 50% in 2011.
Figure 13: Huawei’s smartphone share by region (2010-2013E) Huawei Share 2010 2011 2012E 2013E Huawei Units (mn) 2010 2011 2012E 2013E
North America 0.0% 4.3% 5.8% 6.5% North America 0.0 4.6 6.9 8.6
Western Europe 0.2% 0.9% 5.5% 5.0% Western Europe 0.2 0.9 6.2 6.6
Japan 0.0% 0.3% 0.5% 1.0% Japan 0.0 0.1 0.1 0.3
China 0.6% 10.2% 19.0% 17.5% China 0.2 7.9 28.0 34.6
India 0.0% 0.3% 1.8% 2.5% India 0.0 0.0 0.5 1.5
Korea 0.0% 0.0% 0.0% 0.0% Korea 0.0 0.0 0.0 0.0
Other APAC 0.0% 1.1% 6.3% 8.0% Other APAC 0.0 0.5 4.9 6.9
Brazil 0.0% 0.6% 4.5% 7.0% Brazil 0.0 0.1 0.7 1.4
Mexico 0.0% 1.1% 4.5% 7.0% Mexico 0.0 0.1 0.7 1.4
Other LatAm 0.0% 3.3% 7.8% 10.0% Other LatAm 0.0 0.5 1.7 3.2
Russia 0.0% 1.1% 4.0% 5.5% Russia 0.0 0.1 0.6 1.2
Other Central & E. Europe 0.1% 3.6% 7.8% 10.0% Other Central & E. Europe 0.0 0.4 1.2 2.1
Middle East & Africa 0.0% 1.5% 7.0% 8.0% Middle East & Africa 0.0 0.5 3.3 5.3
Global smartphone share (%) 0.1% 3.3% 8.2% 8.6% Global smartphone share (%) 0.1% 3.3% 8.2% 8.6% Smartphone Units (mn) 0.4 15.6 54.9 73.2 Smartphone Units (mn) 0.4 15.6 54.9 73.2
Source: Gartner, Company data, Credit Suisse estimates
Huawei planning to stick with Android. Huawei continues to focus on Android for its smartphone business as it is yet to launch any smartphone which runs on Microsoft’s Windows Phone software. Here management noted that the company is still waiting for the next version of Windows Phone OS and as such, plans to launch its first Windows Phone 8 based smartphone in Q412, which may eventually start shipping in Q113.
15 May 2012
IT Hardware / Telco. Equipment 15
Figure 14: Huawei has introduced a series of smartphones at various price points in the last 12 months Detailed specifications of recent smartphone launches from Huawei Manufacturer Huawei Huawei Huawei Huawei HuaweiModel Fusion U8652 Ascend G300 Ascend D1 Ascend D quad XL Ascend D quad
ImageTechnology GSM / HSPA GSM / HSPA GSM / HSPA GSM / HSPA GSM / HSPAAnnounced Mar-12 Feb-12 Jan-12 Feb-12 Feb-12Shipping date Mar-12 Apr 2012 (exp.) Q2 2012 (exp.) Q2 2012 (exp.) Jul 2012 (exp.)Operating System Android v 2.3 Android v 2.3 Android v 4.0 Android v 4.0 Android v 4.0Application Processor - - 1.5GHz dual core 1.5GHz quad core 1.2GHz quad coreRAM 256 MB - 1 GB 1 GB 1 GBMemory 512 MB 2.5 GB 8 GB 8 GB 8 GBScreen (inches) 3.5 4.0 4.5 4.5 4.5Screen type TFT TFT IPS + LCD IPS + LCD IPS + LCDPixels 320 x 480 480 x 800 720 x 1280 720 x 1280 720 x 1280QWERTY no no no no noTouchscreen yes yes yes yes yesDimensions (wxhxd) (mm) 116.1 x 60.5 x 11.9 122.5 x 63 x 10.5 129 x 64 x 8.9 129 x 64 x 10.9 129 x 64 x 8.9Weight (g) 117 140 - 150 130Volume (cc) 84 81 73 90 73Camera (Megapixel) 3.2 5.0 8.0 8.0 8.0
Manufacturer Huawei Huawei Huawei Huawei HuaweiModel Ascend P1 / P1 S M886 Mercury Honor U8860 Vision U8850 Sonic U8650
ImageTechnology GSM / HSPA CDMA EV-DO GSM / HSPA GSM / HSPA GSM / HSPAAnnounced Jan-12 Dec-11 Sep-11 Aug-11 Jul-11Shipping date Q2 2012 (exp.) Dec-11 Dec-11 Oct-11 Aug-11Operating System Android v 4.0 Android v 2.3 Android v 2.3 Android v 2.3 Android v 2.3Application Processor 1.5GHz dual core 1.4GHz 1.4GHz 1.0GHz 1.0GHzRAM 1 GB 512 MB 512 MB 512 MB 256 MBMemory 4 GB 2 GB 4 GB 2 GB 512 MBScreen (inches) 4.3 4.0 4.0 3.7 3.5Screen type Super AMOLED TFT TFT TFT TFTPixels 540 x 960 480 x 854 480 x 854 480 x 800 320 x 480QWERTY no no no no noTouchscreen yes yes yes yes yesDimensions (wxhxd) (mm) 127.4 x 64.3 x 7.7 122 x 61 x 13 122 x 61 x 11 118 x 59.9 x 9.9 116.3 x 60.5 x 11.9Weight (g) 110 139 140 121 120Volume (cc) 63 97 82 70 84Camera (Megapixel) 8.0 8.0 8.0 5.0 3.2
Source: Company data, Credit Suisse research
15 May 2012
IT Hardware / Telco. Equipment 16
4) What is Huawei’s silicon strategy? Formed in 2004, HiSilicon was previously Huawei's ASIC design center (since 1991). HiSilicon designs ASICs for telecommunication networks, mobile devices, and digital media. Headquartered in Shenzhen, HiSilicon has design centers in Beijing, Shanghai, Silicon Valley (USA), Sweden, and Ontario (Canada). HiSilicon designs wireline network chips such as high-end IP router chips for Huawei, its parent company, and EETimes estimates that the chip will be ready by 2012. In the digital media field, HiSilicon has chips for network surveillance, set-top-boxes, DVB and IPTV.
Figure 15: Brief profile for HiSilicon Company Name HiSilicon
Headquarters Shenzhen
Design centers Shanghai, Chengdu, Beijing, Taiwan, Sweden, San Jose (US), Austin (US), Ontario
CEO Teresa He
Source: Company data, Credit Suisse research
To date, HiSilicon completed more than 120 chip designs and claims to have shipped 150mn chips. The IP router chip is the most sophisticated and ambitious project in the brief history of the secretive HiSilicon group. Per our channel checks, HiSilicon has hired the ex-Cisco microprocessor architect heading its router chip design team.
High-end ARM licensee. HiSilicon Technologies has licensed a range of ARM technology (Cortex-A9, Cortex-A15, Cortex-M3, CoreLink CCI-400 cache coherent interconnects fabric) for use across the breadth of its communications chip design activities including 3G/4G base-stations, networking infrastructure and applications processor. HiSilicon created the industry’s first eight-core ARM Cortex-A9 network SoC in 2011.
Figure 16: HiSilicon offers chips for use in wireless terminals, wireless and fixed networks and network access
terminals Segment Products
Wireless Terminal K3 Applications Processor, Balong 310/510/710 HSPA/LTE baseband modem chipset
Wireless Network High performance wireless networking chipsets (baseband for use in base-stations)
Fixed Network GPON/EPON chips, router chips, switching chips, carrier-grade IP network chip, traffic management chipset
Network Access Terminal Security & Surveillance, set-top box
Source: Company data, Credit Suisse research
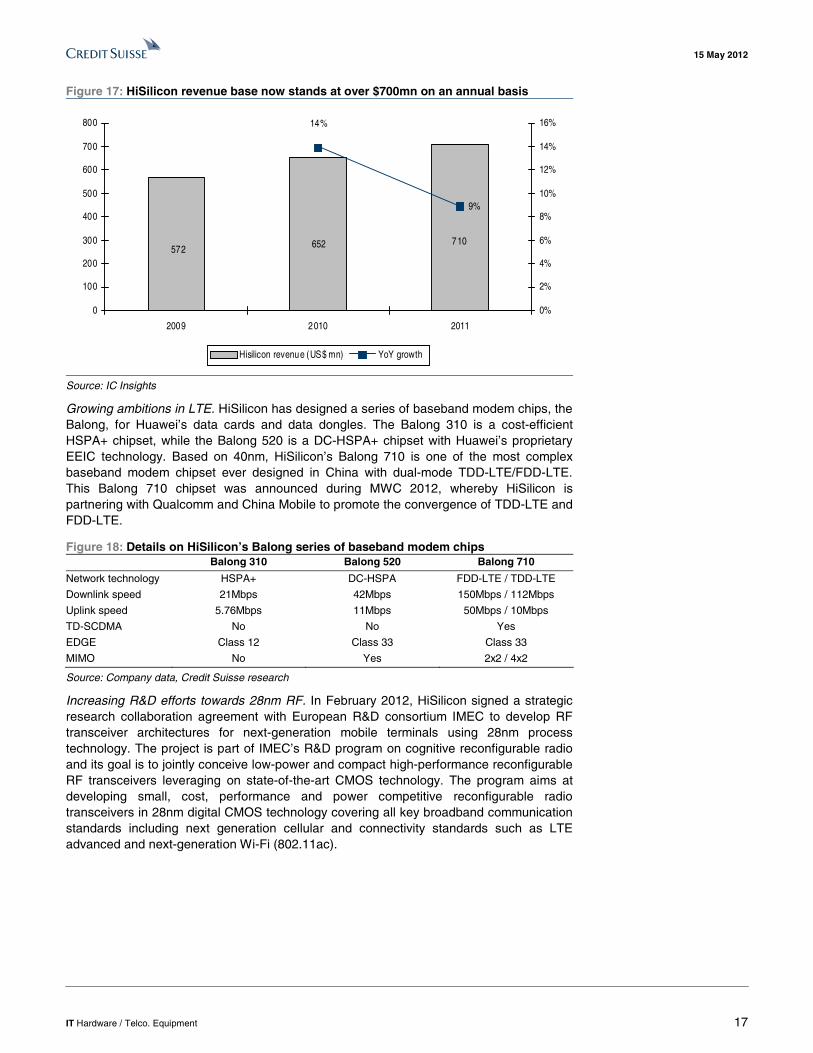
Revenue base of over $700mn. According to IC Insights, HiSilicon generated US$710mn revenue in 2011, up 9% yoy as shown in Figure 17. We estimate that 60% of its sales are from by Huawei, mainly in the wireless and fixed network products and wireless terminals. Its external sales are mainly aimed at security & surveillance and set-top-box chipsets. HiSilicon is the largest domestic surveillance chipset and set-top-box chipset maker.
15 May 2012
IT Hardware / Telco. Equipment 17
Figure 17: HiSilicon revenue base now stands at over $700mn on an annual basis
710572 652
9%
14%
0
100
200
300
400
500
600
700
800
2009 2010 2011
0%
2%
4%
6%
8%
10%
12%
14%
16%
Hisilicon revenue (US$ mn) YoY growth
Source: IC Insights
Growing ambitions in LTE. HiSilicon has designed a series of baseband modem chips, the Balong, for Huawei’s data cards and data dongles. The Balong 310 is a cost-efficient HSPA+ chipset, while the Balong 520 is a DC-HSPA+ chipset with Huawei’s proprietary EEIC technology. Based on 40nm, HiSilicon’s Balong 710 is one of the most complex baseband modem chipset ever designed in China with dual-mode TDD-LTE/FDD-LTE. This Balong 710 chipset was announced during MWC 2012, whereby HiSilicon is partnering with Qualcomm and China Mobile to promote the convergence of TDD-LTE and FDD-LTE.
Figure 18: Details on HiSilicon’s Balong series of baseband modem chips Balong 310 Balong 520 Balong 710
Network technology HSPA+ DC-HSPA FDD-LTE / TDD-LTE
Downlink speed 21Mbps 42Mbps 150Mbps / 112Mbps
Uplink speed 5.76Mbps 11Mbps 50Mbps / 10Mbps
TD-SCDMA No No Yes
EDGE Class 12 Class 33 Class 33
MIMO No Yes 2x2 / 4x2
Source: Company data, Credit Suisse research
Increasing R&D efforts towards 28nm RF. In February 2012, HiSilicon signed a strategic research collaboration agreement with European R&D consortium IMEC to develop RF transceiver architectures for next-generation mobile terminals using 28nm process technology. The project is part of IMEC’s R&D program on cognitive reconfigurable radio and its goal is to jointly conceive low-power and compact high-performance reconfigurable RF transceivers leveraging on state-of-the-art CMOS technology. The program aims at developing small, cost, performance and power competitive reconfigurable radio transceivers in 28nm digital CMOS technology covering all key broadband communication standards including next generation cellular and connectivity standards such as LTE advanced and next-generation Wi-Fi (802.11ac).

15 May 2012
IT Hardware / Telco. Equipment 18
Figure 19: HiSilicon’s K3V2 quad-core application processor with 16-core GPU
Source: Company data, Credit Suisse research
Launching its own applications processor for smartphones and tablets. HiSilicon has designed a quad-core applications processor with 16-core GPU. Compared to similar products from its peers with quad-core processors, HiSilicon’s chipset claims to have the smallest package size. In addition, HiSilicon claims that its chipset consumes less power than competition and yields lowest chip temperature amongst all current quad-core processors.
Figure 20: Comparing HiSilicon’s application processor to its peers HiSilicon K3V2 Qualcomm Snapdragon S4 TI OMAP 5 Nvidia Tegra 3
Core processor Quad-core ARM Cortex A9 Upto Dual and Quad-core Krait CPUs
2 ARM Cortex-A15 + 2 ARM Cortex-M4
Quad-core ARM Cortex A9 + 5th companion core
Speed 1.2 / 1.5 GHz 1.0 / 1.2 / 1.5 / 1.7 GHz 1.5 / 2.0 GHz 1.4 GHz
Cache 1MB L2 cache 1MB L2 cache 2MB L2 cache 1MB L2 cache
Memory interface 64-bit 533 MHz LPDDR2 Dual-channel 500 MHz LPDDR2
32-bit Dual-channel 533 MHz LPDDR2
32-bit Dual-channel 533 MHz LPDDR2
Graphics core 16-core Vivante GPU Upto Adreno 320 GPU Dual-core PowerVR SGX544MP2
ULP GeForce
Graphics capability 1.3Gpix/s, 80GFLOPS 1.0Gpix/s
Camera support 20Mpixel 20Mpixel 24Mpixel 32Mpixel
Video performance 1080p 60FPS 1080p 30FPS 1080p 60FPS 1080p 60FPS
Process technology 40nm LP 28nm LP 28nm LP 40nm LP
Package 12 x 12mm PoP 14 x 14mm PoP 14 x 14mm BGA
Availability 2H12 4Q11 3Q12 1Q12
Source: Company data, Credit Suisse research
More vertically integrated over time? With the recent launch of its new apps processor (K3V2) and baseband modem (Balong 710), Huawei now also has the option of being a more vertically integrated player in both smartphones and tablets over time. In fact, the company is already using its K3V2 apps processor in the recently announced Ascend D quad smartphone.
15 May 2012
IT Hardware / Telco. Equipment 19
5) R&D – remains a force to be reckoned with Both the IT hardware and telecom equipment sectors remain an R&D intensive business, which is crucial for ongoing cost reductions as well as maintaining a competitive advantage. Interestingly, Huawei’s capabilities here remain strong with the company continuing to add more resources to maintain its positioning with the industry.
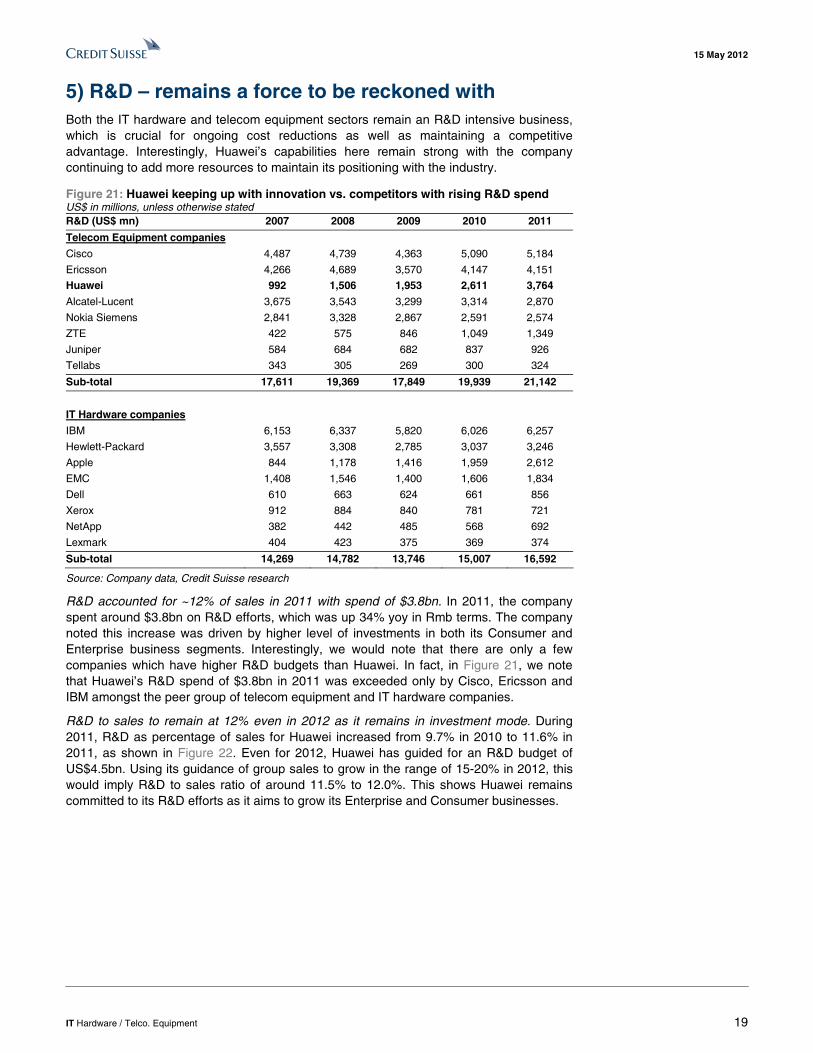
Figure 21: Huawei keeping up with innovation vs. competitors with rising R&D spend US$ in millions, unless otherwise stated R&D (US$ mn) 2007 2008 2009 2010 2011
Telecom Equipment companies
Cisco 4,487 4,739 4,363 5,090 5,184
Ericsson 4,266 4,689 3,570 4,147 4,151
Huawei 992 1,506 1,953 2,611 3,764
Alcatel-Lucent 3,675 3,543 3,299 3,314 2,870
Nokia Siemens 2,841 3,328 2,867 2,591 2,574
ZTE 422 575 846 1,049 1,349
Juniper 584 684 682 837 926
Tellabs 343 305 269 300 324
Sub-total 17,611 19,369 17,849 19,939 21,142
IT Hardware companies
IBM 6,153 6,337 5,820 6,026 6,257
Hewlett-Packard 3,557 3,308 2,785 3,037 3,246
Apple 844 1,178 1,416 1,959 2,612
EMC 1,408 1,546 1,400 1,606 1,834
Dell 610 663 624 661 856
Xerox 912 884 840 781 721
NetApp 382 442 485 568 692
Lexmark 404 423 375 369 374
Sub-total 14,269 14,782 13,746 15,007 16,592
Source: Company data, Credit Suisse research
R&D accounted for ~12% of sales in 2011 with spend of $3.8bn. In 2011, the company spent around $3.8bn on R&D efforts, which was up 34% yoy in Rmb terms. The company noted this increase was driven by higher level of investments in both its Consumer and Enterprise business segments. Interestingly, we would note that there are only a few companies which have higher R&D budgets than Huawei. In fact, in Figure 21, we note that Huawei’s R&D spend of $3.8bn in 2011 was exceeded only by Cisco, Ericsson and IBM amongst the peer group of telecom equipment and IT hardware companies.
R&D to sales to remain at 12% even in 2012 as it remains in investment mode. During 2011, R&D as percentage of sales for Huawei increased from 9.7% in 2010 to 11.6% in 2011, as shown in Figure 22. Even for 2012, Huawei has guided for an R&D budget of US$4.5bn. Using its guidance of group sales to grow in the range of 15-20% in 2012, this would imply R&D to sales ratio of around 11.5% to 12.0%. This shows Huawei remains committed to its R&D efforts as it aims to grow its Enterprise and Consumer businesses.

15 May 2012
IT Hardware / Telco. Equipment 20
Figure 22: R&D to sales for Telecom Equipment sector… Figure 23: …and the same for IT Hardware sector
0%
5%
10%
15%
20%
25%
30%
ZTE Huawei Cisco Ericsson NokiaSiemens
Alcatel-Lucent Juniper Tellabs
R&D to sales (%)
2007 2008 2009 2010 2011
2011 average = 15%
0%
5%
10%
15%
Dell Apple Hewlett-Packard
Xerox IBM Lexmark EMC NetApp
R&D to sales (%)
2007 2008 2009 2010 2011
2011 average = 6%
Source: Company data, Credit Suisse research Source: Company data, Credit Suisse research
Also a significant number of staff to be reckoned with. As shown in Figure 24, at the end of 2011, Huawei employed some 140K employees, of which 62K or 44% were in R&D. This is significantly higher than 34% at ZTE (c30K R&D staff), 27% at Nokia (35K R&D engineers including Nokia Siemens) and 21% at Ericsson (c22K R&D employees). In addition, interestingly the R&D cost per R&D employee Huawei is $61K versus Ericsson at $185K and Nokia at $180K as shown in Figure 25, with only ZTE operating at a lower cost (at around $45K). In addition to the higher level of R&D headcount, we believe this lower cost per employee in R&D continues to give Huawei a material cost advantage versus peers. This is aided by the company having a well distributed R&D base. Although in the past, Huawei had a local R&D bias, now the company has R&D operations throughout the world with centers in India, US, Germany, Russia and Sweden.
Figure 24: With 62K R&D staff, Huawei remains a force… Figure 25: …especially with the cost advantage in R&D
0
10
20
30
40
50
60
70
Tellabs Juniper Cisco Ericsson Alcatel-Lucent Nokia (inclNSN)
ZTE Huawei
R&D employee count ('000)
2007 2008 2009 2010 2011
4561
128
180 185
217 224246
0
50
100
150
200
250
300
ZTE Huawei Alcatel-Lucent Nokia Ericsson Tellabs Juniper Cisco
R&D cost per R&D employee (US$ '000) in 2011
Source: Company data, Credit Suisse research Source: Company data, Credit Suisse research
15 May 2012
IT Hardware / Telco. Equipment 21
Companies Mentioned (Price as of 14 May 12) Alcatel-Lucent (ALUA.PA, Eu1.17, UNDERPERFORM [V], TP Eu1.20) Apple Inc. (AAPL, $558.22, OUTPERFORM, TP $750.00) Cisco Systems Inc. (CSCO, $16.70, OUTPERFORM, TP $27.00) Dell Inc. (DELL, $15.44, UNDERPERFORM, TP $16.00) EMC Corp. (EMC, $26.10, OUTPERFORM, TP $35.00) Ericsson (ERICb.ST, SKr61.45, NEUTRAL, TP SKr57.50) Google, Inc. (GOOG, $604.00, OUTPERFORM, TP $770.00) Hewlett-Packard (HPQ, $22.98, NEUTRAL, TP $30.00) International Business Machines (IBM, $199.44, NEUTRAL, TP $200.00) Juniper Networks (JNPR, $17.57, NEUTRAL, TP $21.00) Lexmark International (LXK, $28.14, UNDERPERFORM, TP $28.00) Microsoft Corp. (MSFT, $30.68, OUTPERFORM, TP $38.00) NetApp Inc. (NTAP, $35.79, NEUTRAL, TP $45.00) Nokia (NOK1V.HE, Eu2.33, OUTPERFORM [V], TP Eu4.50) Nvidia Corporation (NVDA, $13.13) QUALCOMM Inc. (QCOM, $61.46, OUTPERFORM, TP $75.00) Siemens (SIEGn.DE, Eu67.10, OUTPERFORM, TP Eu90.00) Tellabs (TLAB, $3.65) Texas Instruments Inc. (TXN, $30.65, OUTPERFORM, TP $40.00) Xerox Corporation (XRX, $7.69, NEUTRAL, TP $9.00) ZTE Corporation (0763.HK, HK$16.98, OUTPERFORM, TP HK$28.00)
Disclosure Appendix Important Global Disclosures I, Kulbinder Garcha, certify that (1) the views expressed in this report accurately reflect my personal views about all of the subject companies and securities and (2) no part of my compensation was, is or will be directly or indirectly related to the specific recommendations or views expressed in this report. The analyst(s) responsible for preparing this research report received compensation that is based upon various factors including Credit Suisse's total revenues, a portion of which are generated by Credit Suisse's investment banking activities. Analysts’ stock ratings are defined as follows: Outperform (O): The stock’s total return is expected to outperform the relevant benchmark* by at least 10-15% (or more, depending on perceived risk) over the next 12 months. Neutral (N): The stock’s total return is expected to be in line with the relevant benchmark* (range of ±10-15%) over the next 12 months. Underperform (U): The stock’s total return is expected to underperform the relevant benchmark* by 10-15% or more over the next 12 months. *Relevant benchmark by region: As of 29th May 2009, Australia, New Zealand, U.S. and Canadian ratings are based on (1) a stock’s absolute total return potential to its current share price and (2) the relative attractiveness of a stock’s total return potential within an analyst’s coverage universe**, with Outperforms representing the most attractive, Neutrals the less attractive, and Underperforms the least attractive investment opportunities. Some U.S. and Canadian ratings may fall outside the absolute total return ranges defined above, depending on market conditions and industry factors. For Latin American, Japanese, and non-Japan Asia stocks, ratings are based on a stock’s total return relative to the average total return of the relevant country or regional benchmark; for European stocks, ratings are based on a stock’s total return relative to the analyst's coverage universe**. For Australian and New Zealand stocks, 12-month rolling yield is incorporated in the absolute total return calculation and a 15% and a 7.5% threshold replace the 10-15% level in the Outperform and Underperform stock rating definitions, respectively. The 15% and 7.5% thresholds replace the +10-15% and -10-15% levels in the Neutral stock rating definition, respectively. **An analyst's coverage universe consists of all companies covered by the analyst within the relevant sector. Restricted (R): In certain circumstances, Credit Suisse policy and/or applicable law and regulations preclude certain types of communications, including an investment recommendation, during the course of Credit Suisse's engagement in an investment banking transaction and in certain other circumstances. Volatility Indicator [V]: A stock is defined as volatile if the stock price has moved up or down by 20% or more in a month in at least 8 of the past 24 months or the analyst expects significant volatility going forward.
Analysts’ coverage universe weightings are distinct from analysts’ stock ratings and are based on the expected performance of an analyst’s coverage universe* versus the relevant broad market benchmark**: Overweight: Industry expected to outperform the relevant broad market benchmark over the next 12 months. Market Weight: Industry expected to perform in-line with the relevant broad market benchmark over the next 12 months. Underweight: Industry expected to underperform the relevant broad market benchmark over the next 12 months. *An analyst’s coverage universe consists of all companies covered by the analyst within the relevant sector. **The broad market benchmark is based on the expected return of the local market index (e.g., the S&P 500 in the U.S.) over the next 12 months.

15 May 2012
IT Hardware / Telco. Equipment 22
Credit Suisse’s distribution of stock ratings (and banking clients) is:
Global Ratings Distribution Outperform/Buy* 47% (59% banking clients) Neutral/Hold* 41% (57% banking clients) Underperform/Sell* 10% (51% banking clients) Restricted 2%
*For purposes of the NYSE and NASD ratings distribution disclosure requirements, our stock ratings of Outperform, Neutral, and Underperform most closely correspond to Buy, Hold, and Sell, respectively; however, the meanings are not the same, as our stock ratings are determined on a relative basis. (Please refer to definitions above.) An investor's decision to buy or sell a security should be based on investment objectives, current holdings, and other individual factors.
Credit Suisse’s policy is to update research reports as it deems appropriate, based on developments with the subject company, the sector or the market that may have a material impact on the research views or opinions stated herein.
Credit Suisse's policy is only to publish investment research that is impartial, independent, clear, fair and not misleading. For more detail please refer to Credit Suisse's Policies for Managing Conflicts of Interest in connection with Investment Research: http://www.csfb.com/research-and-analytics/disclaimer/managing_conflicts_disclaimer.html
Credit Suisse does not provide any tax advice. Any statement herein regarding any US federal tax is not intended or written to be used, and cannot be used, by any taxpayer for the purposes of avoiding any penalties. Important Regional Disclosures Singapore recipients should contact a Singapore financial adviser for any matters arising from this research report.
Restrictions on certain Canadian securities are indicated by the following abbreviations: NVS--Non-Voting shares; RVS--Restricted Voting Shares; SVS--Subordinate Voting Shares. Individuals receiving this report from a Canadian investment dealer that is not affiliated with Credit Suisse should be advised that this report may not contain regulatory disclosures the non-affiliated Canadian investment dealer would be required to make if this were its own report. For Credit Suisse Securities (Canada), Inc.'s policies and procedures regarding the dissemination of equity research, please visit http://www.csfb.com/legal_terms/canada_research_policy.shtml.
The following disclosed European company/ies have estimates that comply with IFRS: ALUA.PA, ERICb.ST, NOK1V.HE, SIEGn.DE.
As of the date of this report, Credit Suisse acts as a market maker or liquidity provider in the equities securities that are the subject of this report.
Principal is not guaranteed in the case of equities because equity prices are variable. Commission is the commission rate or the amount agreed with a customer when setting up an account or at anytime after that. Taiwanese Disclosures: This research report is for reference only. Investors should carefully consider their own investment risk. Investment results are the responsibility of the individual investor. Reports may not be reprinted without permission of CS. Reports written by Taiwan-based analysts on non-Taiwan listed companies are not considered recommendations to buy or sell securities under Taiwan Stock Exchange Operational Regulations Governing Securities Firms Recommending Trades in Securities to Customers. To the extent this is a report authored in whole or in part by a non-U.S. analyst and is made available in the U.S., the following are important disclosures regarding any non-U.S. analyst contributors: The non-U.S. research analysts listed below (if any) are not registered/qualified as research analysts with FINRA. The non-U.S. research analysts listed below may not be associated persons of CSSU and therefore may not be subject to the NASD Rule 2711 and NYSE Rule 472 restrictions on communications with a subject company, public appearances and trading securities held by a research analyst account. • Achal Sultania, non-U.S. analyst, is a research analyst employed by Credit Suisse Securities (Europe) Limited. Important Credit Suisse HOLT Disclosures With respect to the analysis in this report based on the Credit Suisse HOLT methodology, Credit Suisse certifies that (1) the views expressed in this report accurately reflect the Credit Suisse HOLT methodology and (2) no part of the Firm’s compensation was, is, or will be directly related to the specific views disclosed in this report. The Credit Suisse HOLT methodology does not assign ratings to a security. It is an analytical tool that involves use of a set of proprietary quantitative algorithms and warranted value calculations, collectively called the Credit Suisse HOLT valuation model, that are consistently applied to all the companies included in its database. Third-party data (including consensus earnings estimates) are systematically translated into a number of default variables and incorporated into the algorithms available in the Credit Suisse HOLT valuation model. The source financial statement, pricing, and earnings data provided by outside data vendors are subject to quality control and may also be adjusted to more closely measure the underlying economics of firm performance. These adjustments provide consistency when analyzing a single company across time, or analyzing multiple companies across industries or national borders. The default scenario that is produced by the Credit Suisse HOLT valuation model establishes the baseline valuation for a security, and a user then may adjust the default variables to produce alternative scenarios, any of which could occur. Additional information about the Credit Suisse HOLT methodology is available on request. The Credit Suisse HOLT methodology does not assign a price target to a security. The default scenario that is produced by the Credit Suisse HOLT valuation model establishes a warranted price for a security, and as the third-party data are updated, the warranted price may also change. The default variables may also be adjusted to produce alternative warranted prices, any of which could occur. CFROI®, HOLT, HOLTfolio, HOLTSelect, ValueSearch, AggreGator, Signal Flag and “Powered by HOLT” are trademarks or service marks or registered trademarks or registered service marks of Credit Suisse or its affiliates in the United States and other countries. HOLT is a corporate performance and valuation advisory service of Credit Suisse.
15 May 2012
IT Hardware / Telco. Equipment 23
Additional information about the Credit Suisse HOLT methodology is available on request. For Credit Suisse disclosure information on other companies mentioned in this report, please visit the website at www.credit-suisse.com/researchdisclosures or call +1 (877) 291-2683. Disclaimers continue on next page.
15 May 2012
Equity Research
Huawei 2012 note_MASTER.doc
This report is not directed to, or intended for distribution to or use by, any person or entity who is a citizen or resident of or located in any locality, state, country or other jurisdiction where such distribution, publication, availability or use would be contrary to law or regulation or which would subject Credit Suisse AG, the Swiss bank, or its subsidiaries or its affiliates (“CS”) to any registration or licensing requirement within such jurisdiction. All material presented in this report, unless specifically indicated otherwise, is under copyright to CS. None of the material, nor its content, nor any copy of it, may be altered in any way, transmitted to, copied or distributed to any other party, without the prior express written permission of CS. All trademarks, service marks and logos used in this report are trademarks or service marks or registered trademarks or service marks of CS or its affiliates. The information, tools and material presented in this report are provided to you for information purposes only and are not to be used or considered as an offer or the solicitation of an offer to sell or to buy or subscribe for securities or other financial instruments. CS may not have taken any steps to ensure that the securities referred to in this report are suitable for any particular investor. CS will not treat recipients as its customers by virtue of their receiving the report. The investments or services contained or referred to in this report may not be suitable for you and it is recommended that you consult an independent investment advisor if you are in doubt about such investments or investment services. Nothing in this report constitutes investment, legal, accounting or tax advice or a representation that any investment or strategy is suitable or appropriate to your individual circumstances or otherwise constitutes a personal recommendation to you. CS does not offer advice on the tax consequences of investment and you are advised to contact an independent tax adviser. Please note in particular that the bases and levels of taxation may change. CS believes the information and opinions in the Disclosure Appendix of this report are accurate and complete. Information and opinions presented in the other sections of the report were obtained or derived from sources CS believes are reliable, but CS makes no representations as to their accuracy or completeness. Additional information is available upon request. CS accepts no liability for loss arising from the use of the material presented in this report, except that this exclusion of liability does not apply to the extent that liability arises under specific statutes or regulations applicable to CS. This report is not to be relied upon in substitution for the exercise of independent judgment. CS may have issued, and may in the future issue, a trading call regarding this security. Trading calls are short term trading opportunities based on market events and catalysts, while stock ratings reflect investment recommendations based on expected total return over a 12-month period as defined in the disclosure section. Because trading calls and stock ratings reflect different assumptions and analytical methods, trading calls may differ directionally from the stock rating. In addition, CS may have issued, and may in the future issue, other reports that are inconsistent with, and reach different conclusions from, the information presented in this report. Those reports reflect the different assumptions, views and analytical methods of the analysts who prepared them and CS is under no obligation to ensure that such other reports are brought to the attention of any recipient of this report. CS is involved in many businesses that relate to companies mentioned in this report. These businesses include specialized trading, risk arbitrage, market making, and other proprietary trading. Past performance should not be taken as an indication or guarantee of future performance, and no representation or warranty, express or implied, is made regarding future performance. Information, opinions and estimates contained in this report reflect a judgement at its original date of publication by CS and are subject to change without notice. The price, value of and income from any of the securities or financial instruments mentioned in this report can fall as well as rise. The value of securities and financial instruments is subject to exchange rate fluctuation that may have a positive or adverse effect on the price or income of such securities or financial instruments. Investors in securities such as ADR’s, the values of which are influenced by currency volatility, effectively assume this risk. Structured securities are complex instruments, typically involve a high degree of risk and are intended for sale only to sophisticated investors who are capable of understanding and assuming the risks involved. The market value of any structured security may be affected by changes in economic, financial and political factors (including, but not limited to, spot and forward interest and exchange rates), time to maturity, market conditions and volatility, and the credit quality of any issuer or reference issuer. Any investor interested in purchasing a structured product should conduct their own investigation and analysis of the product and consult with their own professional advisers as to the risks involved in making such a purchase. Some investments discussed in this report have a high level of volatility. High volatility investments may experience sudden and large falls in their value causing losses when that investment is realised. Those losses may equal your original investment. Indeed, in the case of some investments the potential losses may exceed the amount of initial investment, in such circumstances you may be required to pay more money to support those losses. Income yields from investments may fluctuate and, in consequence, initial capital paid to make the investment may be used as part of that income yield. Some investments may not be readily realisable and it may be difficult to sell or realise those investments, similarly it may prove difficult for you to obtain reliable information about the value, or risks, to which such an investment is exposed. This report may provide the addresses of, or contain hyperlinks to, websites. Except to the extent to which the report refers to website material of CS, CS has not reviewed the linked site and takes no responsibility for the content contained therein. Such address or hyperlink (including addresses or hyperlinks to CS’s own website material) is provided solely for your convenience and information and the content of the linked site does not in any way form part of this document. Accessing such website or following such link through this report or CS’s website shall be at your own risk. This report is issued and distributed in Europe (except Switzerland) by Credit Suisse Securities (Europe) Limited, One Cabot Square, London E14 4QJ, England, which is regulated in the United Kingdom by The Financial Services Authority (“FSA”). This report is being distributed in Germany by Credit Suisse Securities (Europe) Limited Niederlassung Frankfurt am Main regulated by the Bundesanstalt fuer Finanzdienstleistungsaufsicht ("BaFin"). This report is being distributed in the United States by Credit Suisse Securities (USA) LLC ; in Switzerland by Credit Suisse AG; in Canada by Credit Suisse Securities (Canada), Inc.; in Brazil by Banco de Investimentos Credit Suisse (Brasil) S.A. or its affiliates; in Mexico by Banco Credit Suisse (México), S.A. (transactions related to the securities mentioned in this report will only be effected in compliance with applicable regulation); in Japan by Credit Suisse Securities (Japan) Limited, Financial Instrument Firm, Director-General of Kanto Local Finance Bureau (Kinsho) No. 66, a member of Japan Securities Dealers Association, The Financial Futures Association of Japan, Japan Securities Investment Advisers Association, Type II Financial Instruments Firms Association; elsewhere in Asia/Pacific by whichever of the following is the appropriately authorised entity in the relevant jurisdiction: Credit Suisse (Hong Kong) Limited, Credit Suisse Equities (Australia) Limited , Credit Suisse Securities (Thailand) Limited, Credit Suisse Securities (Malaysia) Sdn Bhd, Credit Suisse AG, Singapore Branch, Credit Suisse Securities (India) Private Limited regulated by the Securities and Exchange Board of India (registration Nos. INB230970637; INF230970637; INB010970631; INF010970631), having registered address at 9th Floor, Ceejay House,Dr.A.B. Road, Worli, Mumbai - 18, India, T- +91-22 6777 3777, Credit Suisse Securities (Europe) Limited, Seoul Branch, Credit Suisse AG, Taipei Securities Branch, PT Credit Suisse Securities Indonesia, Credit Suisse Securities (Philippines ) Inc., and elsewhere in the world by the relevant authorised affiliate of the above. Research on Taiwanese securities produced by Credit Suisse AG, Taipei Securities Branch has been prepared by a registered Senior Business Person. Research provided to residents of Malaysia is authorised by the Head of Research for Credit Suisse Securities (Malaysia) Sdn. Bhd., to whom they should direct any queries on +603 2723 2020. In jurisdictions where CS is not already registered or licensed to trade in securities, transactions will only be effected in accordance with applicable securities legislation, which will vary from jurisdiction to jurisdiction and may require that the trade be made in accordance with applicable exemptions from registration or licensing requirements. Non-U.S. customers wishing to effect a transaction should contact a CS entity in their local jurisdiction unless governing law permits otherwise. U.S. customers wishing to effect a transaction should do so only by contacting a representative at Credit Suisse Securities (USA) LLC in the U.S. Please note that this report was originally prepared and issued by CS for distribution to their market professional and institutional investor customers. Recipients who are not market professional or institutional investor customers of CS should seek the advice of their independent financial advisor prior to taking any investment decision based on this report or for any necessary explanation of its contents. This research may relate to investments or services of a person outside of the UK or to other matters which are not regulated by the FSA or in respect of which the protections of the FSA for private customers and/or the UK compensation scheme may not be available, and further details as to where this may be the case are available upon request in respect of this report. Any Nielsen Media Research material contained in this report represents Nielsen Media Research's estimates and does not represent facts. NMR has neither reviewed nor approved this report and/or any of the statements made herein. If this report is being distributed by a financial institution other than Credit Suisse AG, or its affiliates, that financial institution is solely responsible for distribution. Clients of that institution should contact that institution to effect a transaction in the securities mentioned in this report or require further information. This report does not constitute investment advice by Credit Suisse to the clients of the distributing financial institution, and neither Credit Suisse AG, its affiliates, and their respective officers, directors and employees accept any liability whatsoever for any direct or consequential loss arising from their use of this report or its content. Copyright 2012 CREDIT SUISSE AG and/or its affiliates. All rights reserved.