Embed Size (px)
Citation preview

IT Human Resource
Need Assessment Study
Pakistan Software Export Board (PSEB)
March 2006
Prepared By: NU-Consulting (FAST) FAST House, AK Brohi Road H-11/4, Islamabad
IT Human Resource Need Assessment Study
Table of Contents
2
Executive Summary ____________________________________________________ 4
1. Preamble ___________________________________________________________ 7
2. Purpose of the Study _______________________________________________ 9 2.1 The building Block _____________________________________________________ 9 2.2 Objectives ___________________________________________________________ 11 2.3 Study Limitations_____________________________________________________ 11
3. Methodology ______________________________________________________ 13 3.1 Population and Sample ________________________________________________ 13 3.2 Unit of Analysis _______________________________________________________ 14 3.3 Variables and Instrument________________________________________________ 14 3.4 Data Collection ________________________________________________________ 15 3.5 Response ______________________________________________________________ 16 3.6 Model Construction: ____________________________________________________ 17 3.7 Modeling Techniques: ___________________________________________________ 17 3.8 Time Series Linear Regression Analysis: ___________________________________ 17 3.9 Time Series Curvilinear Regression Analysis: ______________________________ 18 3.10 Measuring Goodness of fit ______________________________________________ 18
4. Analysis and Findings ______________________________________________ 19 4.1 Findings_______________________________________________________________ 19
4.1.1 Breakdown of IT Professionals by sector. ___________________________________ 20 4.1.2 Breakdown of IT Professionals by Skills. _____________________________________ 21 4.1.3 Breakdown of IT Professionals by Qualification._______________________________ 22 4.1.4 Estimated new job positions broken down by Sector (2006 – 2015). _____________ 23 4.1.5 Breakdown of Job positions in Non IT Sector. _________________________________ 25 4.1.6 Estimated new job positions in the IT/Non IT Sectors broken down by Skills (2006 – 2015). _________________________________________________________________________ 26 4.1.7 Supply of IT Professionals in the Industry (2006 – 2015). _________________________ 30 4.1.8 Comparison of Demand and Supply (2006-2015). ____________________________ 31
4.2 Tools of Analysis_______________________________________________________ 33 4.2.1 The General Model_________________________________________________________ 33 4.2.2 Equation of Best Fit ________________________________________________________ 34 4.2.3 Use of F and t-test__________________________________________________________ 35 4.2.4 The Coefficient of Determination_____________________________________________ 36 4.2.5 The Normal Probability Plot _________________________________________________ 36
4.3 Underlying Factors:_____________________________________________________ 36 5. Conclusion ___________________________________________________________ 39
5.1 The number game _______________________________________________________ 39
IT Human Resource Need Assessment Study
Table of Contents
3
5.2 Supply-Demand Situation ________________________________________________ 39 5.4 The Curriculum Revision_________________________________________________ 40 5.5 The Standardization________________________________________________________ 41
Glossary _________________________________________________________________ 42
Annexure 2 Questionnaires to Industry (IT & Non IT) Annexure 3 Questionnaires to Academia (Universities) Annexure 4 Facts and findings (Tables/Graphs/Pie Charts)
Report on IT Human Resource Need Assessment
4
Executive Summary
As IT sector is growing at a very rapid rate since 1990’s hence the focus of the
study is on the development of the required infrastructure and availability of
relevant human resources. The study is essentially a survey leading to
findings and conclusions regarding the current status and future
requirements of the Pakistani IT industry in terms of Human Resource. Main
variables were the current number of employees, their break down by
qualification, by skills, future job openings, qualification for future positions
and skills for future job openings. The statistics on future job openings from
2006 to 2010 by sector and by skill set are prepared to meet the objectives of
the study.
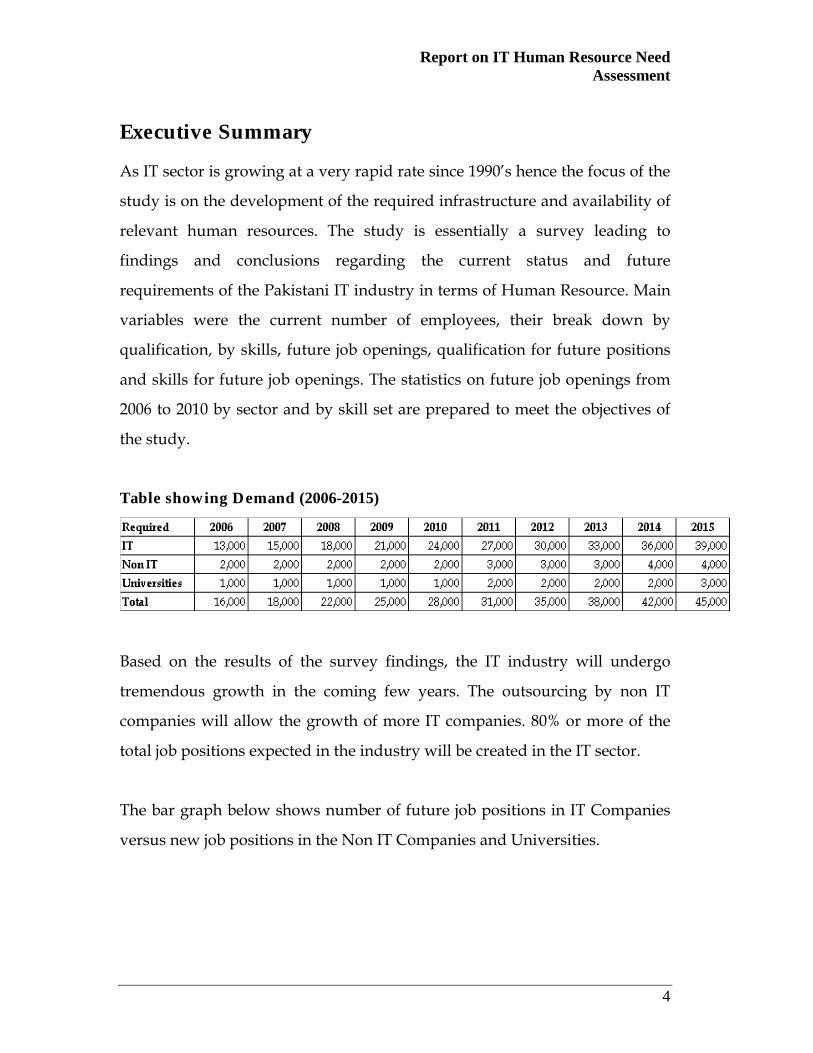
Table showing Demand (2006-2015)
Based on the results of the survey findings, the IT industry will undergo
tremendous growth in the coming few years. The outsourcing by non IT
companies will allow the growth of more IT companies. 80% or more of the
total job positions expected in the industry will be created in the IT sector.
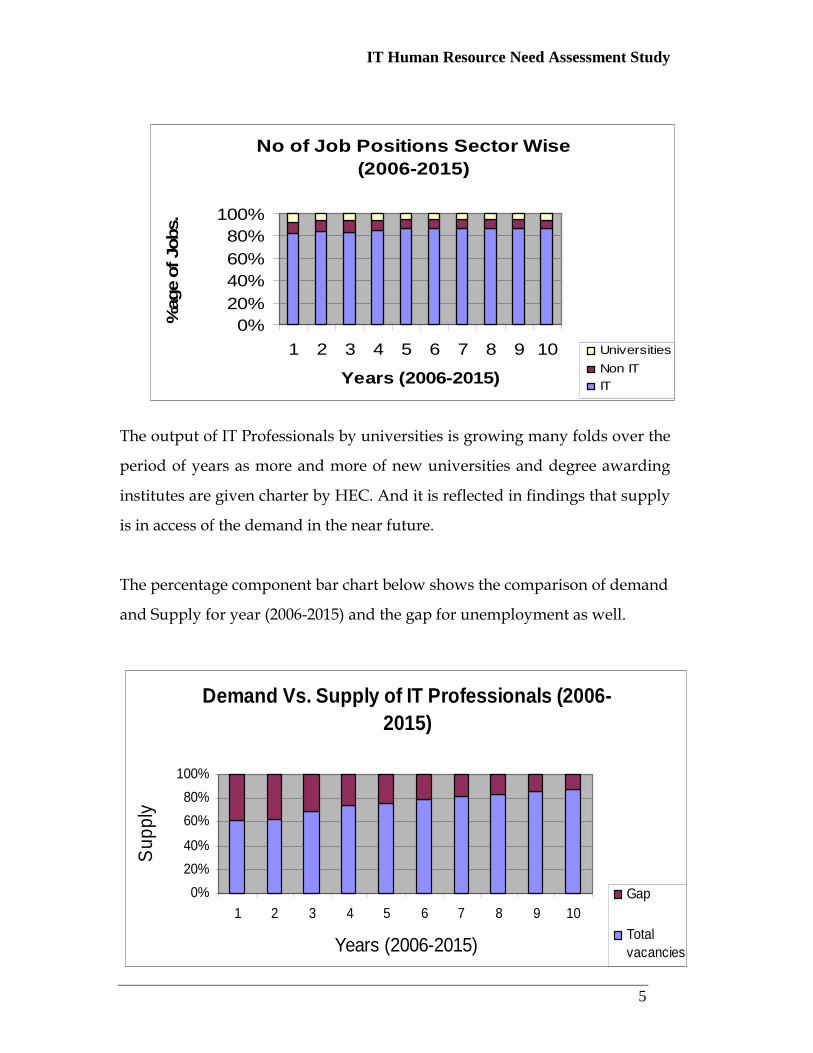
The bar graph below shows number of future job positions in IT Companies
versus new job positions in the Non IT Companies and Universities.
IT Human Resource Need Assessment Study
5
The output of IT Professionals by universities is growing many folds over the
period of years as more and more of new universities and degree awarding
institutes are given charter by HEC. And it is reflected in findings that supply
is in access of the demand in the near future.
The percentage component bar chart below shows the comparison of demand
and Supply for year (2006-2015) and the gap for unemployment as well.
No of Job Positions Sector Wise (2006-2015)
0%20%40%60%80%
100%
1 2 3 4 5 6 7 8 9 10
Years (2006-2015)
%ag
e of
Job
s.
UniversitiesNon ITIT
Demand Vs. Supply of IT Professionals (2006-2015)
0%20%40%
60%80%
100%
1 2 3 4 5 6 7 8 9 10
Years (2006-2015)
Sup
ply
Gap
Totalvacancies

IT Human Resource Need Assessment Study
6
It is indeed evident from the above graph that in the long term that gap will
be reduced by hiring in the govt. and defense organizations and due to the
creation of new IT companies in response to the growing IT needs of the non
IT companies.
Current number of IT Professionals in the Industry is estimated at 46,000 out
of which 74% are employed in the IT companies, 17% in non IT (plc)
Companies listed at KSE, and 9% are employed in Universities and degree
awarding institutes. Another 42,0001 are estimated to be employed by
Defense, Government and Private limited companies.
Currently Employed 2005
IT Companies 34,000
Non IT Companies (Public Limited) 8,000
Universities 4,000
Total 46,000
Govt. & Defense Org. (Estimated) 25000
SECP registered Pvt Limited
Companies. (Estimated) 17000
Grand Total 88,0002
The study reflects on many interesting aspects of which the most important
one is the shift of IT professionals amongst various skill sets available. The
study clearly indicates that the quality of fresh graduates entering the
industry is not to the market standards and industry incurs heavy cost on job
training and development and yet the retention of trained professionals is an
issue. Industry desires the govt. to share the cost of training through either
sponsorships or by setting up executive development centers. At the same
time universities need to revise their curriculum along with the changing
needs of the industry to make sure that optimal results can be achieved in the
future. 1 These figures are derived from general feedback received from Government and Defense Organizations, industry specialists, PSEB and other sources.

IT Human Resource Need Assessment Study
7
1. Preamble
During the last decade, the IT sector of Pakistan has experienced an
unprecedented growth. That growth; to many analysts is due to the
availability of human resource, domestic socio economic factors, geographic
location and other suitable factors that give the country a comparative
advantage and competitive edge over some other competing countries in the
field of Information Technology.
However, many analysts believe at the same time that the realized potential
fell much below the perceived potential at the beginning and it is still the
case. It is a generally agreed upon notion that we have been unable to tap the
arena of human resource capacity building in the most optimal fashion to
meet the demands of the growing IT sector.
At the moment, all initiatives taken in the field of IT depend heavily, not
upon the technological innovations domestically but the availability of
human resource that is technically proficient to handle the outsourced work
generated by developed nations of the world. Conflicting opinions appear as
to what needs to be done in this respect. At one extreme, it is believed that the
influx of considerable work (mostly from abroad and to a lesser extent local
development) implies that the requisite infrastructure and relevant human
resource is available as per the requirement of the industry. At the other
extreme, the perception is that our infrastructure and human resource is way
short of its optimum scale and all efforts must be made to develop it on a war
footing. The reality, it seems, lies somewhere in the middle. We have enough
infra-structure and human resource to attract a considerable amount of work
from the developed west; however we need to invest a lot in real R&D to

IT Human Resource Need Assessment Study
8
bring about the realm of technological innovation and fill the innovation
chasm that has become more and more a serious concern. At the same time,
we need to think in terms of our success on a relative scale. The influx of
work, that we have been referring it is still below the desired level when we
start comparing ourselves with countries like India and China. The planning
process, however can only be initiated once we have a reasonable assessment
of the current strength of our human resource as that becomes the building
block for our future IT vision.
We consider this study as a first step towards formation a bigger vision for IT
development and growth in Pakistan. The compilation of this study in itself is
quite complex. The number, type and scope of HR needed to assess the past
and present performance trend and more importantly, to forecast the future
requirement for the IT industry of Pakistan requires collection of
data/information from a variety of sources.
The potential of IT and its capacity to help human development need not
automatically translate into realization of the true potential that the country
has. Institutional innovations to adopt IT to local needs, creative partnerships
to share expertise and finances, enlightened national and global policy
regimes to provide sustainable macroeconomic and legal framework are
some of the necessary inputs to realize the potential of the IT. This potential
for human development is aided by the significant strides in the technology
sector. It could pave the way for an inclusive economic sphere by lowering
entry barriers for e-commerce and provide two-way flow of goods
knowledge and ideas to any and all.

IT Human Resource Need Assessment Study
9
2. Purpose of the Study
2.1 The building Block
As the IT sector is growing at a very rapid rate since 1990’s hence the focus of
the study is on the development of the required infrastructure and
availability of relevant human resources. For this we ought to know the
prevailing situation for employed IT Professionals in the industry. The study
would serve the purpose of establishing a reasonable estimate of our
strengths and weaknesses as defined by our pool of human resource to
address the IT vision of the country.
With the world becoming a true global village, the concept of benchmarking
and relative measurement has become more complex than ever. It must have
always been imprudent to decide on policy issues in isolation but in our
times, the relative yardsticks have become more important than ever. To
develop an IT vision for Pakistan, the most fundamental requirement is the
understanding of our human resource strength. The prime reason for
considering it to be that significant is the fact that it is our most productive
asset in the backdrop of strong forces of globalization that shape the threats
as well as opportunities present in the global environment.

IT Human Resource Need Assessment Study
10
The Human Resource Assessment will be best understood in the perspective
of the strong global forces including:
• Migration of millions of service oriented jobs from the developed
countries to developing countries
• Ubiquitous availability of information throughout the globe
• Removal of protection given to industry by political entities leading to
intense competition.
• Increasing role and use of knowledge to enhance productivity
Once we understand these forces completely, the next step is to look closely
at what we have to offer to exploit the opportunities present in the
environment. It must be very clear from the beginning that nothing tangible
can be achieved without enabling government policies and a regulatory
framework that supports a globally connected knowledge based economy.
With these prerequisites in place, the national productivity enhancement rests
on two pillars only and they are:
• A well trained and efficient manpower
• Efficient and cost effective infrastructure
Both of these objectives can be achieved once we have a fair idea of the
direction and the scale at which the enabling actions must be taken. The
findings of this report will help achieve that.
IT Human Resource Need Assessment Study
11
2.2 Objectives
The study’s prime objective is to assess the current IT human resource in
Pakistan but from that very prime objective flow a number of specific goals.
These goals are as follows:
2.1.1 To reasonably assess the current number of IT professionals in the
industry broken down by skills and qualification.
2.1.2 To reasonably forecast the IT HR requirements for the near term (next
five years) and long run (from five to ten years)
2.1.3 To understand the growth trends in the realm of IT Human Resource
and to foresee the shifts in near future.
2.3 Study Limitations
The study as mentioned earlier is a complex study and thus carries a number
of limiting factors. The methodology that has been adopted aims at
minimizing all such factors and filtering the best possible information that
can be derived using the available means; however it would be unwise not to
mention those factors that to an extent mitigate the results of this study to a
certain extent. The reason for highlighting these limitations at an early stage
help the reader appreciate the results in their true perspective. These factors
are as follows:
2.3.1 The data related to IT professionals employed by Government
organizations, (i.e., AEC, NDC, KRL) though significant, cannot be
obtained completely due to the secretive nature of most of these
organizations and their charter limiting the freedom on their part to
IT Human Resource Need Assessment Study
12
share that information with any outsider. Defense and such other
organizations are, hence not part of the population under study.
2.3.2 The public limited companies form the population but non-IT private
limited companies were excluded. The population under study will
thus not include the Non-IT private limited companies.
IT Human Resource Need Assessment Study
13
3. Methodology
The study is essentially a survey leading to findings and conclusions serving
the objectives of the study set forth in the earlier sections. Understanding of
the basic parameters of the methodology will help the reader understand the
findings in their true perspective. The highlights of the methodology are as
follows:
3.1 Population and Sample
The target population consists of three broad clusters. These clusters include
IT Companies, Non-IT companies (public limited mainly) and educational
institutes (Universities mainly).
The IT companies registered with PSEB form the core population. The total
number of such companies is around 700. For Non IT Companies only public
listed companies are considered which are listed at KSE. These companies are
680 in total, as per listing of the Karachi Stock Exchange
(http://www.kse.com.pk/publications/daily). For Universities and degree
awarding institutes, we considered all those universities and institutes, in
both public and private sector, which are given charter by Higher Education
Commission. This figure (110) was taken from HEC
(http://www.hec.gov.pk/htmls/hei/collunilist.htm). Out of these 110
Institutes, 05 do not have relevant programs in the IT domain leaving the
relevant population to be of 105 Universities and Institutes.
IT Human Resource Need Assessment Study
14
The stratified random sampling seemed appropriate to cater the naturally
existed grouping. In consultation with PSEB a sample of 400 companies in all
is selected consisting of 100 IT companies, 200 Non-IT companies and 100
universities/institutes. For the purpose of data collection the IT industry is
segmented into public and private sectors and then further classified into IT
Companies, Non-IT Companies and Universities awarding the degrees in IT
related education.
3.2 Unit of Analysis
The unit of analysis for this survey was an organization. Hence, all the
employees of each and every organization included in the sample were made
a part of this study. The analysis included actual data of professionals
employed in these organizations collected through four different types of
questionnaires addressing all clusters of the population. (For reference see
Annexure-2 and 3)
3.3 Variables and Instrument
Questionnaire (attached in the annexure-2 and 3) was used as an instrument
to collect information in a precise and efficient manner. Separate
questionnaires were developed for each of the segments i.e., IT, Non IT and
Universities. Questionnaires so developed covered wide spectrum
information. Each question was so constructed that its qualifying response
should flow from an objective statement.
To assess the relationship between demand and supply of IT professionals in
the market, the questionnaire developed for universities was broken down
into two sections; first form was used to collect information on students’
IT Human Resource Need Assessment Study
15
passing out ratio to assess the supply for the market and the second form was
used to tap the IT Professionals employed in the universities and the demand
for professionals by the universities in the future. The questionnaires for IT
and Non IT companies tap the present employment status of the companies
in terms of IT Professionals, their qualifications and their skills. Same
questionnaires also tap the future requirements by these companies in terms
of employee’s qualification and skill.
Main variables were the current number of employees, their break down by
qualification, by skills, future job openings, qualification for future positions
and skills for future job openings. The statistics on future job openings were
demanded from 2006 to 2010 to meet the objective of a realistic trend for these
five years and to extend the same trends to the next five year phase,
extrapolation techniques were employed.
3.4 Data Collection
The data collection is governed by Delphi Technique. The Delphi Technique
is supplemented in many ways to increase the response rate to the most
optimal possible. Questionnaires were initially transmitted to the respondent
agency, institute or company through Courier Services. In the second phase
email, faxes and telephones were extensively used not only to retransmit the
questionnaire but to keep a constant follow up. All the questionnaires were
sent in both soft copy and hard copy format.
The questionnaires were accompanied by PSEB and HEC endorsement letters
to convey their authenticity to the respondents and to persuade a better
response rate.
IT Human Resource Need Assessment Study
16
All possible modes (fax, e-mail, courier and physical follow-up) of collecting
the filled questionnaires were employed to increase the response rate by
facilitating the respondent end. From respondents’ point of view these
methods allowed the information (requested in the questionnaire which was)
not available at a single desk to be collected from several desks and then be
compiled at a single access point. Hence, access to questionnaires by different
departments within the same institute was made possible.
Apart from using questionnaires as mode of collecting data, interview of
several IT professionals at the leading positions in their organizations were
also held. These interviews proved helpful in taking the feedback on the
quality of current IT Professionals coming in the market and they were also
helpful in developing trends for the future needs for the IT Professionals in
the industry. Interviews were generally held on a concurrent basis but some
are held post-collection as well. The interviews were meant to validate the
results obtained through questionnaires and to have a subjective opinion
along side the objective close-end data in order to extrapolate the information
to create trend lines and forecasts.
3.5 Response
The total response rate has been 41%. In terms of numbers, data from 165
organizations was received in total. Questionnaires received from Universities totaled
35, from IT companies 46 and from Non-IT public limited companies 93 respectively.
In terms of percentages, 29% of the total response came from the IT companies
whereas 58% came from the non-IT sector and 21% was covered by the response
from the Universities. The response was supplemented with interviews from the
leading professionals of the industry and extrapolation techniques (time series
regression) were employed to extend the sample data to the entire population and to
assess the trends in various dimensions.
IT Human Resource Need Assessment Study
17
3.6 Model Construction:
The models were constructed through the use of time series regression
analysis. These regression models so constructed were then analyzed for their
predictive ability at 95% level of confidence (as indicated by the regression
and individual regression variable P-values). Models were constructed
applying Ordinary Least Square to the data on future job positions,
qualifications and skills in IT, Non IT sectors and universities.
3.7 Modeling Techniques:
The SPSS version 11.0.1 software package was used to perform the statistical
analysis for this project. SPSS can perform a variety of statistical operation
including regression analysis (linear, multiple linear, curvilinear, and curve
estimation). The software provided tools to fit 11 regression models: linear,
logarithm, inverse, quadratic, cubic, power, compound, S, logistic, growth
and exponential.
3.8 Time Series Linear Regression Analysis:
Simple Time Series linear regression analysis was conducted to examine
relationship between time (independent variable) and job positions
(dependent variable), skills for jobs and qualification for jobs. The best fit
equation was developed for each response pair.
IT Human Resource Need Assessment Study
18
3.9 Time Series Curvilinear Regression Analysis:
In addition to standard linear models, several curvilinear models were
considered where scatter plots showed a non-linear relationship between
time periods and skills, qualification, total job positions. Detailed discussion
of these analyses is given in annexure-04.
3.10 Measuring Goodness of fit
Measuring how well the model fits the data, three statistics were commonly
used.
1. co-efficient of determination r2
2. t-test for the significance of regression co-efficient
3. F-test for the significance of fitted model.
The goodness of fit is developed through appropriate descriptive statistics
and graphs attached in the annexure-04.
IT Human Resource Need Assessment Study
19
4. Analysis and Findings
Once all the parameters are identified, the analysis is undertaken with respect
to the specific objectives of the study and the focus remained on developing a
trend model to reflect the HR demand and supply situation for near term and
long run.
The definition under which an IT professional shall fall during this study is as
follows:
“Professionals involved in the design/development, services, installation, and
implementation of computer systems and applications, including those personnel that
have a degree or certification and experience in the information technology arena.”
With this definition well in place and having a complete comprehension of the
importance of the study, the analysis is conducted that revealed the following
findings.
4.1 Findings
The current study appears to be first of its kind. We are confident that the
actual figures are within a 5% range of the estimations given below. The
current number of IT Professionals in the Industry (within our defined
population) turns out to be 46,000. Another 42,000 is estimated to be
employed by Defense, government and private limited companies.
IT Human Resource Need Assessment Study
20
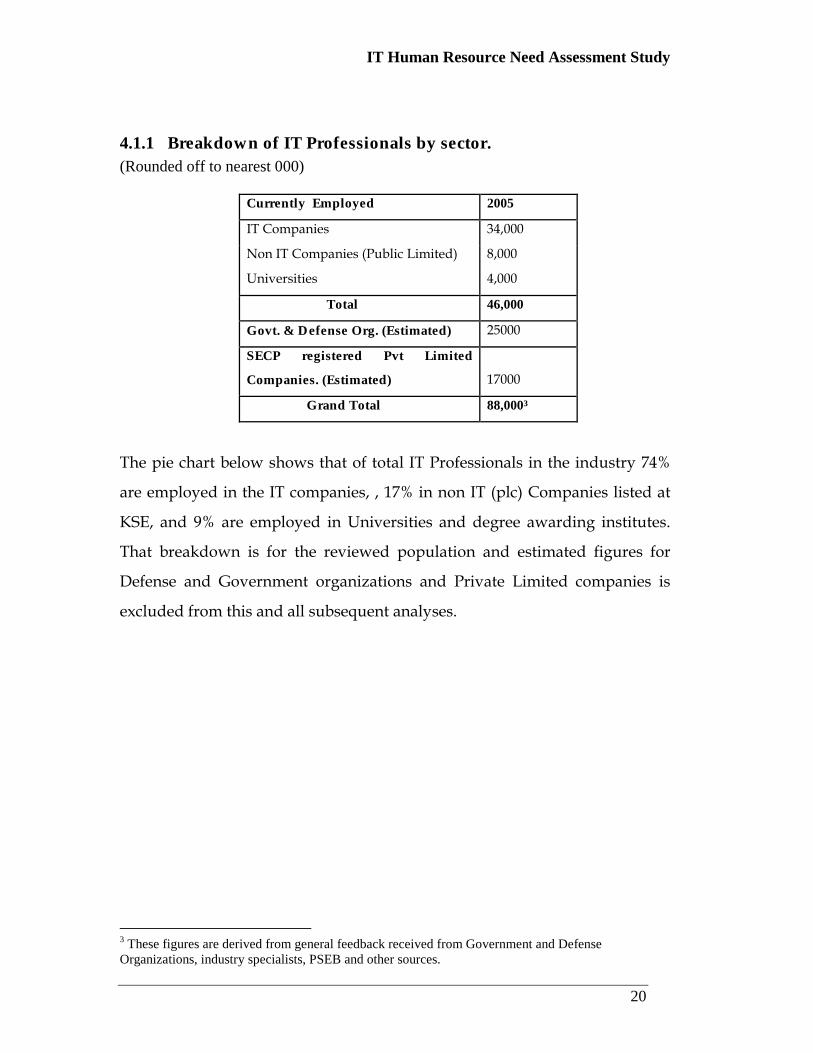
4.1.1 Breakdown of IT Professionals by sector. (Rounded off to nearest 000)
Currently Employed 2005
IT Companies 34,000
Non IT Companies (Public Limited) 8,000
Universities 4,000
Total 46,000
Govt. & Defense Org. (Estimated) 25000
SECP registered Pvt Limited
Companies. (Estimated) 17000
Grand Total 88,0003
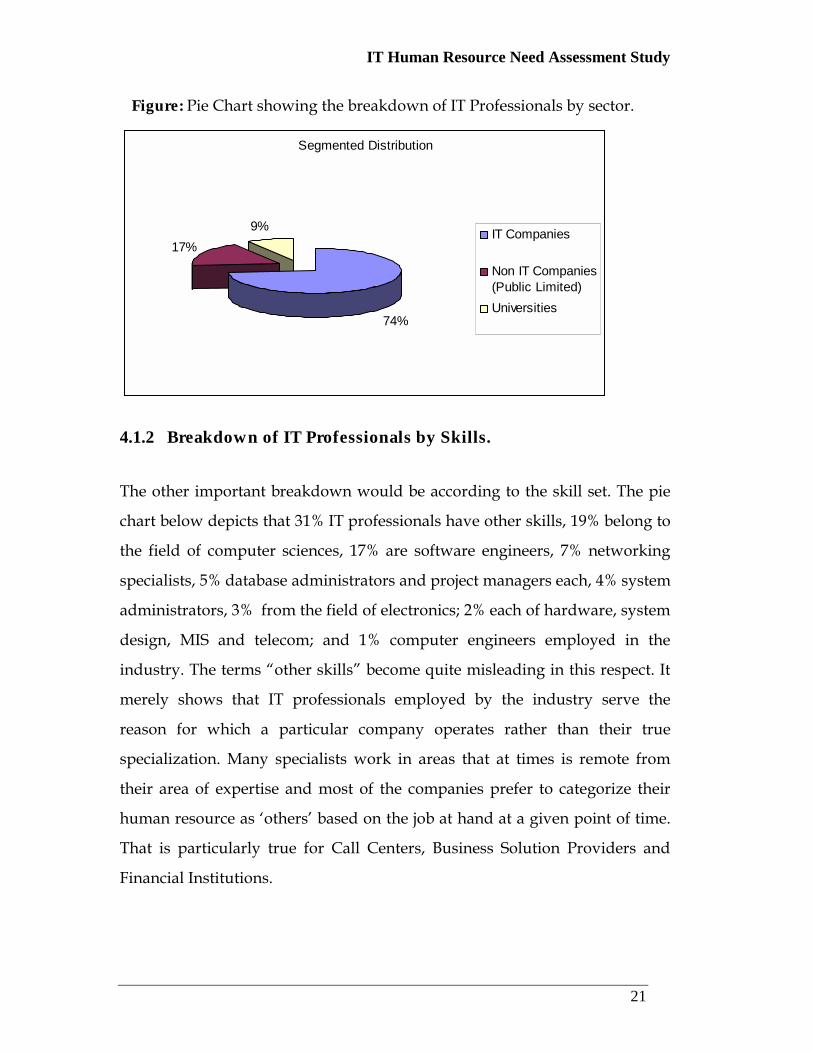
The pie chart below shows that of total IT Professionals in the industry 74%
are employed in the IT companies, , 17% in non IT (plc) Companies listed at
KSE, and 9% are employed in Universities and degree awarding institutes.
That breakdown is for the reviewed population and estimated figures for
Defense and Government organizations and Private Limited companies is
excluded from this and all subsequent analyses.
3 These figures are derived from general feedback received from Government and Defense Organizations, industry specialists, PSEB and other sources.
IT Human Resource Need Assessment Study
21
Figure: Pie Chart showing the breakdown of IT Professionals by sector.
Segmented Distribution
74%
17%9% IT Companies
Non IT Companies(Public Limited)Universities
4.1.2 Breakdown of IT Professionals by Skills.
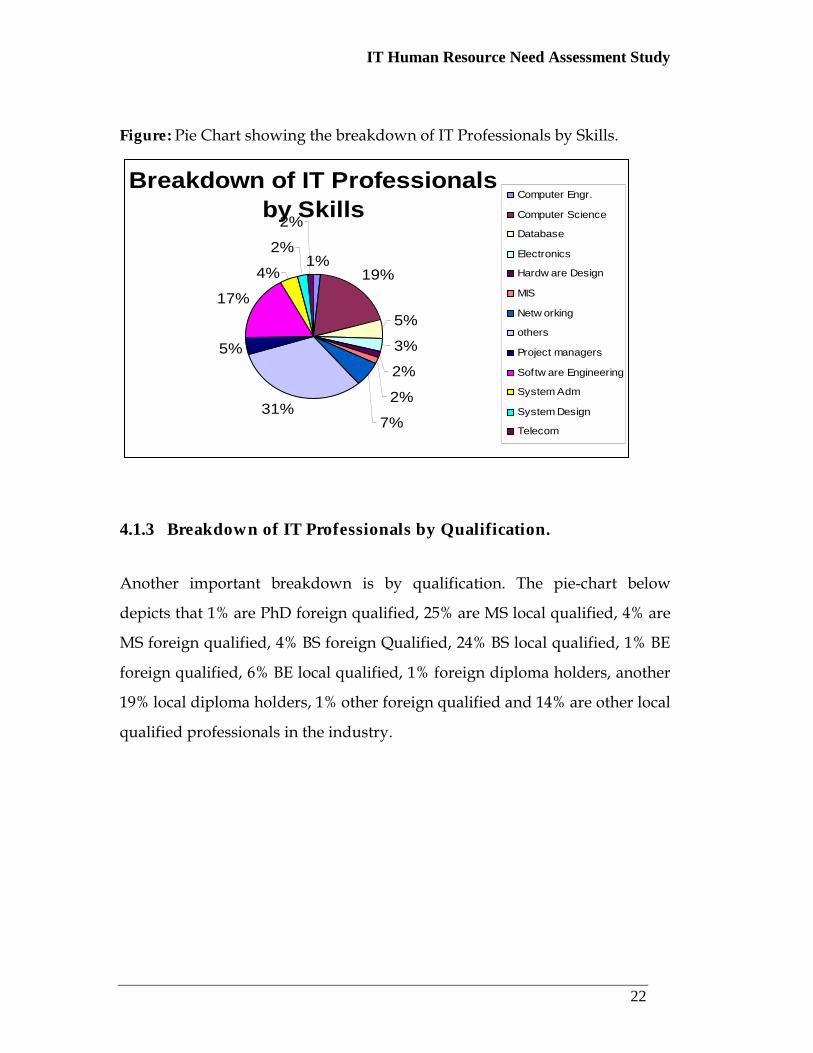
The other important breakdown would be according to the skill set. The pie
chart below depicts that 31% IT professionals have other skills, 19% belong to
the field of computer sciences, 17% are software engineers, 7% networking
specialists, 5% database administrators and project managers each, 4% system
administrators, 3% from the field of electronics; 2% each of hardware, system
design, MIS and telecom; and 1% computer engineers employed in the
industry. The terms “other skills” become quite misleading in this respect. It
merely shows that IT professionals employed by the industry serve the
reason for which a particular company operates rather than their true
specialization. Many specialists work in areas that at times is remote from
their area of expertise and most of the companies prefer to categorize their
human resource as ‘others’ based on the job at hand at a given point of time.
That is particularly true for Call Centers, Business Solution Providers and
Financial Institutions.
IT Human Resource Need Assessment Study
22
Figure: Pie Chart showing the breakdown of IT Professionals by Skills.
Breakdown of IT Professionals by Skills
1%19%
5%
3%
2%
2%
7%31%
5%
17%
4%
2%
2%
Computer Engr.
Computer Science
Database
Electronics
Hardw are Design
MIS
Netw orking
others
Project managers
Softw are Engineering
System Adm
System Design
Telecom
4.1.3 Breakdown of IT Professionals by Qualification.
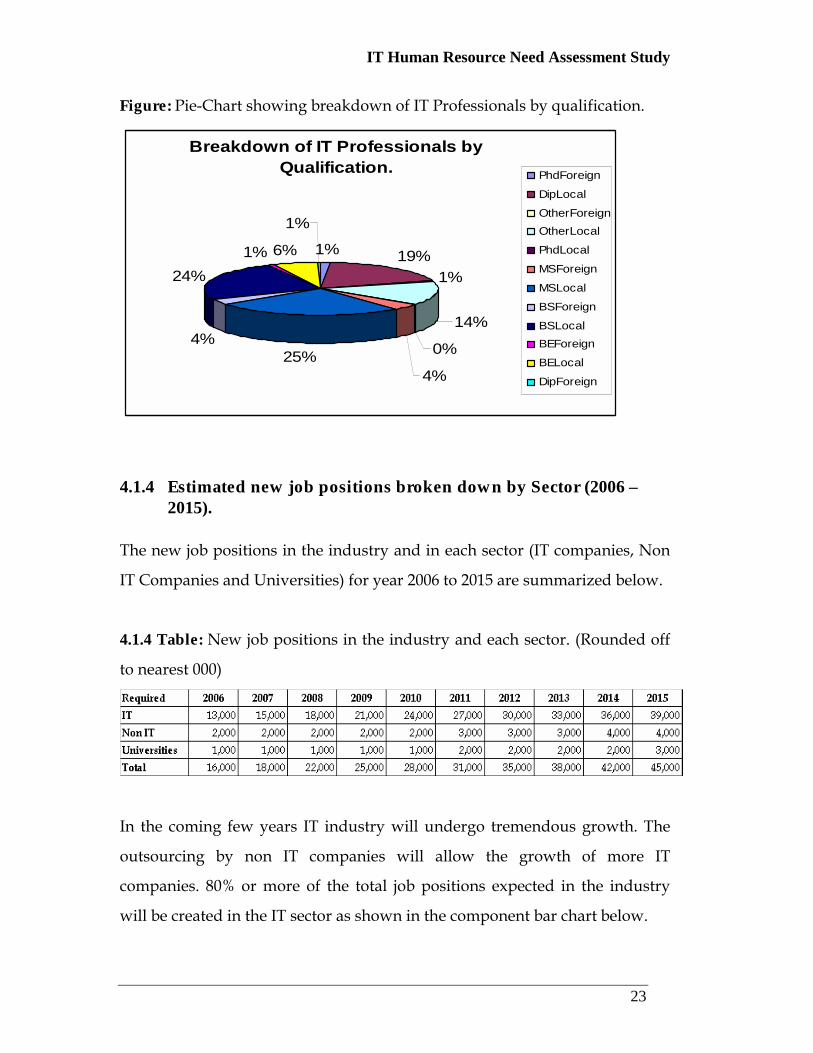
Another important breakdown is by qualification. The pie-chart below
depicts that 1% are PhD foreign qualified, 25% are MS local qualified, 4% are
MS foreign qualified, 4% BS foreign Qualified, 24% BS local qualified, 1% BE
foreign qualified, 6% BE local qualified, 1% foreign diploma holders, another
19% local diploma holders, 1% other foreign qualified and 14% are other local
qualified professionals in the industry.
IT Human Resource Need Assessment Study
23
Figure: Pie-Chart showing breakdown of IT Professionals by qualification.
Breakdown of IT Professionals by Qualification.
1% 19%1%
14%
0%
4%25%
4%
24%1% 6%
1%
PhdForeign
DipLocal
OtherForeignOtherLocal
PhdLocal
MSForeign
MSLocal
BSForeign
BSLocalBEForeign
BELocal
DipForeign
4.1.4 Estimated new job positions broken down by Sector (2006 – 2015).
The new job positions in the industry and in each sector (IT companies, Non
IT Companies and Universities) for year 2006 to 2015 are summarized below.
4.1.4 Table: New job positions in the industry and each sector. (Rounded off
to nearest 000)
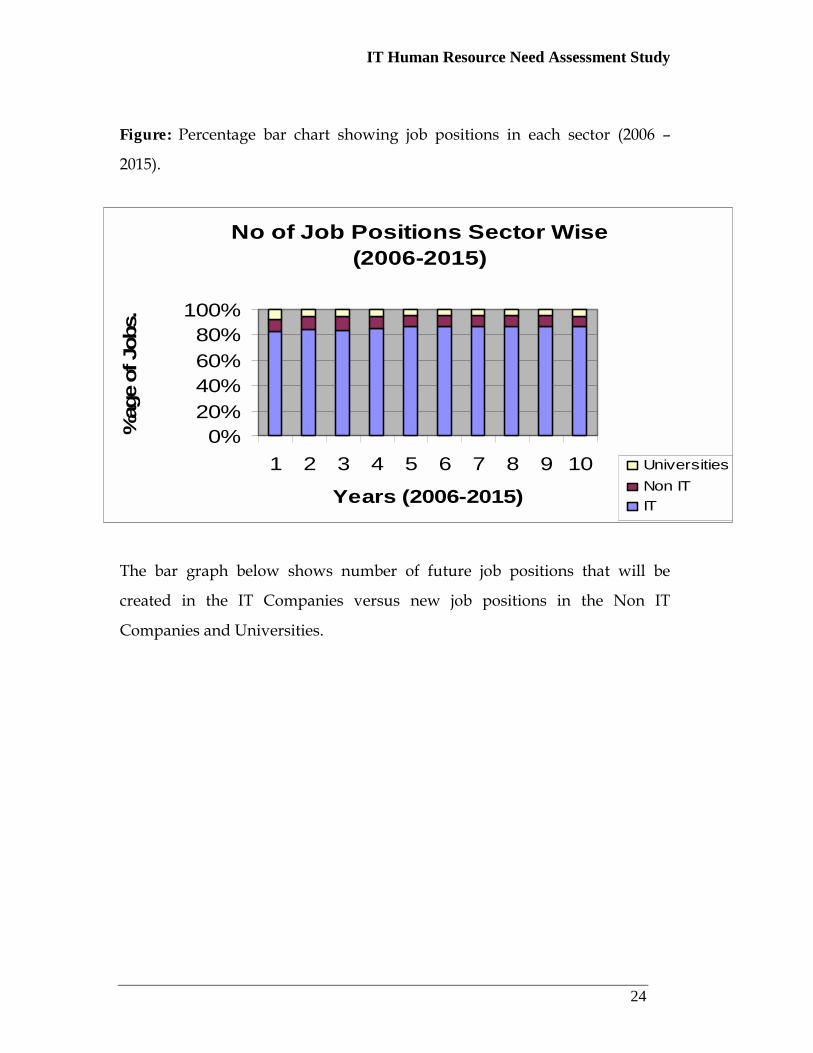
In the coming few years IT industry will undergo tremendous growth. The
outsourcing by non IT companies will allow the growth of more IT
companies. 80% or more of the total job positions expected in the industry
will be created in the IT sector as shown in the component bar chart below.
IT Human Resource Need Assessment Study
24
Figure: Percentage bar chart showing job positions in each sector (2006 –
2015).
The bar graph below shows number of future job positions that will be
created in the IT Companies versus new job positions in the Non IT
Companies and Universities.
No of Job Positions Sector Wise (2006-2015)
0%20%40%60%80%
100%
1 2 3 4 5 6 7 8 9 10
Years (2006-2015)
%ag
e of
Job
s.
UniversitiesNon ITIT
IT Human Resource Need Assessment Study
25
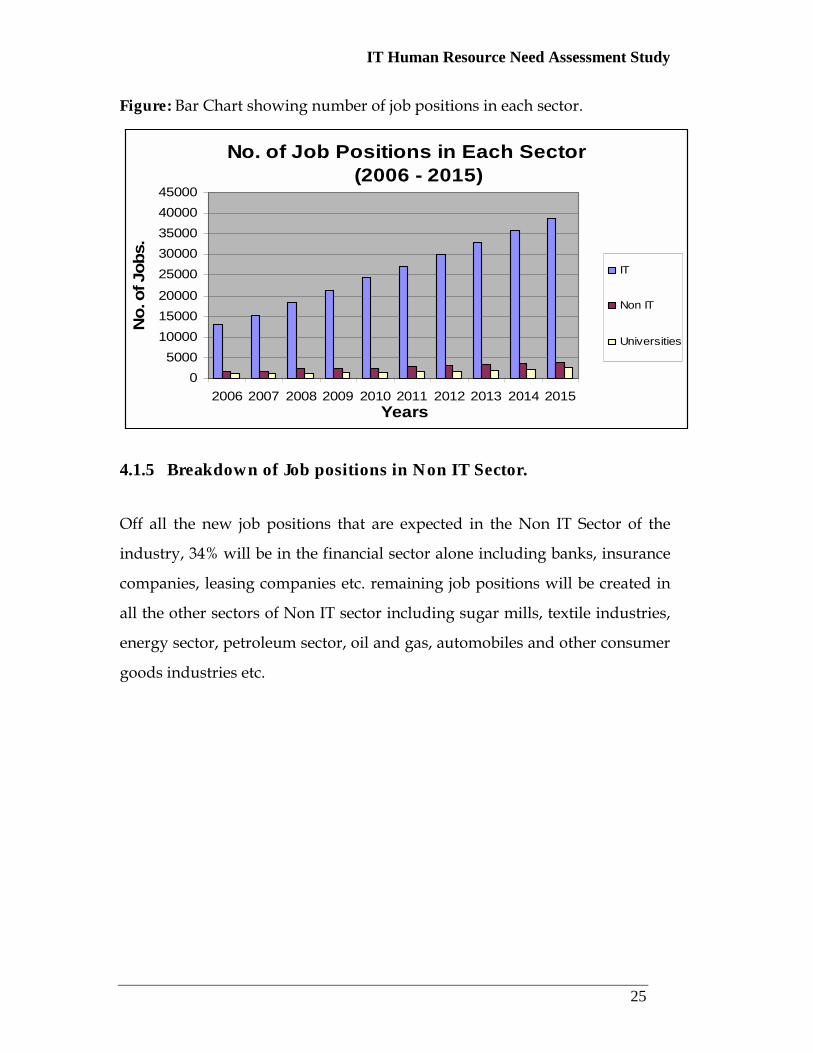
Figure: Bar Chart showing number of job positions in each sector.
4.1.5 Breakdown of Job positions in Non IT Sector.
Off all the new job positions that are expected in the Non IT Sector of the
industry, 34% will be in the financial sector alone including banks, insurance
companies, leasing companies etc. remaining job positions will be created in
all the other sectors of Non IT sector including sugar mills, textile industries,
energy sector, petroleum sector, oil and gas, automobiles and other consumer
goods industries etc.
No. of Job Positions in Each Sector (2006 - 2015)
05000
100001500020000
2500030000350004000045000
2006 2007 2008 2009 2010 2011 2012 2013 2014 2015Years
No.
of J
obs.
IT
Non IT
Universities
IT Human Resource Need Assessment Study
26
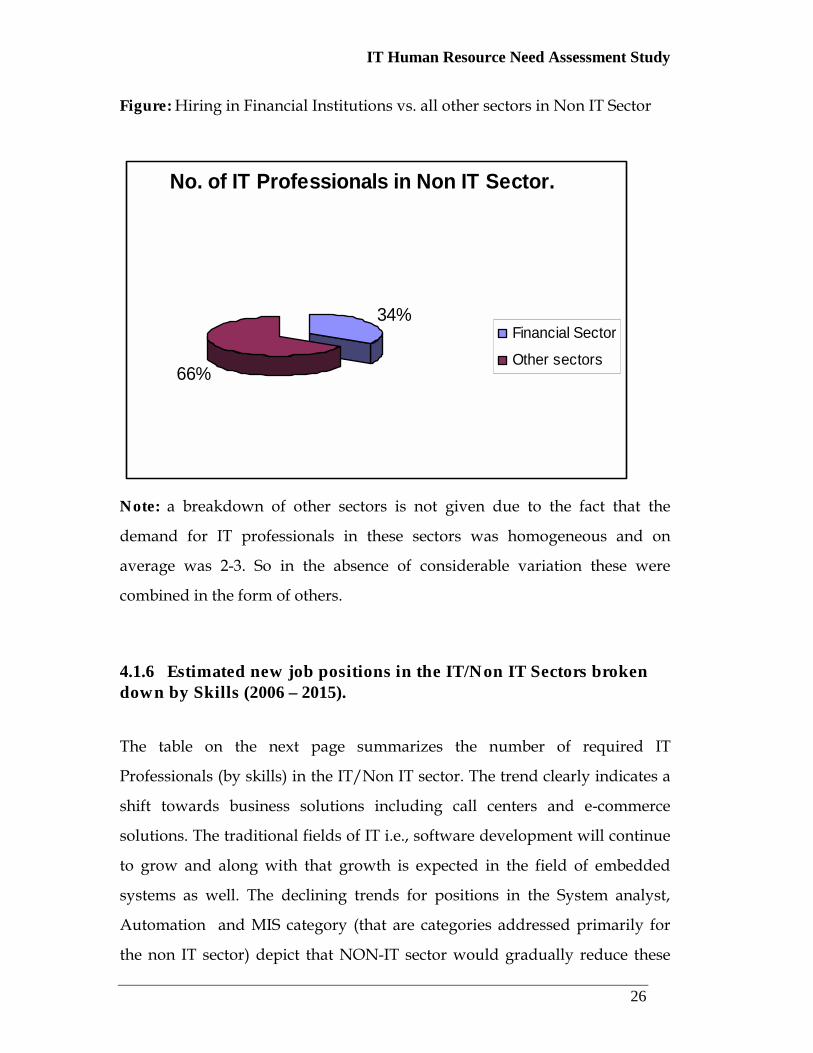
Figure: Hiring in Financial Institutions vs. all other sectors in Non IT Sector
No. of IT Professionals in Non IT Sector.
34%
66%
Financial Sector
Other sectors
Note: a breakdown of other sectors is not given due to the fact that the
demand for IT professionals in these sectors was homogeneous and on
average was 2-3. So in the absence of considerable variation these were
combined in the form of others.
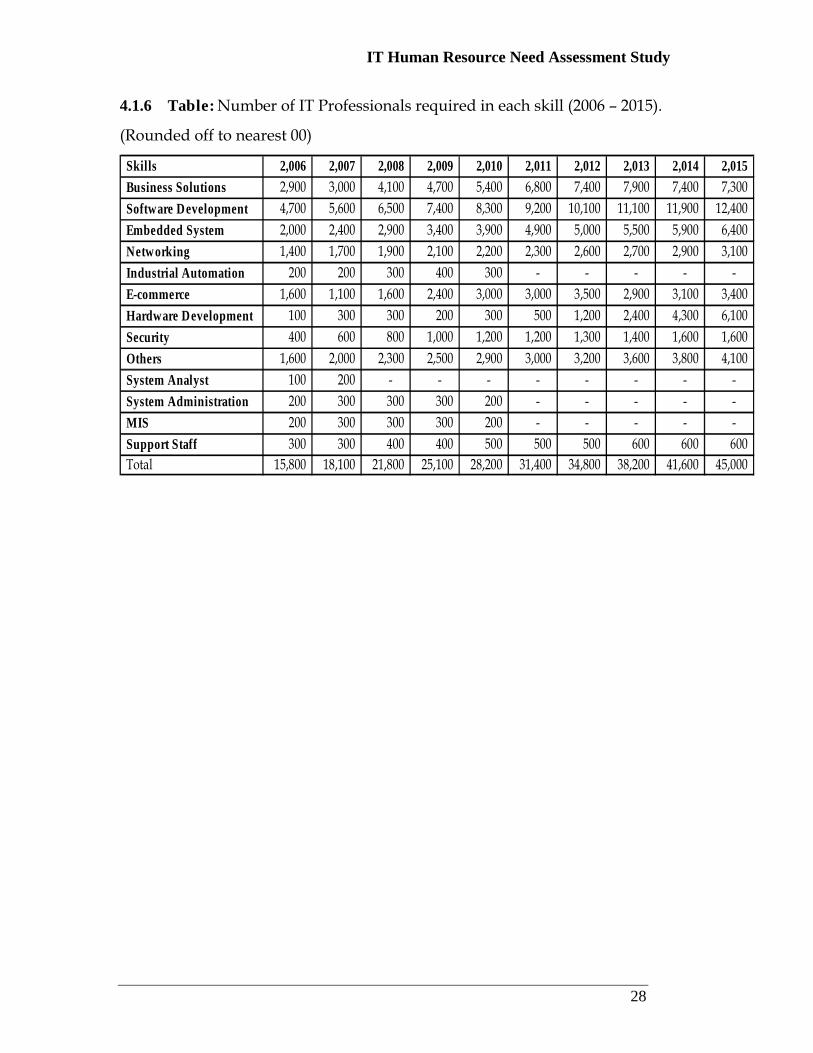
4.1.6 Estimated new job positions in the IT/Non IT Sectors broken down by Skills (2006 – 2015).
The table on the next page summarizes the number of required IT
Professionals (by skills) in the IT/Non IT sector. The trend clearly indicates a
shift towards business solutions including call centers and e-commerce
solutions. The traditional fields of IT i.e., software development will continue
to grow and along with that growth is expected in the field of embedded
systems as well. The declining trends for positions in the System analyst,
Automation and MIS category (that are categories addressed primarily for
the non IT sector) depict that NON-IT sector would gradually reduce these
IT Human Resource Need Assessment Study
27
positions as their permanent workforce and outsource these functions. IT
sector will eventually provide the resources in this function however they
would not label their HR exactly according to these classifications. That
implies that the growing number of Software Developers, Networking
Specialists and Business Solution Providers would cover this skill set in the
future. Another significant trend is observed in the E-Commerce category and
the Security category. This trend is evident of the changing priorities of the
local business environment and their understanding of the critical success
factors in today’s global setting. Hardware development sees a significant
rise, indicating again the outsourcing trends and the shifts in local indigenous
development regime.
IT Human Resource Need Assessment Study
28
4.1.6 Table: Number of IT Professionals required in each skill (2006 – 2015).
(Rounded off to nearest 00)
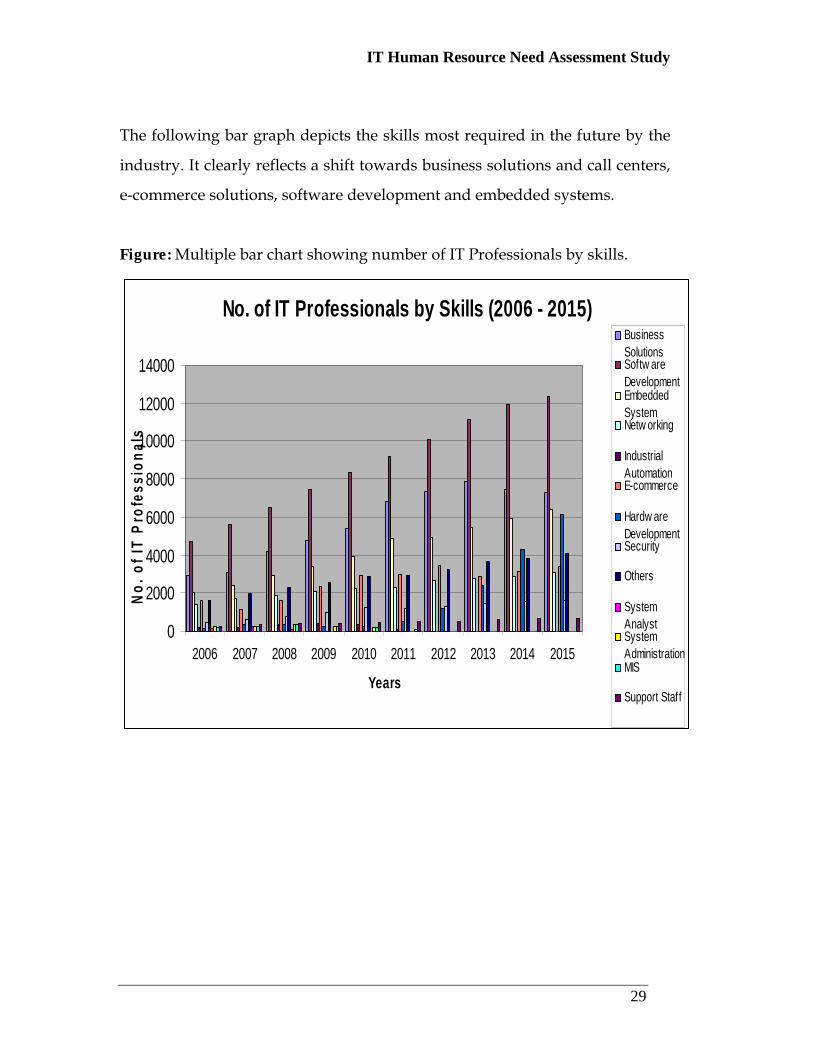
Skills 2,006 2,007 2,008 2,009 2,010 2,011 2,012 2,013 2,014 2,015 Business Solutions 2,900 3,000 4,100 4,700 5,400 6,800 7,400 7,900 7,400 7,300 Software Development 4,700 5,600 6,500 7,400 8,300 9,200 10,100 11,100 11,900 12,400 Embedded System 2,000 2,400 2,900 3,400 3,900 4,900 5,000 5,500 5,900 6,400 Networking 1,400 1,700 1,900 2,100 2,200 2,300 2,600 2,700 2,900 3,100 Industrial Automation 200 200 300 400 300 - - - - - E-commerce 1,600 1,100 1,600 2,400 3,000 3,000 3,500 2,900 3,100 3,400 Hardware Development 100 300 300 200 300 500 1,200 2,400 4,300 6,100 Security 400 600 800 1,000 1,200 1,200 1,300 1,400 1,600 1,600 Others 1,600 2,000 2,300 2,500 2,900 3,000 3,200 3,600 3,800 4,100 System Analyst 100 200 - - - - - - - - System Administration 200 300 300 300 200 - - - - - MIS 200 300 300 300 200 - - - - - Support Staff 300 300 400 400 500 500 500 600 600 600 Total 15,800 18,100 21,800 25,100 28,200 31,400 34,800 38,200 41,600 45,000
IT Human Resource Need Assessment Study
29
The following bar graph depicts the skills most required in the future by the
industry. It clearly reflects a shift towards business solutions and call centers,
e-commerce solutions, software development and embedded systems.
Figure: Multiple bar chart showing number of IT Professionals by skills.
No. of IT Professionals by Skills (2006 - 2015)
0
2000
4000
6000
8000
10000
12000
14000
2006 2007 2008 2009 2010 2011 2012 2013 2014 2015
Years
No.
of I
T P
rofe
ssio
nals
BusinessSolutionsSoftw areDevelopmentEmbeddedSystemNetw orking
IndustrialAutomationE-commerce
Hardw areDevelopmentSecurity
Others
SystemAnalystSystemAdministrationMIS
Support Staff
IT Human Resource Need Assessment Study
30
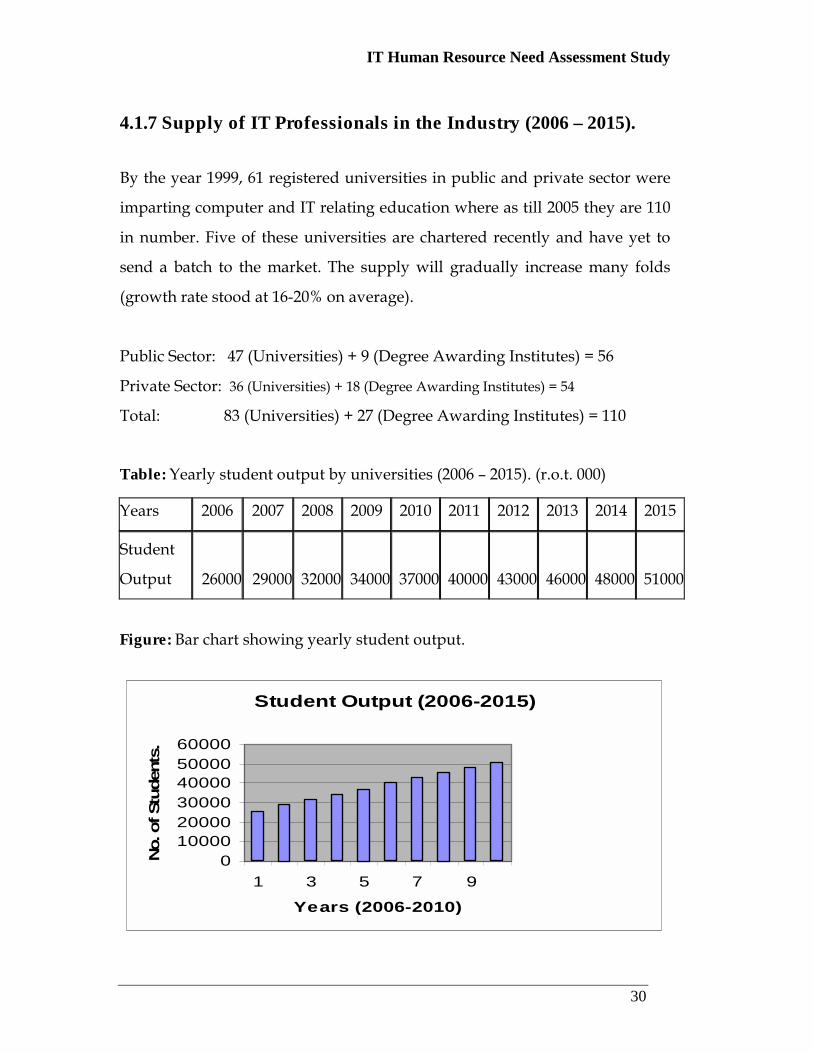
4.1.7 Supply of IT Professionals in the Industry (2006 – 2015).
By the year 1999, 61 registered universities in public and private sector were
imparting computer and IT relating education where as till 2005 they are 110
in number. Five of these universities are chartered recently and have yet to
send a batch to the market. The supply will gradually increase many folds
(growth rate stood at 16-20% on average).
Public Sector: 47 (Universities) + 9 (Degree Awarding Institutes) = 56
Private Sector: 36 (Universities) + 18 (Degree Awarding Institutes) = 54
Total: 83 (Universities) + 27 (Degree Awarding Institutes) = 110
Table: Yearly student output by universities (2006 – 2015). (r.o.t. 000)
Figure: Bar chart showing yearly student output.
Years 2006 2007 2008 2009 2010 2011 2012 2013 2014 2015
Student
Output 26000 29000 32000 34000 37000 40000 43000 46000 48000 51000
Student Output (2006-2015)
0100002000030000400005000060000
1 3 5 7 9
Years (2006-2010)
No.
of S
tude
nts.
IT Human Resource Need Assessment Study
31
(Here 1-10 are time periods representing years from 2006 to 2015
respectively.)
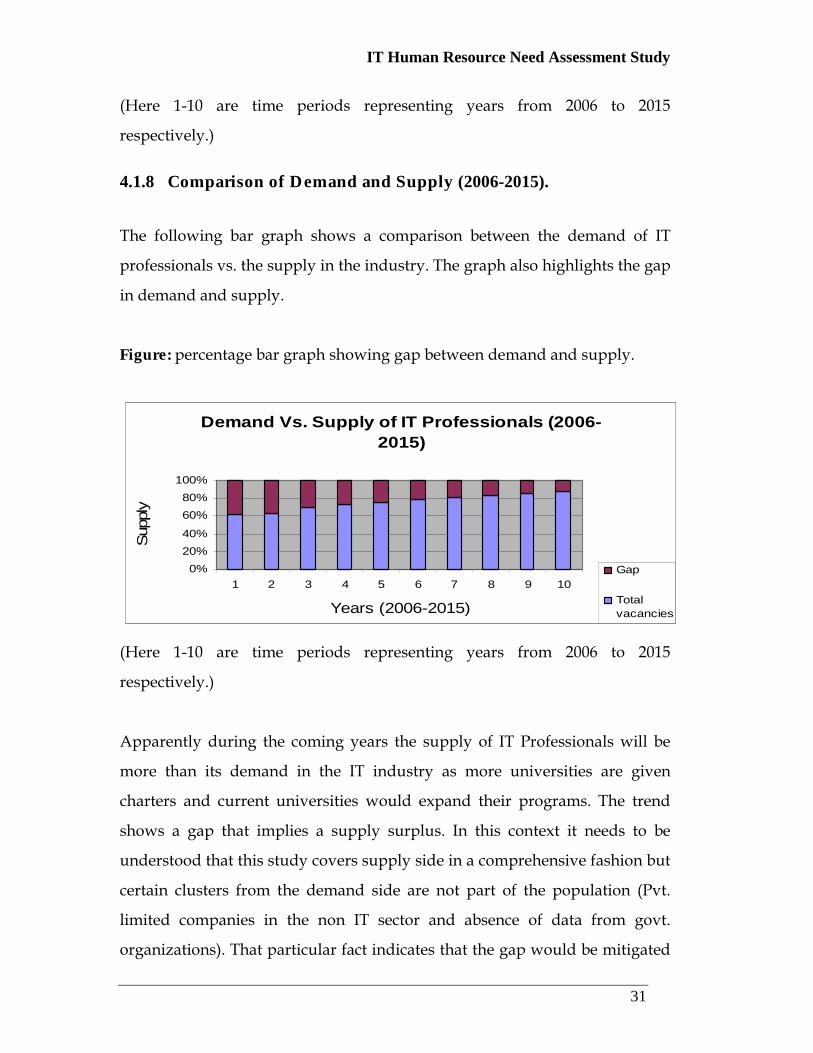
4.1.8 Comparison of Demand and Supply (2006-2015).
The following bar graph shows a comparison between the demand of IT
professionals vs. the supply in the industry. The graph also highlights the gap
in demand and supply.
Figure: percentage bar graph showing gap between demand and supply.
(Here 1-10 are time periods representing years from 2006 to 2015
respectively.)
Apparently during the coming years the supply of IT Professionals will be
more than its demand in the IT industry as more universities are given
charters and current universities would expand their programs. The trend
shows a gap that implies a supply surplus. In this context it needs to be
understood that this study covers supply side in a comprehensive fashion but
certain clusters from the demand side are not part of the population (Pvt.
limited companies in the non IT sector and absence of data from govt.
organizations). That particular fact indicates that the gap would be mitigated
Demand Vs. Supply of IT Professionals (2006-2015)
0%20%40%
60%80%
100%
1 2 3 4 5 6 7 8 9 10
Years (2006-2015)
Sup
ply
Gap
Totalvacancies
IT Human Resource Need Assessment Study
32
to a certain extent. However, it would be difficult to mention a specific
percentage reduction in the gap covered by the aforementioned clusters.
If quality standards in education are employed properly, more productive
work force may be created and the gap could be minimized with effective
utilization through exploring new avenues. In that case the excess supply will
not only generate competition but also give new direction to users to employ
manpower trained and adept in multiple software application and IT
management.
This envisaged atmosphere of competition will produce quality manpower
that expects better job prospects, remuneration and positions. Data findings
have reflected that in the near future, the focus of IT will be more towards
business solutions, call centers and applied technologies. Hence, universities
need to revise their curriculum to adjust it to market needs. Universities must
focus on preparing entrepreneurs for providing business solutions, running a
call centre etc. Present situation reflects that universities are producing more
of software engineers, computer engineers, system administrators, database
administrators, networking specialist etc. where as industry demands are
growing more for business solution providers, software development and e-
commerce solutions providers. That stresses the need for curriculum revision
in line with industry trends and demands for the near term and the future.
IT Human Resource Need Assessment Study
33
4.2 Tools of Analysis
Time series regression analysis is used to analyze trends that appear to be
related to time. An estimated equation is developed using time as an
independent variable. The time period is divided in subsequent years and job
positions are used as dependent variable. To identify the HR with various
skills and qualifications, (current and new) job positions were broken down
by skill set. Qualification sets were treated as dependent variable and plotted
with time to develop trend for forecasts.
We must remember that time does not cause change in the demand or supply
of human resources. These changes are caused by a variety of economic
factors. Hence, time series regression analysis will not automatically identify
changes in a trend (i.e., it cannot predict a period of low demand for IT
professionals when the available data trace a trend of increasing demand for
IT professionals.). The forecasts made in this report are thus, based on an
identifiable set of economic trends that are assumed to remain consistent over
the forecast period. The reader must keep in mind that a significant change in
economic indicators could bring about an unpredicted change in the
forecasts, however the study of economic trends reveal that such volatile
fluctuations are highly unlikely.
4.2.1 The General Model The general situation involved a set of n paired observations to be denoted:
(Xi, Yi) for i= 1, 2, 3… n.
Here the forecast variable Yi represents the job positions for IT Professionals
and the explanatory variable is time. Scatter plots were constructed by
plotting time against x-axis and job positions along y-axis to assess the nature
IT Human Resource Need Assessment Study
34
of relationship among variables. A linear relationship was considered
between job positions in IT sector and time. Hence the fitted model was:
Y = a + bX + e
Where a is the intercept, b is the slope of the line, and e denotes the error. The
objective was to find the values of a and b so the line ŷ = a + bX presents the
best fit to the data.
4.2.2 Equation of Best Fit To obtain an overall goodness of fit, we calculated the sum of squared errors.
The line of best fit is chosen to be the one which yields the smallest value for
this sum of squared errors. The correlation coefficient plays an important role
in multivariate data analysis and has strong ties with regression analysis.
Coefficient of determination (r²), the squared correlation coefficient is used as
a measure for the adequacy of the fitted model. r² can be interpreted as a
proportion of the variation in dependent variable Y (job positions) which is
explained by independent variable X (time). In the case of new job positions
and time data, the calculated r² = 0.997 or 99.7%. So 99.7% variations in the
job positions will be explained by the straight line model (see table 4.1). The
errors (e) also called residuals cannot explained by the fitted model hence we
also examined the residuals for the adequacy of the fitted model and for that
matter we constructed the normal P-P plots (see figure 4.1 in annexure).
IT Human Resource Need Assessment Study
35
4.2.3 Use of F and t-test Certain statistical tests were conducted to test the significance of the overall
models, to test the individual coefficients in the equation, and to develop the
prediction intervals for the forecasts that were being made using the fitted
models. F-test was used for the significance of overall model. The large value
of F statistics means regression explains a substantial proportion of the
variance. The p-value gives the probability of obtaining an F-statistic as large
as the one calculated for the data. Hence we concluded that the model was
significant for the p-value was smaller than 0.05. t-test was setup to test the
intercept and the slope values. For a p-value smaller than 0.05 we concluded
that an estimated parameter was different from zero.
The b coefficients and the constants are used to create the prediction equation
(regression). The t-test tests the significance of each b coefficient. In this case
all b coefficients are significant at 0.05 significance level. However, it is
possible to have a regression model which is overall significant as supported
by the F-test, but where a particular coefficient is not significant.
Beta coefficients are the standardized regression coefficients. Their relative
absolute magnitude reflects their relative importance in predicting dependant
variable (new job position).
IT Human Resource Need Assessment Study
36
4.2.4 The Coefficient of Determination The coefficient of determination is also used as measure of goodness of the
fitted models. For business solutions it is 98.2% meaning 98.2 % of variations
are
explained by the model. Similarly, for software development it is 94.2%,
embedded systems 95.9%, networking 83.1%, industrial automation 79.1% e-
commerce 93.5%, hardware 99.57% and security 90.5%. All the fitted models
are significant at 5% with the exception of networking which is significant at
17%.
4.2.5 The Normal Probability Plot The normal probability plot (z residual normal P-P plot) is another test of
normally distributed residual error. Under perfect normality, the plot will be
a 45-degree line, if a standard line model is fitted. It is clearly evident in the P-
P plots of all new job positions (Business Solutions, Networking, Software
Development, Embedded System, E-commerce, Security and Others) that the
fitted models are significant. By looking at this plot, it is evident that the
transformation of variables leads to a good reproduction of the shape of the
true function.
In addition to standard linear regression, several curvilinear regression
models were considered. A summary of the results of the curvilinear
regression analysis is given in the result section.
4.3 Underlying Factors:
IT Human Resource Need Assessment Study
37
Questionnaires and interviews revealed a number of significant underlying
factors leading up to the shifts in industry expectations and priorities.
Identification of these factors proved effective in developing trends for the
demand of IT professionals in various companies. Analysis of these factors
revealed that discernable trend in Non IT companies is that, in spite of hiring
IT professionals they prefer opting for outsourcing of their IT needs. Thus, for
any complex technical development or redesigning of system these business
organizations will solicit the services of expert IT Company. Hence, we may
say that as in the near future the demands of these companies in such service
areas grow, they will rely heavily on outsourcing. As a result, new IT
companies will emerge to cater to the needs of Non IT sector particularly for
providing e-commerce solutions, industrial automation and networks
maintenance.
Industry Professionals are not found satisfied with the quality of fresh
graduates entering the industry. The theoretical knowledge base of these
graduates is, no doubt, very strong but they lack the skill to apply the
acquired knowledge to practical environments, even though these graduates
have completed their internships as well to get a hand on experience on
practical applications.
These organizations claim that they had to train their fresh entry of graduates
in order to groom them to acquire market standards before they could render
desired output. This training period is usually spanned over 3 – 6 months. It
involves heavy cost of expenditures during on job training and development
of new recruits before they mature to render valuable output for the parent
organization. After successful completion of on the job training, skilled and
trained employees become most attractive human resource for any needing

IT Human Resource Need Assessment Study
38
organization that are prepared to offer them a lucrative package to subvert
their loyalty to the other institution.
The private entities are of the opinion that the Govt. must share the cost of
training for their respective inductees through either sponsorships or by
setting up an executive development center to train these fresh graduates.
Thus, a pool of trained and skilled work force can be groomed to meet their
anticipated demand by sharing their cost of training.
The study suggests that we must anticipate a significant growth in the IT
sector. As a result, more entrepreneurs will emerge with new ideas and new
companies. This trend will serve to lower the unemployment rate in the IT
Industry. To facilitate this tremendous growth Govt. should also setup a
venture capital fund. More Software technology parks should be established
to facilitate the infrastructural requirements.
It is not that the public sector is not making efforts in this regard. PSEB itself
has launched initiatives like Young Professional Program that aims at
providing a platform to train the young manpower in the IT sector to the
extent of becoming a tailor-made product as per the needs of the industry.
Another initiative by the name of PSEB Venture Capital Fund is in the process
of design by which incubation could be provided to new companies and
support would be made available to innovative ideas to make sure that
emergence of new companies would not face the usual hazards. STPs are
already functioning at various locations and in the near future the number
would grow manifolds. The issue really is to bridge the gap between
Industry, academia and public sector and to achieve that all have to make an
effort.
IT Human Resource Need Assessment Study
39
5. Conclusion
5.1 The number game Based on the results of the survey findings, there are approximately 88,000 IT
professionals employed in the industry. In the coming few years IT industry
will undergo tremendous growth. The outsourcing by non IT companies will
allow the growth of more IT companies. 80% or more of the total job positions
expected in the industry will be created in the IT sector (breakdown given
below).
5.2 Supply-Demand Situation
The output of IT Professionals by universities is growing many folds over the
period of years as more universities and degree awarding institutes are given
charter by HEC. As per HEC records, 50 registered universities both in pubic
and private sector were awarding bachelor and masters degrees in computer
sciences and software engineering till mid nineties. The number has risen to
105 universities by year 2005 and the disciplines have grown from computer
science and software engineering to telecom engineering, IT, computer
engineering etc. Similarly there has been a growth in the IT sector as new
companies have emerged and existing companies have expanded their
businesses.
IT Human Resource Need Assessment Study
40
5.3 Future requirements
The total number of job positions that will be created in the industry in year
2006 are approximately 16,000, in year 2007 are 18000, in year 2008 are 22000,
in year 2009 are 25000 and in year 2010 are 28000 for the near term.
The somewhat abstract (predicted) requirements for IT professionals for the
long term are as follows: in year 2011 are 31000, in year 2012 are 35000, in
year 2013 are 38000, in year 2014 are 42000 an in year 2015 are 45000.
5.4 The Curriculum Revision
Apparently it seems that the supply is much more than the demand of IT
professionals in the industry, but considering that the Govt. organizations
and non-it private limited companies are excluded from the population, it
would be fair to assume that the gap will be filled to a reasonable extent by
these entities. Hence, the job prospects in the market are good for graduates
of well reputed universities, whereas each year 5-10% of the graduates
(mostly from weaker universities) will remain unemployed not because of the
absence of job opportunities but due to the lack of adequate training to meet
the changing demands of the industry.
Hence, universities need to revise their curriculum along with the changing
needs of the industry. Also Govt. should join hands with the private sector to
meet their demand of a more mature, skilled and trained work force by
sharing the cost of training and re-training of IT Professionals in the industry
and also by setting up an executive development centre where these fresh
graduates equip themselves with market standards.

IT Human Resource Need Assessment Study
41
5.5 The Standardization
Another important factor in this regard is the standardization issue. It is
imperative that the IT (in industrial as well as educational perspective)
should be taken as a profession like medicine, law or engineering and an
independent body needs to be set up to standardize the education by
considering all its dimensions. This entity should be formed in line with PEC
or PMDC but with a more pro-active approach. HEC has established NCEAC
(National Computing Education Accreditation Council) as a first step in this
regard but its evolution and effective role is yet to be observed. More concrete
efforts in this regard are needed to cope with challenges of tomorrow.
IT Human Resource Need Assessment Study
42
Glossary
IT Professional:
Professionals involved in the design/development, services, installation, and
implementation of computer systems and applications, including those
personnel that have a degree or certification and experience in the
information technology arena.
System Administration:
The term system administrator (abbreviation: sys-admin) designates a job
position of engineers involved in computer systems. They are the people
responsible for running the system, or running some aspect of it.
Database administration:
Database administration is the process of establishing computerized
databases, and insuring their recoverability, integrity, security, availability,
reliability, and performance.
System Analyst:
A person responsible for studying the requirements, feasibility, cost, design,
specification, and implementation of a computer based system for an
organization/ business.
Networking:
The linking of a number of devices, such as computers, workstations,
printers, and AV gear into a network (system) for the purpose of sharing
resources.
Software Developers:
The professional and amateur programmers who create software for use on
computers.
Software engineering:
Software engineering is the profession concerned with creating and
maintaining software applications by applying technologies and practices
IT Human Resource Need Assessment Study
43
from computer science, project management, engineering, application
domains, and other fields.
IT Human Resource Need Assessment Study
44
Computer Science:
The body of knowledge resulting from this discipline contains theories for
understanding computing systems and methods; design methodology,
algorithms, and tools; methods for the testing of concepts; methods of
analysis and verification; and knowledge representation and implementation.
E-Commerce:
E-commerce is the buying and selling of goods and services, and the transfer
of funds, through digital communications.
Industrial automation:
Industrial automation is the use of computers to control industrial machinery
and processes, replacing human operators.
Support staff:
Support staff is a technician and other support personnel who resolve
incidents assigned to them within the system.
MIS
This stands for Management Information Systems, and is really just another
name for data processing by computer to produce current, accurate, and
informative reports for decision makers.
Security
Protection of networks and their services from unauthorized modification,
destruction, or disclosure, and provision of assurance that the network
performs its critical functions correctly and there are no harmful side-effects.
Network security includes providing for data integrity.
Embedded Systems:
Large engineering systems containing a computer to monitor its whole
behavior.
Others:
IT professionals employed by the industry serve the reason for which a
particular company operates rather than their true specialization.
IT Human Resource Need Assessment Study
45
Class Interval: In plotting a histogram, one starts by dividing the range of values into a set of non-overlapping intervals, called class intervals, in such a way that every datum is contained in some class interval. Cluster Sample: In a cluster sample, the sampling unit is a collection of population units, not single population units. For example, techniques for adjusting the U.S. census start with a sample of geographic blocks, then (try to) enumerate all inhabitants of the blocks in the sample to obtain a sample of people. This is an example of a cluster sample. (The blocks are chosen separately from different strata, so the overall design is a stratified cluster sample.) Confidence Interval: A confidence interval for a parameter is a random interval constructed from data in such a way that the probability that the interval contains the true value of the parameter can be specified before the data are collected. Confidence Level: The confidence level of a confidence interval is the chance that the interval that will result once data are collected will contain the corresponding parameter. If one computes confidence intervals again and again from independent data, the long-term limit of the fraction of intervals that contain the parameter is the confidence level. Correlation: A measure of linear association between two (ordered) lists. Two variables can be strongly correlated without having any causal relationship, and two variables can have a causal relationship and yet be uncorrelated. Correlation coefficient: The correlation coefficient r is a measure of how nearly a scatterplot falls on a straight line. The correlation coefficient is always between -1 and +1. To compute the correlation coefficient of a list of pairs of measurements (X,Y), first transform X and Y individually into standard units. Multiply
IT Human Resource Need Assessment Study
46
corresponding elements of the transformed pairs to get a single list of numbers. The correlation coefficient is the mean of that list of products. Dependent Variable: In regression, the variable whose values are supposed to be explained by changes in the other variable (the independent or explanatory variable). Usually one regresses the dependent variable on the independent variable. Discrete Variable: A quantitative variable whose set of possible values is countable. Typical examples of discrete variables are variables whose possible values are a subset of the integers, such as the number of vehicles that cross a particular bridge on a given day, the number of people in a family, ages rounded to the nearest year, etc. Discrete variables are "chunky." C.f. continuous variable. A discrete random variable is one whose set of possible values is countable. A random variable is discrete if and only if its cumulative probability distribution function is a stair-step function; i.e., if it is piecewise constant and only increases by jumps. Distribution: The distribution of a set of numerical data is how their values are distributed over the real numbers. It is completely characterized by the empirical distribution function. Similarly, the probability distribution of a random variable is completely characterized by its probability distribution function. Sometimes the word "distribution" is used as a synonym for the empirical distribution function or the probability distribution function. Estimator: An estimator is a rule for "guessing" the value of a population parameter based on a random sample from the population. An estimator is a random variable, because its value depends on which particular sample is obtained, which is random. A canonical example of an estimator is the sample mean, which is an estimator of the population mean. Expectation, Expected Value: The expected value of a random variable is the long-term limiting average of its values in independent repeated experiments. The expected value of the random variable X is denoted EX or E(X). For a discrete random variable (one that has a countable number of possible values) the expected value is the
IT Human Resource Need Assessment Study
47
weighted average of its possible values, where the weight assigned to each possible value is the chance that the random variable takes that value. One can think of the expected value of a random variable as the point at which its probability histogram would balance, if it were cut out of a uniform material. Taking the expected value is a linear operation: if X and Y are two random variables, the expected value of their sum is the sum of their expected values (E(X+Y) = E(X) + E(Y)), and the expected value of a constant a times a random variable X is the constant times the expected value of X (E(a×X ) = a× E(X)). Histogram: A histogram is a kind of plot that summarizes how data are distributed. Starting with a set of class intervals, the histogram is a set of rectangles ("bins") sitting on the horizontal axis. The bases of the rectangles are the class intervals, and their heights are such that their areas are proportional to the fraction of observations in the corresponding class intervals. That is, the height of a given rectangle is the fraction of observations in the corresponding class interval, divided by the length of the corresponding class interval. A histogram does not need a vertical scale, because the total area of the histogram must equal 100%. The units of the vertical axis are percent per unit of the horizontal axis. This is called the density scale. The horizontal axis of a histogram needs a scale. If any observations coincide with the endpoints of class intervals, the endpoint convention is important. Independent Variable: In regression, the independent variable is the one that is supposed to explain the other; the term is a synonym for "explanatory variable." Usually, one regresses the "dependent variable" on the "independent variable." There is not always a clear choice of the independent variable. The independent variable is usually plotted on the horizontal axis. Independent in this context does not mean the same thing as statistically independent. Population: A collection of units being studied. Units can be people, places, objects, epochs, drugs, procedures, or many other things. Much of statistics is concerned with estimating numerical properties (parameters) of an entire population from a random sample of units from the population. Regression, Linear Regression: Linear regression fits a line to a scatterplot in such a way as to minimize the sum of the squares of the residuals. The resulting regression line, together
IT Human Resource Need Assessment Study
48
with the standard deviations of the two variables or their correlation coefficient, can be a reasonable summary of a scatter-plot if the scatter-plot is roughly football-shaped. In other cases, it is a poor summary. If we are regressing the variable Y on the variable X, and if Y is plotted on the vertical axis and X is plotted on the horizontal axis, the regression line passes through the point of averages, and has slope equal to the correlation coefficient times the SD of Y divided by the SD of X. Sample: A sample is a collection of units from a population. Standard Deviation (SD): The standard deviation of a set of numbers is the rms of the set of deviations between each element of the set and the mean of the set t-test: An hypothesis test based on approximating the probability histogram of the test statistic by Student's t curve. t tests usually are used to test hypotheses about the mean of a population when the sample size is intermediate and the distribution of the population is known to be nearly normal.
Extrapolation:
Extrapolation is when the value of a variable is estimated at times which have not yet been observed. This estimate may be reasonably reliable for short times into the future, but for longer times, the estimate is liable to become less accurate.
ANOVA:
(Analysis of variance): A test for significant differences between multiple means by comparing variances. It concerns a normally distributed response (outcome) variable and a single categorical explanatory (predictor) variable, which represents treatments or groups. ANOVA is a special case of multiple regression where indicator variables (or orthogonal polynomials) are used to describe the discrete levels of factor variables. The term analysis of variance refers not to the model but to the method of determining which effects are statistically significant.
IT Human Resource Need Assessment Study
49
Covariance models:
Models containing some quantitative and some qualitative explanatory variables, where the chief explanatory variables of interest are qualitative and the quantitative variables are introduced primarily to reduce the variance of the error terms. [Models in which all explanatory variables are qualitative are called analysis of variance -ANOVA- models.] Analysis of covariance -ANCOVA- combines features of ANOVA and regression.
F test:
The F test for linear regression tests whether the slope is significantly different from 0, which is equivalent to testing whether the fit using non-zero slope is significantly better than the null model with 0 slope.
General linear model:
A group of linear regression models in which the response variable is continuous and normally distributed, the response variable values are predicted from a linear combination of predictor variables, and the linear combination of values for the predictor variables is not transformed (i.e., there is no link function as in generalized linear models). Linear multiple regression is a typical example of general linear models whereas simple linear regression is a special case of generalized linear models with the identity link function.
Linear regression models:
In the context of linear statistical modeling, 'linear' means linear in the parameters (coefficients), not the explanatory variables. The explanatory variables can be transformed (say, x2), but the model will still be linear if the coefficients remain linear. When the overall function (Y) remains a sum of terms that are each an X variable multiplied by a coefficient, the function Y is said to be linear in the coefficients.

Annexure 02 Questionnaires to Industry (IT & Non IT)
Pakistan Software Export Board (PSEB) & NU-Consulting (FAST) Joint Study 1
IT Human Resource Need Assessment Study Questionnaire
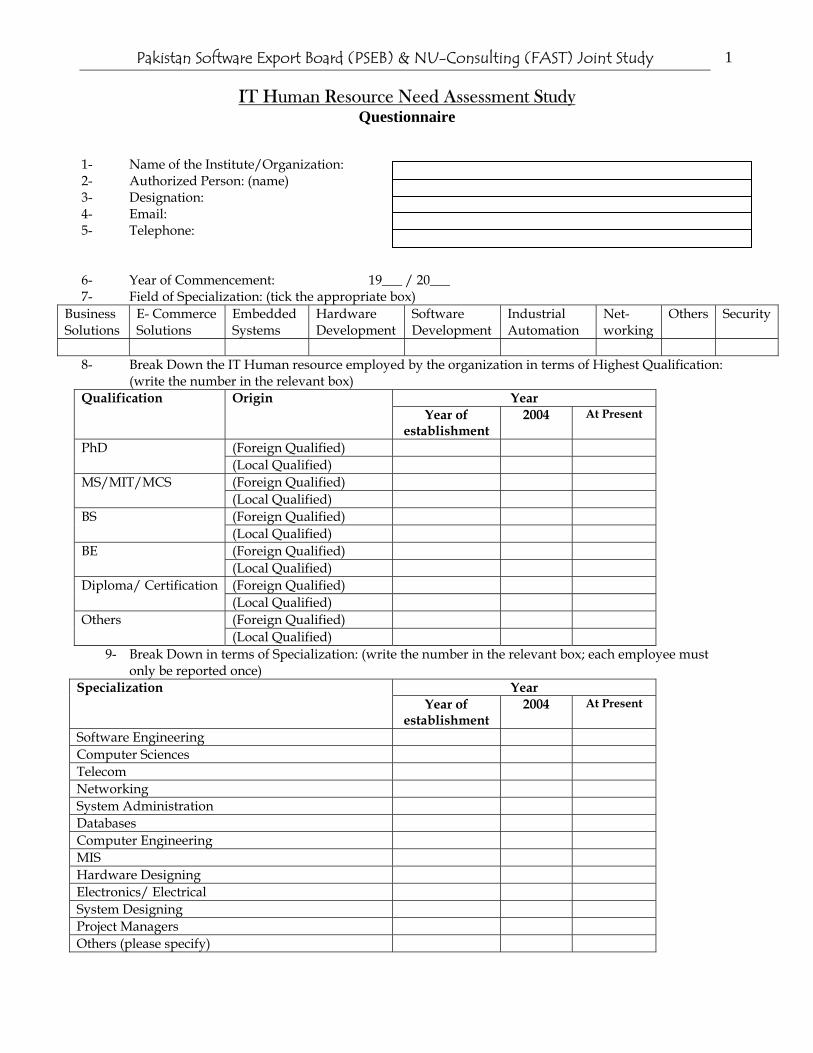
1- Name of the Institute/Organization: 2- Authorized Person: (name) 3- Designation: 4- Email: 5- Telephone: 6- Year of Commencement: 19___ / 20___ 7- Field of Specialization: (tick the appropriate box)
Business Solutions
E- Commerce Solutions
Embedded Systems
Hardware Development
Software Development
Industrial Automation
Net-working
Others Security
8- Break Down the IT Human resource employed by the organization in terms of Highest Qualification:
(write the number in the relevant box) Year Qualification Origin
Year of establishment
2004 At Present
(Foreign Qualified) PhD (Local Qualified) (Foreign Qualified) MS/MIT/MCS (Local Qualified) (Foreign Qualified) BS
(Local Qualified) (Foreign Qualified) BE (Local Qualified) (Foreign Qualified) Diploma/ Certification
(Local Qualified) (Foreign Qualified) Others
(Local Qualified) 9- Break Down in terms of Specialization: (write the number in the relevant box; each employee must
only be reported once) Year Specialization
Year of establishment
2004 At Present
Software Engineering Computer Sciences Telecom Networking System Administration Databases Computer Engineering MIS Hardware Designing Electronics/ Electrical System Designing Project Managers Others (please specify)
Pakistan Software Export Board (PSEB) & NU-Consulting (FAST) Joint Study 2
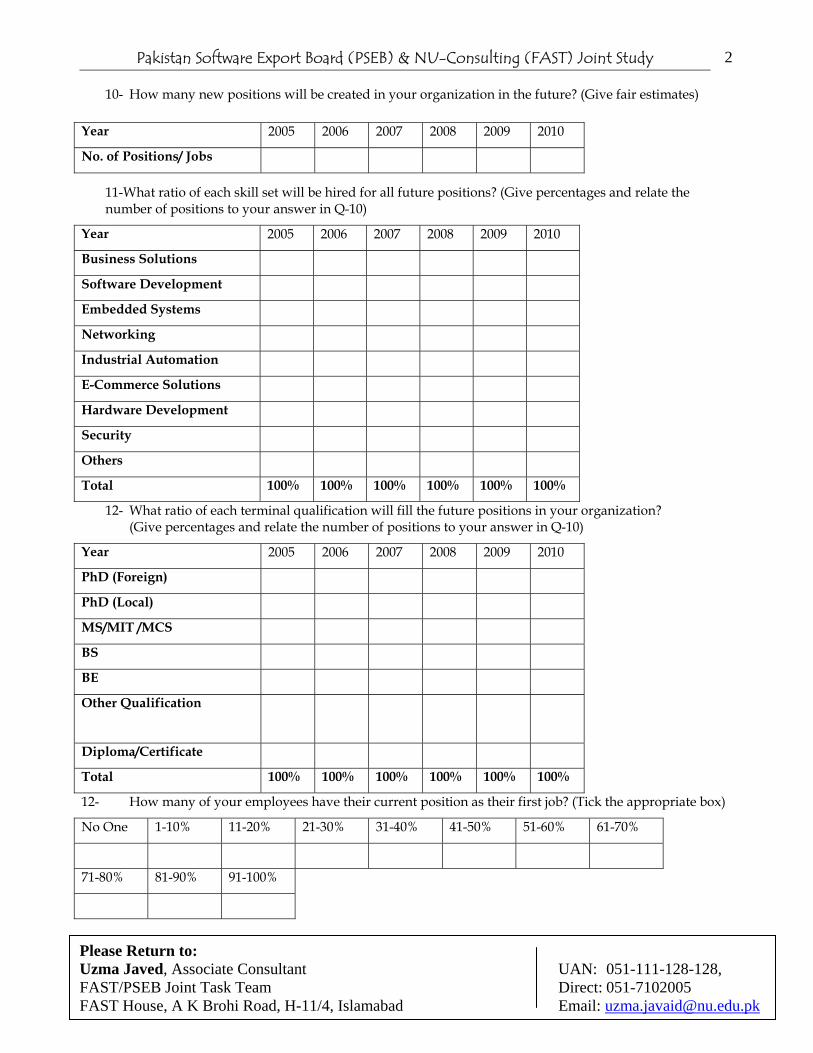
10- How many new positions will be created in your organization in the future? (Give fair estimates)
11-What ratio of each skill set will be hired for all future positions? (Give percentages and relate the number of positions to your answer in Q-10)
Year 2005 2006 2007 2008 2009 2010
Business Solutions
Software Development
Embedded Systems
Networking
Industrial Automation
E-Commerce Solutions
Hardware Development
Security
Others
Total 100% 100% 100% 100% 100% 100%
12- What ratio of each terminal qualification will fill the future positions in your organization? (Give percentages and relate the number of positions to your answer in Q-10)
Year 2005 2006 2007 2008 2009 2010
PhD (Foreign)
PhD (Local)
MS/MIT /MCS
BS
BE
Other Qualification
Diploma/Certificate
Total 100% 100% 100% 100% 100% 100%
12- How many of your employees have their current position as their first job? (Tick the appropriate box)
No One 1-10% 11-20% 21-30% 31-40% 41-50% 51-60% 61-70%
71-80% 81-90% 91-100%
Year 2005 2006 2007 2008 2009 2010
No. of Positions/ Jobs
Please Return to: Uzma Javed, Associate Consultant UAN: 051-111-128-128, FAST/PSEB Joint Task Team Direct: 051-7102005 FAST House, A K Brohi Road, H-11/4, Islamabad Email: [email protected]
Pakistan Software Export Board (PSEB) & NU-Consulting (FAST) Joint Study 1
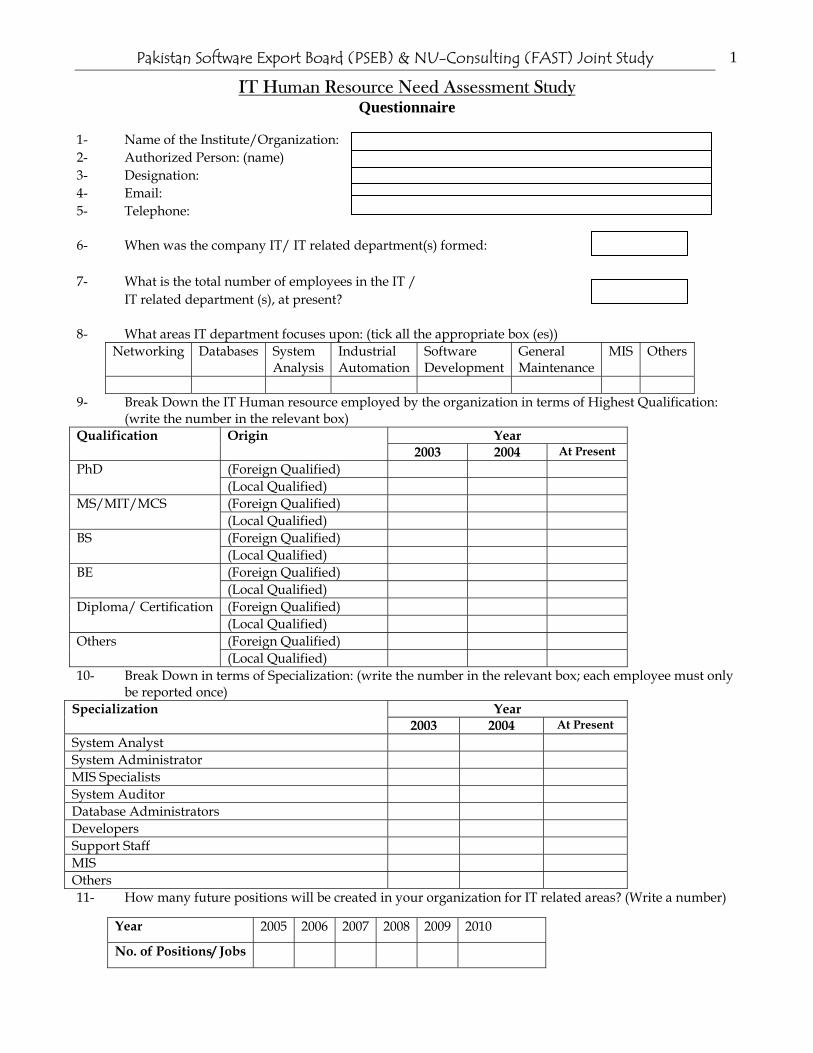
IT Human Resource Need Assessment Study Questionnaire
1- Name of the Institute/Organization: 2- Authorized Person: (name) 3- Designation: 4- Email: 5- Telephone: 6- When was the company IT/ IT related department(s) formed: 7- What is the total number of employees in the IT /
IT related department (s), at present?
8- What areas IT department focuses upon: (tick all the appropriate box (es)) Networking Databases System
Analysis Industrial Automation
Software Development
General Maintenance
MIS Others
9- Break Down the IT Human resource employed by the organization in terms of Highest Qualification:
(write the number in the relevant box) Year Qualification Origin
2003 2004 At Present (Foreign Qualified) PhD (Local Qualified) (Foreign Qualified) MS/MIT/MCS (Local Qualified) (Foreign Qualified) BS
(Local Qualified) (Foreign Qualified) BE (Local Qualified) (Foreign Qualified) Diploma/ Certification
(Local Qualified) (Foreign Qualified) Others
(Local Qualified) 10- Break Down in terms of Specialization: (write the number in the relevant box; each employee must only
be reported once) Year Specialization
2003 2004 At Present System Analyst System Administrator MIS Specialists System Auditor Database Administrators Developers Support Staff MIS Others 11- How many future positions will be created in your organization for IT related areas? (Write a number)
Year 2005 2006 2007 2008 2009 2010
No. of Positions/ Jobs
Pakistan Software Export Board (PSEB) & NU-Consulting (FAST) Joint Study 2
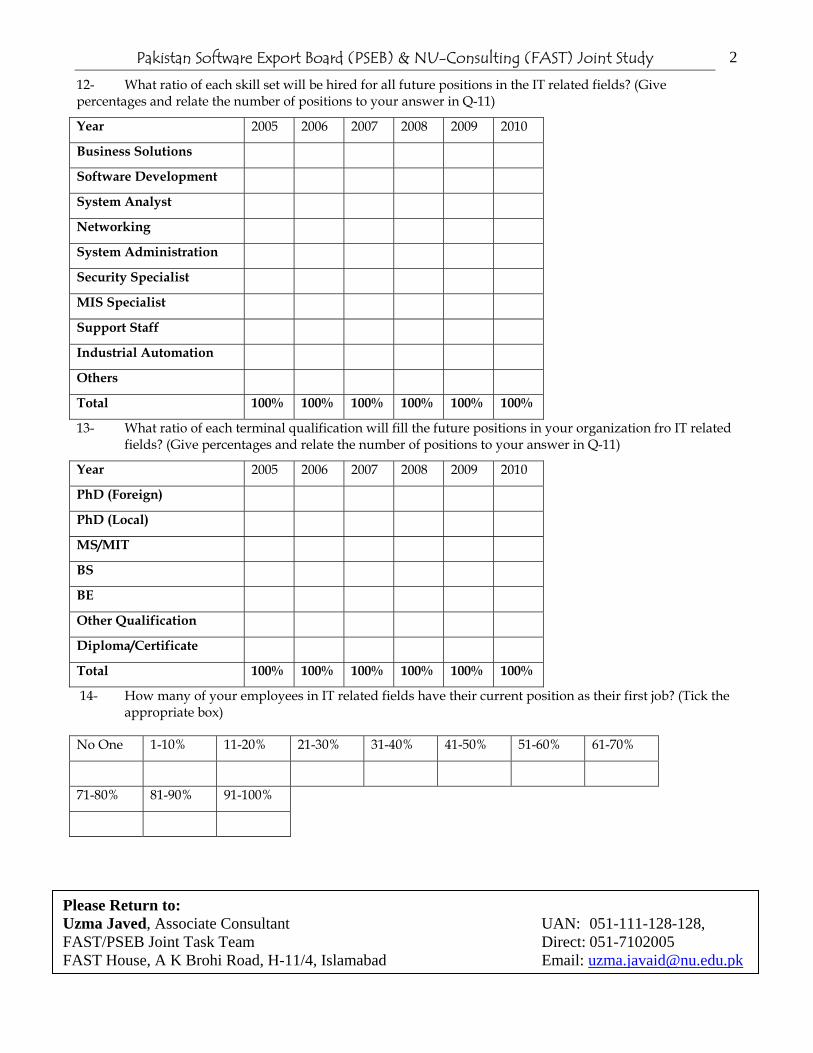
12- What ratio of each skill set will be hired for all future positions in the IT related fields? (Give percentages and relate the number of positions to your answer in Q-11)
Year 2005 2006 2007 2008 2009 2010
Business Solutions
Software Development
System Analyst
Networking
System Administration
Security Specialist
MIS Specialist
Support Staff
Industrial Automation
Others
Total 100% 100% 100% 100% 100% 100%
13- What ratio of each terminal qualification will fill the future positions in your organization fro IT related fields? (Give percentages and relate the number of positions to your answer in Q-11)
Year 2005 2006 2007 2008 2009 2010
PhD (Foreign)
PhD (Local)
MS/MIT
BS
BE
Other Qualification
Diploma/Certificate
Total 100% 100% 100% 100% 100% 100%
14- How many of your employees in IT related fields have their current position as their first job? (Tick the appropriate box)
No One 1-10% 11-20% 21-30% 31-40% 41-50% 51-60% 61-70%
71-80% 81-90% 91-100%
Please Return to: Uzma Javed, Associate Consultant UAN: 051-111-128-128, FAST/PSEB Joint Task Team Direct: 051-7102005 FAST House, A K Brohi Road, H-11/4, Islamabad Email: [email protected]

Annexure 03 Questionnaires to Academia (Universities)
Pakistan Software Export Board (PSEB) & NU-Consulting (FAST) Joint Study
1
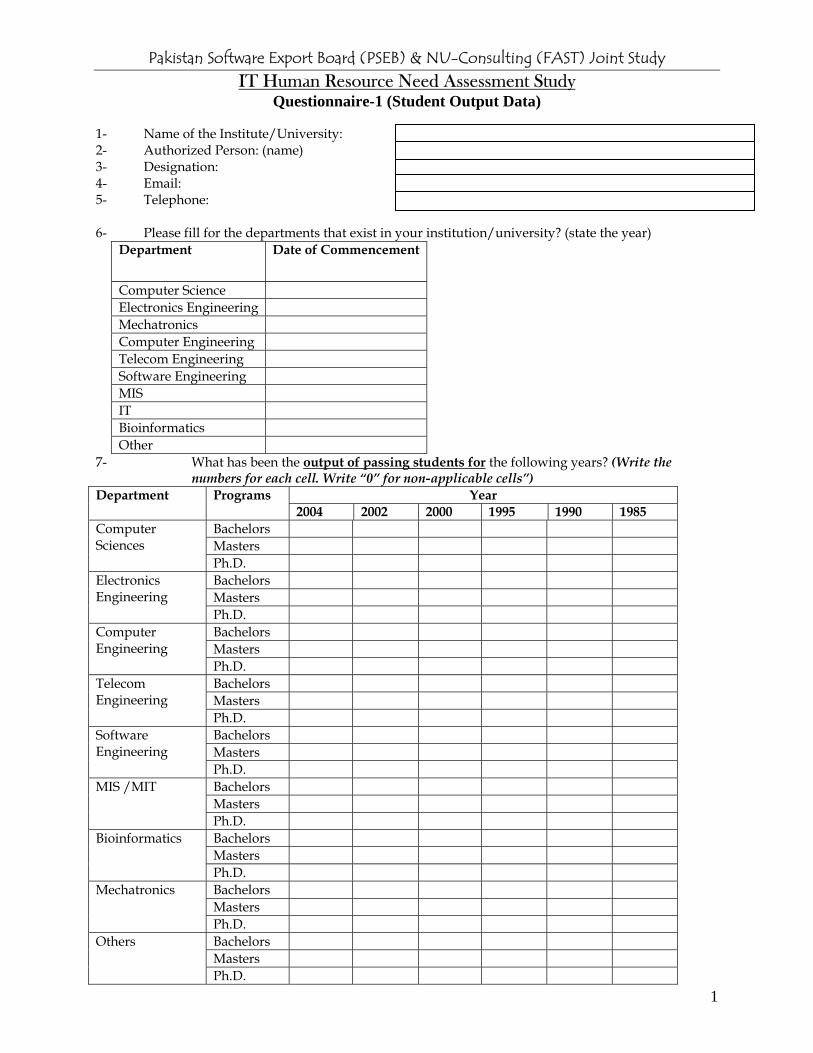
IT Human Resource Need Assessment Study Questionnaire-1 (Student Output Data)
1- Name of the Institute/University: 2- Authorized Person: (name) 3- Designation: 4- Email: 5- Telephone: 6- Please fill for the departments that exist in your institution/university? (state the year)
Department Date of Commencement
Computer Science Electronics Engineering Mechatronics Computer Engineering Telecom Engineering Software Engineering MIS IT Bioinformatics Other
7- What has been the output of passing students for the following years? (Write the numbers for each cell. Write “0” for non-applicable cells”)
Year Department Programs 2004 2002 2000 1995 1990 1985
Bachelors Masters
Computer Sciences
Ph.D. Bachelors Masters
Electronics Engineering
Ph.D. Bachelors Masters
Computer Engineering
Ph.D. Bachelors Masters
Telecom Engineering
Ph.D. Bachelors Masters
Software Engineering
Ph.D. Bachelors Masters
MIS /MIT
Ph.D. Bachelors Masters
Bioinformatics
Ph.D. Bachelors Masters
Mechatronics
Ph.D. Bachelors Masters
Others
Ph.D.
Pakistan Software Export Board (PSEB) & NU-Consulting (FAST) Joint Study
2
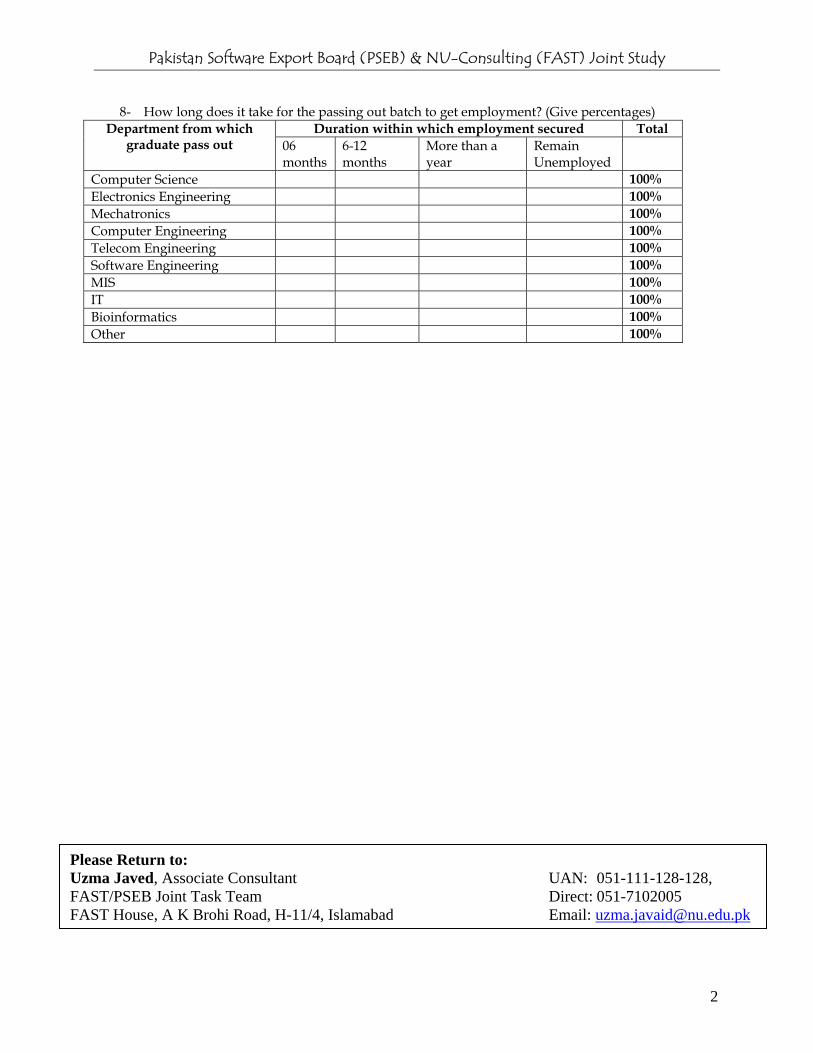
8- How long does it take for the passing out batch to get employment? (Give percentages)
Duration within which employment secured Total Department from which graduate pass out 06
months 6-12 months
More than a year
Remain Unemployed
Computer Science 100% Electronics Engineering 100% Mechatronics 100% Computer Engineering 100% Telecom Engineering 100% Software Engineering 100% MIS 100% IT 100% Bioinformatics 100% Other 100%
Please Return to: Uzma Javed, Associate Consultant UAN: 051-111-128-128, FAST/PSEB Joint Task Team Direct: 051-7102005 FAST House, A K Brohi Road, H-11/4, Islamabad Email: [email protected]
Pakistan Software Export Board (PSEB) & NU-Consulting (FAST) Joint Study
1
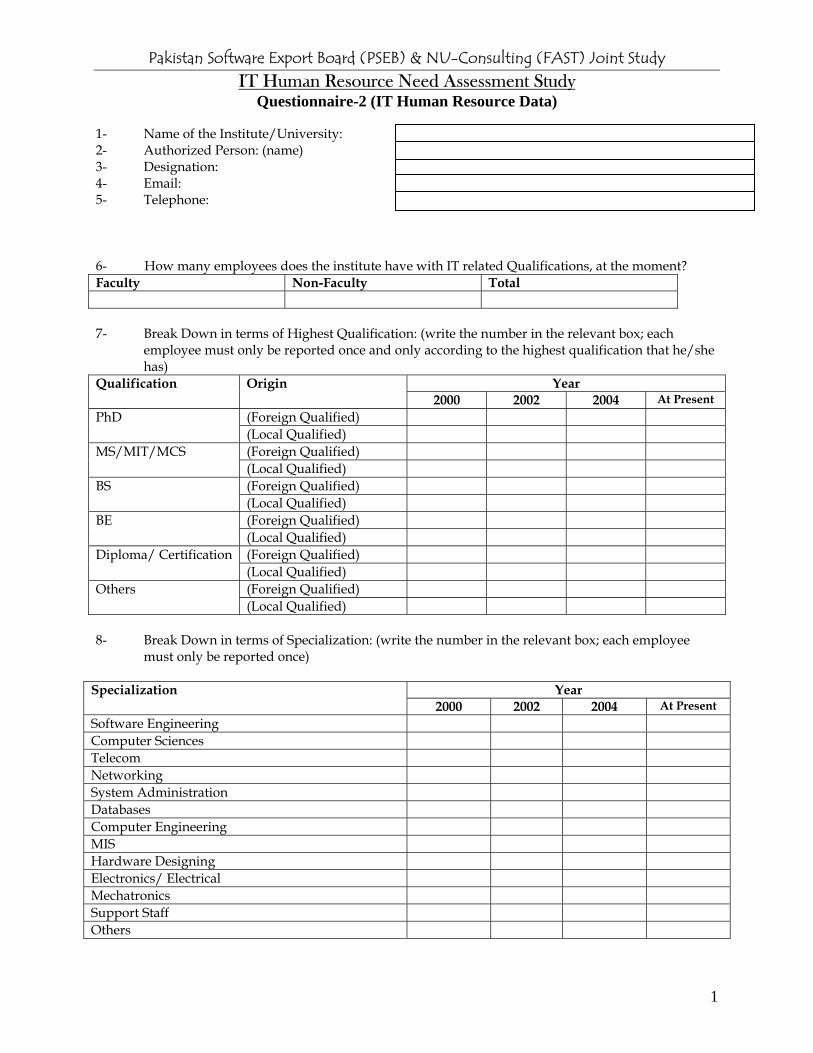
IT Human Resource Need Assessment Study Questionnaire-2 (IT Human Resource Data)
1- Name of the Institute/University: 2- Authorized Person: (name) 3- Designation: 4- Email: 5- Telephone: 6- How many employees does the institute have with IT related Qualifications, at the moment? Faculty Non-Faculty Total
7- Break Down in terms of Highest Qualification: (write the number in the relevant box; each
employee must only be reported once and only according to the highest qualification that he/she has)
Year Qualification Origin 2000 2002 2004 At Present
(Foreign Qualified) PhD (Local Qualified) (Foreign Qualified) MS/MIT/MCS (Local Qualified) (Foreign Qualified) BS
(Local Qualified) (Foreign Qualified) BE (Local Qualified) (Foreign Qualified) Diploma/ Certification
(Local Qualified) (Foreign Qualified) Others
(Local Qualified) 8- Break Down in terms of Specialization: (write the number in the relevant box; each employee
must only be reported once)
Year Specialization 2000 2002 2004 At Present
Software Engineering Computer Sciences Telecom Networking System Administration Databases Computer Engineering MIS Hardware Designing Electronics/ Electrical Mechatronics Support Staff Others
Pakistan Software Export Board (PSEB) & NU-Consulting (FAST) Joint Study
2
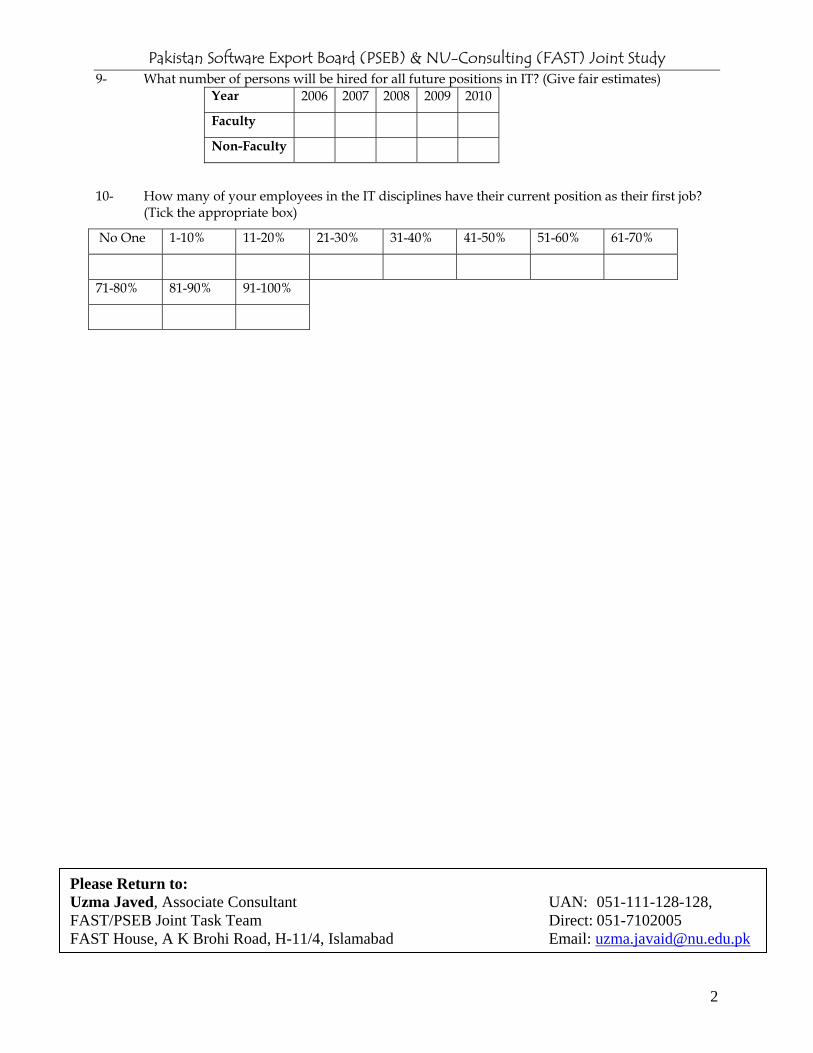
9- What number of persons will be hired for all future positions in IT? (Give fair estimates) Year 2006 2007 2008 2009 2010
Faculty
Non-Faculty
10- How many of your employees in the IT disciplines have their current position as their first job? (Tick the appropriate box)
No One 1-10% 11-20% 21-30% 31-40% 41-50% 51-60% 61-70%
71-80% 81-90% 91-100%
Please Return to: Uzma Javed, Associate Consultant UAN: 051-111-128-128, FAST/PSEB Joint Task Team Direct: 051-7102005 FAST House, A K Brohi Road, H-11/4, Islamabad Email: [email protected]

Annexure 04 (Facts & Figures)
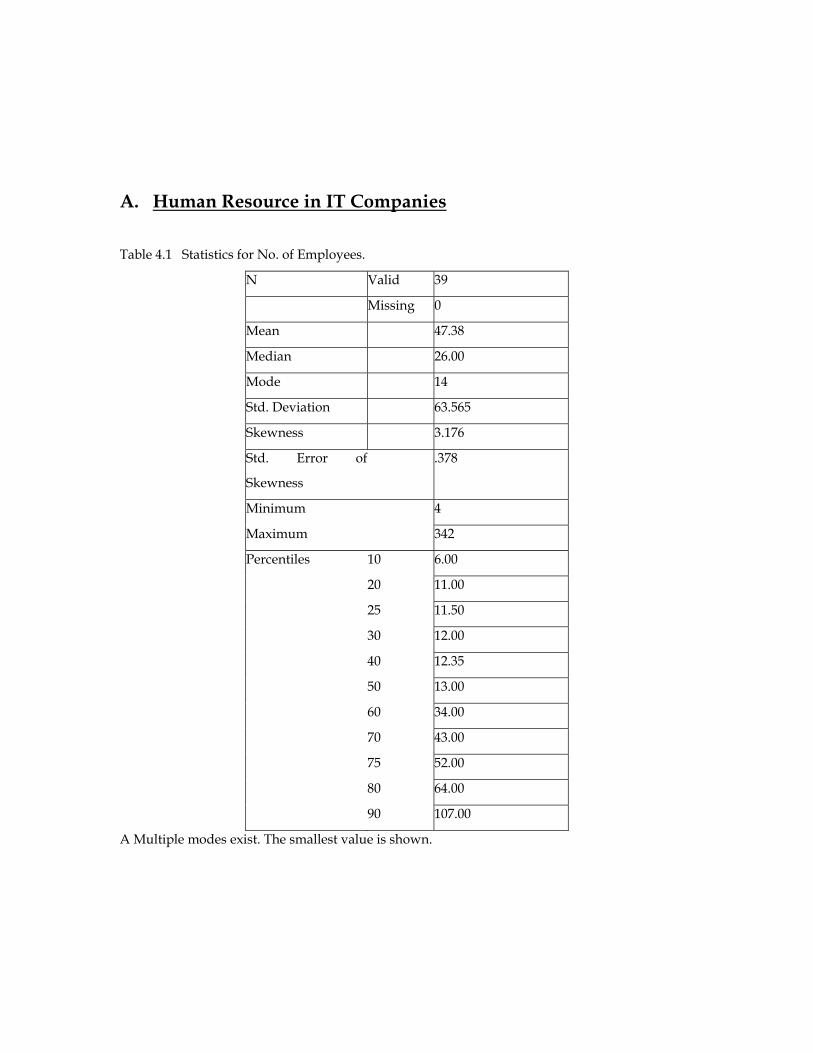
A. Human Resource in IT Companies
Table 4.1 Statistics for No. of Employees.
N Valid 39
Missing 0
Mean 47.38
Median 26.00
Mode 14
Std. Deviation 63.565
Skewness 3.176
Std. Error of
Skewness
.378
Minimum 4
Maximum 342
Percentiles 10 6.00
20 11.00
25 11.50
30 12.00
40 12.35
50 13.00
60 34.00
70 43.00
75 52.00
80 64.00
90 107.00
A Multiple modes exist. The smallest value is shown.
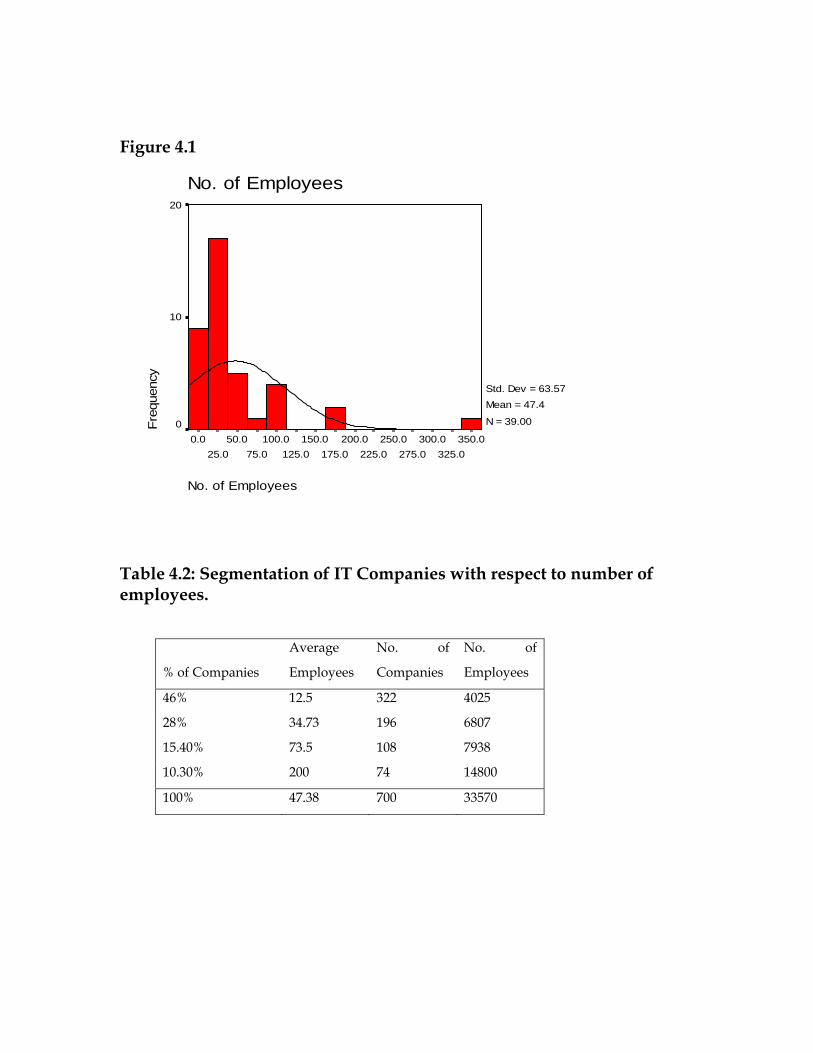
Figure 4.1
No. of Employees
350.0325.0
300.0275.0
250.0225.0
200.0175.0
150.0125.0
100.075.0
50.025.0
0.0
No. of Employees
Freq
uenc
y
20
10
0
Std. Dev = 63.57 Mean = 47.4
N = 39.00
Table 4.2: Segmentation of IT Companies with respect to number of employees.
% of Companies
Average
Employees
No. of
Companies
No. of
Employees
46% 12.5 322 4025
28% 34.73 196 6807
15.40% 73.5 108 7938
10.30% 200 74 14800
100% 47.38 700 33570
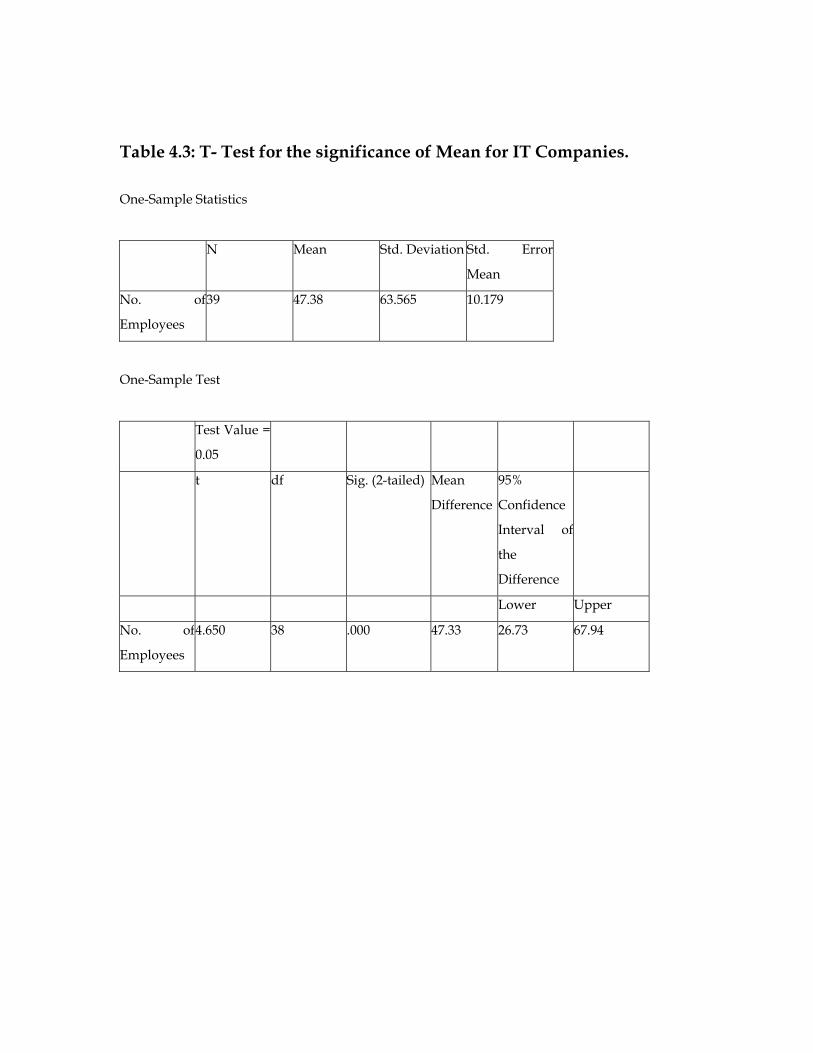
Table 4.3: T- Test for the significance of Mean for IT Companies.
One-Sample Statistics
N Mean Std. Deviation Std. Error
Mean
No. of
Employees
39 47.38 63.565 10.179
One-Sample Test
Test Value =
0.05
t df Sig. (2-tailed) Mean
Difference
95%
Confidence
Interval of
the
Difference
Lower Upper
No. of
Employees
4.650 38 .000 47.33 26.73 67.94
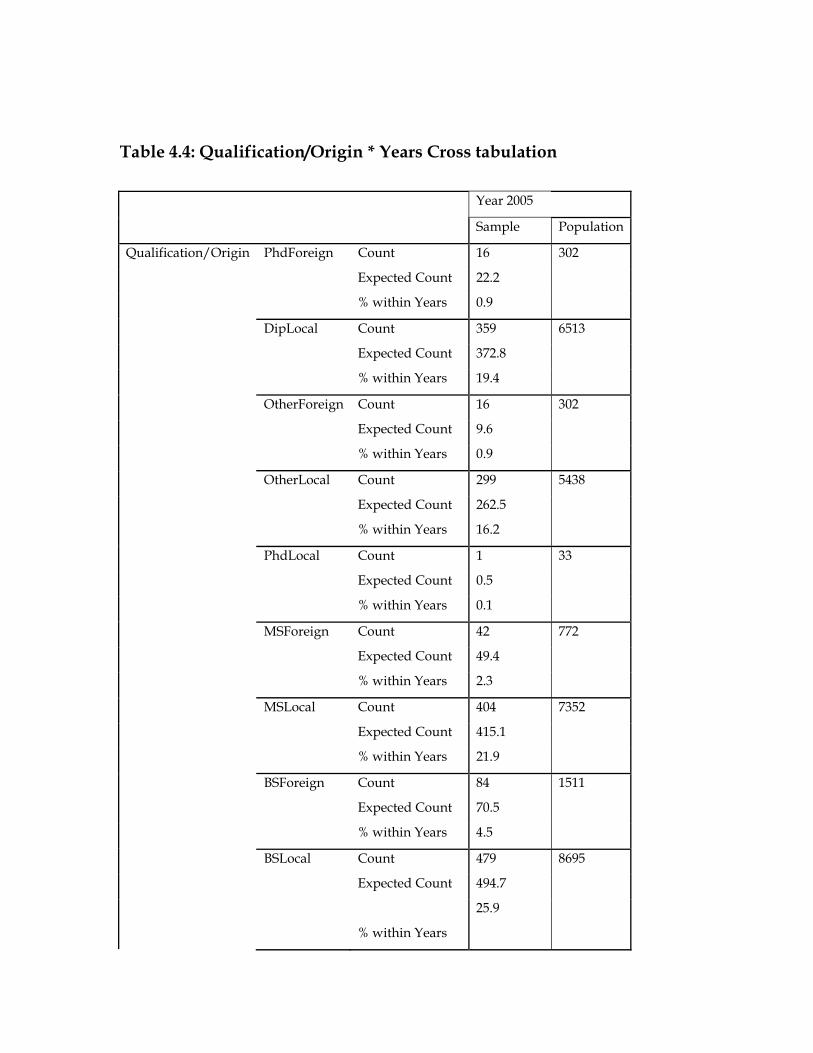
Table 4.4: Qualification/Origin * Years Cross tabulation
Year 2005
Sample Population
Qualification/Origin PhdForeign Count 16 302
Expected Count 22.2
% within Years 0.9
DipLocal Count 359 6513
Expected Count 372.8
% within Years 19.4
OtherForeign Count 16 302
Expected Count 9.6
% within Years 0.9
OtherLocal Count 299 5438
Expected Count 262.5
% within Years 16.2
PhdLocal Count 1 33
Expected Count 0.5
% within Years 0.1
MSForeign Count 42 772
Expected Count 49.4
% within Years 2.3
MSLocal Count 404 7352
Expected Count 415.1
% within Years 21.9
BSForeign Count 84 1511
Expected Count 70.5
% within Years 4.5
BSLocal Count 479 8695
Expected Count 494.7
% within Years
25.9
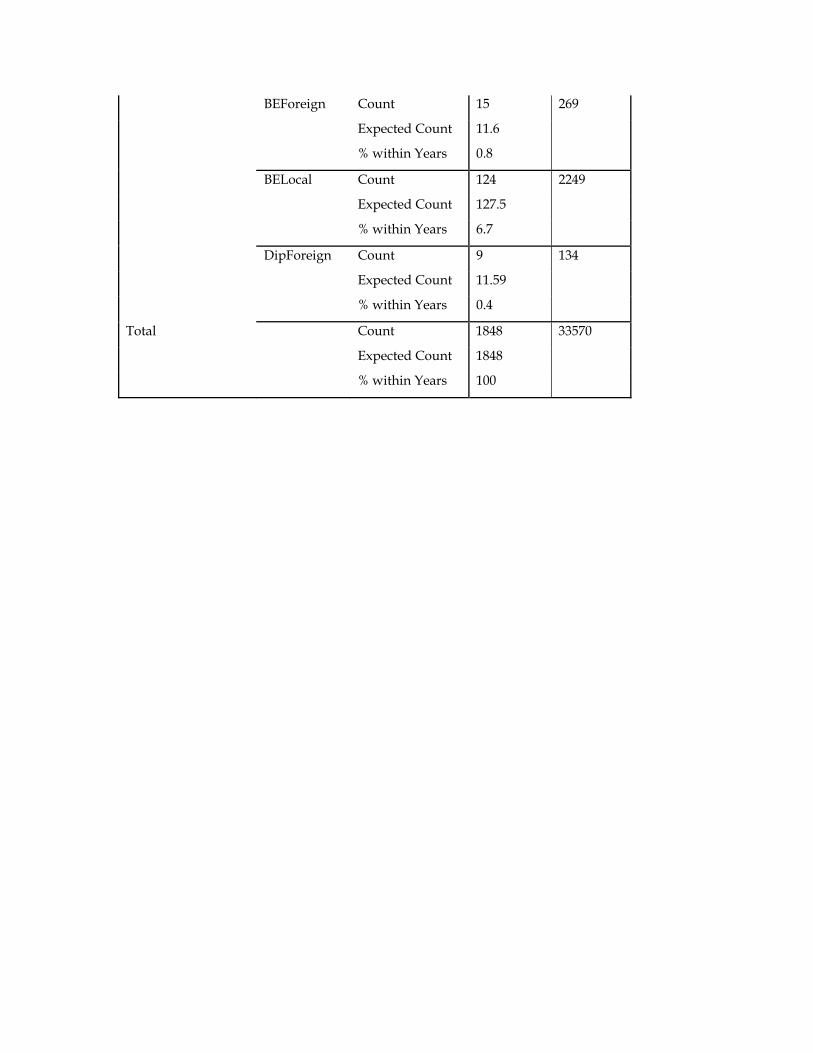
BEForeign Count 15 269
Expected Count 11.6
% within Years 0.8
BELocal Count 124 2249
Expected Count 127.5
% within Years 6.7
DipForeign Count 9 134
Expected Count 11.59
% within Years 0.4
Total Count 1848 33570
Expected Count 1848
% within Years 100
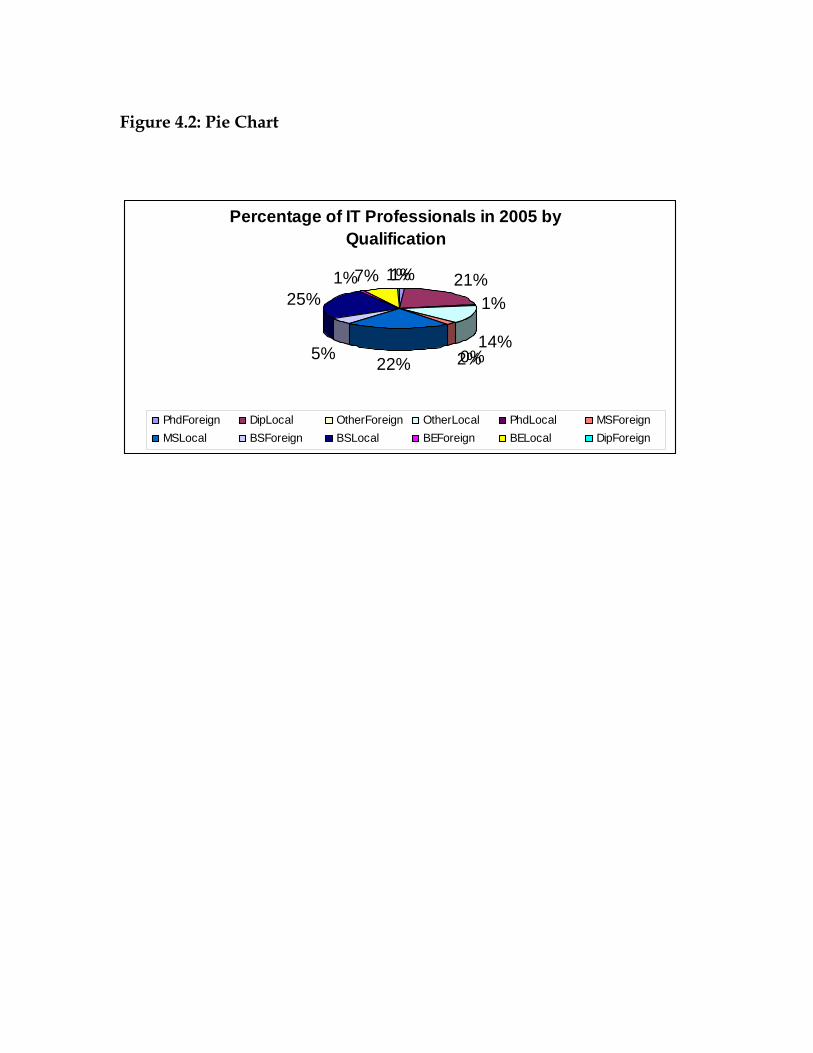
Figure 4.2: Pie Chart
Percentage of IT Professionals in 2005 by Qualification
1% 21%1%
14%0%2%22%5%
25%1%7% 1%
PhdForeign DipLocal OtherForeign OtherLocal PhdLocal MSForeignMSLocal BSForeign BSLocal BEForeign BELocal DipForeign
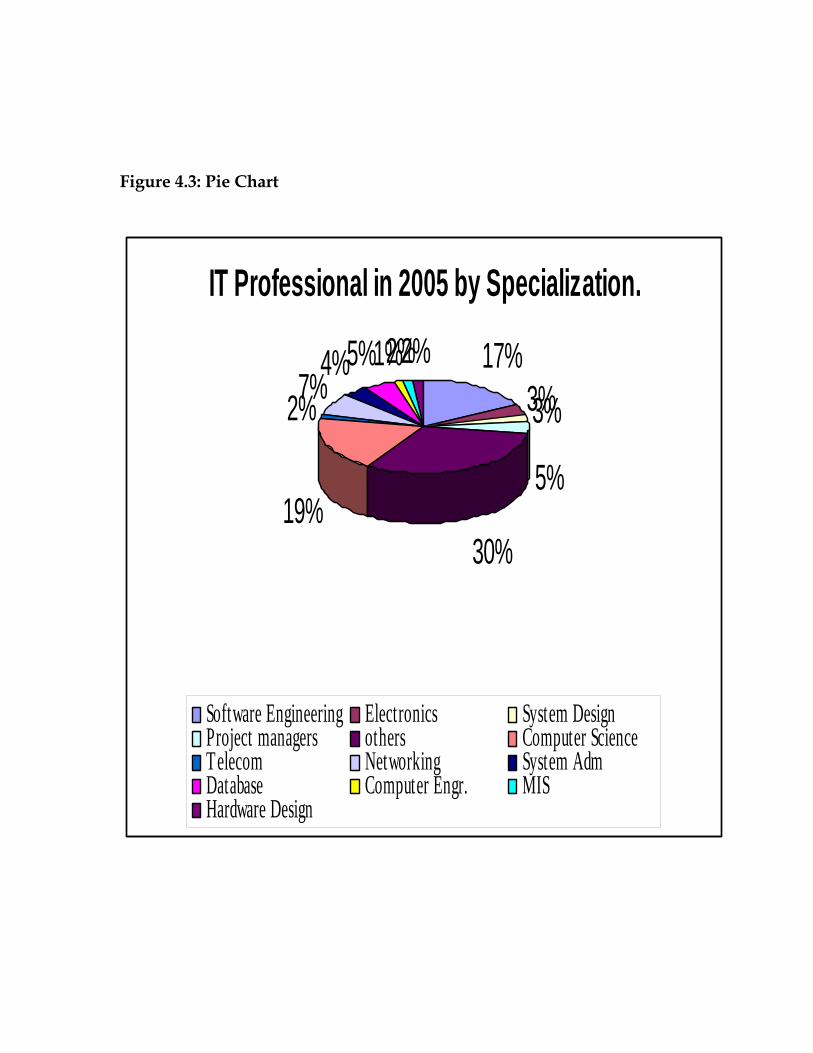
Figure 4.3: Pie Chart
IT Professional in 2005 by Specialization.
17%3%3%
5%
30%19%
2%7%4%5%1%2%2%
Software Engineering Electronics System DesignProject managers others Computer ScienceTelecom Networking System AdmDatabase Computer Engr. MISHardware Design
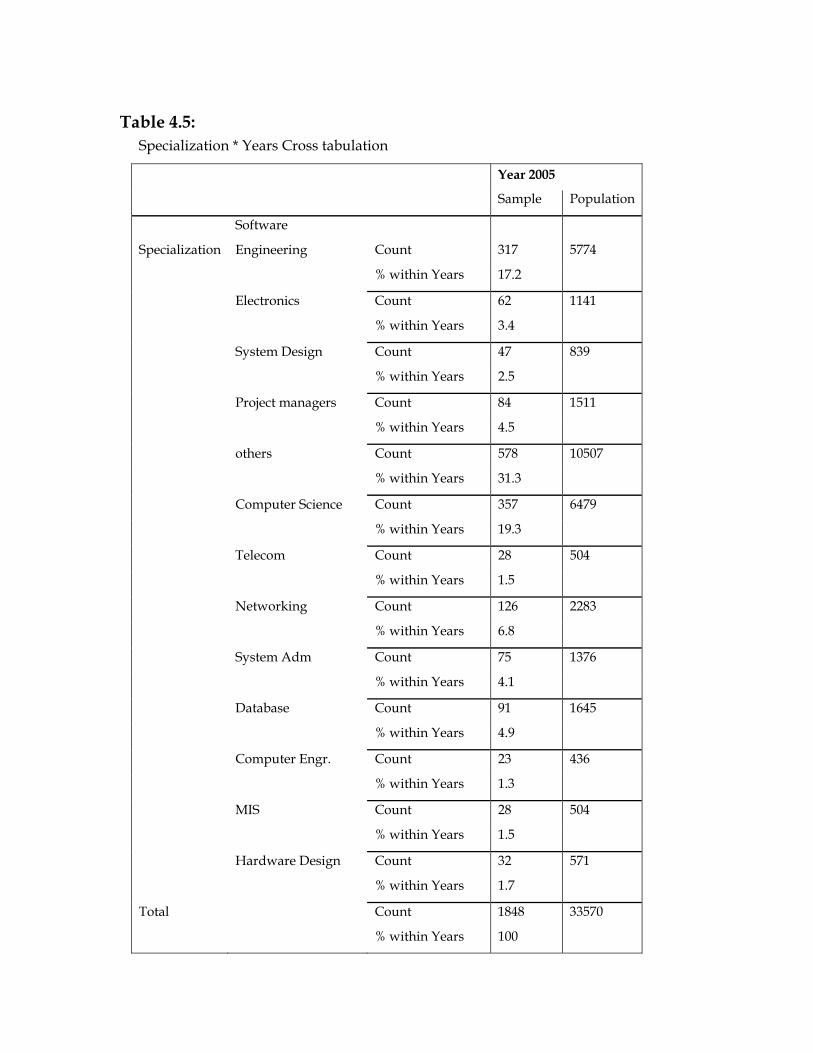
Table 4.5: Specialization * Years Cross tabulation
Year 2005
Sample Population
Specialization
Software
Engineering Count 317 5774
% within Years 17.2
Electronics Count 62 1141
% within Years 3.4
System Design Count 47 839
% within Years 2.5
Project managers Count 84 1511
% within Years 4.5
others Count 578 10507
% within Years 31.3
Computer Science Count 357 6479
% within Years 19.3
Telecom Count 28 504
% within Years 1.5
Networking Count 126 2283
% within Years 6.8
System Adm Count 75 1376
% within Years 4.1
Database Count 91 1645
% within Years 4.9
Computer Engr. Count 23 436
% within Years 1.3
MIS Count 28 504
% within Years 1.5
Hardware Design Count 32 571
% within Years 1.7
Total Count 1848 33570
% within Years 100
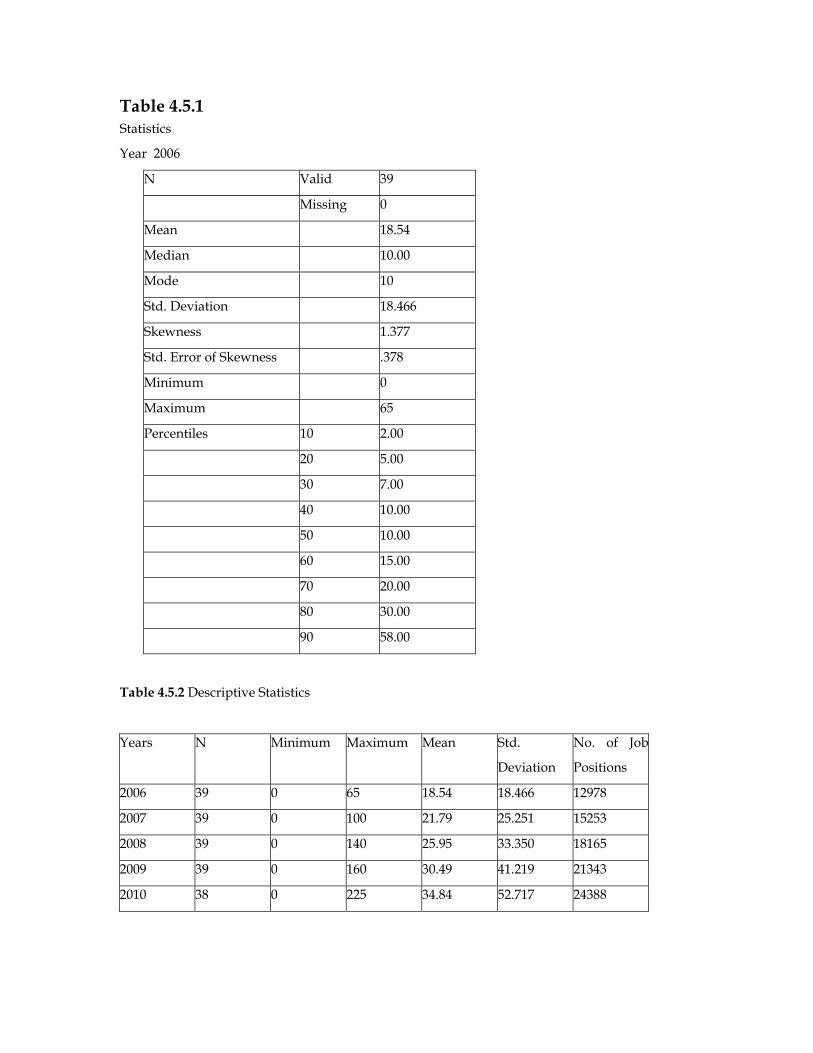
Table 4.5.1 Statistics
Year 2006
N Valid 39
Missing 0
Mean 18.54
Median 10.00
Mode 10
Std. Deviation 18.466
Skewness 1.377
Std. Error of Skewness .378
Minimum 0
Maximum 65
Percentiles 10 2.00
20 5.00
30 7.00
40 10.00
50 10.00
60 15.00
70 20.00
80 30.00
90 58.00
Table 4.5.2 Descriptive Statistics
Years N Minimum Maximum Mean Std.
Deviation
No. of Job
Positions
2006 39 0 65 18.54 18.466 12978
2007 39 0 100 21.79 25.251 15253
2008 39 0 140 25.95 33.350 18165
2009 39 0 160 30.49 41.219 21343
2010 38 0 225 34.84 52.717 24388
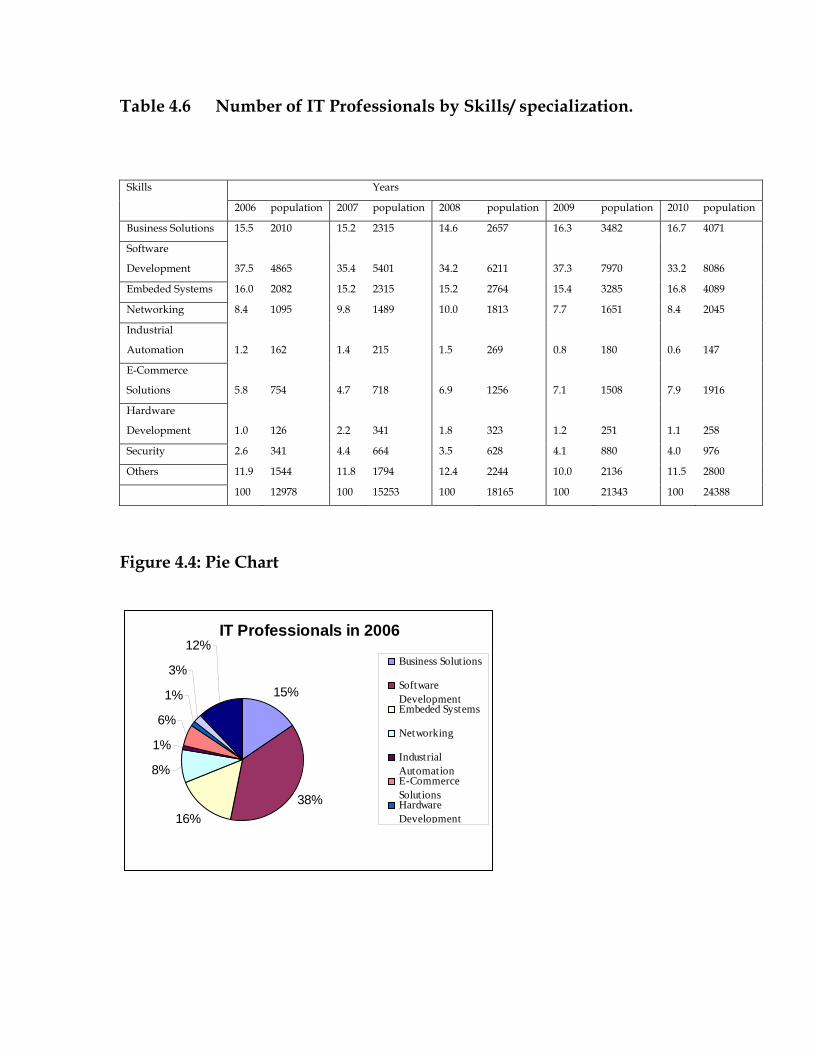
Table 4.6 Number of IT Professionals by Skills/ specialization.
Skills Years
2006 population 2007 population 2008 population 2009 population 2010 population
Business Solutions 15.5 2010 15.2 2315 14.6 2657 16.3 3482 16.7 4071
Software
Development 37.5 4865 35.4 5401 34.2 6211 37.3 7970 33.2 8086
Embeded Systems 16.0 2082 15.2 2315 15.2 2764 15.4 3285 16.8 4089
Networking 8.4 1095 9.8 1489 10.0 1813 7.7 1651 8.4 2045
Industrial
Automation 1.2 162 1.4 215 1.5 269 0.8 180 0.6 147
E-Commerce
Solutions 5.8 754 4.7 718 6.9 1256 7.1 1508 7.9 1916
Hardware
Development 1.0 126 2.2 341 1.8 323 1.2 251 1.1 258
Security 2.6 341 4.4 664 3.5 628 4.1 880 4.0 976
Others 11.9 1544 11.8 1794 12.4 2244 10.0 2136 11.5 2800
100 12978 100 15253 100 18165 100 21343 100 24388
Figure 4.4: Pie Chart
IT Professionals in 2006
15%
38%16%
8%
1%
6%
1%
3%
12%Business Solutions
SoftwareDevelopmentEmbeded Systems
Networking
IndustrialAutomationE-CommerceSolutionsHardwareDevelopment
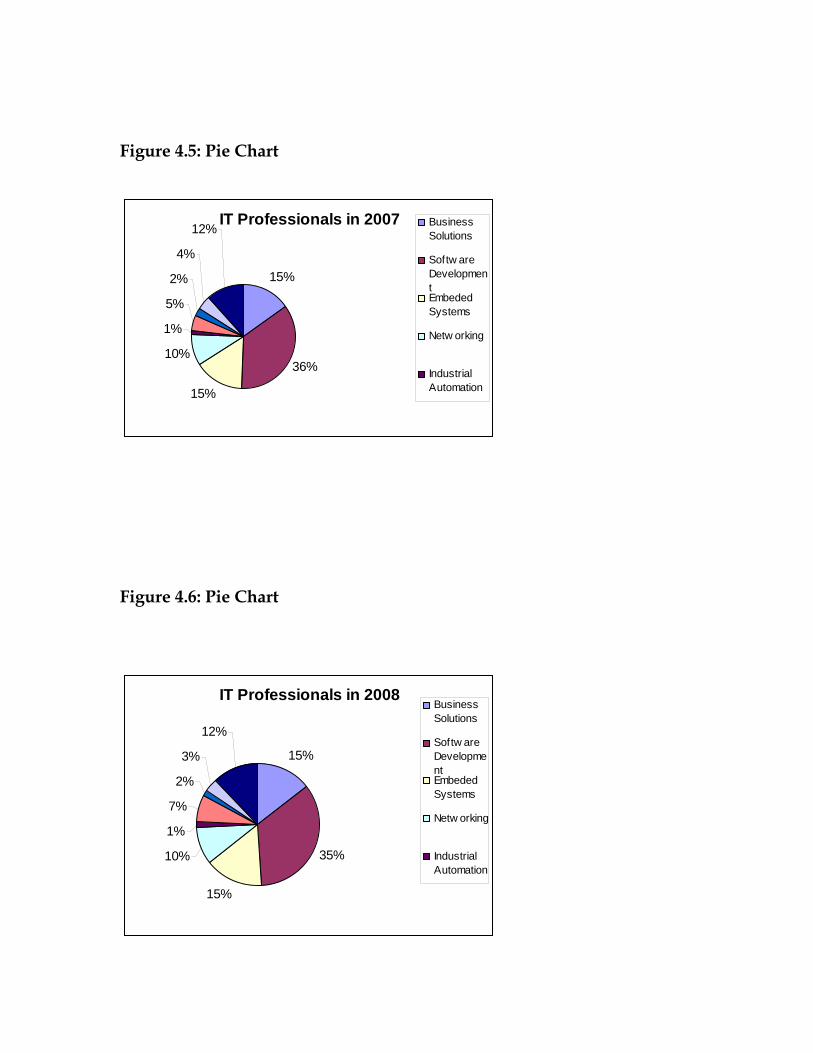
Figure 4.5: Pie Chart
IT Professionals in 2007
15%
36%
15%
10%
1%
5%
2%
4%
12% BusinessSolutions
Softw areDevelopmentEmbededSystems
Netw orking
IndustrialAutomation
Figure 4.6: Pie Chart
IT Professionals in 2008
15%
35%
15%
10%
1%
7%
2%
3%
12%
BusinessSolutions
Softw areDevelopmentEmbededSystems
Netw orking
IndustrialAutomation
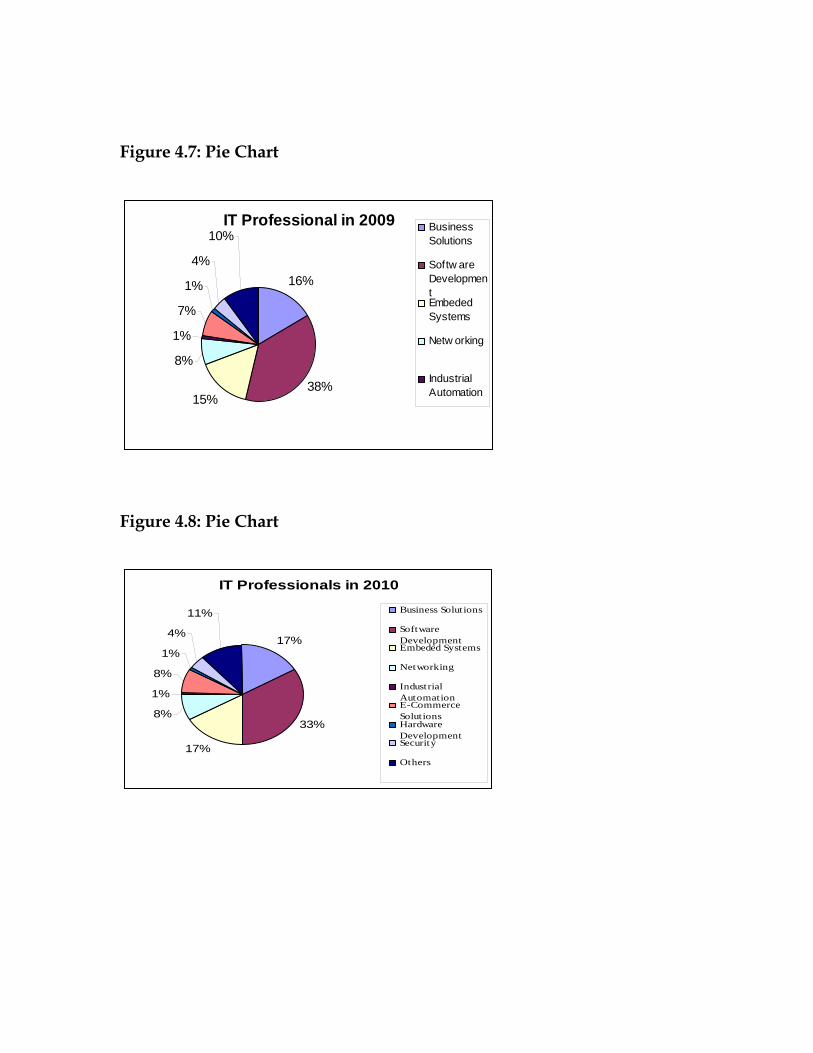
Figure 4.7: Pie Chart
IT Professional in 2009
16%
38%15%
8%
1%
7%
1%
4%
10%BusinessSolutions
Softw areDevelopmentEmbededSystems
Netw orking
IndustrialAutomation
Figure 4.8: Pie Chart
IT Professionals in 2010
17%
33%
17%
8%
1%
8%
1%
4%
11% Business Solutions
SoftwareDevelopmentEmbeded Systems
Networking
IndustrialAutomationE-CommerceSolutionsHardwareDevelopmentSecurity
Others
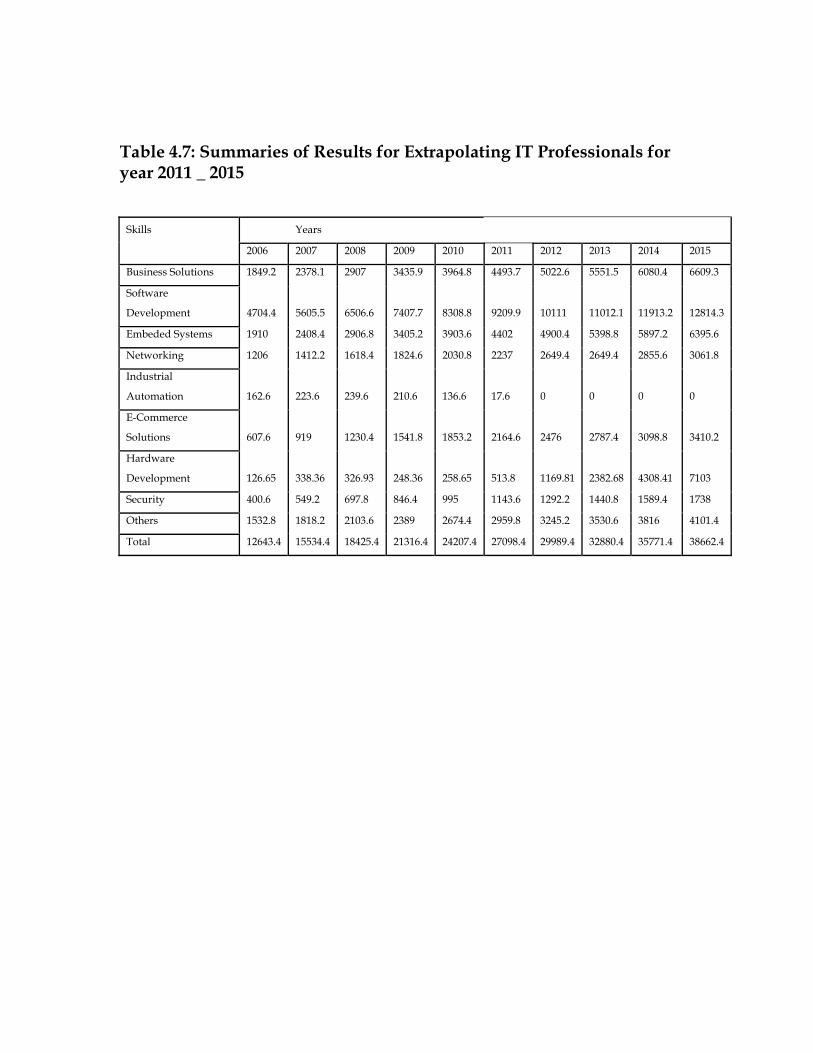
Table 4.7: Summaries of Results for Extrapolating IT Professionals for year 2011 _ 2015
Skills Years
2006 2007 2008 2009 2010 2011 2012 2013 2014 2015
Business Solutions 1849.2 2378.1 2907 3435.9 3964.8 4493.7 5022.6 5551.5 6080.4 6609.3
Software
Development 4704.4 5605.5 6506.6 7407.7 8308.8 9209.9 10111 11012.1 11913.2 12814.3
Embeded Systems 1910 2408.4 2906.8 3405.2 3903.6 4402 4900.4 5398.8 5897.2 6395.6
Networking 1206 1412.2 1618.4 1824.6 2030.8 2237 2649.4 2649.4 2855.6 3061.8
Industrial
Automation 162.6 223.6 239.6 210.6 136.6 17.6 0 0 0 0
E-Commerce
Solutions 607.6 919 1230.4 1541.8 1853.2 2164.6 2476 2787.4 3098.8 3410.2
Hardware
Development 126.65 338.36 326.93 248.36 258.65 513.8 1169.81 2382.68 4308.41 7103
Security 400.6 549.2 697.8 846.4 995 1143.6 1292.2 1440.8 1589.4 1738
Others 1532.8 1818.2 2103.6 2389 2674.4 2959.8 3245.2 3530.6 3816 4101.4
Total 12643.4 15534.4 18425.4 21316.4 24207.4 27098.4 29989.4 32880.4 35771.4 38662.4
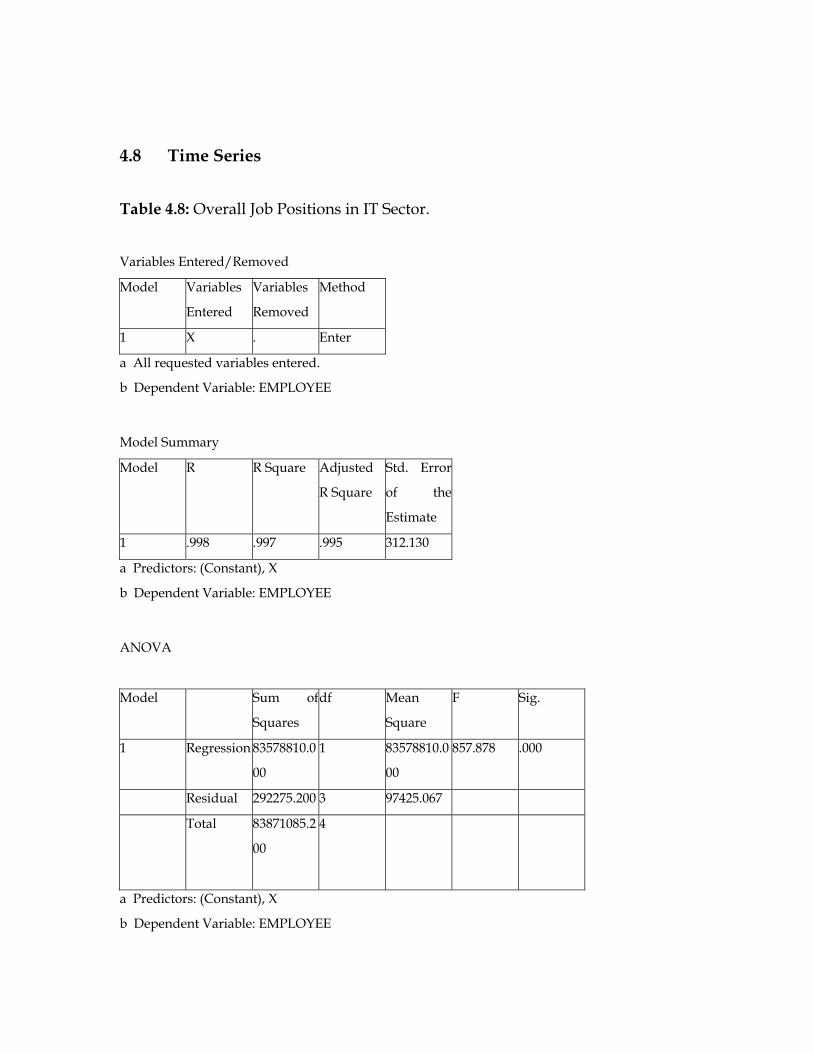
4.8 Time Series
Table 4.8: Overall Job Positions in IT Sector.
Variables Entered/Removed
Model Variables
Entered
Variables
Removed
Method
1 X . Enter
a All requested variables entered.
b Dependent Variable: EMPLOYEE
Model Summary
Model R R Square Adjusted
R Square
Std. Error
of the
Estimate
1 .998 .997 .995 312.130
a Predictors: (Constant), X
b Dependent Variable: EMPLOYEE
ANOVA
Model Sum of
Squares
df Mean
Square
F Sig.
1 Regression 83578810.0
00
1 83578810.0
00
857.878 .000
Residual 292275.200 3 97425.067
Total 83871085.2
00
4
a Predictors: (Constant), X
b Dependent Variable: EMPLOYEE
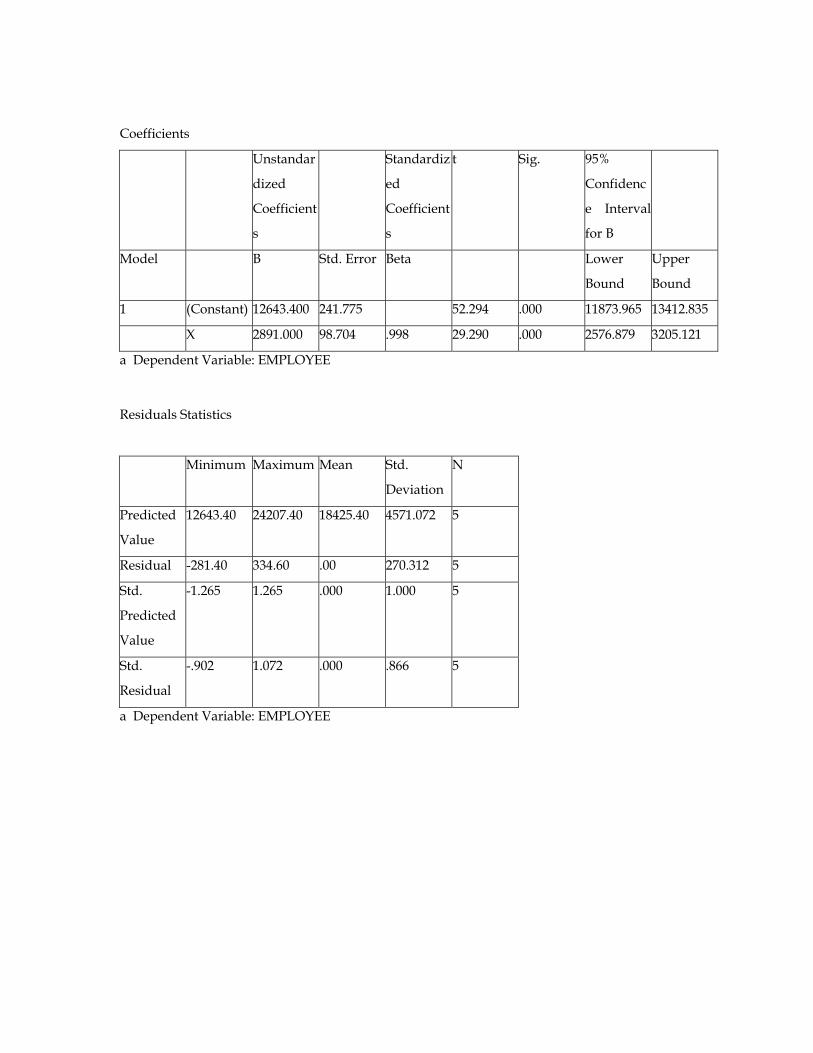
Coefficients
Unstandar
dized
Coefficient
s
Standardiz
ed
Coefficient
s
t Sig. 95%
Confidenc
e Interval
for B
Model B Std. Error Beta Lower
Bound
Upper
Bound
1 (Constant) 12643.400 241.775 52.294 .000 11873.965 13412.835
X 2891.000 98.704 .998 29.290 .000 2576.879 3205.121
a Dependent Variable: EMPLOYEE
Residuals Statistics
Minimum Maximum Mean Std.
Deviation
N
Predicted
Value
12643.40 24207.40 18425.40 4571.072 5
Residual -281.40 334.60 .00 270.312 5
Std.
Predicted
Value
-1.265 1.265 .000 1.000 5
Std.
Residual
-.902 1.072 .000 .866 5
a Dependent Variable: EMPLOYEE
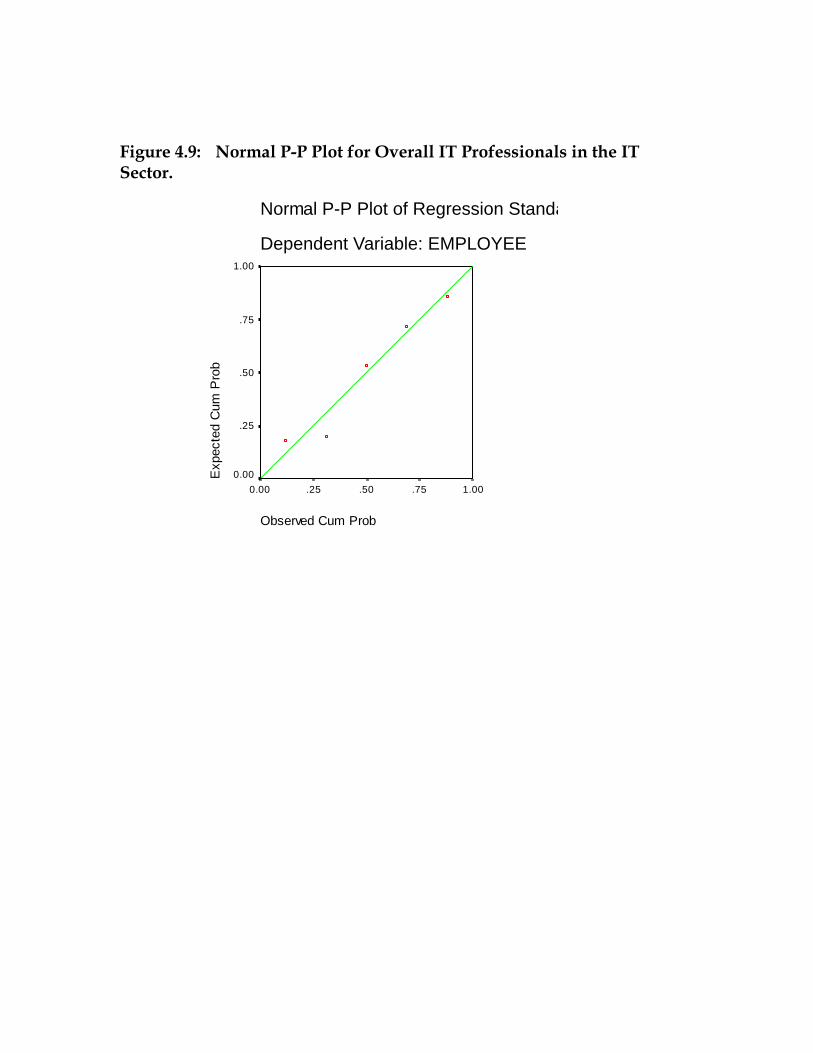
Figure 4.9: Normal P-P Plot for Overall IT Professionals in the IT Sector.
Normal P-P Plot of Regression Standa
Dependent Variable: EMPLOYEE
Observed Cum Prob
1.00.75.50.250.00
Exp
ecte
d C
um P
rob
1.00
.75
.50
.25
0.00
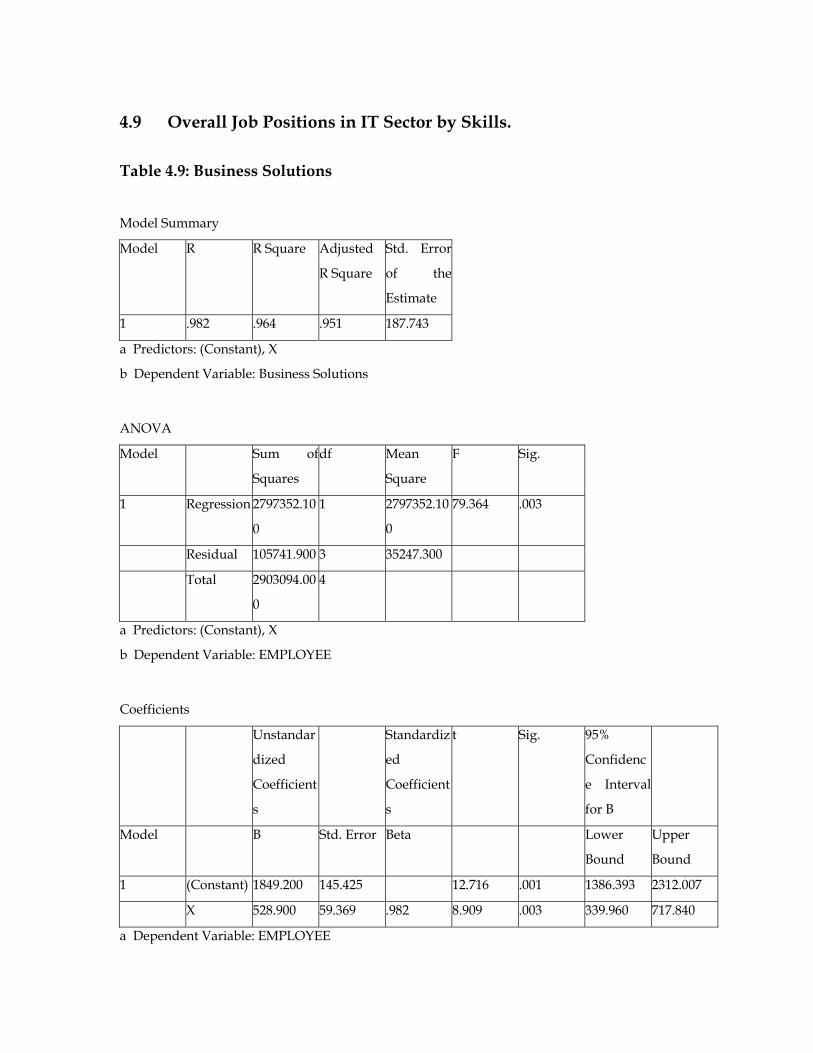
4.9 Overall Job Positions in IT Sector by Skills.
Table 4.9: Business Solutions
Model Summary
Model R R Square Adjusted
R Square
Std. Error
of the
Estimate
1 .982 .964 .951 187.743
a Predictors: (Constant), X
b Dependent Variable: Business Solutions
ANOVA
Model Sum of
Squares
df Mean
Square
F Sig.
1 Regression 2797352.10
0
1 2797352.10
0
79.364 .003
Residual 105741.900 3 35247.300
Total 2903094.00
0
4
a Predictors: (Constant), X
b Dependent Variable: EMPLOYEE
Coefficients
Unstandar
dized
Coefficient
s
Standardiz
ed
Coefficient
s
t Sig. 95%
Confidenc
e Interval
for B
Model B Std. Error Beta Lower
Bound
Upper
Bound
1 (Constant) 1849.200 145.425 12.716 .001 1386.393 2312.007
X 528.900 59.369 .982 8.909 .003 339.960 717.840
a Dependent Variable: EMPLOYEE
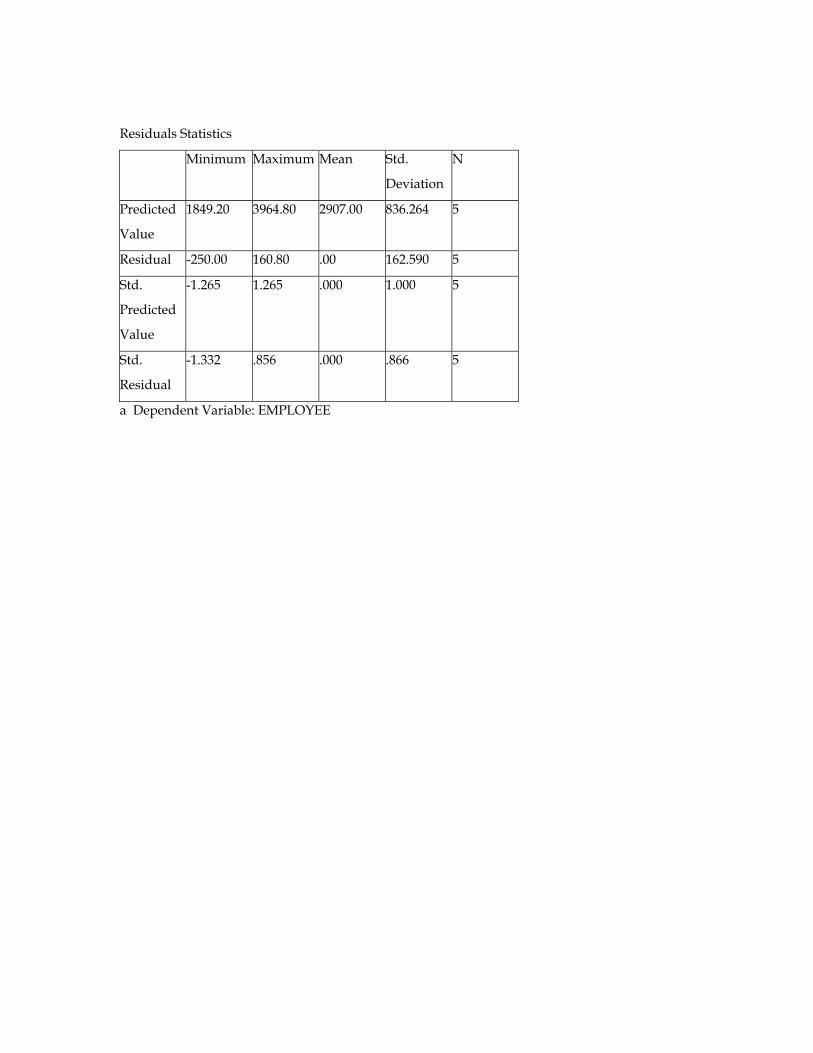
Residuals Statistics
Minimum Maximum Mean Std.
Deviation
N
Predicted
Value
1849.20 3964.80 2907.00 836.264 5
Residual -250.00 160.80 .00 162.590 5
Std.
Predicted
Value
-1.265 1.265 .000 1.000 5
Std.
Residual
-1.332 .856 .000 .866 5
a Dependent Variable: EMPLOYEE
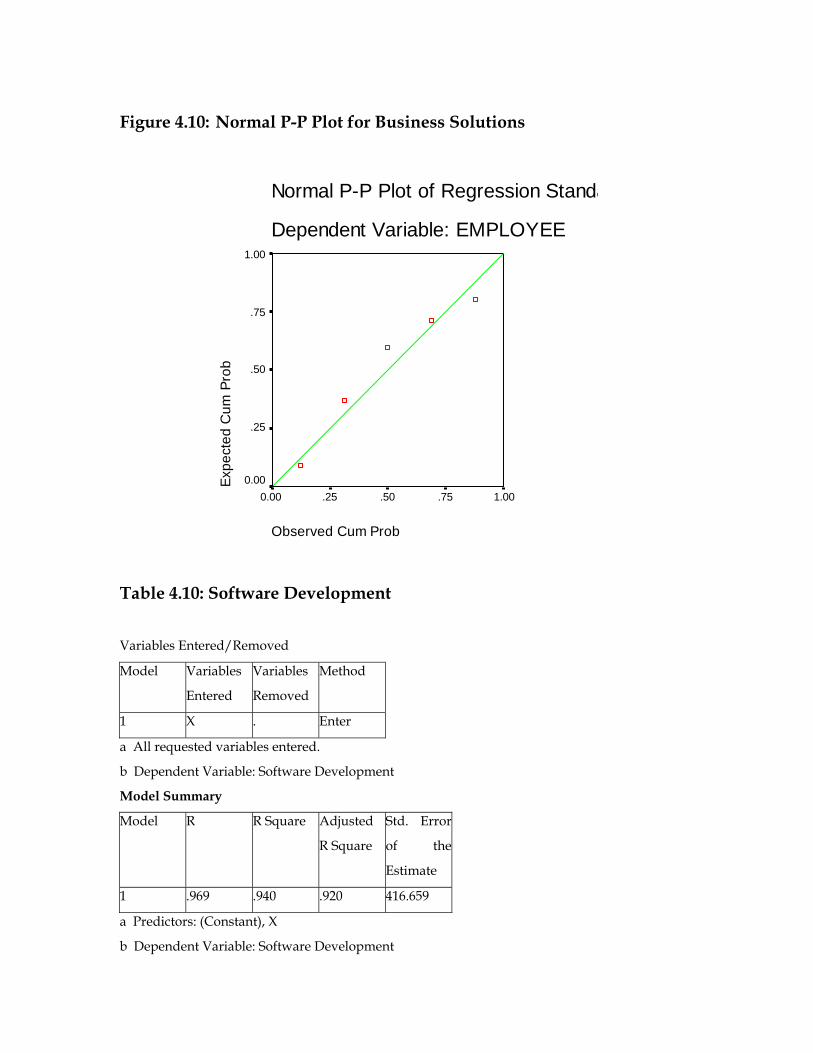
Figure 4.10: Normal P-P Plot for Business Solutions
Normal P-P Plot of Regression Standa
Dependent Variable: EMPLOYEE
Observed Cum Prob
1.00.75.50.250.00
Expe
cted
Cum
Pro
b
1.00
.75
.50
.25
0.00
Table 4.10: Software Development
Variables Entered/Removed
Model Variables
Entered
Variables
Removed
Method
1 X . Enter
a All requested variables entered.
b Dependent Variable: Software Development
Model Summary
Model R R Square Adjusted
R Square
Std. Error
of the
Estimate
1 .969 .940 .920 416.659
a Predictors: (Constant), X
b Dependent Variable: Software Development
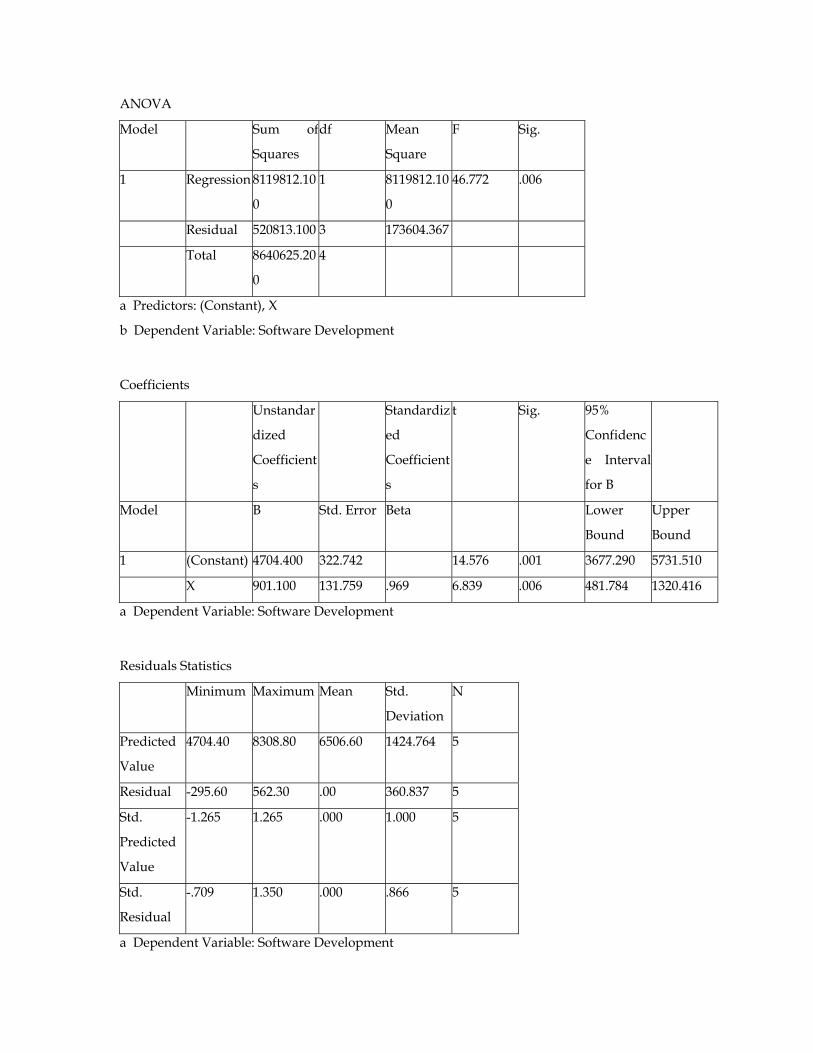
ANOVA
Model Sum of
Squares
df Mean
Square
F Sig.
1 Regression 8119812.10
0
1 8119812.10
0
46.772 .006
Residual 520813.100 3 173604.367
Total 8640625.20
0
4
a Predictors: (Constant), X
b Dependent Variable: Software Development
Coefficients
Unstandar
dized
Coefficient
s
Standardiz
ed
Coefficient
s
t Sig. 95%
Confidenc
e Interval
for B
Model B Std. Error Beta Lower
Bound
Upper
Bound
1 (Constant) 4704.400 322.742 14.576 .001 3677.290 5731.510
X 901.100 131.759 .969 6.839 .006 481.784 1320.416
a Dependent Variable: Software Development
Residuals Statistics
Minimum Maximum Mean Std.
Deviation
N
Predicted
Value
4704.40 8308.80 6506.60 1424.764 5
Residual -295.60 562.30 .00 360.837 5
Std.
Predicted
Value
-1.265 1.265 .000 1.000 5
Std.
Residual
-.709 1.350 .000 .866 5
a Dependent Variable: Software Development
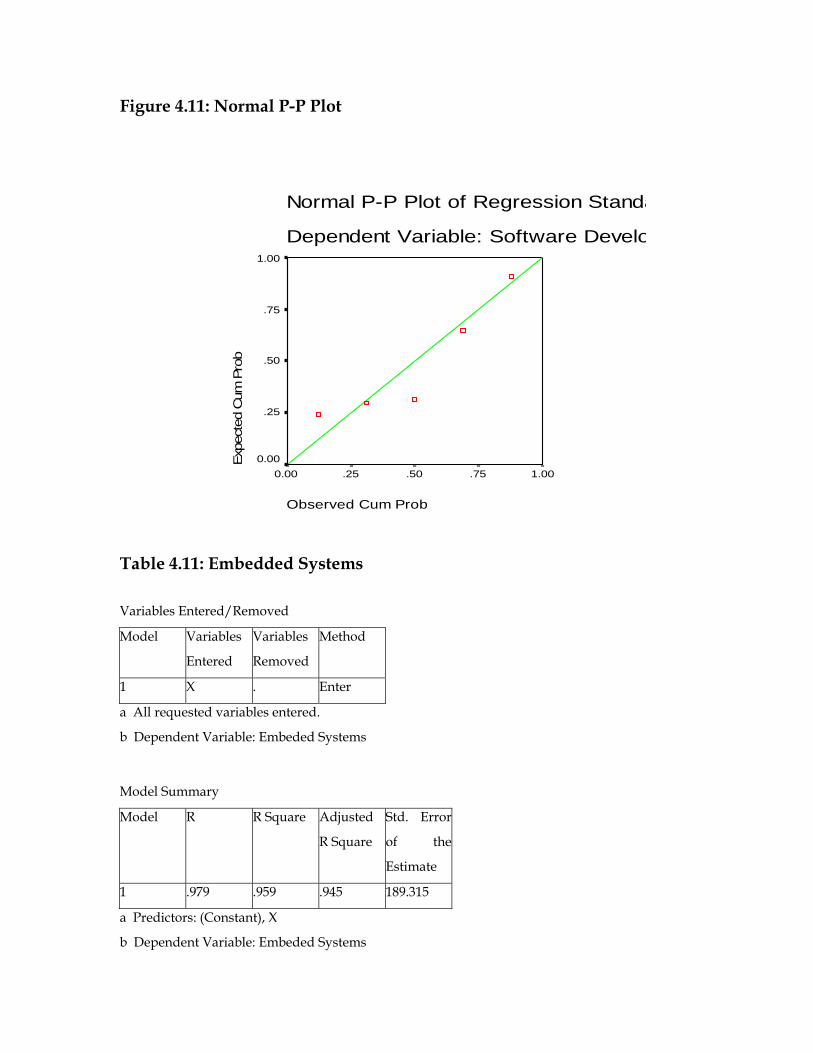
Figure 4.11: Normal P-P Plot
Normal P-P Plot of Regression Standa
Dependent Variable: Software Develo
Observed Cum Prob
1.00.75.50.250.00
Expe
cted
Cum
Pro
b1.00
.75
.50
.25
0.00
Table 4.11: Embedded Systems
Variables Entered/Removed
Model Variables
Entered
Variables
Removed
Method
1 X . Enter
a All requested variables entered.
b Dependent Variable: Embeded Systems
Model Summary
Model R R Square Adjusted
R Square
Std. Error
of the
Estimate
1 .979 .959 .945 189.315
a Predictors: (Constant), X
b Dependent Variable: Embeded Systems
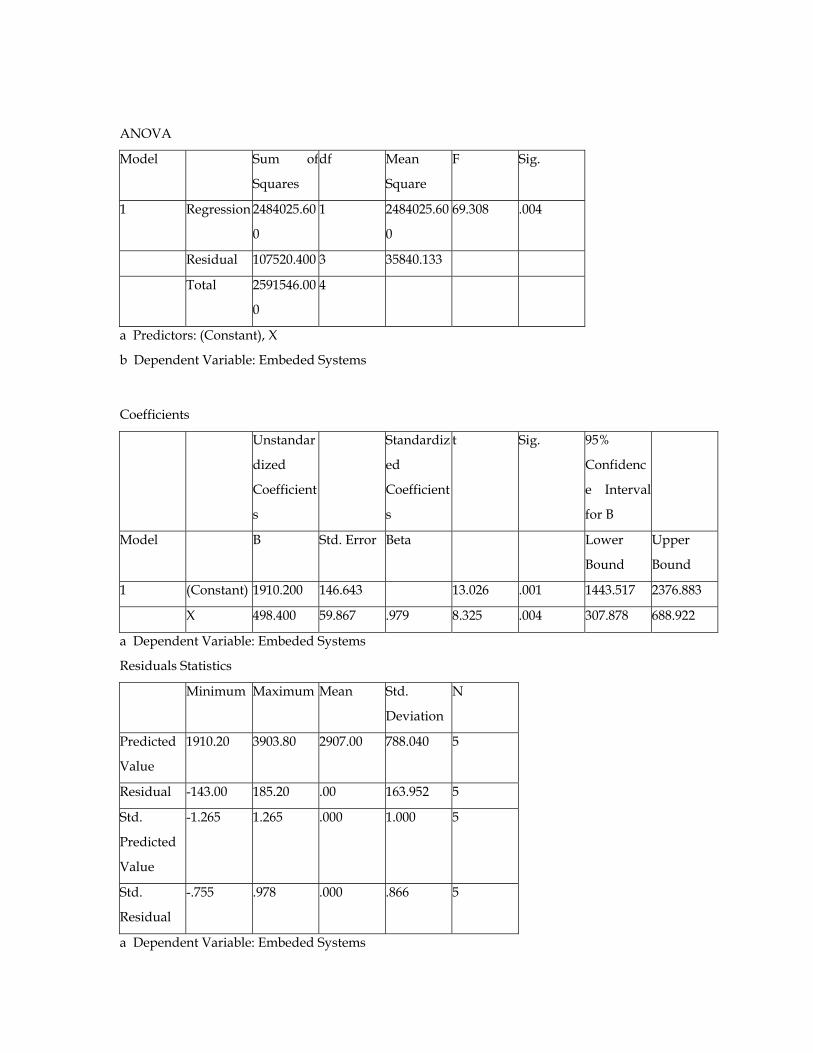
ANOVA
Model Sum of
Squares
df Mean
Square
F Sig.
1 Regression 2484025.60
0
1 2484025.60
0
69.308 .004
Residual 107520.400 3 35840.133
Total 2591546.00
0
4
a Predictors: (Constant), X
b Dependent Variable: Embeded Systems
Coefficients
Unstandar
dized
Coefficient
s
Standardiz
ed
Coefficient
s
t Sig. 95%
Confidenc
e Interval
for B
Model B Std. Error Beta Lower
Bound
Upper
Bound
1 (Constant) 1910.200 146.643 13.026 .001 1443.517 2376.883
X 498.400 59.867 .979 8.325 .004 307.878 688.922
a Dependent Variable: Embeded Systems
Residuals Statistics
Minimum Maximum Mean Std.
Deviation
N
Predicted
Value
1910.20 3903.80 2907.00 788.040 5
Residual -143.00 185.20 .00 163.952 5
Std.
Predicted
Value
-1.265 1.265 .000 1.000 5
Std.
Residual
-.755 .978 .000 .866 5
a Dependent Variable: Embeded Systems
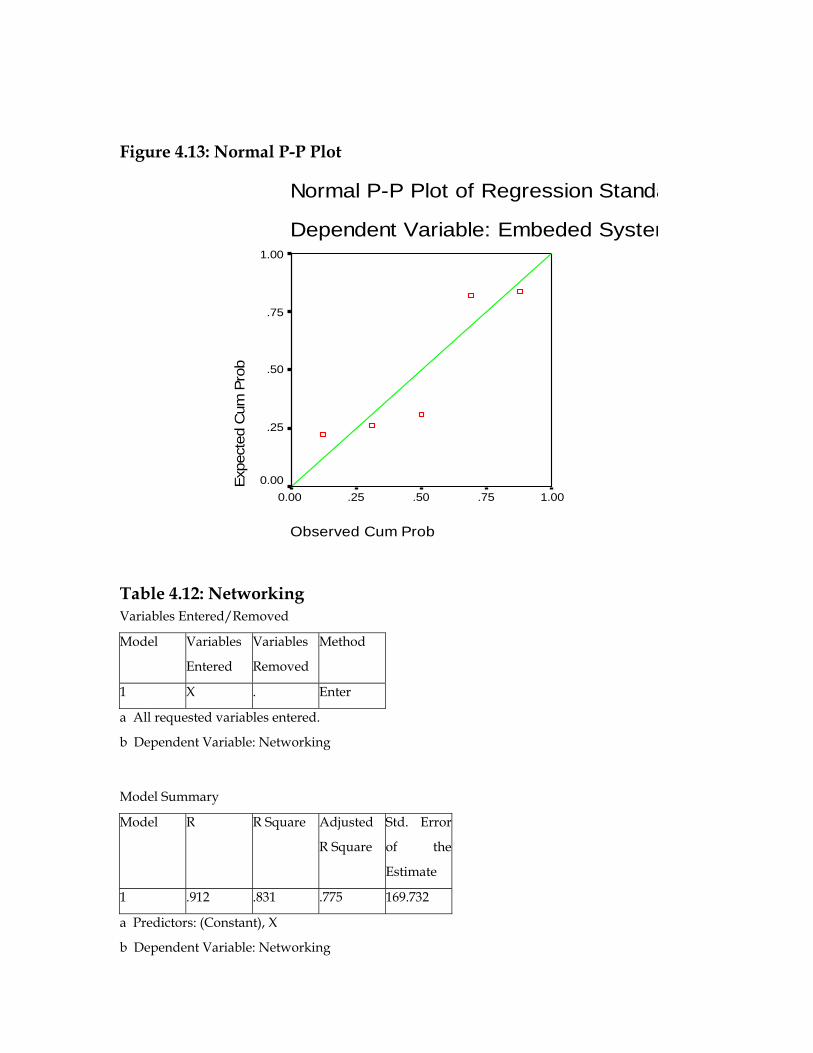
Figure 4.13: Normal P-P Plot
Normal P-P Plot of Regression Standa
Dependent Variable: Embeded System
Observed Cum Prob
1.00.75.50.250.00
Expe
cted
Cum
Pro
b1.00
.75
.50
.25
0.00
Table 4.12: Networking Variables Entered/Removed
Model Variables
Entered
Variables
Removed
Method
1 X . Enter
a All requested variables entered.
b Dependent Variable: Networking
Model Summary
Model R R Square Adjusted
R Square
Std. Error
of the
Estimate
1 .912 .831 .775 169.732
a Predictors: (Constant), X
b Dependent Variable: Networking
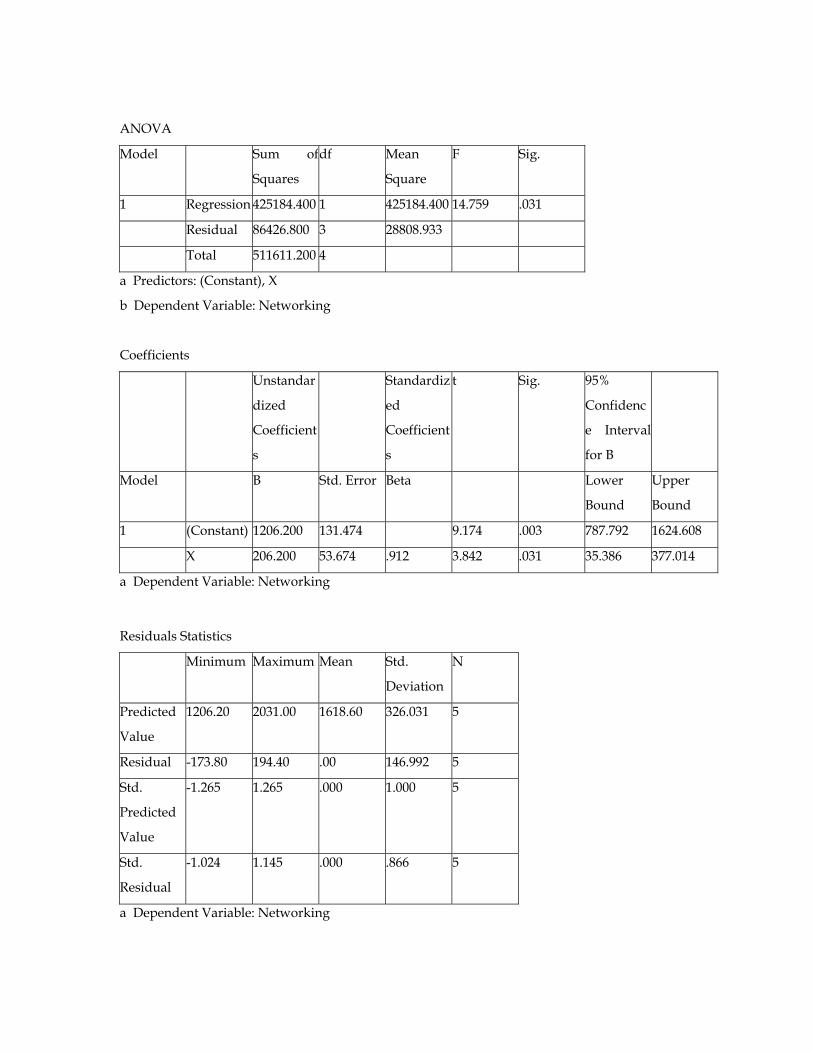
ANOVA
Model Sum of
Squares
df Mean
Square
F Sig.
1 Regression 425184.400 1 425184.400 14.759 .031
Residual 86426.800 3 28808.933
Total 511611.200 4
a Predictors: (Constant), X
b Dependent Variable: Networking
Coefficients
Unstandar
dized
Coefficient
s
Standardiz
ed
Coefficient
s
t Sig. 95%
Confidenc
e Interval
for B
Model B Std. Error Beta Lower
Bound
Upper
Bound
1 (Constant) 1206.200 131.474 9.174 .003 787.792 1624.608
X 206.200 53.674 .912 3.842 .031 35.386 377.014
a Dependent Variable: Networking
Residuals Statistics
Minimum Maximum Mean Std.
Deviation
N
Predicted
Value
1206.20 2031.00 1618.60 326.031 5
Residual -173.80 194.40 .00 146.992 5
Std.
Predicted
Value
-1.265 1.265 .000 1.000 5
Std.
Residual
-1.024 1.145 .000 .866 5
a Dependent Variable: Networking
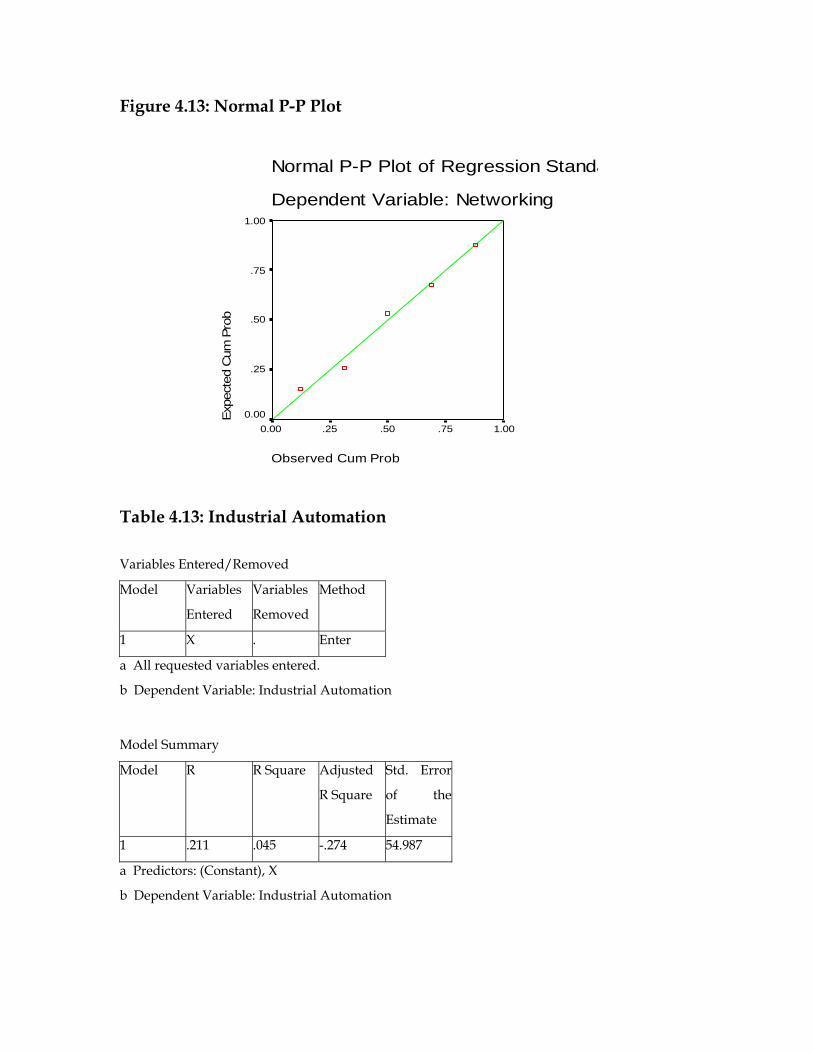
Figure 4.13: Normal P-P Plot
Normal P-P Plot of Regression Standa
Dependent Variable: Networking
Observed Cum Prob
1.00.75.50.250.00
Expe
cted
Cum
Pro
b1.00
.75
.50
.25
0.00
Table 4.13: Industrial Automation
Variables Entered/Removed
Model Variables
Entered
Variables
Removed
Method
1 X . Enter
a All requested variables entered.
b Dependent Variable: Industrial Automation
Model Summary
Model R R Square Adjusted
R Square
Std. Error
of the
Estimate
1 .211 .045 -.274 54.987
a Predictors: (Constant), X
b Dependent Variable: Industrial Automation
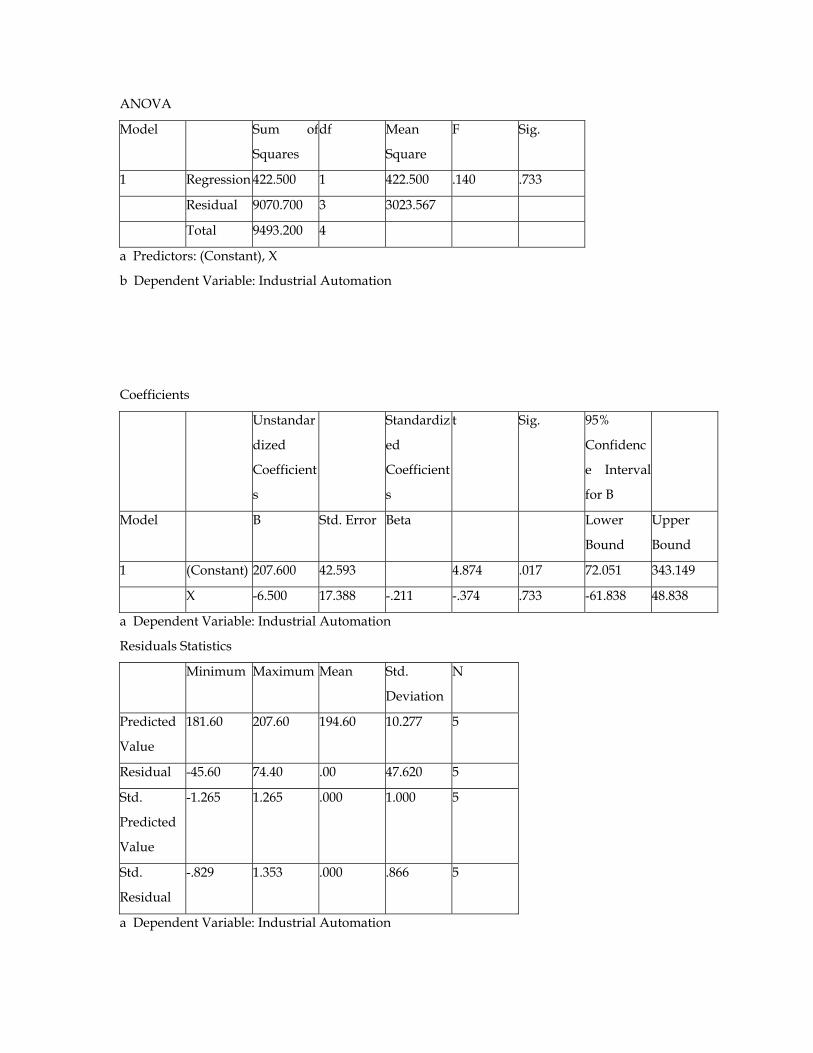
ANOVA
Model Sum of
Squares
df Mean
Square
F Sig.
1 Regression 422.500 1 422.500 .140 .733
Residual 9070.700 3 3023.567
Total 9493.200 4
a Predictors: (Constant), X
b Dependent Variable: Industrial Automation
Coefficients
Unstandar
dized
Coefficient
s
Standardiz
ed
Coefficient
s
t Sig. 95%
Confidenc
e Interval
for B
Model B Std. Error Beta Lower
Bound
Upper
Bound
1 (Constant) 207.600 42.593 4.874 .017 72.051 343.149
X -6.500 17.388 -.211 -.374 .733 -61.838 48.838
a Dependent Variable: Industrial Automation
Residuals Statistics
Minimum Maximum Mean Std.
Deviation
N
Predicted
Value
181.60 207.60 194.60 10.277 5
Residual -45.60 74.40 .00 47.620 5
Std.
Predicted
Value
-1.265 1.265 .000 1.000 5
Std.
Residual
-.829 1.353 .000 .866 5
a Dependent Variable: Industrial Automation
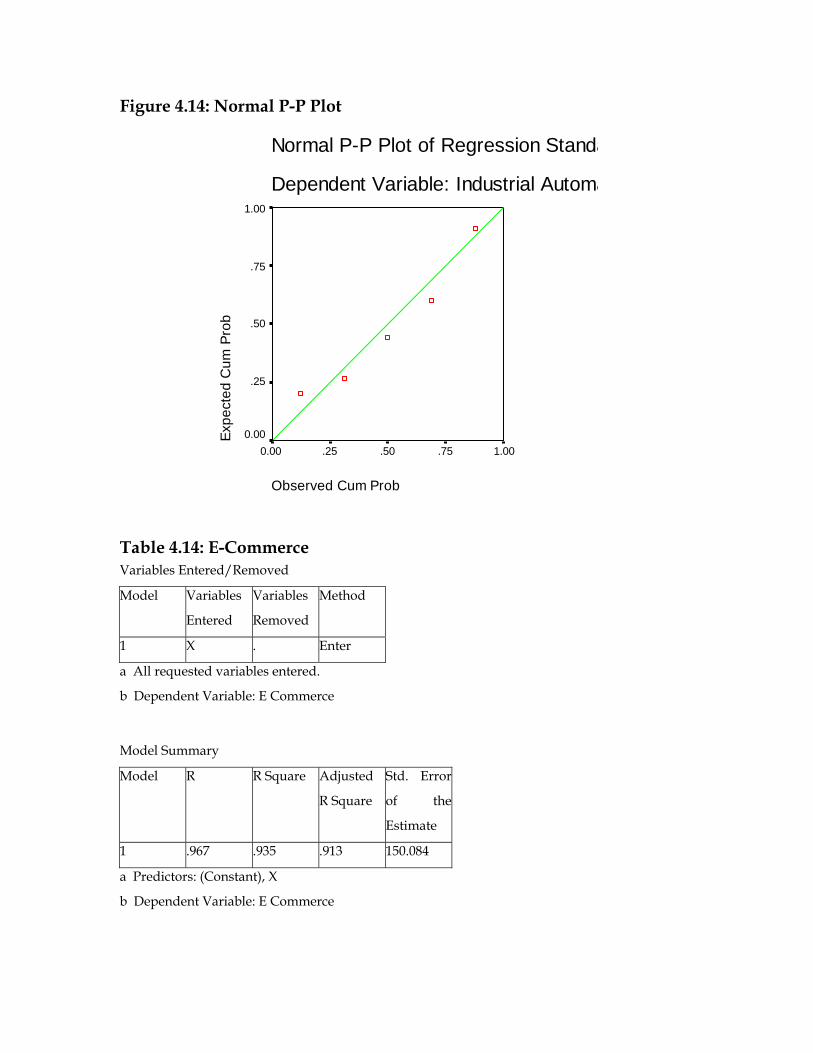
Figure 4.14: Normal P-P Plot
Normal P-P Plot of Regression Standa
Dependent Variable: Industrial Automa
Observed Cum Prob
1.00.75.50.250.00
Expe
cted
Cum
Pro
b1.00
.75
.50
.25
0.00
Table 4.14: E-Commerce Variables Entered/Removed
Model Variables
Entered
Variables
Removed
Method
1 X . Enter
a All requested variables entered.
b Dependent Variable: E Commerce
Model Summary
Model R R Square Adjusted
R Square
Std. Error
of the
Estimate
1 .967 .935 .913 150.084
a Predictors: (Constant), X
b Dependent Variable: E Commerce
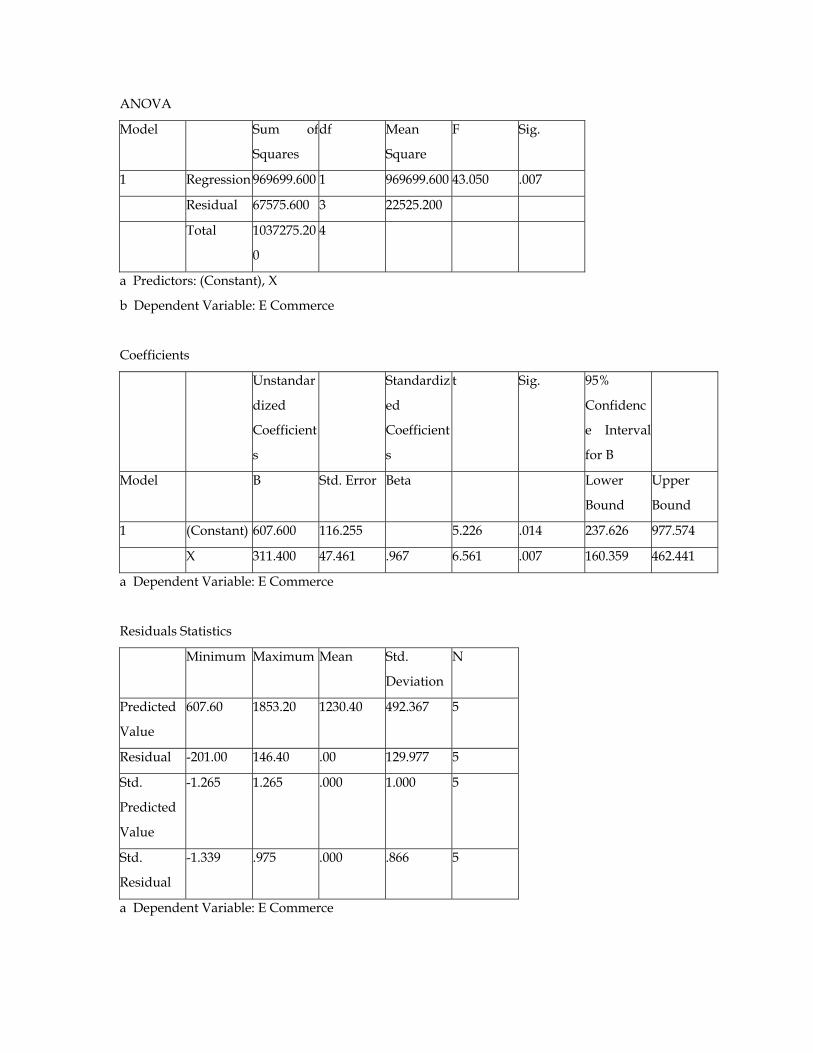
ANOVA
Model Sum of
Squares
df Mean
Square
F Sig.
1 Regression 969699.600 1 969699.600 43.050 .007
Residual 67575.600 3 22525.200
Total 1037275.20
0
4
a Predictors: (Constant), X
b Dependent Variable: E Commerce
Coefficients
Unstandar
dized
Coefficient
s
Standardiz
ed
Coefficient
s
t Sig. 95%
Confidenc
e Interval
for B
Model B Std. Error Beta Lower
Bound
Upper
Bound
1 (Constant) 607.600 116.255 5.226 .014 237.626 977.574
X 311.400 47.461 .967 6.561 .007 160.359 462.441
a Dependent Variable: E Commerce
Residuals Statistics
Minimum Maximum Mean Std.
Deviation
N
Predicted
Value
607.60 1853.20 1230.40 492.367 5
Residual -201.00 146.40 .00 129.977 5
Std.
Predicted
Value
-1.265 1.265 .000 1.000 5
Std.
Residual
-1.339 .975 .000 .866 5
a Dependent Variable: E Commerce
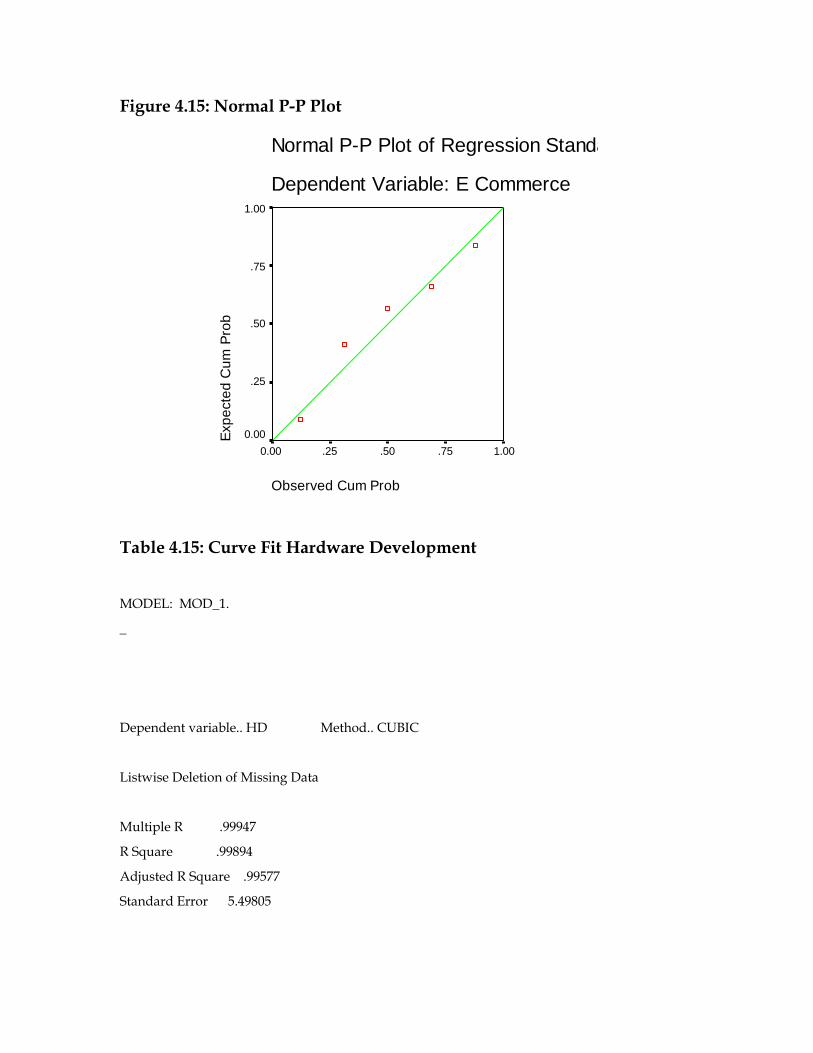
Figure 4.15: Normal P-P Plot
Normal P-P Plot of Regression Standa
Dependent Variable: E Commerce
Observed Cum Prob
1.00.75.50.250.00
Expe
cted
Cum
Pro
b1.00
.75
.50
.25
0.00
Table 4.15: Curve Fit Hardware Development MODEL: MOD_1.
_
Dependent variable.. HD Method.. CUBIC
Listwise Deletion of Missing Data
Multiple R .99947
R Square .99894
Adjusted R Square .99577
Standard Error 5.49805
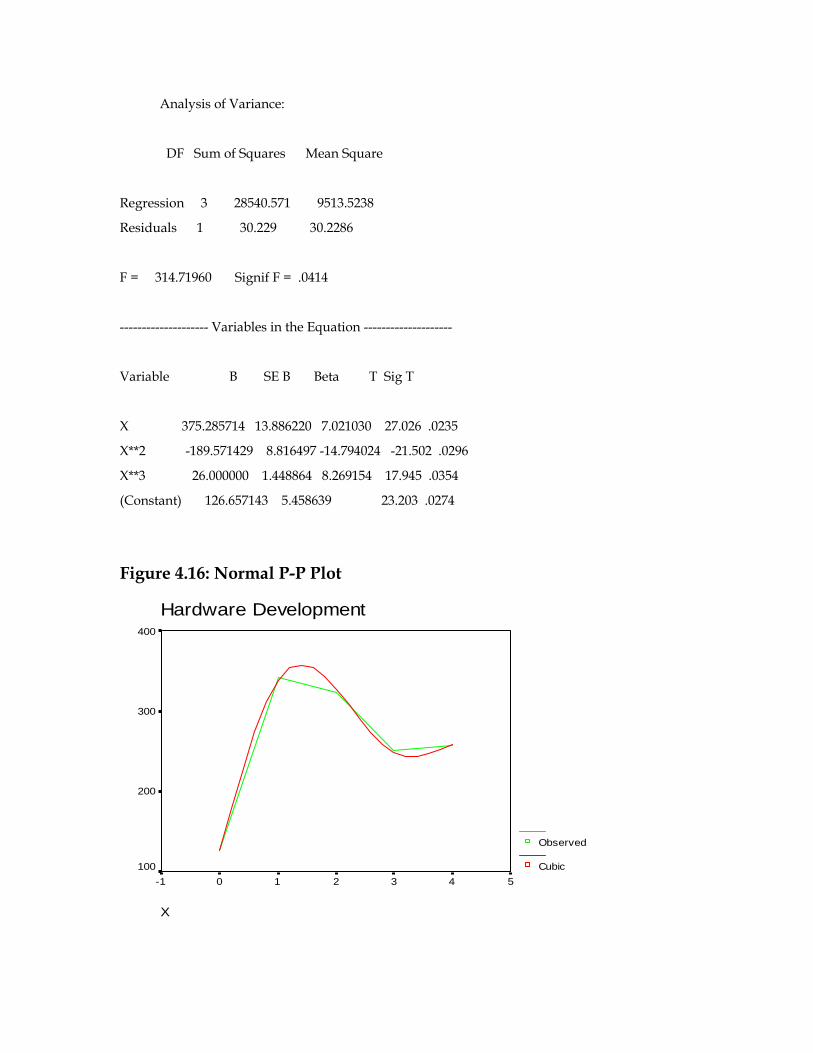
Analysis of Variance:
DF Sum of Squares Mean Square
Regression 3 28540.571 9513.5238
Residuals 1 30.229 30.2286
F = 314.71960 Signif F = .0414
-------------------- Variables in the Equation --------------------
Variable B SE B Beta T Sig T
X 375.285714 13.886220 7.021030 27.026 .0235
X**2 -189.571429 8.816497 -14.794024 -21.502 .0296
X**3 26.000000 1.448864 8.269154 17.945 .0354
(Constant) 126.657143 5.458639 23.203 .0274
Figure 4.16: Normal P-P Plot
Hardware Development
X
543210-1
400
300
200
100
Observed
Cubic
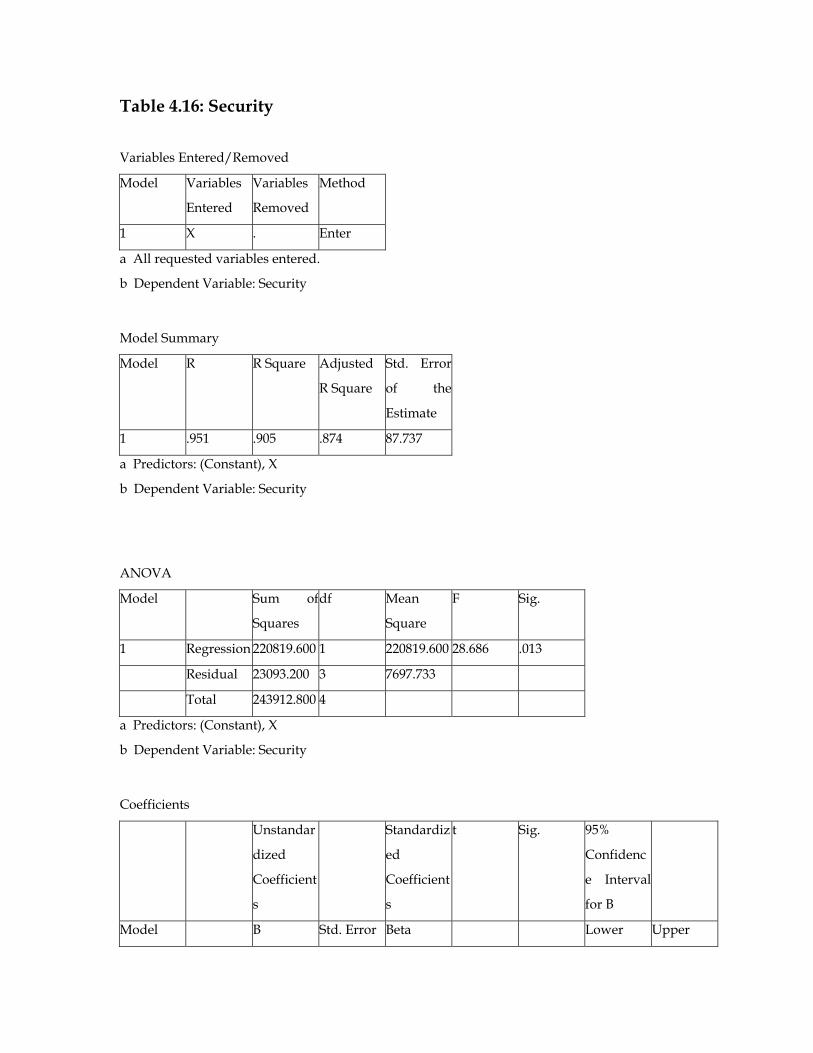
Table 4.16: Security Variables Entered/Removed
Model Variables
Entered
Variables
Removed
Method
1 X . Enter
a All requested variables entered.
b Dependent Variable: Security
Model Summary
Model R R Square Adjusted
R Square
Std. Error
of the
Estimate
1 .951 .905 .874 87.737
a Predictors: (Constant), X
b Dependent Variable: Security
ANOVA
Model Sum of
Squares
df Mean
Square
F Sig.
1 Regression 220819.600 1 220819.600 28.686 .013
Residual 23093.200 3 7697.733
Total 243912.800 4
a Predictors: (Constant), X
b Dependent Variable: Security
Coefficients
Unstandar
dized
Coefficient
s
Standardiz
ed
Coefficient
s
t Sig. 95%
Confidenc
e Interval
for B
Model B Std. Error Beta Lower Upper
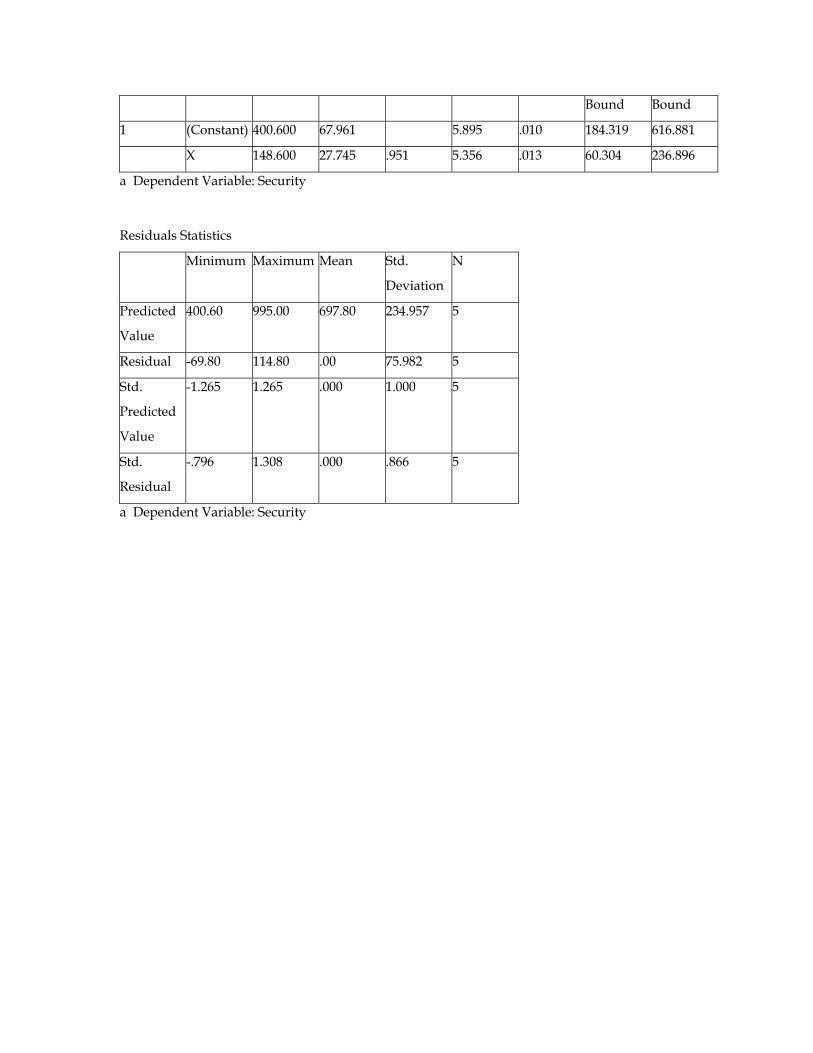
Bound Bound
1 (Constant) 400.600 67.961 5.895 .010 184.319 616.881
X 148.600 27.745 .951 5.356 .013 60.304 236.896
a Dependent Variable: Security
Residuals Statistics
Minimum Maximum Mean Std.
Deviation
N
Predicted
Value
400.60 995.00 697.80 234.957 5
Residual -69.80 114.80 .00 75.982 5
Std.
Predicted
Value
-1.265 1.265 .000 1.000 5
Std.
Residual
-.796 1.308 .000 .866 5
a Dependent Variable: Security
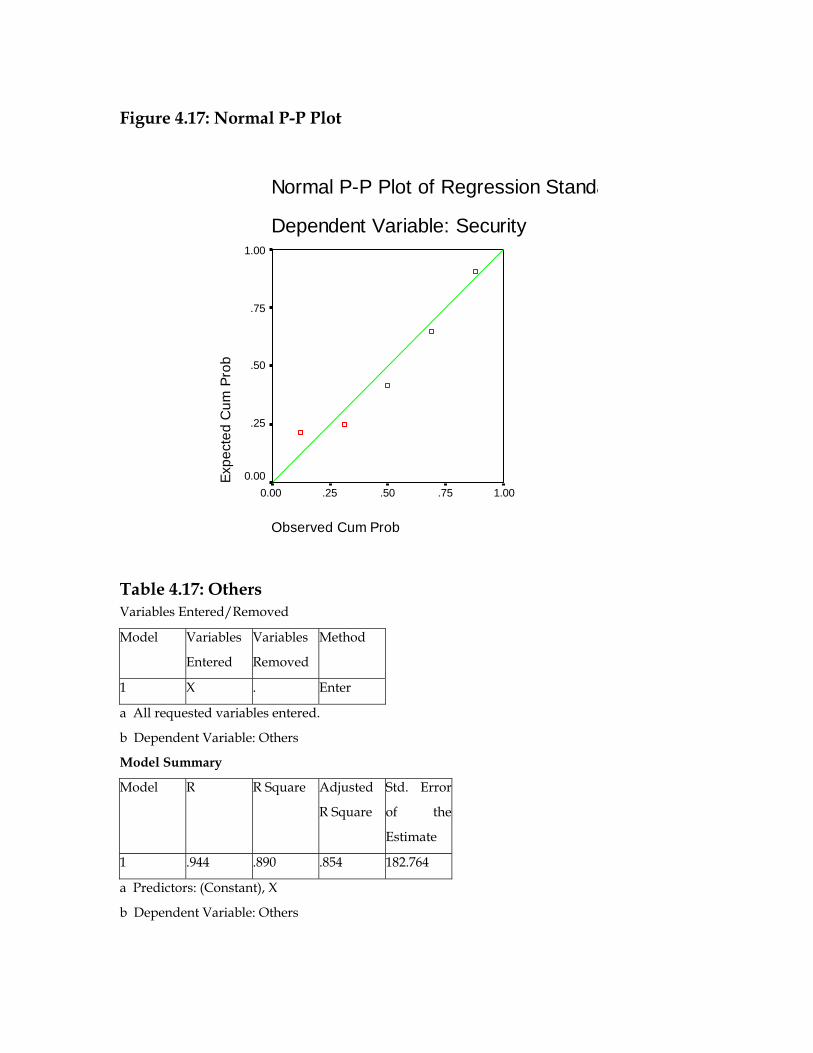
Figure 4.17: Normal P-P Plot
Normal P-P Plot of Regression Standa
Dependent Variable: Security
Observed Cum Prob
1.00.75.50.250.00
Expe
cted
Cum
Pro
b
1.00
.75
.50
.25
0.00
Table 4.17: Others Variables Entered/Removed
Model Variables
Entered
Variables
Removed
Method
1 X . Enter
a All requested variables entered.
b Dependent Variable: Others
Model Summary
Model R R Square Adjusted
R Square
Std. Error
of the
Estimate
1 .944 .890 .854 182.764
a Predictors: (Constant), X
b Dependent Variable: Others
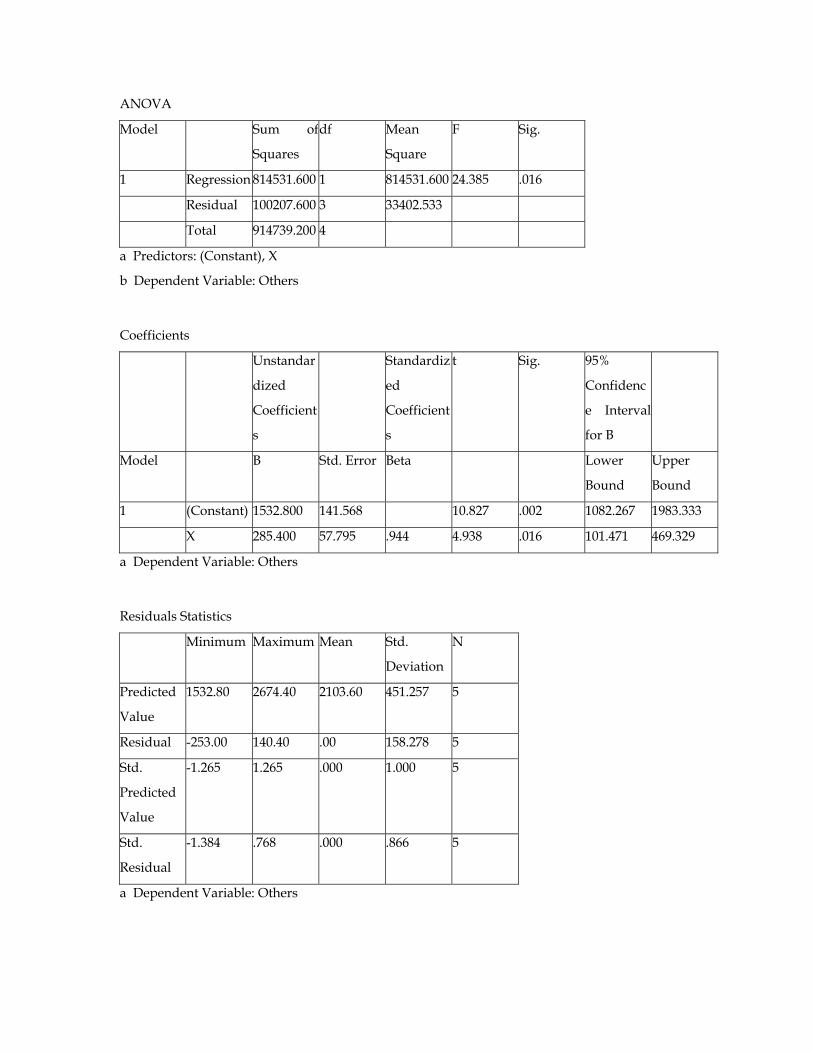
ANOVA
Model Sum of
Squares
df Mean
Square
F Sig.
1 Regression 814531.600 1 814531.600 24.385 .016
Residual 100207.600 3 33402.533
Total 914739.200 4
a Predictors: (Constant), X
b Dependent Variable: Others
Coefficients
Unstandar
dized
Coefficient
s
Standardiz
ed
Coefficient
s
t Sig. 95%
Confidenc
e Interval
for B
Model B Std. Error Beta Lower
Bound
Upper
Bound
1 (Constant) 1532.800 141.568 10.827 .002 1082.267 1983.333
X 285.400 57.795 .944 4.938 .016 101.471 469.329
a Dependent Variable: Others
Residuals Statistics
Minimum Maximum Mean Std.
Deviation
N
Predicted
Value
1532.80 2674.40 2103.60 451.257 5
Residual -253.00 140.40 .00 158.278 5
Std.
Predicted
Value
-1.265 1.265 .000 1.000 5
Std.
Residual
-1.384 .768 .000 .866 5
a Dependent Variable: Others
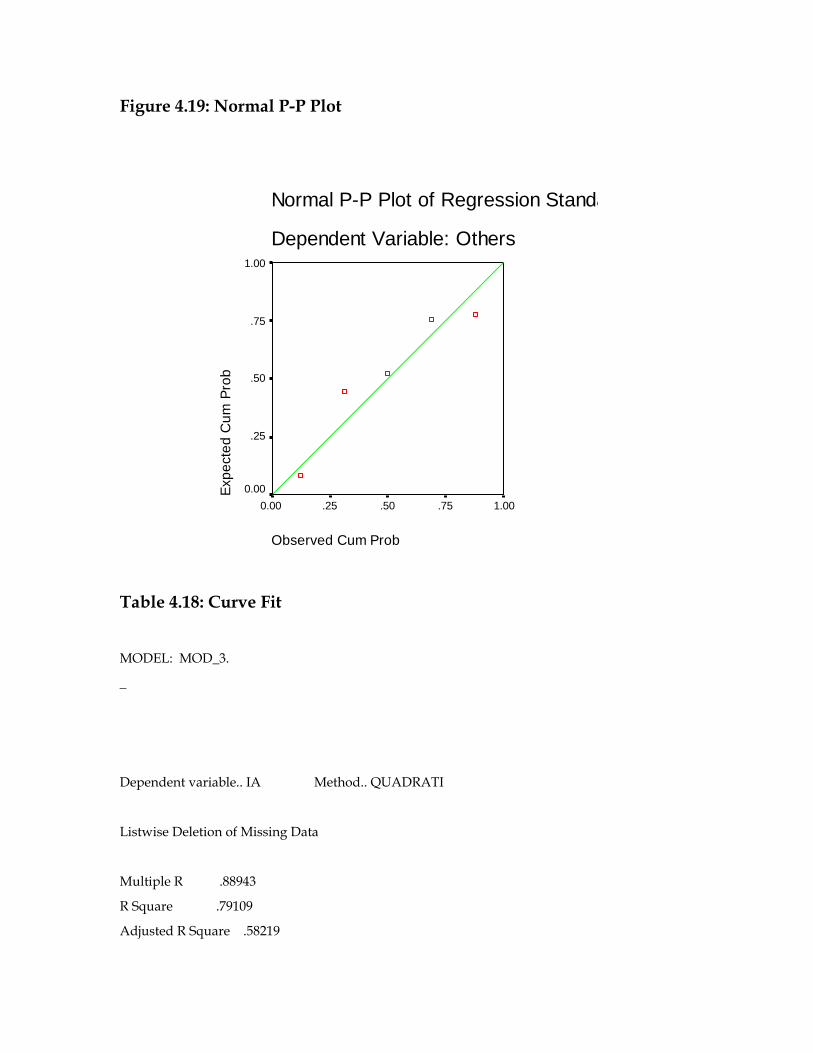
Figure 4.19: Normal P-P Plot
Normal P-P Plot of Regression Standa
Dependent Variable: Others
Observed Cum Prob
1.00.75.50.250.00
Expe
cted
Cum
Pro
b
1.00
.75
.50
.25
0.00
Table 4.18: Curve Fit MODEL: MOD_3.
_
Dependent variable.. IA Method.. QUADRATI
Listwise Deletion of Missing Data
Multiple R .88943
R Square .79109
Adjusted R Square .58219
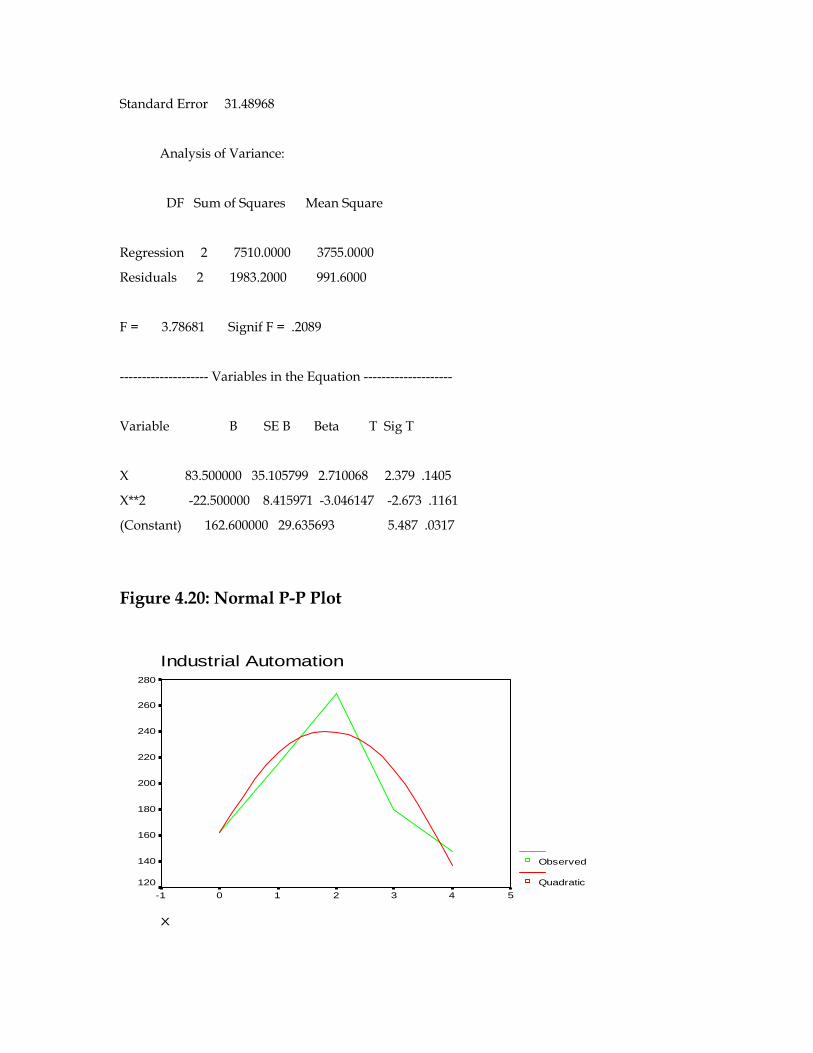
Standard Error 31.48968
Analysis of Variance:
DF Sum of Squares Mean Square
Regression 2 7510.0000 3755.0000
Residuals 2 1983.2000 991.6000
F = 3.78681 Signif F = .2089
-------------------- Variables in the Equation --------------------
Variable B SE B Beta T Sig T
X 83.500000 35.105799 2.710068 2.379 .1405
X**2 -22.500000 8.415971 -3.046147 -2.673 .1161
(Constant) 162.600000 29.635693 5.487 .0317
Figure 4.20: Normal P-P Plot
Industrial Automation
X
543210-1
280
260
240
220
200
180
160
140
120
Observed
Quadratic
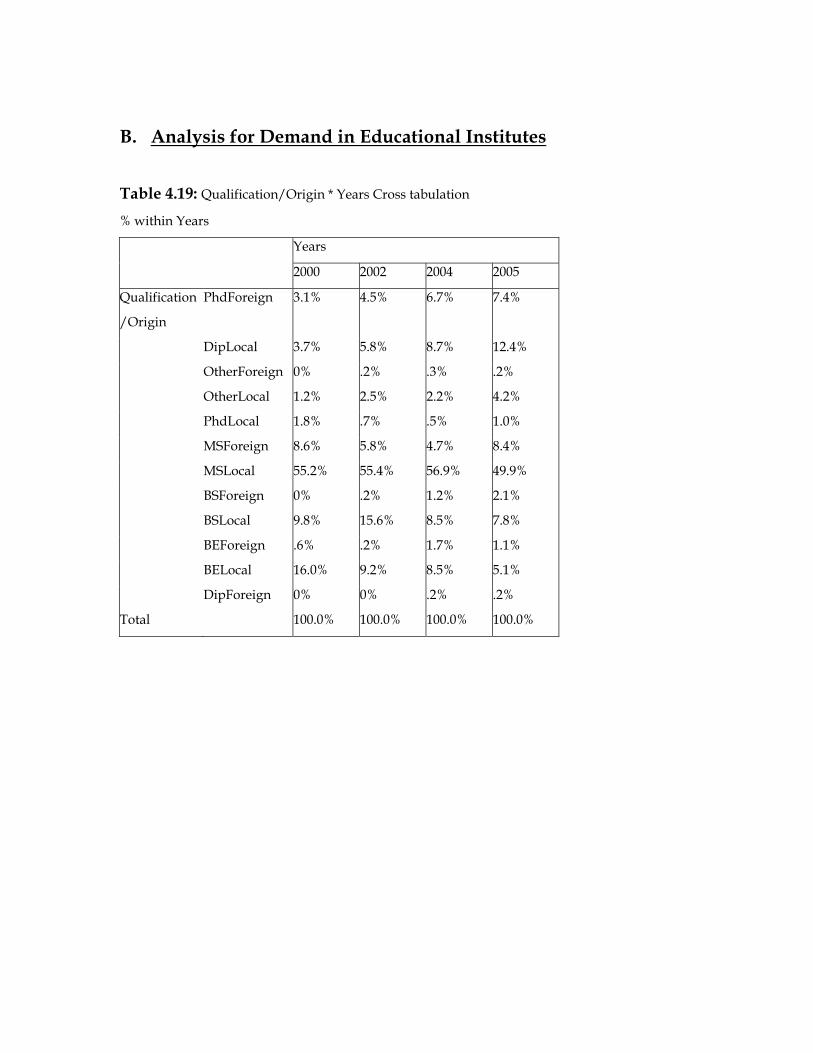
B. Analysis for Demand in Educational Institutes
Table 4.19: Qualification/Origin * Years Cross tabulation
% within Years
Years
2000 2002 2004 2005
Qualification
/Origin
PhdForeign 3.1% 4.5% 6.7% 7.4%
DipLocal 3.7% 5.8% 8.7% 12.4%
OtherForeign 0% .2% .3% .2%
OtherLocal 1.2% 2.5% 2.2% 4.2%
PhdLocal 1.8% .7% .5% 1.0%
MSForeign 8.6% 5.8% 4.7% 8.4%
MSLocal 55.2% 55.4% 56.9% 49.9%
BSForeign 0% .2% 1.2% 2.1%
BSLocal 9.8% 15.6% 8.5% 7.8%
BEForeign .6% .2% 1.7% 1.1%
BELocal 16.0% 9.2% 8.5% 5.1%
DipForeign 0% 0% .2% .2%
Total 100.0% 100.0% 100.0% 100.0%
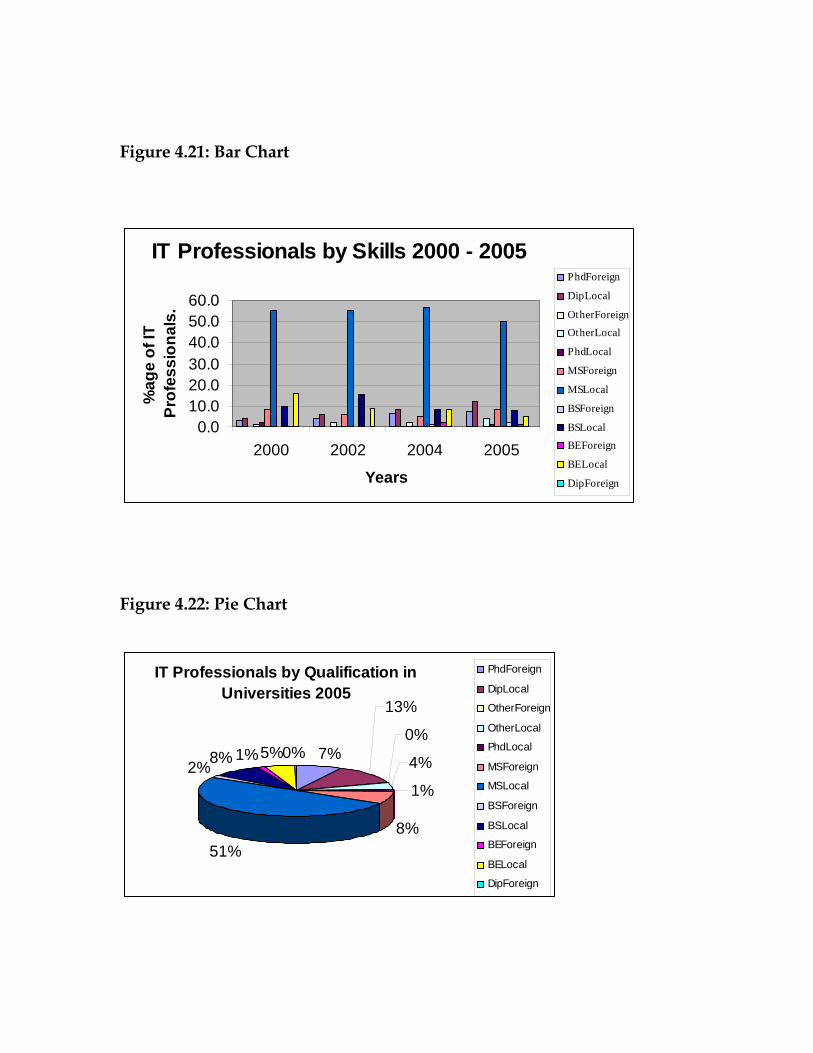
Figure 4.21: Bar Chart
IT Professionals by Skills 2000 - 2005
0.010.020.030.040.050.060.0
2000 2002 2004 2005
Years
%ag
e of
IT
Prof
essi
onal
s.
PhdForeign
DipLocal
OtherForeignOtherLocal
PhdLocal
MSForeign
MSLocal
BSForeign
BSLocalBEForeign
BELocal
DipForeign
Figure 4.22: Pie Chart
IT Professionals by Qualification in Universities 2005
7%
13%
0%
4%
1%
8%51%
2%8% 1%5%0%
PhdForeign
DipLocal
OtherForeign
OtherLocal
PhdLocal
MSForeign
MSLocal
BSForeign
BSLocal
BEForeign
BELocal
DipForeign
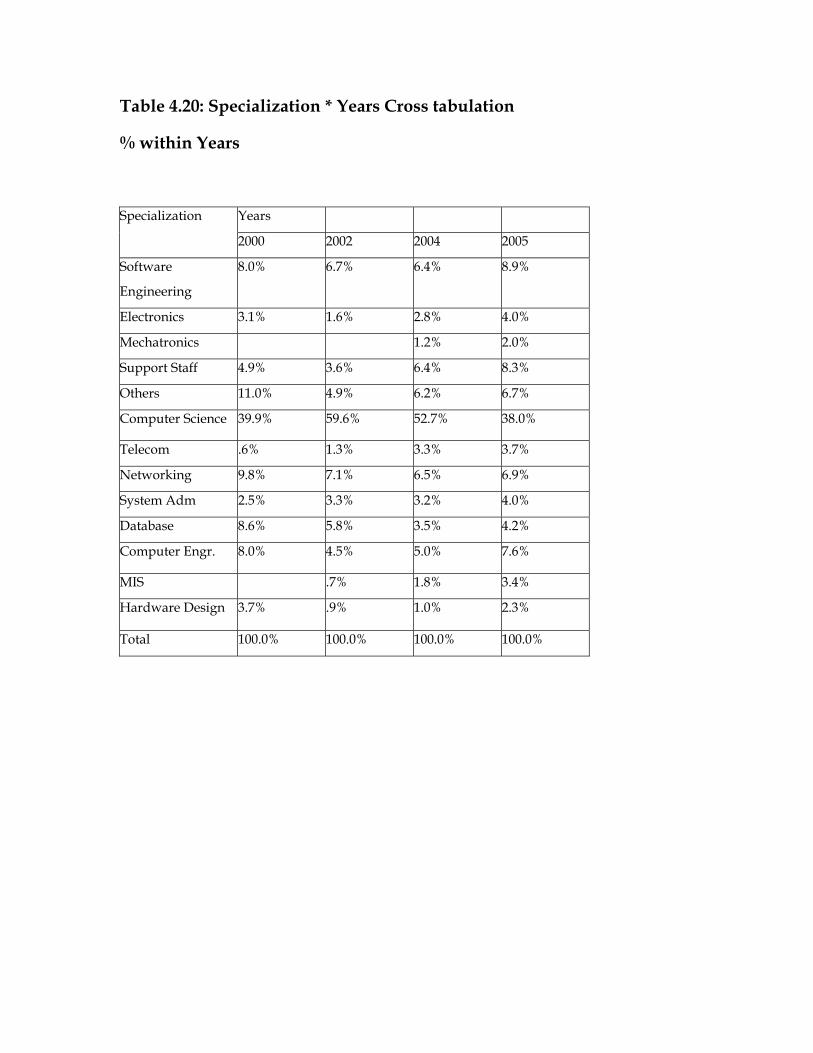
Table 4.20: Specialization * Years Cross tabulation
% within Years
Specialization Years
2000 2002 2004 2005
Software
Engineering
8.0% 6.7% 6.4% 8.9%
Electronics 3.1% 1.6% 2.8% 4.0%
Mechatronics 1.2% 2.0%
Support Staff 4.9% 3.6% 6.4% 8.3%
Others 11.0% 4.9% 6.2% 6.7%
Computer Science 39.9% 59.6% 52.7% 38.0%
Telecom .6% 1.3% 3.3% 3.7%
Networking 9.8% 7.1% 6.5% 6.9%
System Adm 2.5% 3.3% 3.2% 4.0%
Database 8.6% 5.8% 3.5% 4.2%
Computer Engr. 8.0% 4.5% 5.0% 7.6%
MIS .7% 1.8% 3.4%
Hardware Design 3.7% .9% 1.0% 2.3%
Total 100.0% 100.0% 100.0% 100.0%
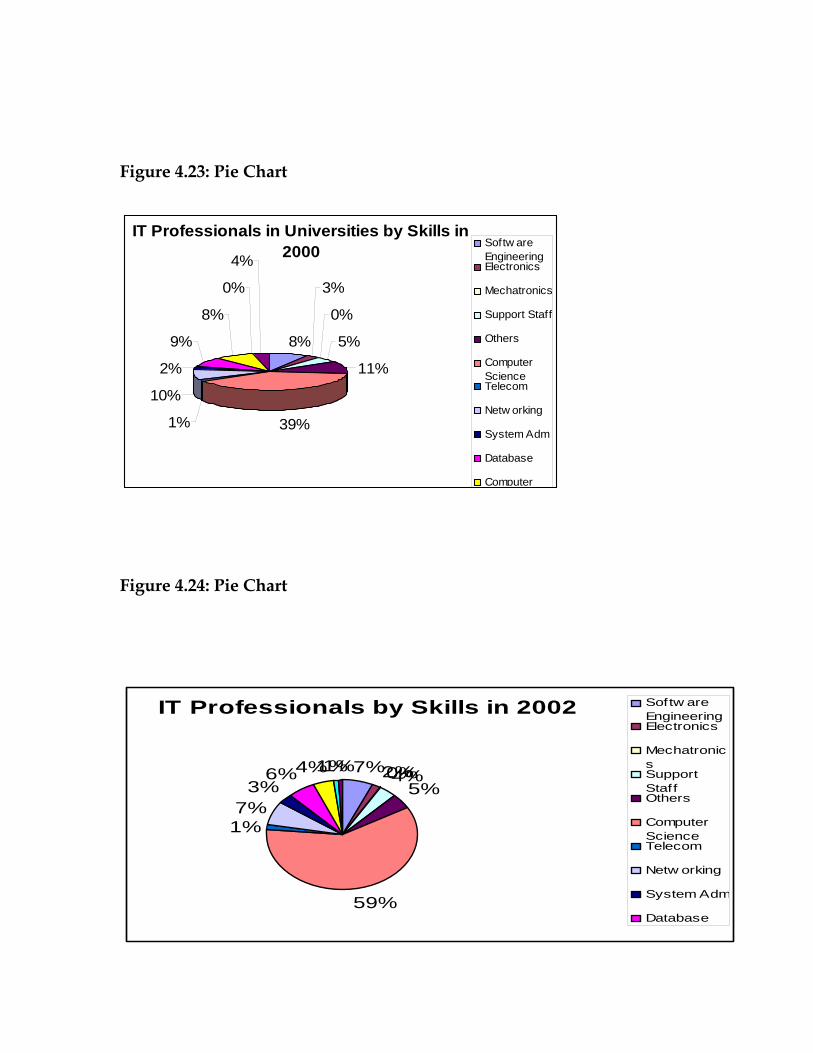
Figure 4.23: Pie Chart
IT Professionals in Universities by Skills in 2000
8%
3%
0%
5%
11%
39%1%
10%
2%
9%
8%
0%
4%Softw areEngineeringElectronics
Mechatronics
Support Staff
Others
ComputerScienceTelecom
Netw orking
System Adm
Database
Computer
Figure 4.24: Pie Chart
IT Professionals by Skills in 2002
7%2%0%4%5%
59%
1%7%
3%6%4%1%1%
Softw areEngineeringElectronics
MechatronicsSupportStaffOthers
ComputerScienceTelecom
Netw orking
System Adm
Database
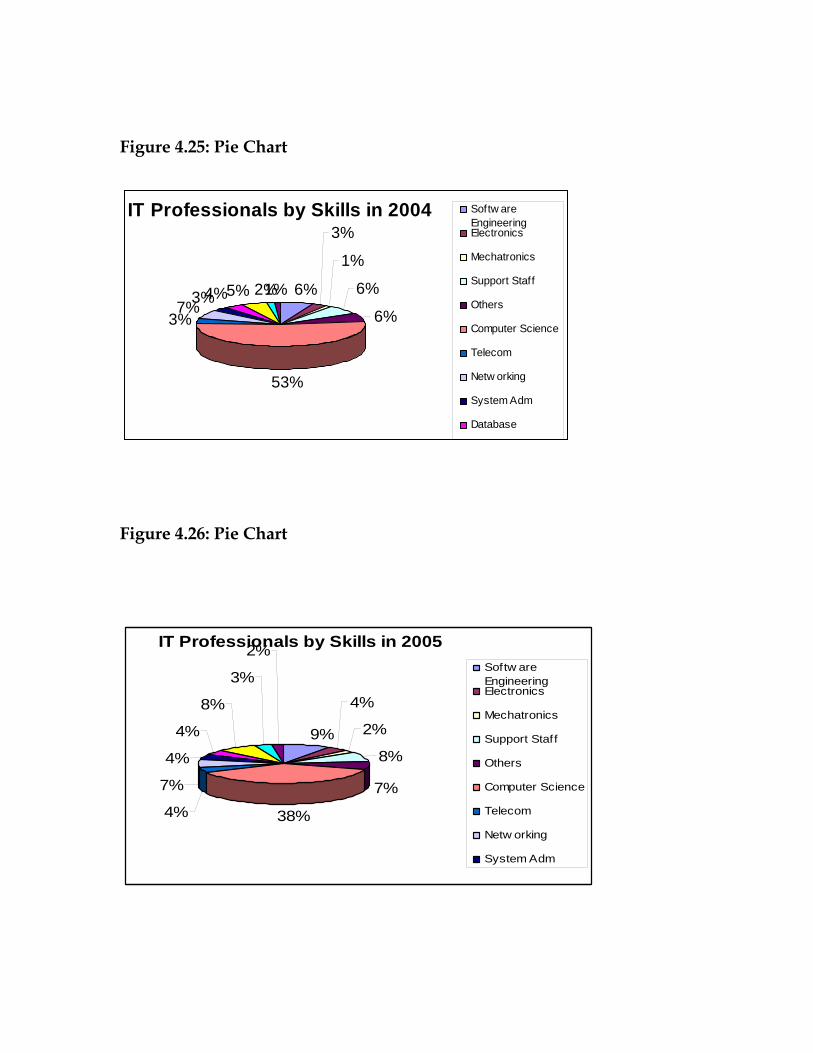
Figure 4.25: Pie Chart
IT Professionals by Skills in 2004
6%
3%
1%
6%
6%
53%
3%7%3%4%5% 2%1%
Softw areEngineeringElectronics
Mechatronics
Support Staff
Others
Computer Science
Telecom
Netw orking
System Adm
Database
Figure 4.26: Pie Chart
IT Professionals by Skills in 2005
9%
4%
2%
8%
7%
38%4%
7%
4%
4%
8%
3%
2%Softw areEngineeringElectronics
Mechatronics
Support Staff
Others
Computer Science
Telecom
Netw orking
System Adm
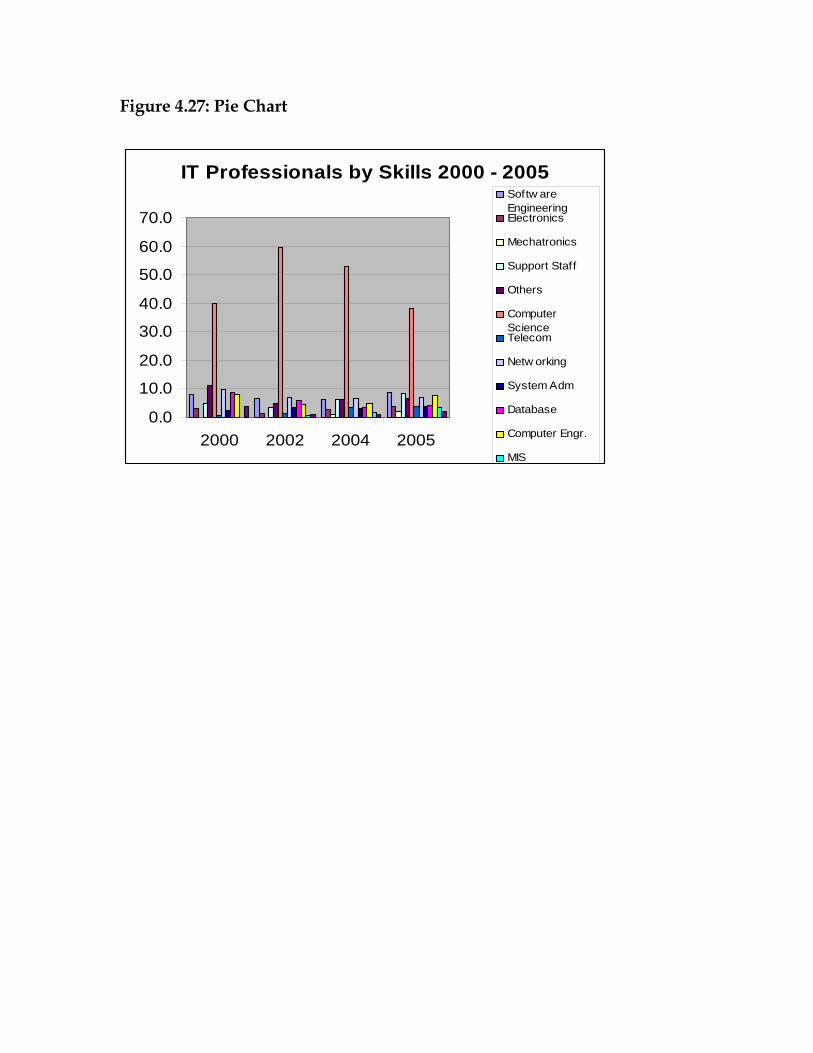
Figure 4.27: Pie Chart
IT Professionals by Skills 2000 - 2005
0.0
10.0
20.0
30.0
40.0
50.0
60.0
70.0
2000 2002 2004 2005
Softw areEngineeringElectronics
Mechatronics
Support Staff
Others
ComputerScienceTelecom
Netw orking
System Adm
Database
Computer Engr.
MIS
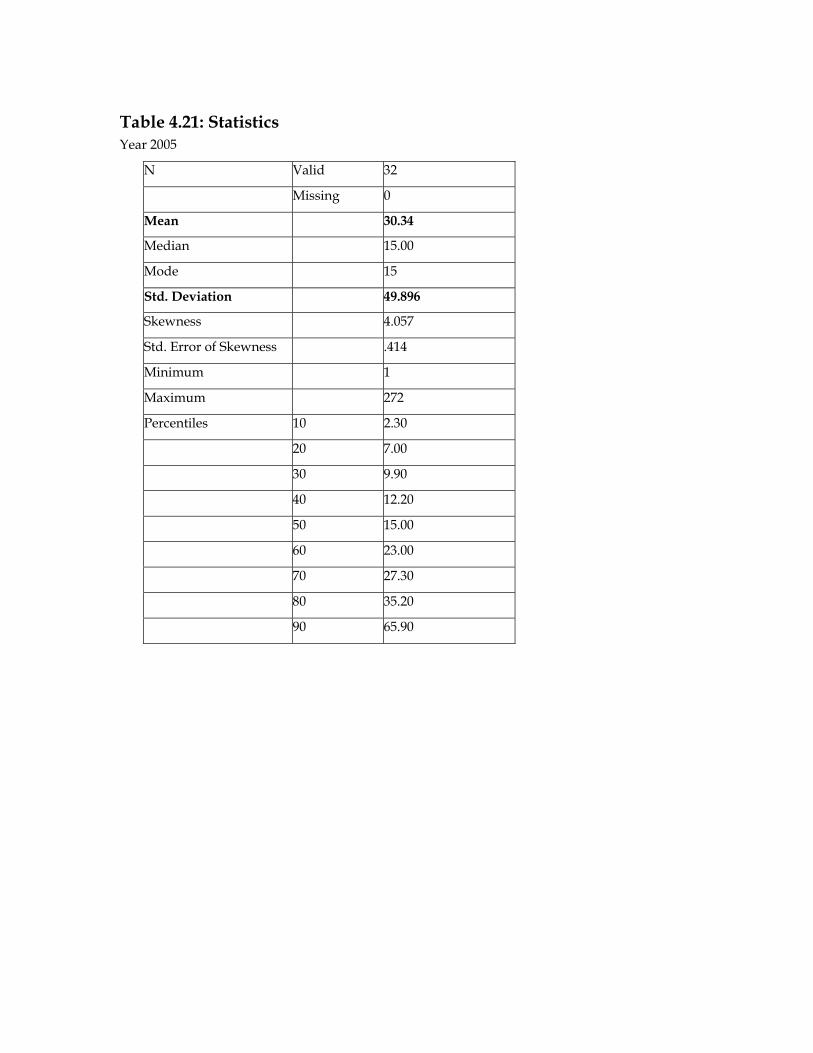
Table 4.21: Statistics Year 2005
N Valid 32
Missing 0
Mean 30.34
Median 15.00
Mode 15
Std. Deviation 49.896
Skewness 4.057
Std. Error of Skewness .414
Minimum 1
Maximum 272
Percentiles 10 2.30
20 7.00
30 9.90
40 12.20
50 15.00
60 23.00
70 27.30
80 35.20
90 65.90
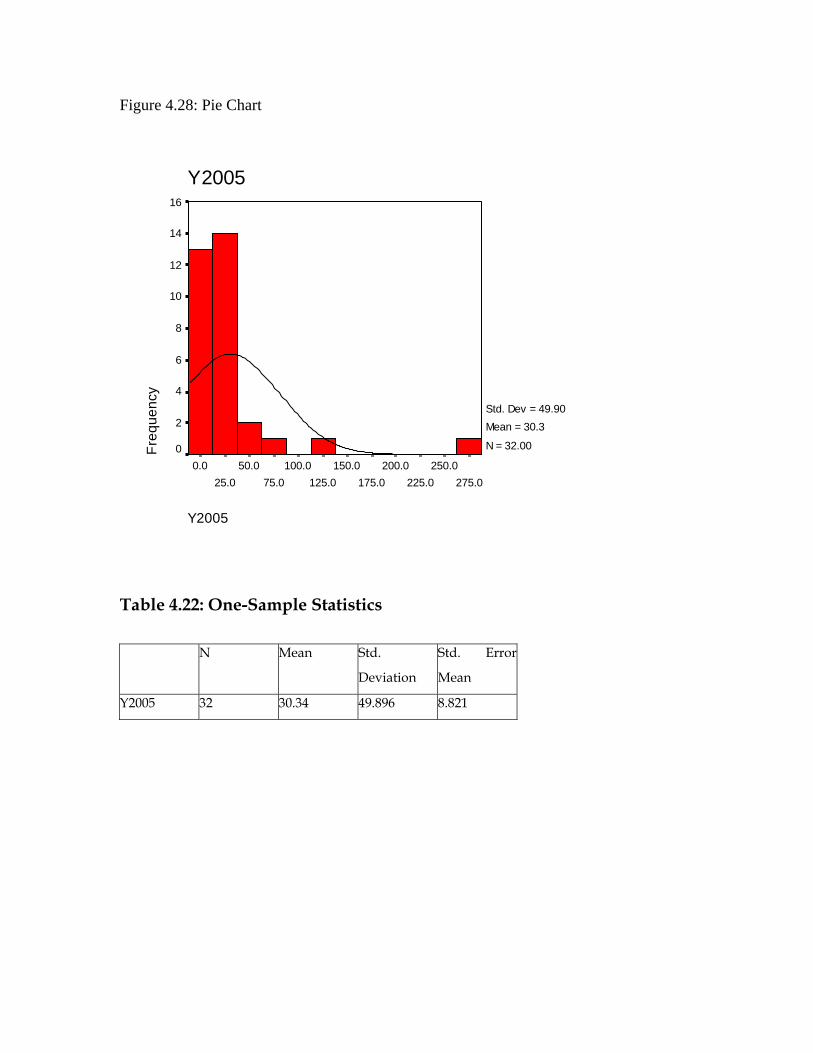
Figure 4.28: Pie Chart
Y2005
275.0250.0
225.0200.0
175.0150.0
125.0100.0
75.050.0
25.00.0
Y2005Fr
eque
ncy
16
14
12
10
8
6
4
2
0
Std. Dev = 49.90 Mean = 30.3
N = 32.00
Table 4.22: One-Sample Statistics
N Mean Std.
Deviation
Std. Error
Mean
Y2005 32 30.34 49.896 8.821
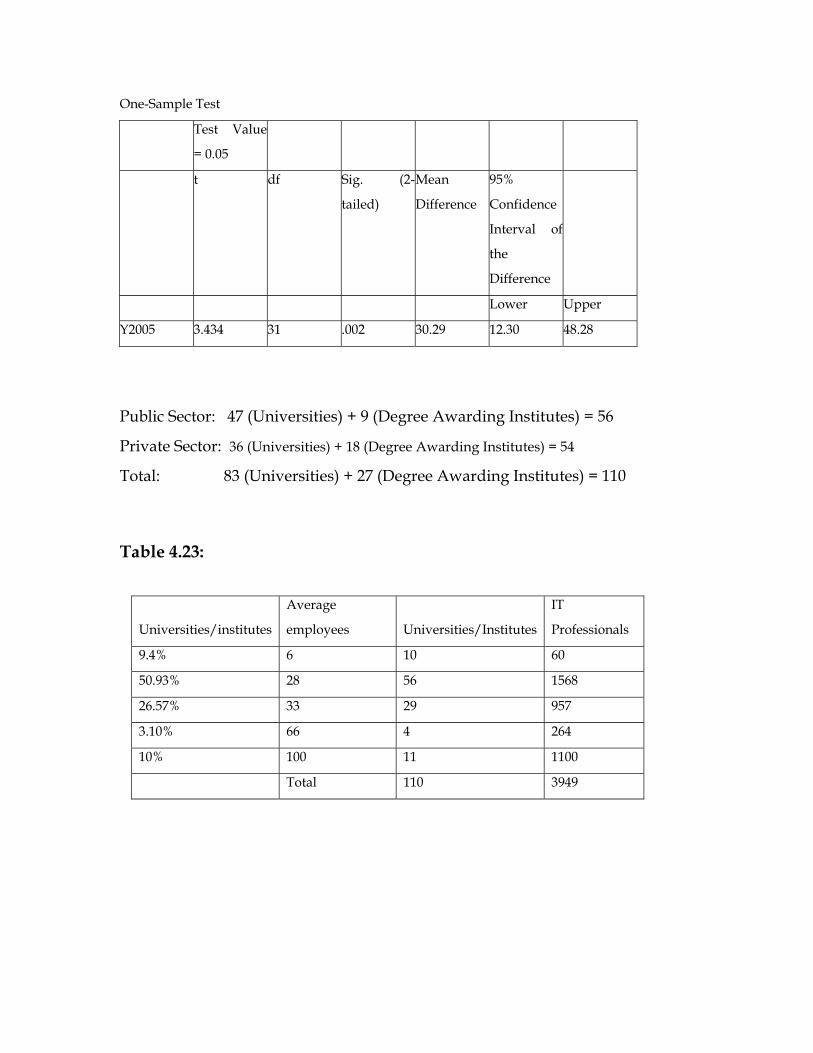
One-Sample Test
Test Value
= 0.05
t df Sig. (2-
tailed)
Mean
Difference
95%
Confidence
Interval of
the
Difference
Lower Upper
Y2005 3.434 31 .002 30.29 12.30 48.28
Public Sector: 47 (Universities) + 9 (Degree Awarding Institutes) = 56
Private Sector: 36 (Universities) + 18 (Degree Awarding Institutes) = 54
Total: 83 (Universities) + 27 (Degree Awarding Institutes) = 110
Table 4.23:
Universities/institutes
Average
employees Universities/Institutes
IT
Professionals
9.4% 6 10 60
50.93% 28 56 1568
26.57% 33 29 957
3.10% 66 4 264
10% 100 11 1100
Total 110 3949
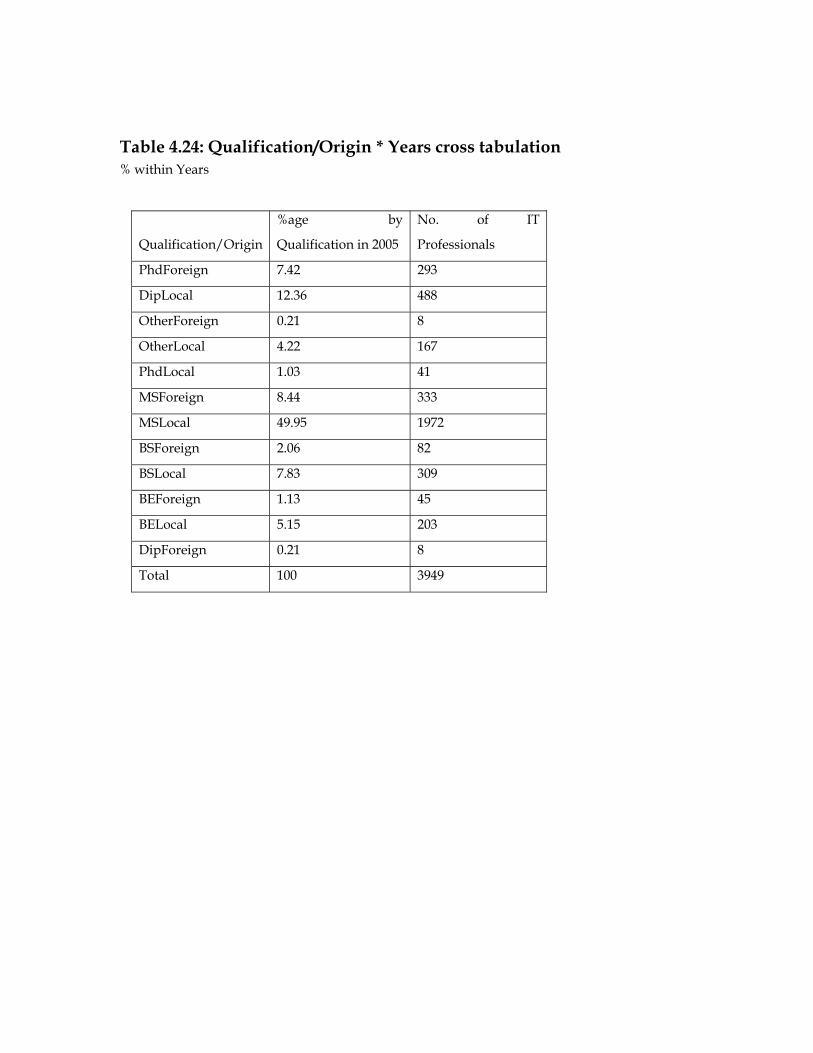
Table 4.24: Qualification/Origin * Years cross tabulation % within Years
Qualification/Origin
%age by
Qualification in 2005
No. of IT
Professionals
PhdForeign 7.42 293
DipLocal 12.36 488
OtherForeign 0.21 8
OtherLocal 4.22 167
PhdLocal 1.03 41
MSForeign 8.44 333
MSLocal 49.95 1972
BSForeign 2.06 82
BSLocal 7.83 309
BEForeign 1.13 45
BELocal 5.15 203
DipForeign 0.21 8
Total 100 3949
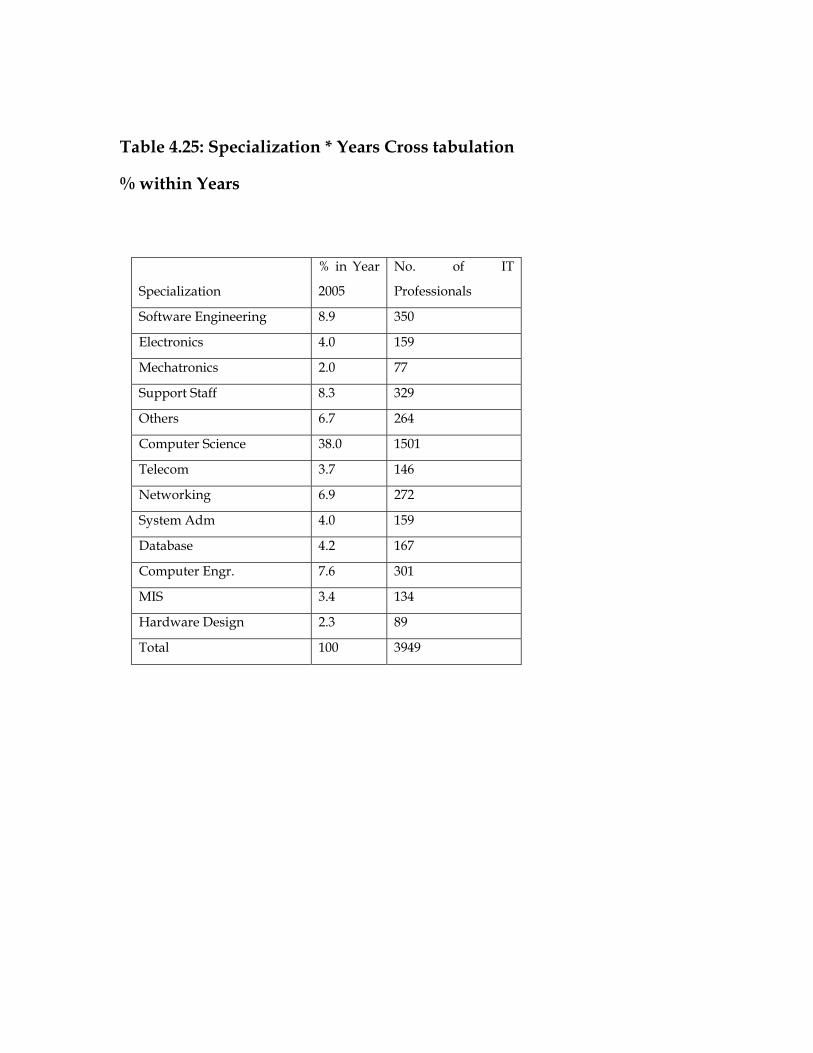
Table 4.25: Specialization * Years Cross tabulation
% within Years
Specialization
% in Year
2005
No. of IT
Professionals
Software Engineering 8.9 350
Electronics 4.0 159
Mechatronics 2.0 77
Support Staff 8.3 329
Others 6.7 264
Computer Science 38.0 1501
Telecom 3.7 146
Networking 6.9 272
System Adm 4.0 159
Database 4.2 167
Computer Engr. 7.6 301
MIS 3.4 134
Hardware Design 2.3 89
Total 100 3949
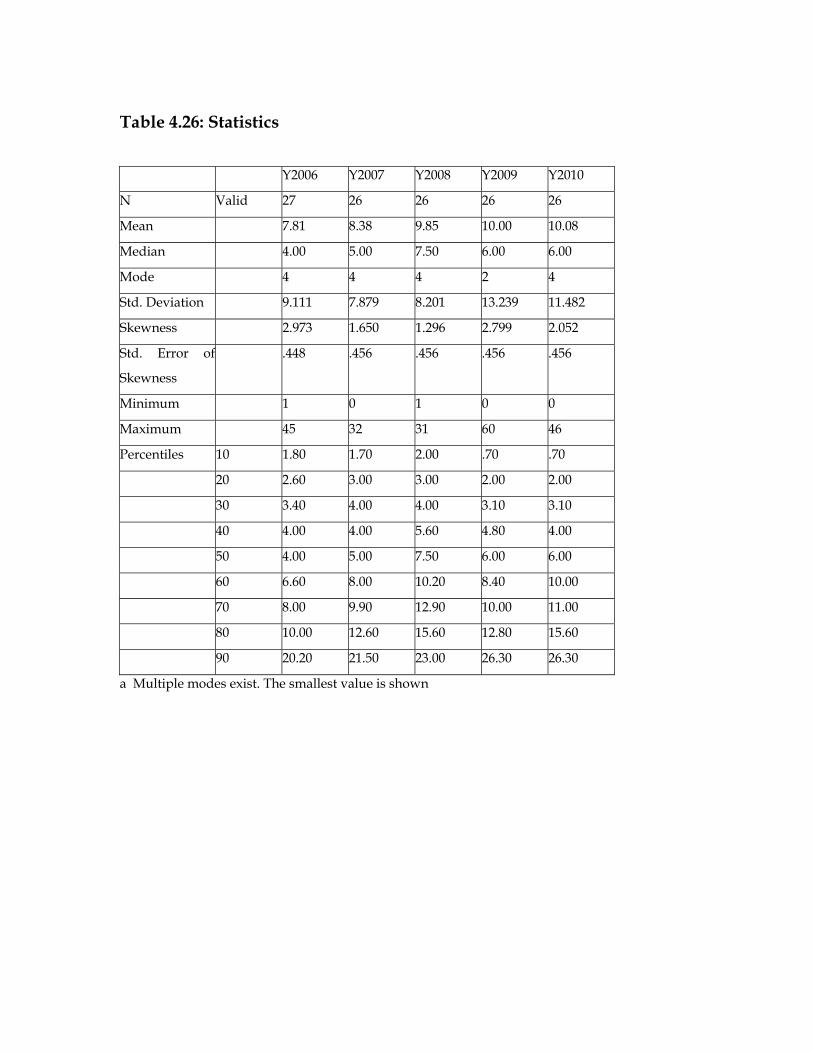
Table 4.26: Statistics
Y2006 Y2007 Y2008 Y2009 Y2010
N Valid 27 26 26 26 26
Mean 7.81 8.38 9.85 10.00 10.08
Median 4.00 5.00 7.50 6.00 6.00
Mode 4 4 4 2 4
Std. Deviation 9.111 7.879 8.201 13.239 11.482
Skewness 2.973 1.650 1.296 2.799 2.052
Std. Error of
Skewness
.448 .456 .456 .456 .456
Minimum 1 0 1 0 0
Maximum 45 32 31 60 46
Percentiles 10 1.80 1.70 2.00 .70 .70
20 2.60 3.00 3.00 2.00 2.00
30 3.40 4.00 4.00 3.10 3.10
40 4.00 4.00 5.60 4.80 4.00
50 4.00 5.00 7.50 6.00 6.00
60 6.60 8.00 10.20 8.40 10.00
70 8.00 9.90 12.90 10.00 11.00
80 10.00 12.60 15.60 12.80 15.60
90 20.20 21.50 23.00 26.30 26.30
a Multiple modes exist. The smallest value is shown
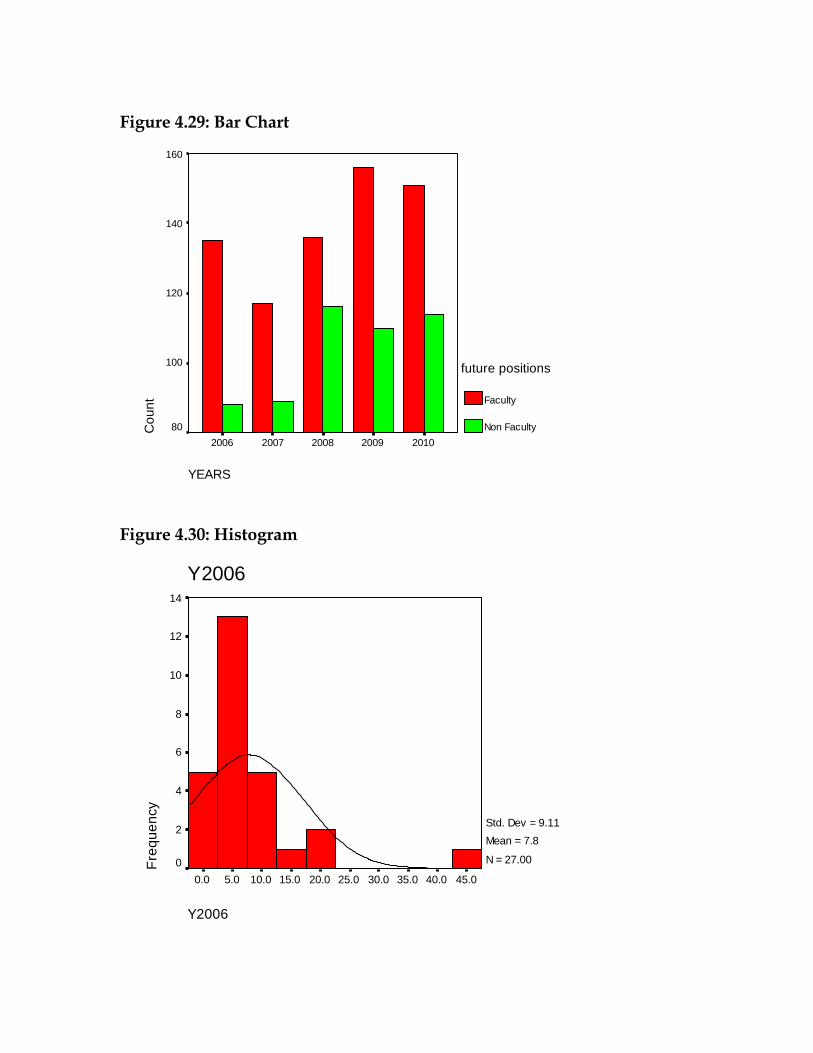
Figure 4.29: Bar Chart
YEARS
20102009200820072006
Cou
nt160
140
120
100
80
future positions
Faculty
Non Faculty
Figure 4.30: Histogram
Y2006
45.040.035.030.025.020.015.010.05.00.0
Y2006
Freq
uenc
y
14
12
10
8
6
4
2
0
Std. Dev = 9.11 Mean = 7.8
N = 27.00
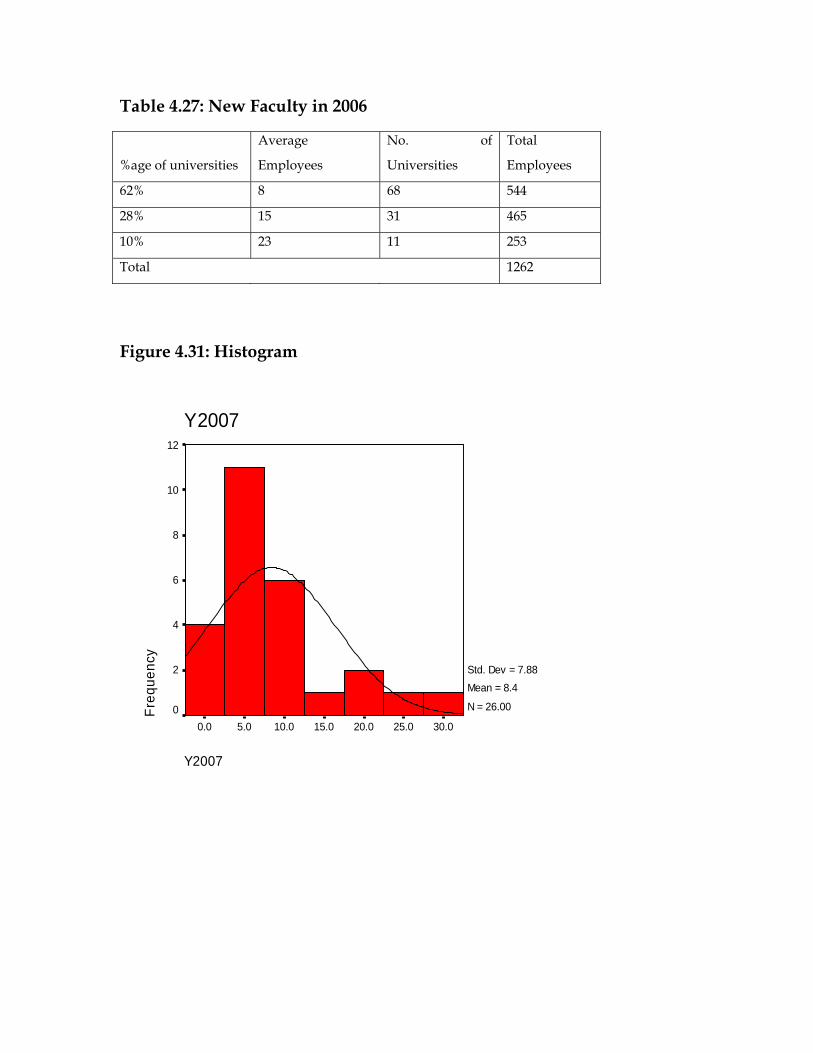
Table 4.27: New Faculty in 2006
Figure 4.31: Histogram
Y2007
30.025.020.015.010.05.00.0
Y2007
Freq
uenc
y
12
10
8
6
4
2
0
Std. Dev = 7.88 Mean = 8.4
N = 26.00
%age of universities
Average
Employees
No. of
Universities
Total
Employees
62% 8 68 544
28% 15 31 465
10% 23 11 253
Total 1262
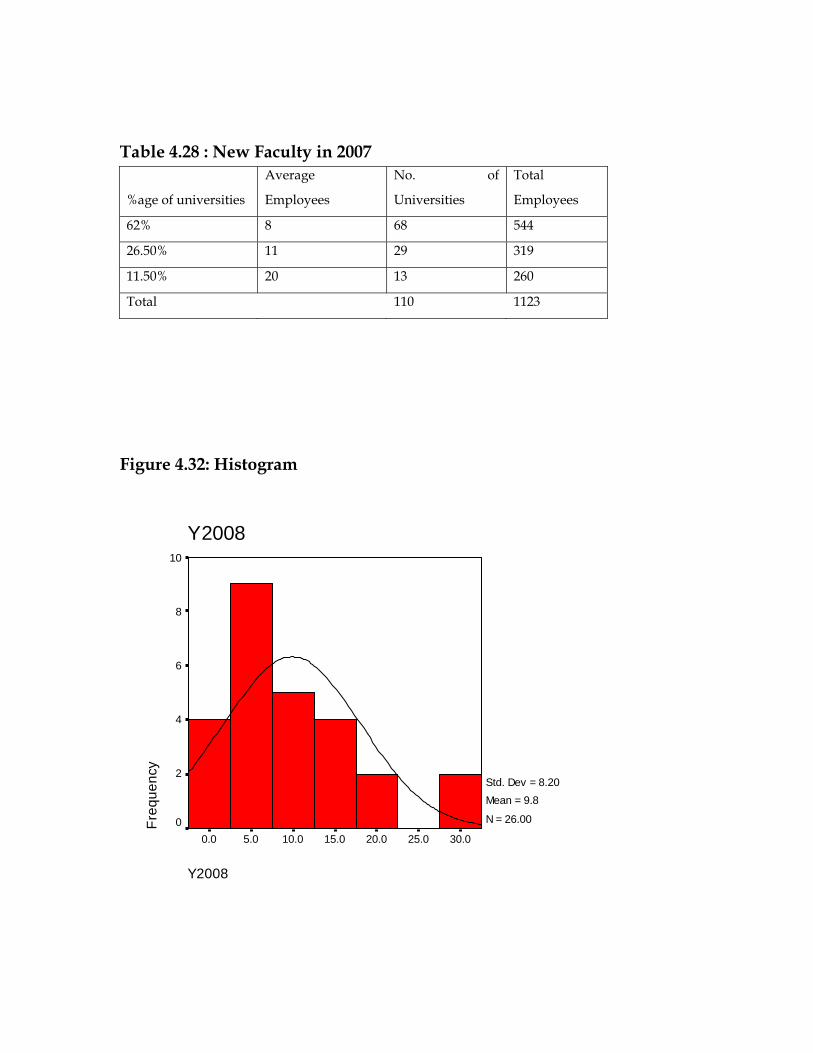
Table 4.28 : New Faculty in 2007
%age of universities
Average
Employees
No. of
Universities
Total
Employees
62% 8 68 544
26.50% 11 29 319
11.50% 20 13 260
Total 110 1123
Figure 4.32: Histogram
Y2008
30.025.020.015.010.05.00.0
Y2008
Freq
uenc
y
10
8
6
4
2
0
Std. Dev = 8.20 Mean = 9.8
N = 26.00
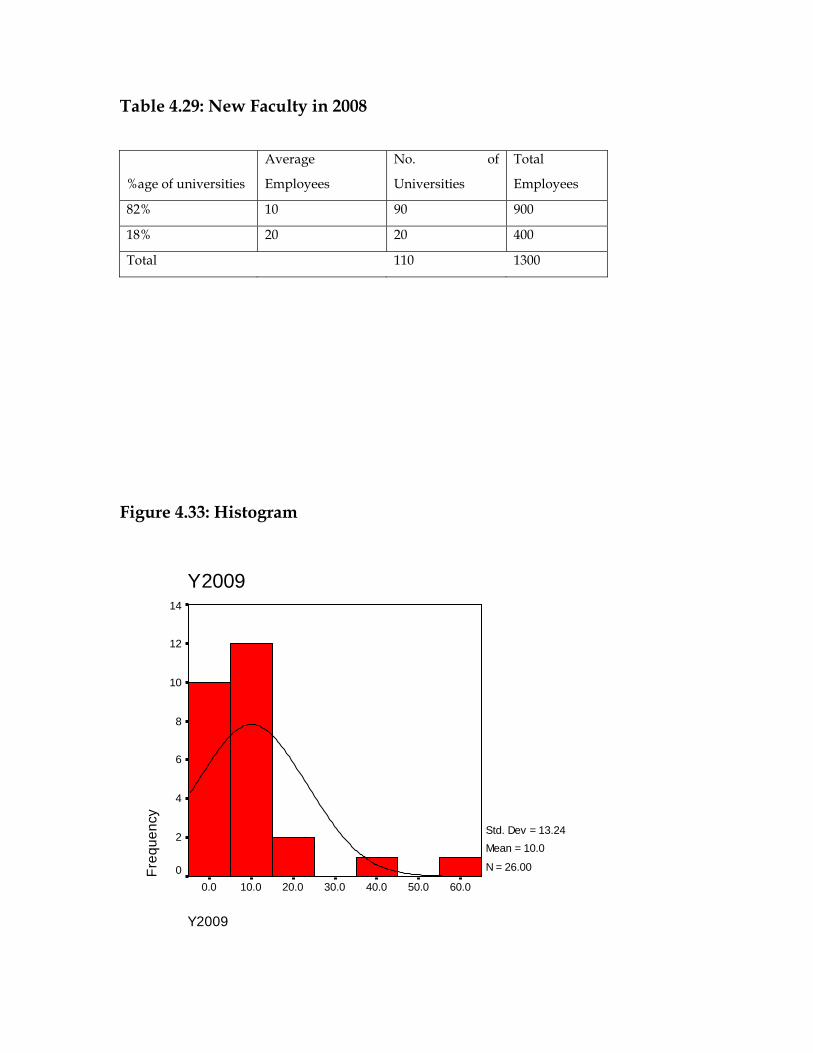
Table 4.29: New Faculty in 2008
%age of universities
Average
Employees
No. of
Universities
Total
Employees
82% 10 90 900
18% 20 20 400
Total 110 1300
Figure 4.33: Histogram
Y2009
60.050.040.030.020.010.00.0
Y2009
Freq
uenc
y
14
12
10
8
6
4
2
0
Std. Dev = 13.24 Mean = 10.0
N = 26.00
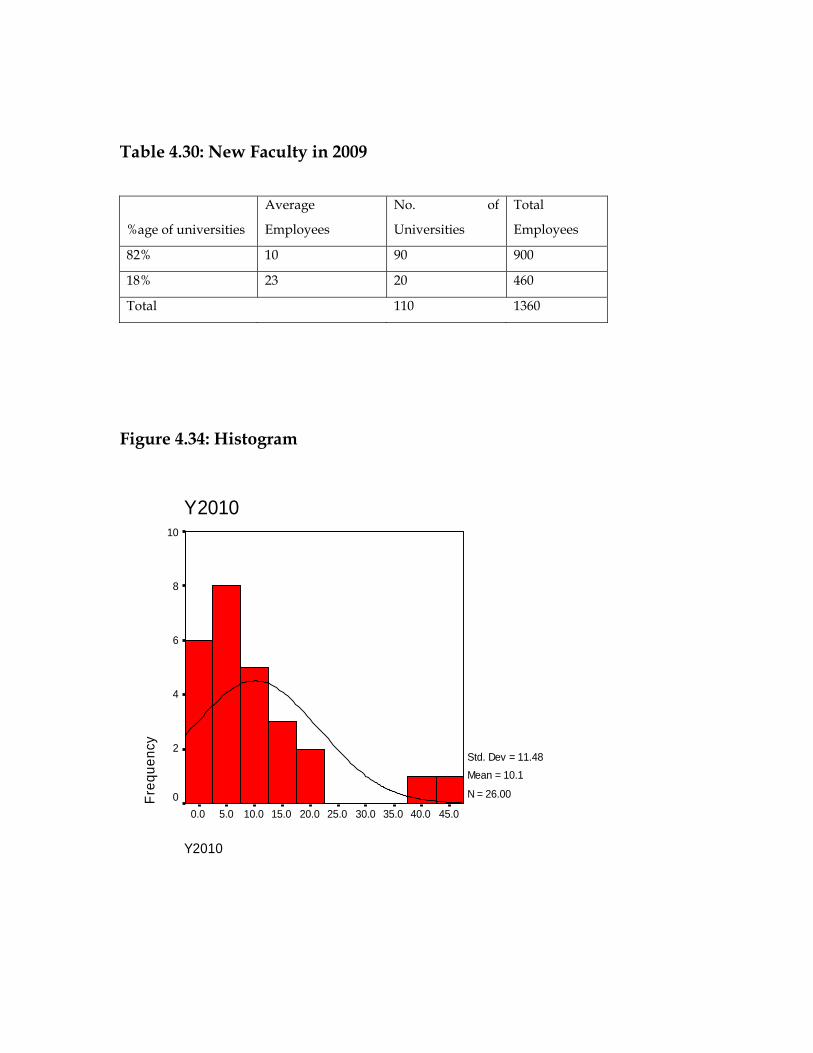
Table 4.30: New Faculty in 2009
%age of universities
Average
Employees
No. of
Universities
Total
Employees
82% 10 90 900
18% 23 20 460
Total 110 1360
Figure 4.34: Histogram
Y2010
45.040.035.030.025.020.015.010.05.00.0
Y2010
Freq
uenc
y
10
8
6
4
2
0
Std. Dev = 11.48 Mean = 10.1
N = 26.00
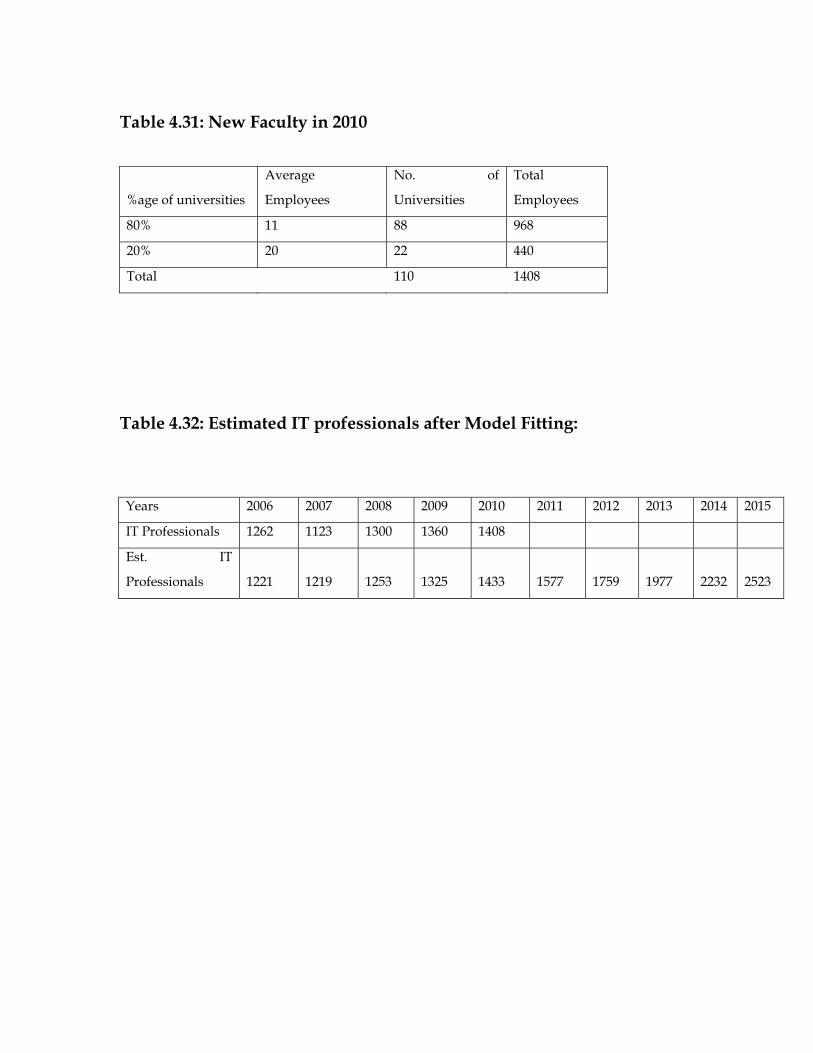
Table 4.31: New Faculty in 2010
%age of universities
Average
Employees
No. of
Universities
Total
Employees
80% 11 88 968
20% 20 22 440
Total 110 1408
Table 4.32: Estimated IT professionals after Model Fitting:
Years 2006 2007 2008 2009 2010 2011 2012 2013 2014 2015
IT Professionals 1262 1123 1300 1360 1408
Est. IT
Professionals 1221 1219 1253 1325 1433 1577 1759 1977 2232 2523
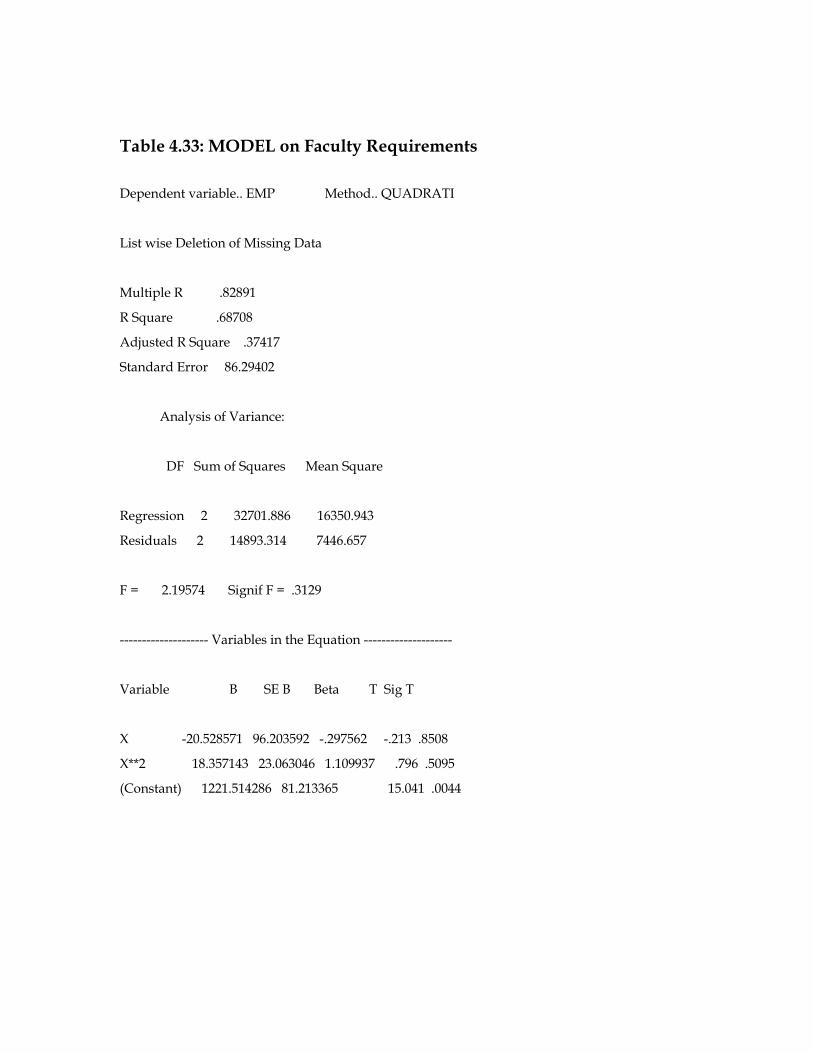
Table 4.33: MODEL on Faculty Requirements
Dependent variable.. EMP Method.. QUADRATI
List wise Deletion of Missing Data
Multiple R .82891
R Square .68708
Adjusted R Square .37417
Standard Error 86.29402
Analysis of Variance:
DF Sum of Squares Mean Square
Regression 2 32701.886 16350.943
Residuals 2 14893.314 7446.657
F = 2.19574 Signif F = .3129
-------------------- Variables in the Equation --------------------
Variable B SE B Beta T Sig T
X -20.528571 96.203592 -.297562 -.213 .8508
X**2 18.357143 23.063046 1.109937 .796 .5095
(Constant) 1221.514286 81.213365 15.041 .0044
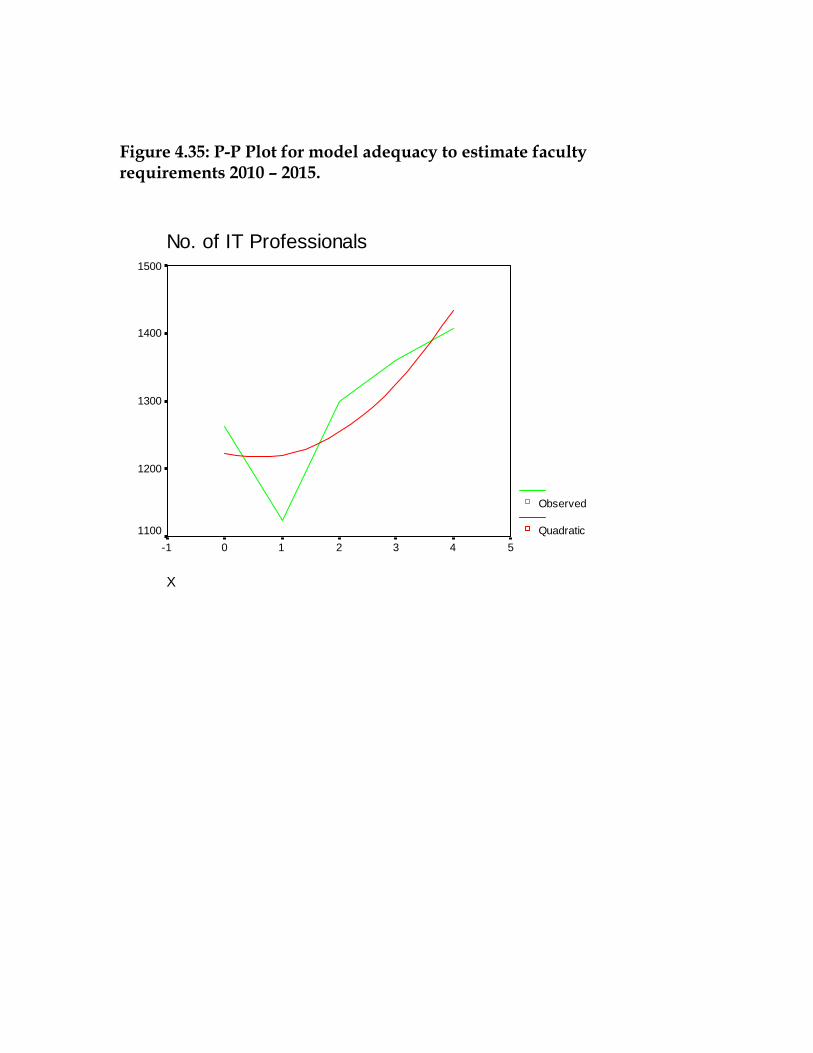
Figure 4.35: P-P Plot for model adequacy to estimate faculty requirements 2010 – 2015.
No. of IT Professionals
X
543210-1
1500
1400
1300
1200
1100
Observed
Quadratic
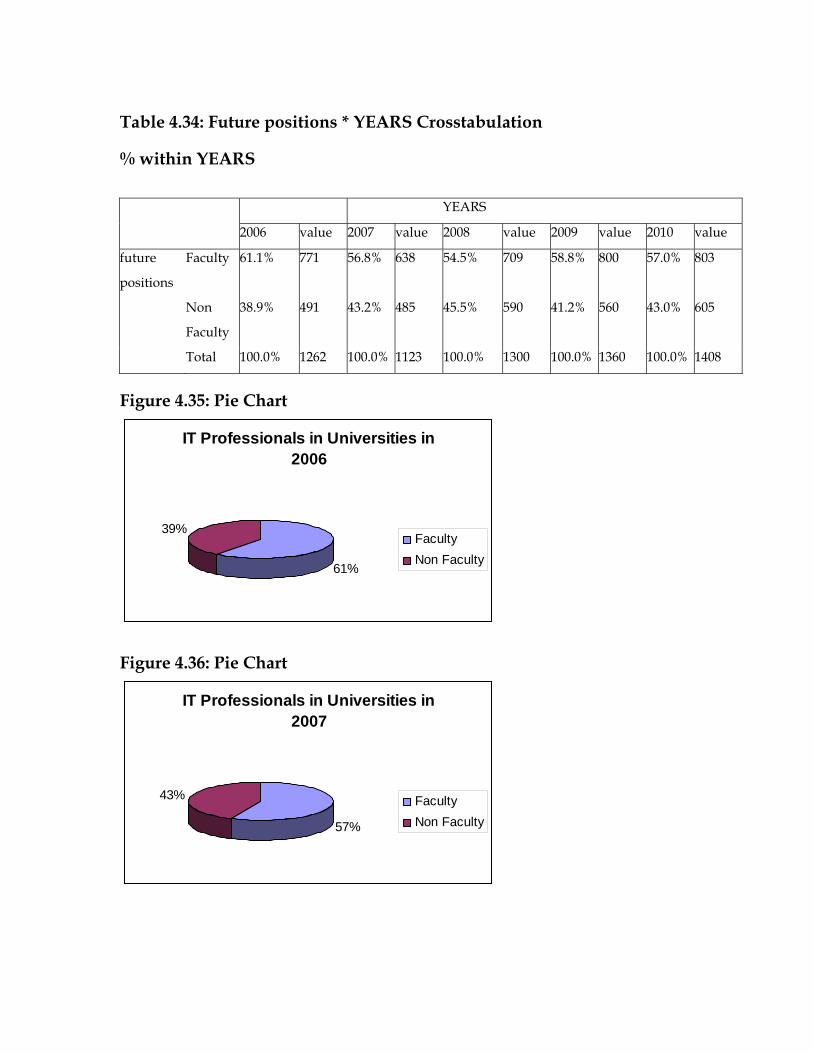
Table 4.34: Future positions * YEARS Crosstabulation
% within YEARS
YEARS
2006 value 2007 value 2008 value 2009 value 2010 value
future
positions
Faculty 61.1% 771 56.8% 638 54.5% 709 58.8% 800 57.0% 803
Non
Faculty
38.9% 491 43.2% 485 45.5% 590 41.2% 560 43.0% 605
Total 100.0% 1262 100.0% 1123 100.0% 1300 100.0% 1360 100.0% 1408
Figure 4.35: Pie Chart
IT Professionals in Universities in 2006
61%
39%FacultyNon Faculty
Figure 4.36: Pie Chart
IT Professionals in Universities in 2007
57%
43% FacultyNon Faculty
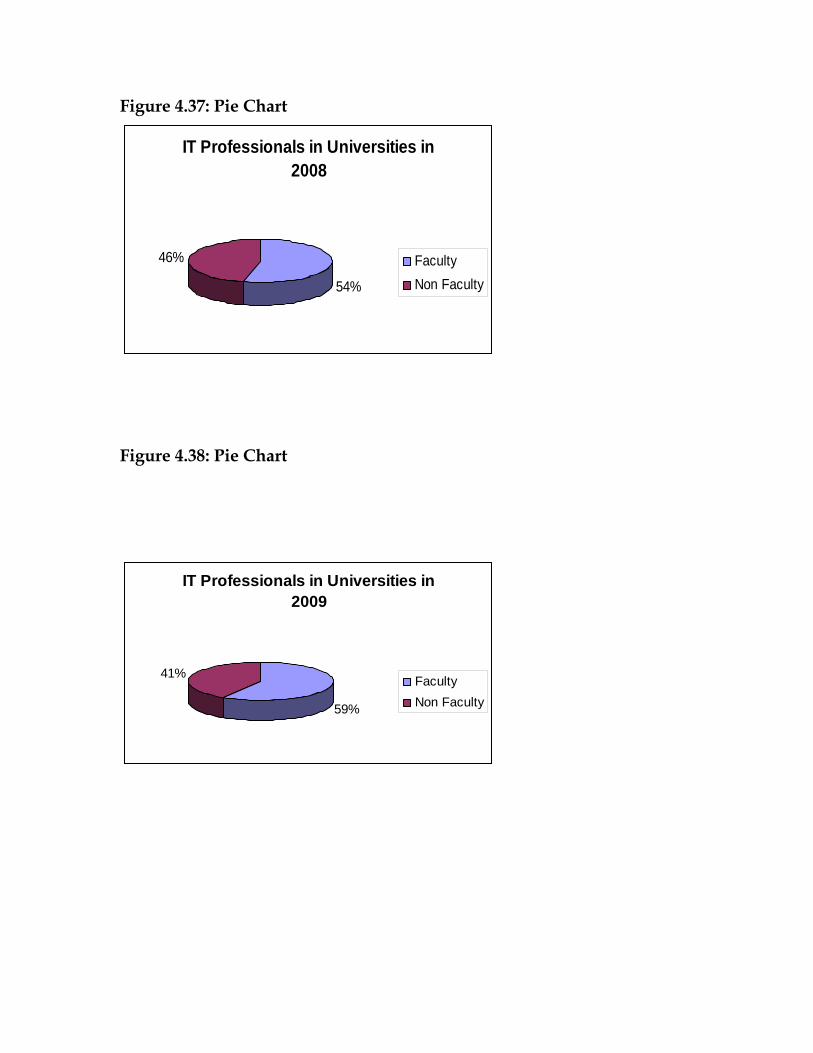
Figure 4.37: Pie Chart
IT Professionals in Universities in 2008
54%
46% FacultyNon Faculty
Figure 4.38: Pie Chart
IT Professionals in Universities in 2009
59%
41% FacultyNon Faculty
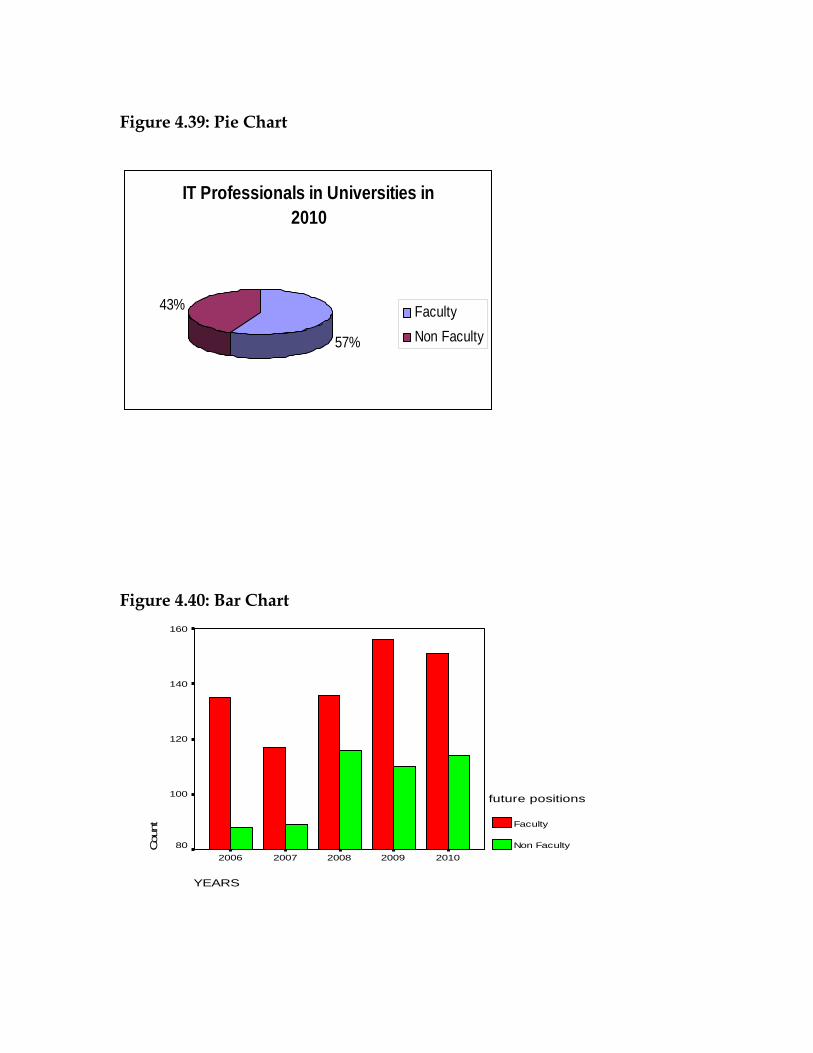
Figure 4.39: Pie Chart
IT Professionals in Universities in 2010
57%
43% FacultyNon Faculty
Figure 4.40: Bar Chart
YEARS
20102009200820072006
Cou
nt
160
140
120
100
80
future positions
Faculty
Non Faculty
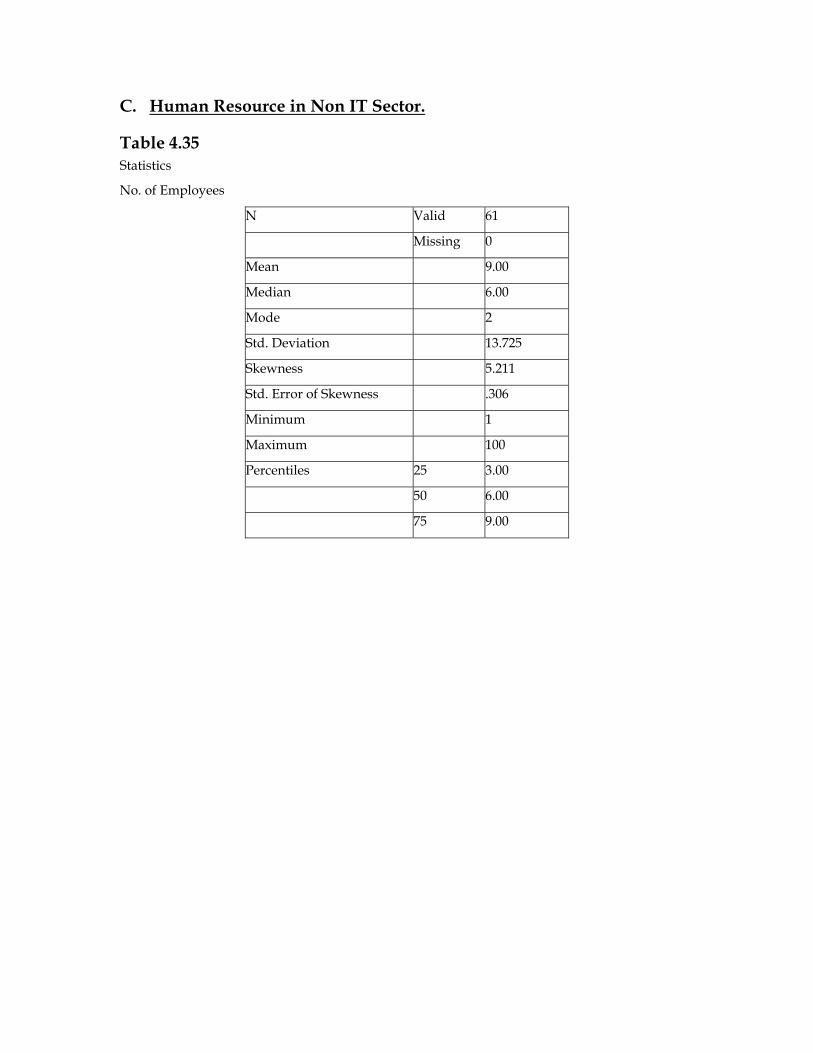
C. Human Resource in Non IT Sector.
Table 4.35 Statistics
No. of Employees
N Valid 61
Missing 0
Mean 9.00
Median 6.00
Mode 2
Std. Deviation 13.725
Skewness 5.211
Std. Error of Skewness .306
Minimum 1
Maximum 100
Percentiles 25 3.00
50 6.00
75 9.00
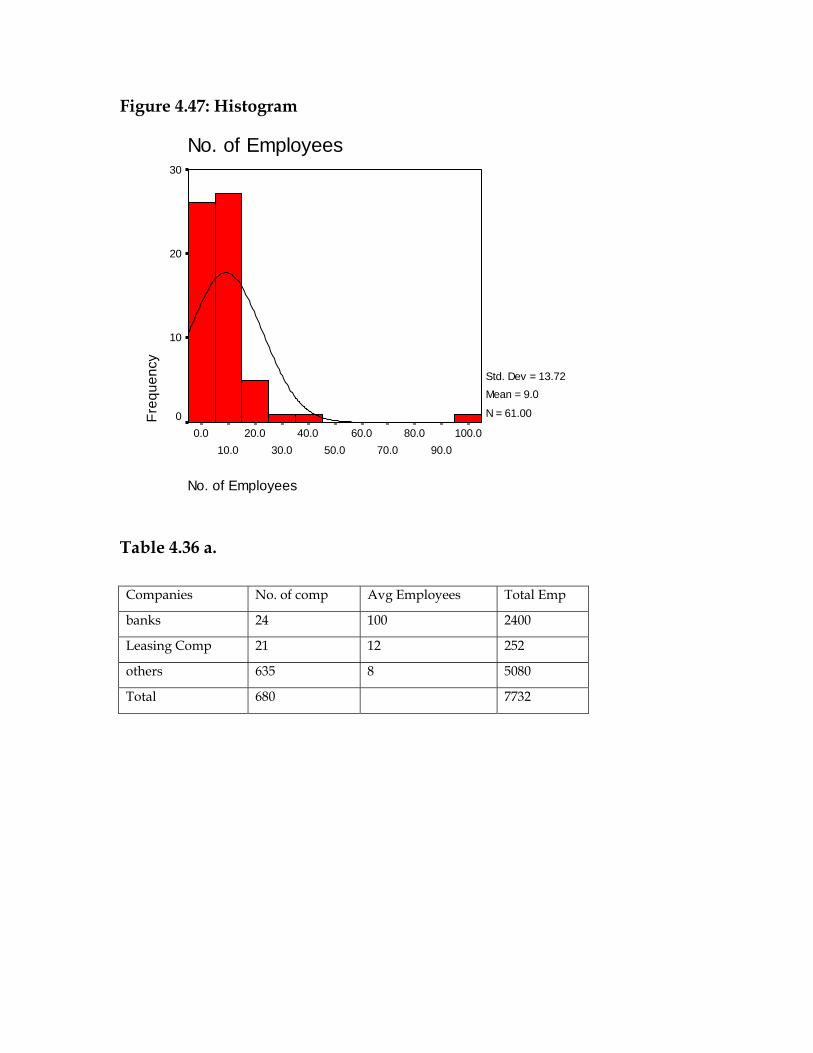
Figure 4.47: Histogram
No. of Employees
100.090.0
80.070.0
60.050.0
40.030.0
20.010.0
0.0
No. of EmployeesFr
eque
ncy
30
20
10
0
Std. Dev = 13.72 Mean = 9.0
N = 61.00
Table 4.36 a.
Companies No. of comp Avg Employees Total Emp
banks 24 100 2400
Leasing Comp 21 12 252
others 635 8 5080
Total 680 7732
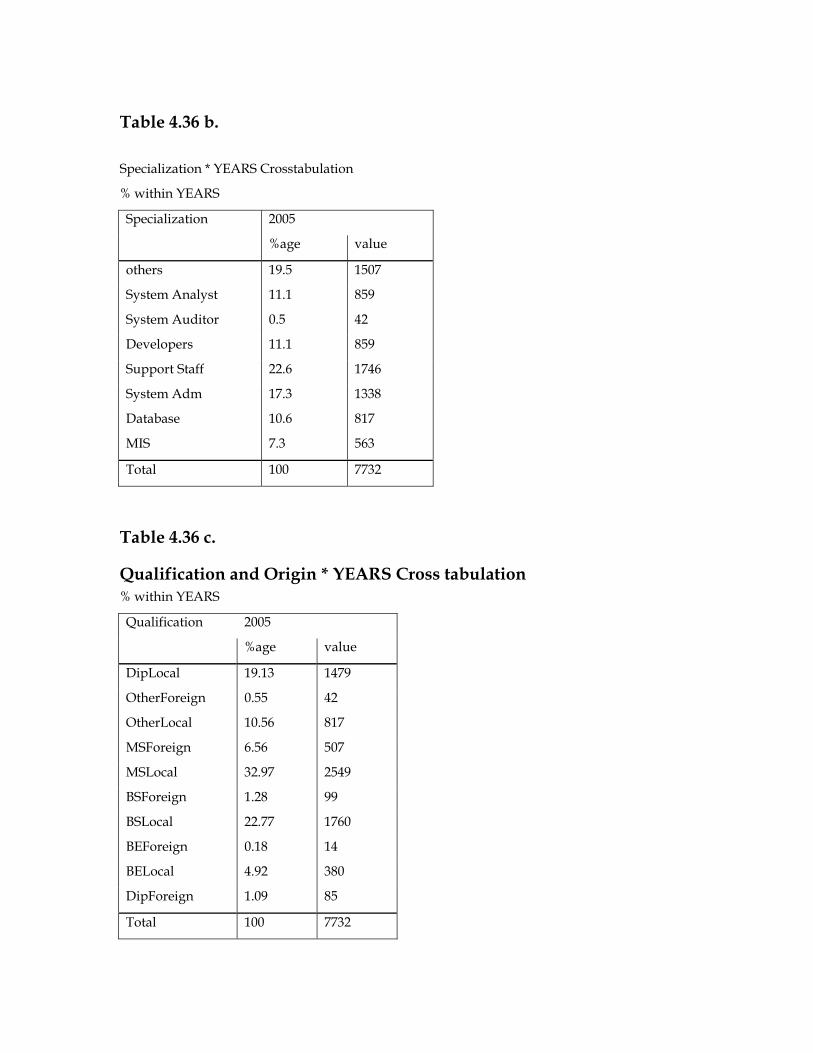
Table 4.36 b.
Specialization * YEARS Crosstabulation
% within YEARS
Specialization 2005
%age value
others 19.5 1507
System Analyst 11.1 859
System Auditor 0.5 42
Developers 11.1 859
Support Staff 22.6 1746
System Adm 17.3 1338
Database 10.6 817
MIS 7.3 563
Total 100 7732
Table 4.36 c.
Qualification and Origin * YEARS Cross tabulation % within YEARS
Qualification 2005
%age value
DipLocal 19.13 1479
OtherForeign 0.55 42
OtherLocal 10.56 817
MSForeign 6.56 507
MSLocal 32.97 2549
BSForeign 1.28 99
BSLocal 22.77 1760
BEForeign 0.18 14
BELocal 4.92 380
DipForeign 1.09 85
Total 100 7732
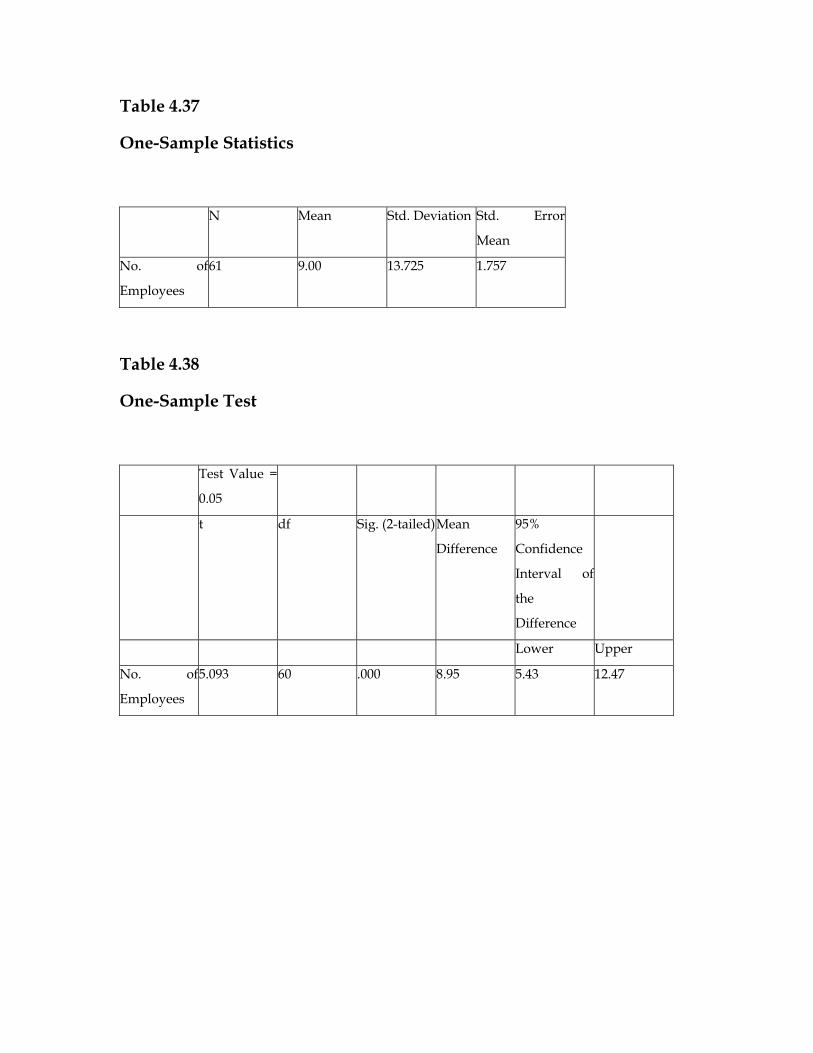
Table 4.37
One-Sample Statistics
N Mean Std. Deviation Std. Error
Mean
No. of
Employees
61 9.00 13.725 1.757
Table 4.38
One-Sample Test
Test Value =
0.05
t df Sig. (2-tailed)Mean
Difference
95%
Confidence
Interval of
the
Difference
Lower Upper
No. of
Employees
5.093 60 .000 8.95 5.43 12.47
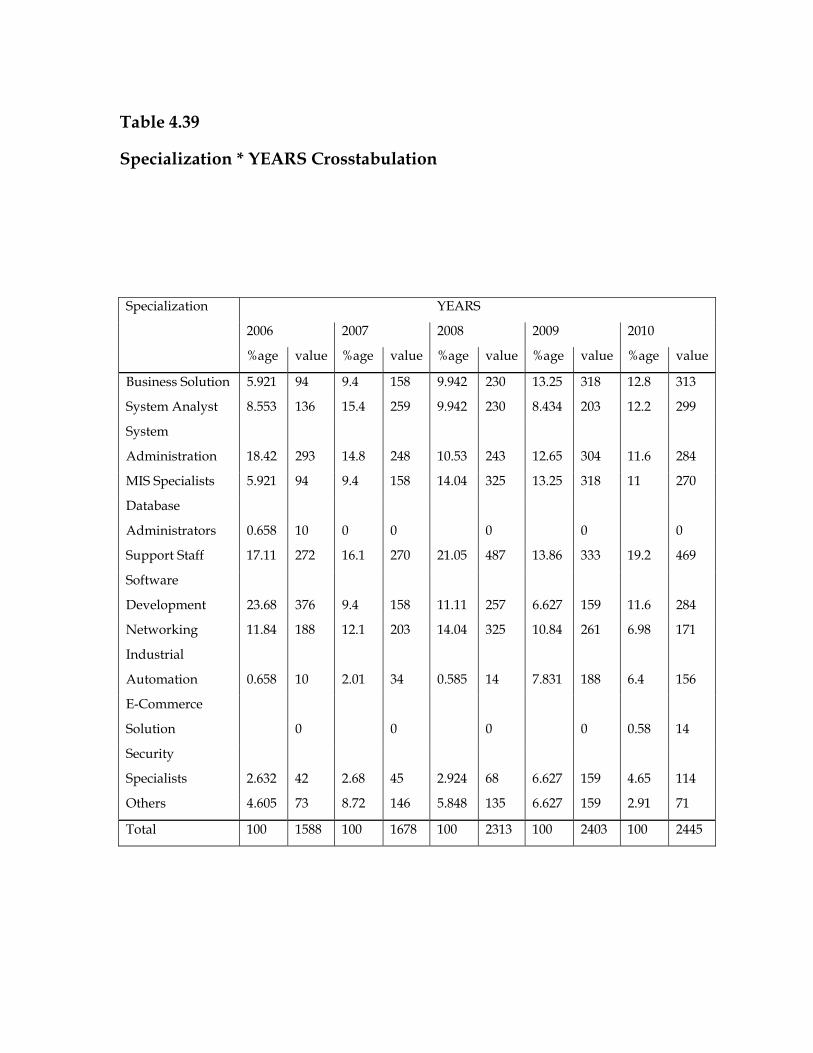
Table 4.39
Specialization * YEARS Crosstabulation
Specialization YEARS
2006 2007 2008 2009 2010
%age value %age value %age value %age value %age value
Business Solution 5.921 94 9.4 158 9.942 230 13.25 318 12.8 313
System Analyst 8.553 136 15.4 259 9.942 230 8.434 203 12.2 299
System
Administration 18.42 293 14.8 248 10.53 243 12.65 304 11.6 284
MIS Specialists 5.921 94 9.4 158 14.04 325 13.25 318 11 270
Database
Administrators 0.658 10 0 0 0 0 0
Support Staff 17.11 272 16.1 270 21.05 487 13.86 333 19.2 469
Software
Development 23.68 376 9.4 158 11.11 257 6.627 159 11.6 284
Networking 11.84 188 12.1 203 14.04 325 10.84 261 6.98 171
Industrial
Automation 0.658 10 2.01 34 0.585 14 7.831 188 6.4 156
E-Commerce
Solution 0 0 0 0 0.58 14
Security
Specialists 2.632 42 2.68 45 2.924 68 6.627 159 4.65 114
Others 4.605 73 8.72 146 5.848 135 6.627 159 2.91 71
Total 100 1588 100 1678 100 2313 100 2403 100 2445
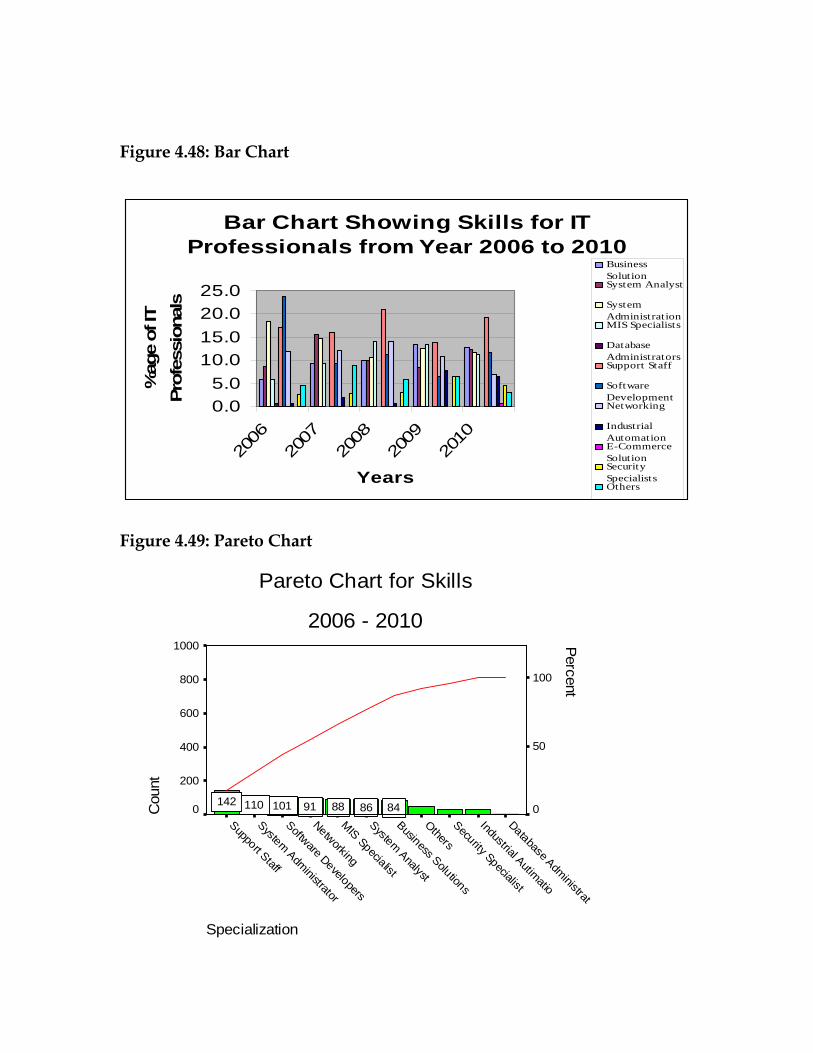
Figure 4.48: Bar Chart
Bar Chart Showing Skills for IT Professionals from Year 2006 to 2010
0.05.0
10.015.020.025.0
2006
2007
2008
2009
2010
Years
%ag
e of
IT
Prof
essi
onal
s
BusinessSolutionSystem Analyst
SystemAdministrationMIS Specialists
DatabaseAdministratorsSupport Staff
SoftwareDevelopmentNetworking
IndustrialAutomationE-CommerceSolutionSecuritySpecialistsOthers
Figure 4.49: Pareto Chart
Pareto Chart for Skills
2006 - 2010
Specialization
Database Administrat
Industrial Autimatio
Security Specialist
Others
Business Solutions
System Analyst
MIS Specialist
Networking
Software Developers
System Administrator
Support Staff
Cou
nt
1000
800
600
400
200
0
Percent
100
50
084868891101110142
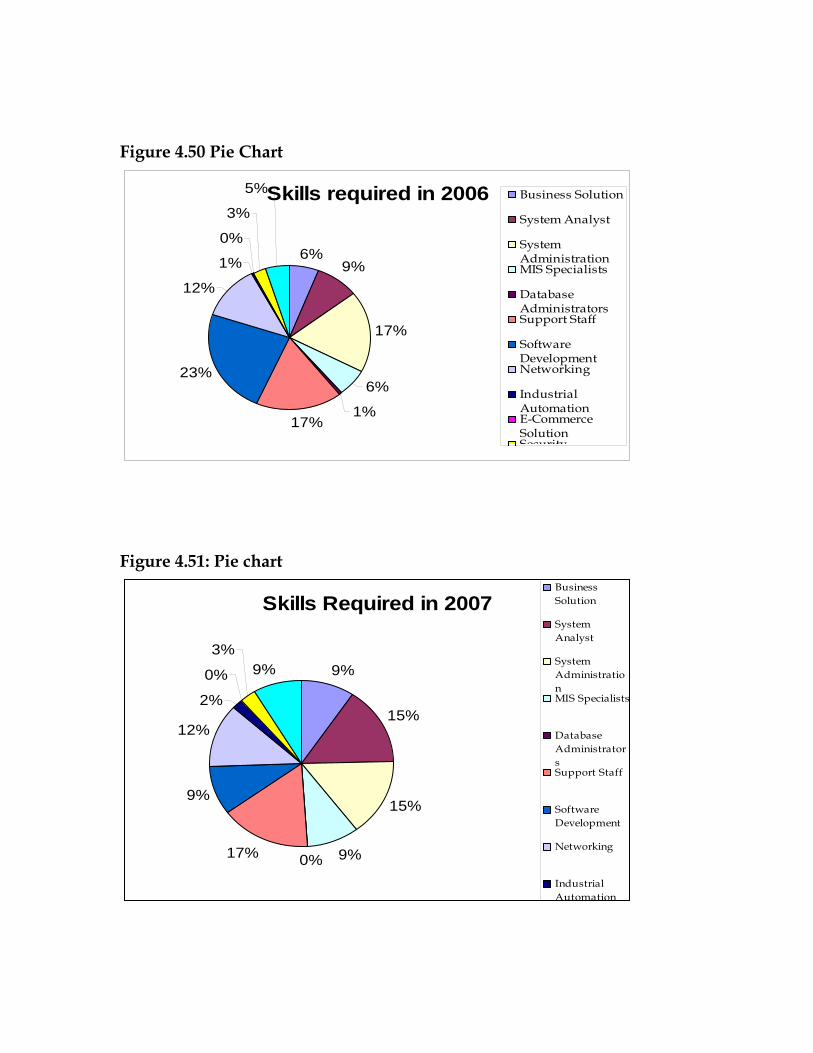
Figure 4.50 Pie Chart
Skills required in 2006
6%9%
17%
6%
1%17%
23%
12%
1%
0%
3%
5% Business Solution
System Analyst
SystemAdministrationMIS Specialists
DatabaseAdministratorsSupport Staff
SoftwareDevelopmentNetworking
IndustrialAutomationE-CommerceSolutionSecurity
Figure 4.51: Pie chart
Skills Required in 2007
9%
15%
15%
9%0%17%
9%
12%
2%
0%
3%9%
BusinessSolution
SystemAnalyst
SystemAdministrationMIS Specialists
DatabaseAdministratorsSupport Staff
SoftwareDevelopment
Networking
IndustrialAutomation
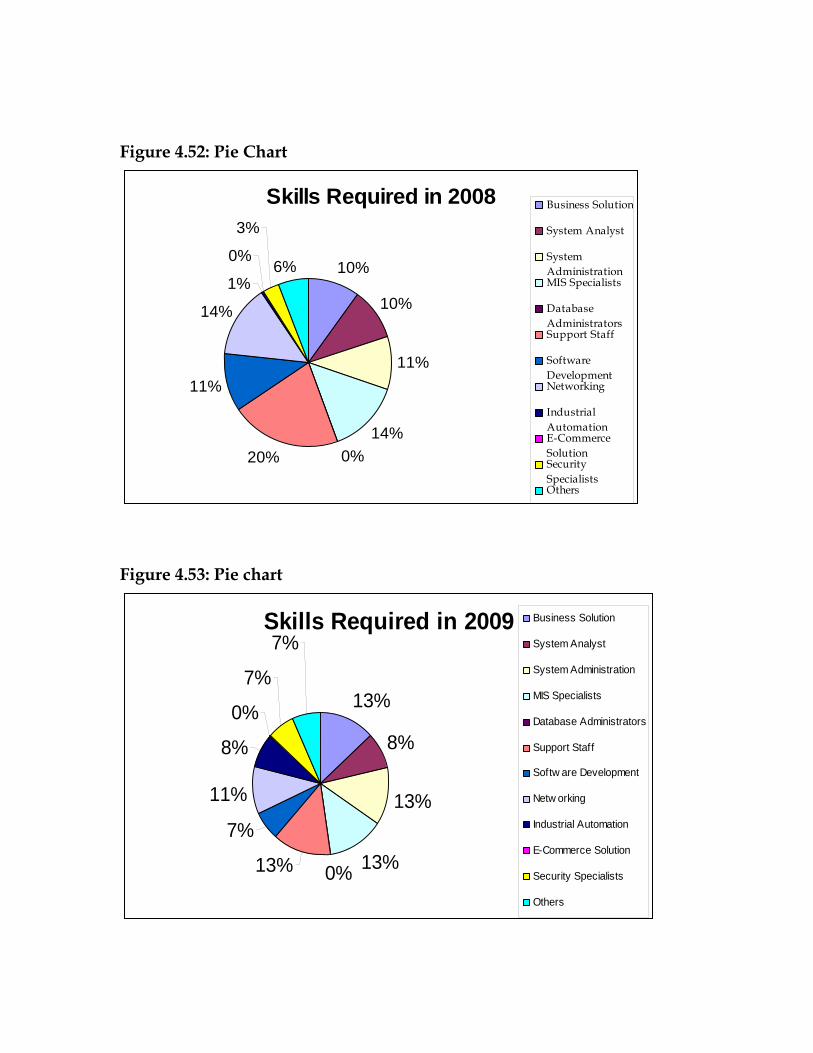
Figure 4.52: Pie Chart
Skills Required in 2008
10%
10%
11%
14%0%20%
11%
14%
1%
0%
3%
6%
Business Solution
System Analyst
SystemAdministrationMIS Specialists
DatabaseAdministratorsSupport Staff
SoftwareDevelopmentNetworking
IndustrialAutomationE-CommerceSolutionSecuritySpecialistsOthers
Figure 4.53: Pie chart
Skills Required in 2009
13%
8%
13%
13%0%13%
7%
11%
8%
0%
7%
7%Business Solution
System Analyst
System Administration
MIS Specialists
Database Administrators
Support Staff
Softw are Development
Netw orking
Industrial Automation
E-Commerce Solution
Security Specialists
Others
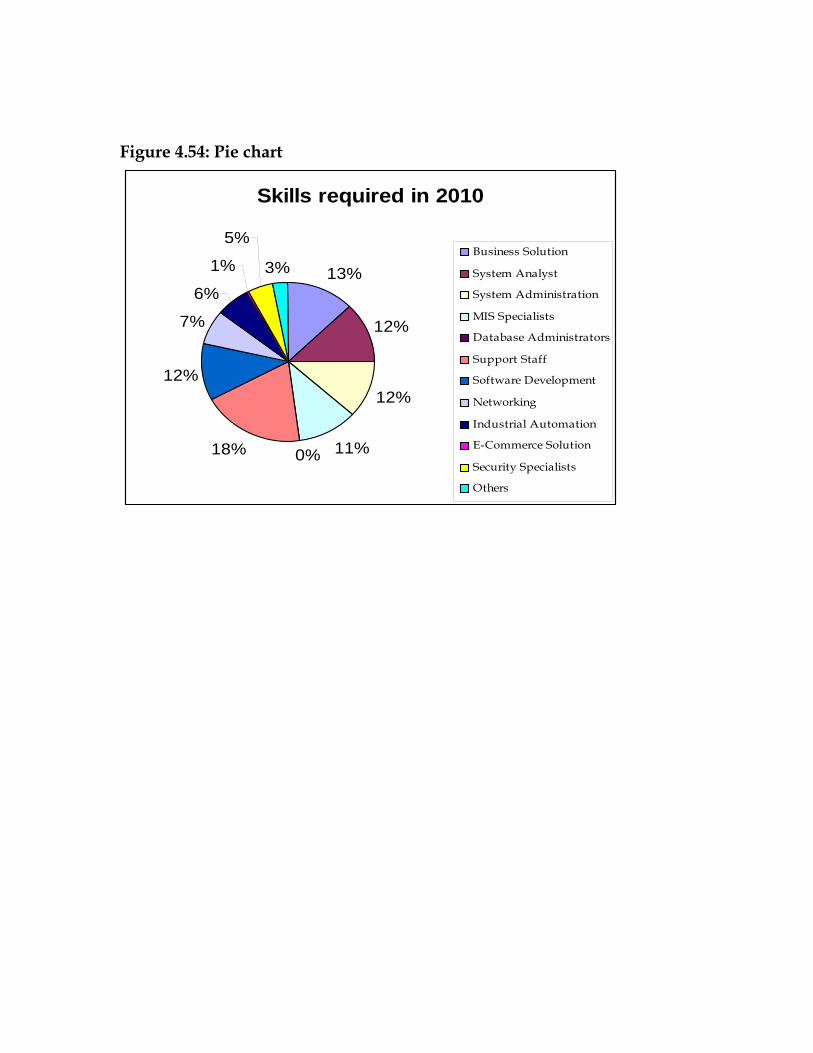
Figure 4.54: Pie chart
Skills required in 2010
13%
12%
12%
11%0%18%
12%
7%
6%
1%
5%
3%Business Solution
System Analyst
System Administration
MIS Specialists
Database Administrators
Support Staff
Software Development
Networking
Industrial Automation
E-Commerce Solution
Security Specialists
Others
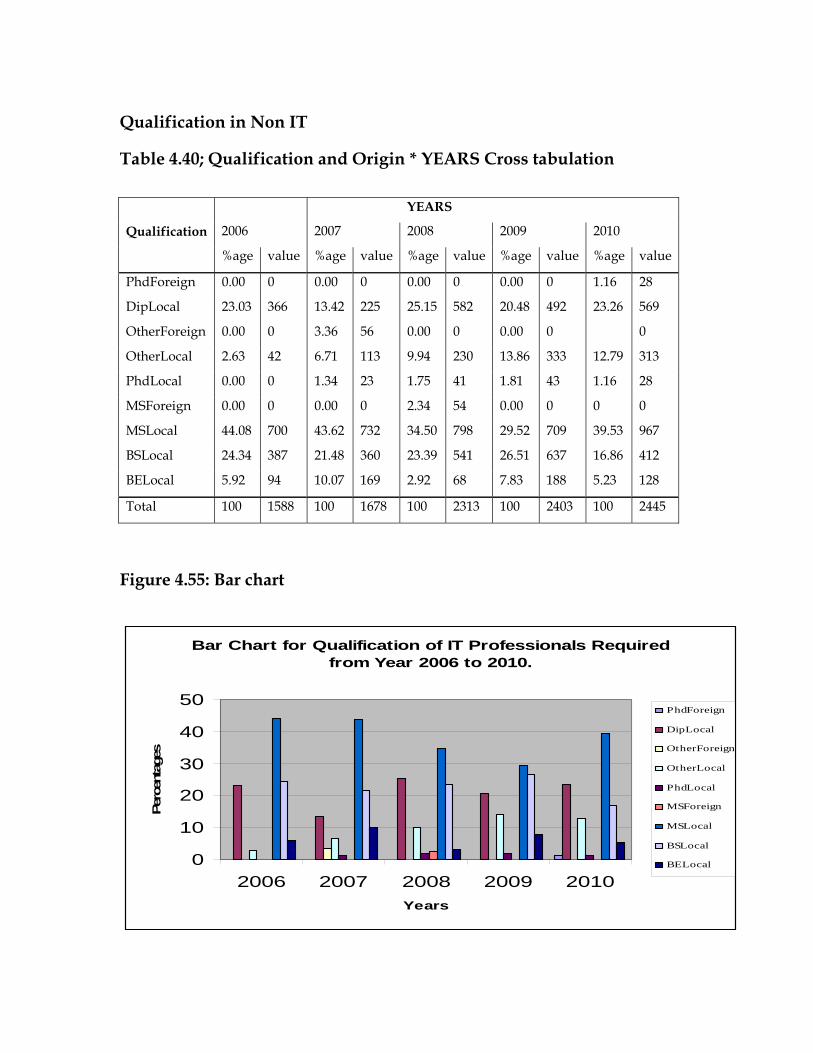
Qualification in Non IT
Table 4.40; Qualification and Origin * YEARS Cross tabulation
YEARS
Qualification 2006 2007 2008 2009 2010
%age value %age value %age value %age value %age value
PhdForeign 0.00 0 0.00 0 0.00 0 0.00 0 1.16 28
DipLocal 23.03 366 13.42 225 25.15 582 20.48 492 23.26 569
OtherForeign 0.00 0 3.36 56 0.00 0 0.00 0 0
OtherLocal 2.63 42 6.71 113 9.94 230 13.86 333 12.79 313
PhdLocal 0.00 0 1.34 23 1.75 41 1.81 43 1.16 28
MSForeign 0.00 0 0.00 0 2.34 54 0.00 0 0 0
MSLocal 44.08 700 43.62 732 34.50 798 29.52 709 39.53 967
BSLocal 24.34 387 21.48 360 23.39 541 26.51 637 16.86 412
BELocal 5.92 94 10.07 169 2.92 68 7.83 188 5.23 128
Total 100 1588 100 1678 100 2313 100 2403 100 2445
Figure 4.55: Bar chart
Bar Chart for Qualification of IT Professionals Required from Year 2006 to 2010.
0
10
20
30
40
50
2006 2007 2008 2009 2010Years
Perc
enta
ges
PhdForeign
DipLocal
OtherForeign
OtherLocal
PhdLocal
MSForeign
MSLocal
BSLocal
BELocal
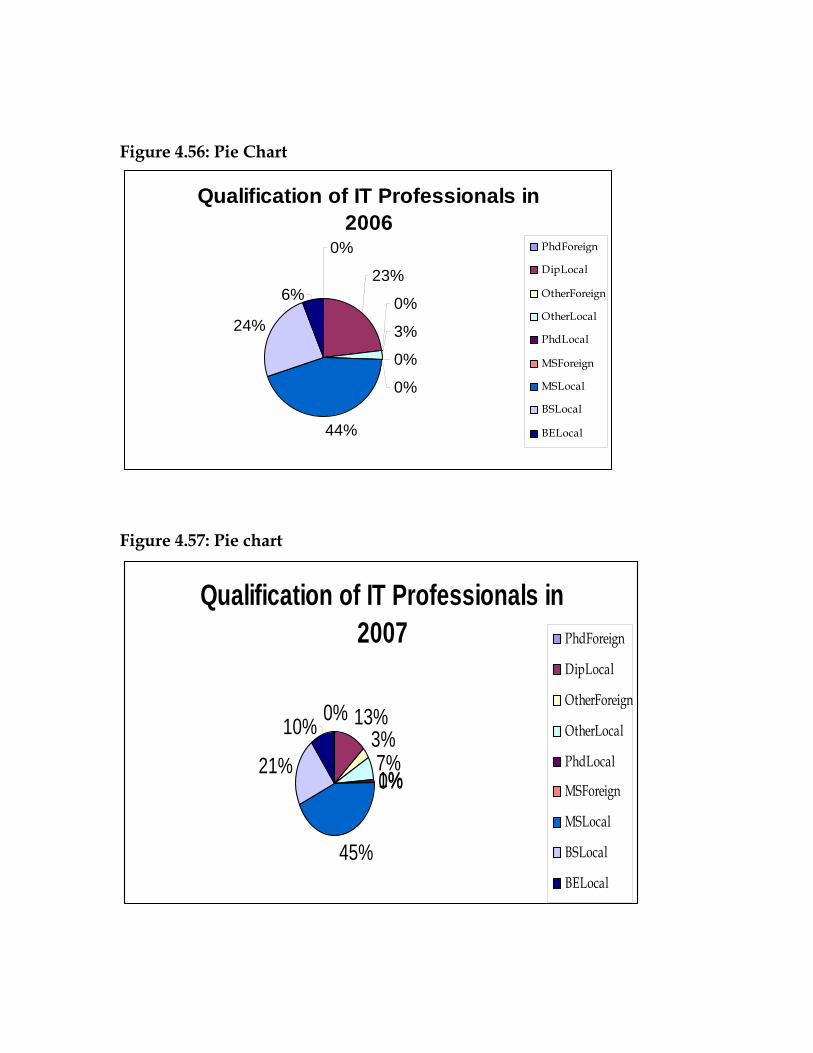
Figure 4.56: Pie Chart
Qualification of IT Professionals in 2006
0%
23%
0%
3%
0%
0%
44%
24%
6%
PhdForeign
DipLocal
OtherForeign
OtherLocal
PhdLocal
MSForeign
MSLocal
BSLocal
BELocal
Figure 4.57: Pie chart
Qualification of IT Professionals in 2007
0% 13%3%7%1%0%
45%
21%
10%
PhdForeign
DipLocal
OtherForeign
OtherLocal
PhdLocal
MSForeign
MSLocal
BSLocal
BELocal
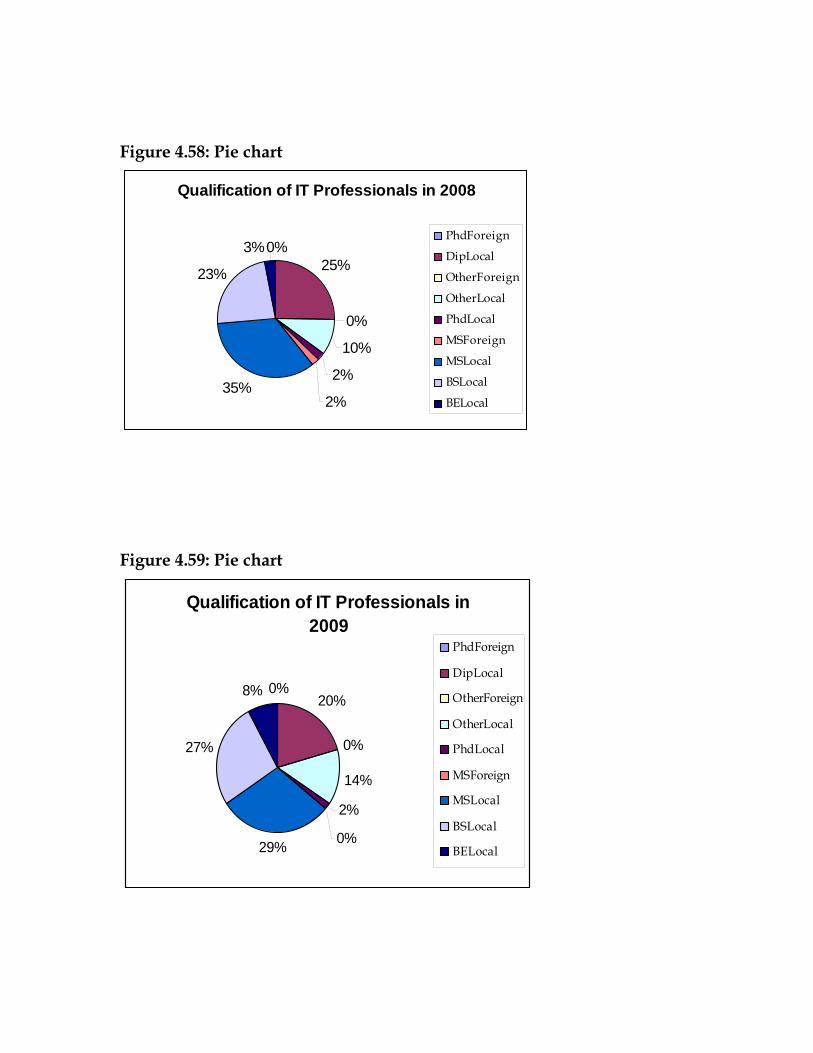
Figure 4.58: Pie chart
Qualification of IT Professionals in 2008
0%25%
0%
10%
2%
2%35%
23%
3%PhdForeign
DipLocal
OtherForeign
OtherLocal
PhdLocal
MSForeign
MSLocal
BSLocal
BELocal
Figure 4.59: Pie chart
Qualification of IT Professionals in 2009
0%20%
0%
14%
2%
0%29%
27%
8%
PhdForeign
DipLocal
OtherForeign
OtherLocal
PhdLocal
MSForeign
MSLocal
BSLocal
BELocal
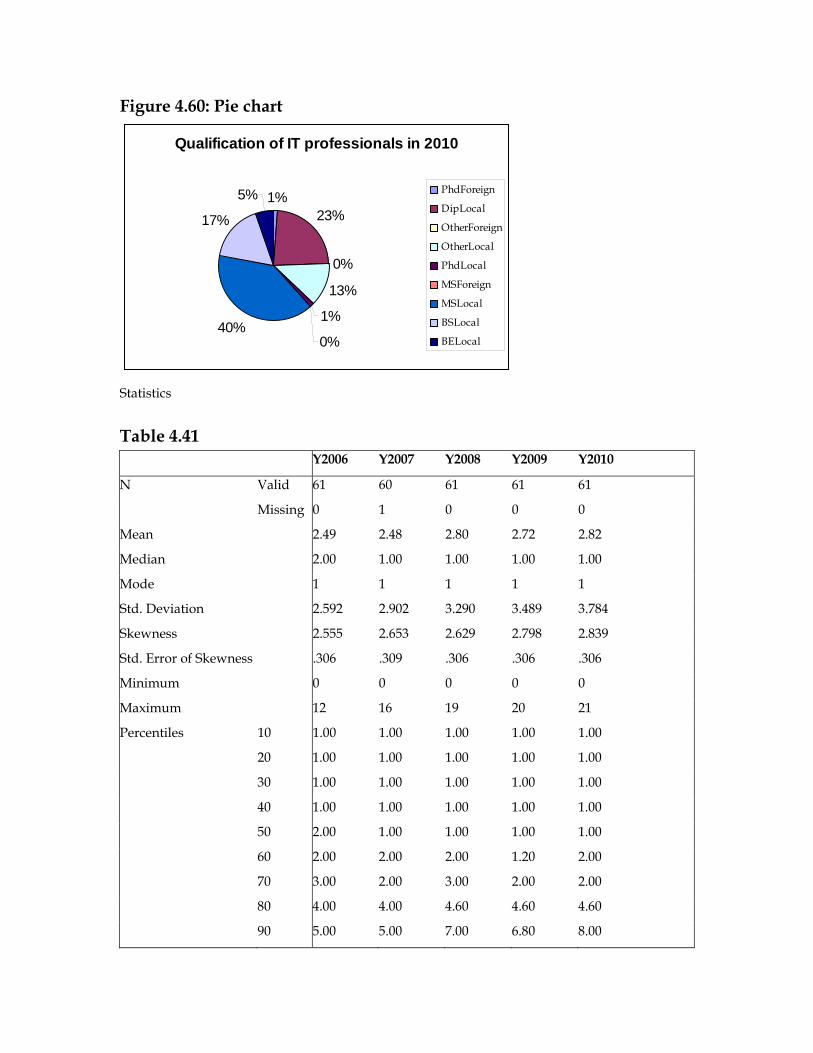
Figure 4.60: Pie chart
Qualification of IT professionals in 2010
1%23%
0%
13%
1%
0%40%
17%
5% PhdForeign
DipLocal
OtherForeign
OtherLocal
PhdLocal
MSForeign
MSLocal
BSLocal
BELocal
Statistics
Table 4.41 Y2006 Y2007 Y2008 Y2009 Y2010
N Valid 61 60 61 61 61
Missing 0 1 0 0 0
Mean 2.49 2.48 2.80 2.72 2.82
Median 2.00 1.00 1.00 1.00 1.00
Mode 1 1 1 1 1
Std. Deviation 2.592 2.902 3.290 3.489 3.784
Skewness 2.555 2.653 2.629 2.798 2.839
Std. Error of Skewness .306 .309 .306 .306 .306
Minimum 0 0 0 0 0
Maximum 12 16 19 20 21
Percentiles 10 1.00 1.00 1.00 1.00 1.00
20 1.00 1.00 1.00 1.00 1.00
30 1.00 1.00 1.00 1.00 1.00
40 1.00 1.00 1.00 1.00 1.00
50 2.00 1.00 1.00 1.00 1.00
60 2.00 2.00 2.00 1.20 2.00
70 3.00 2.00 3.00 2.00 2.00
80 4.00 4.00 4.60 4.60 4.60
90 5.00 5.00 7.00 6.80 8.00
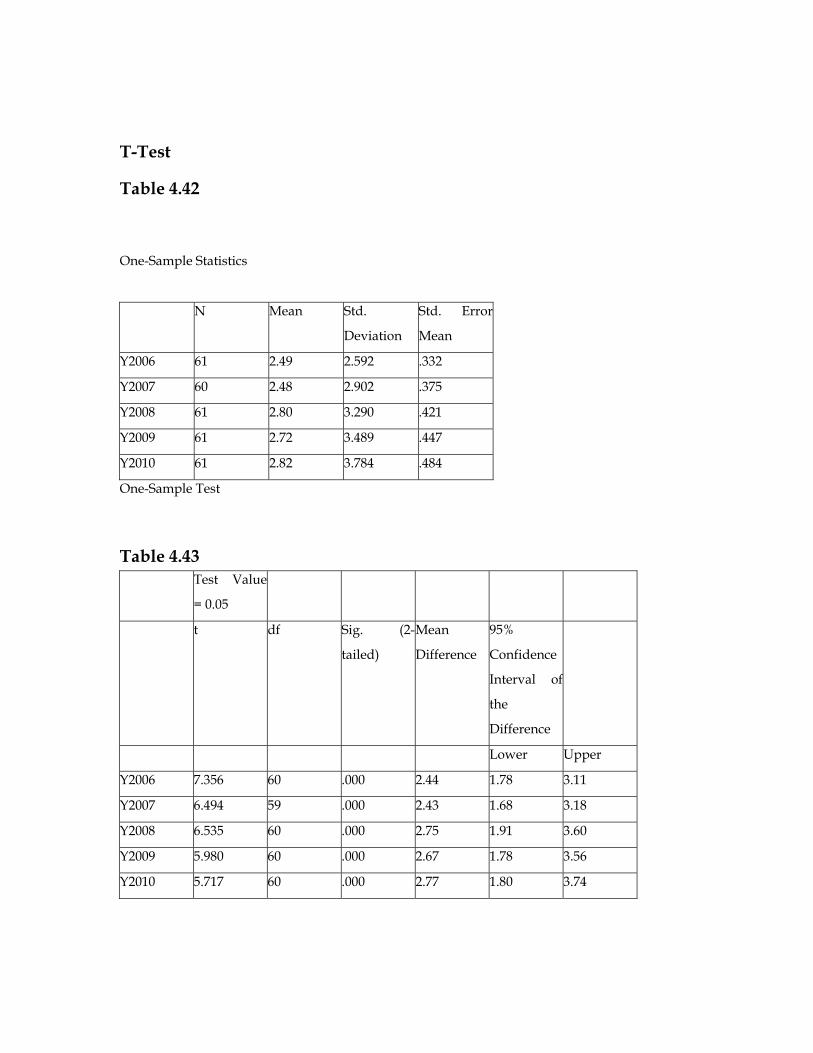
T-Test
Table 4.42
One-Sample Statistics
N Mean Std.
Deviation
Std. Error
Mean
Y2006 61 2.49 2.592 .332
Y2007 60 2.48 2.902 .375
Y2008 61 2.80 3.290 .421
Y2009 61 2.72 3.489 .447
Y2010 61 2.82 3.784 .484
One-Sample Test
Table 4.43 Test Value
= 0.05
t df Sig. (2-
tailed)
Mean
Difference
95%
Confidence
Interval of
the
Difference
Lower Upper
Y2006 7.356 60 .000 2.44 1.78 3.11
Y2007 6.494 59 .000 2.43 1.68 3.18
Y2008 6.535 60 .000 2.75 1.91 3.60
Y2009 5.980 60 .000 2.67 1.78 3.56
Y2010 5.717 60 .000 2.77 1.80 3.74
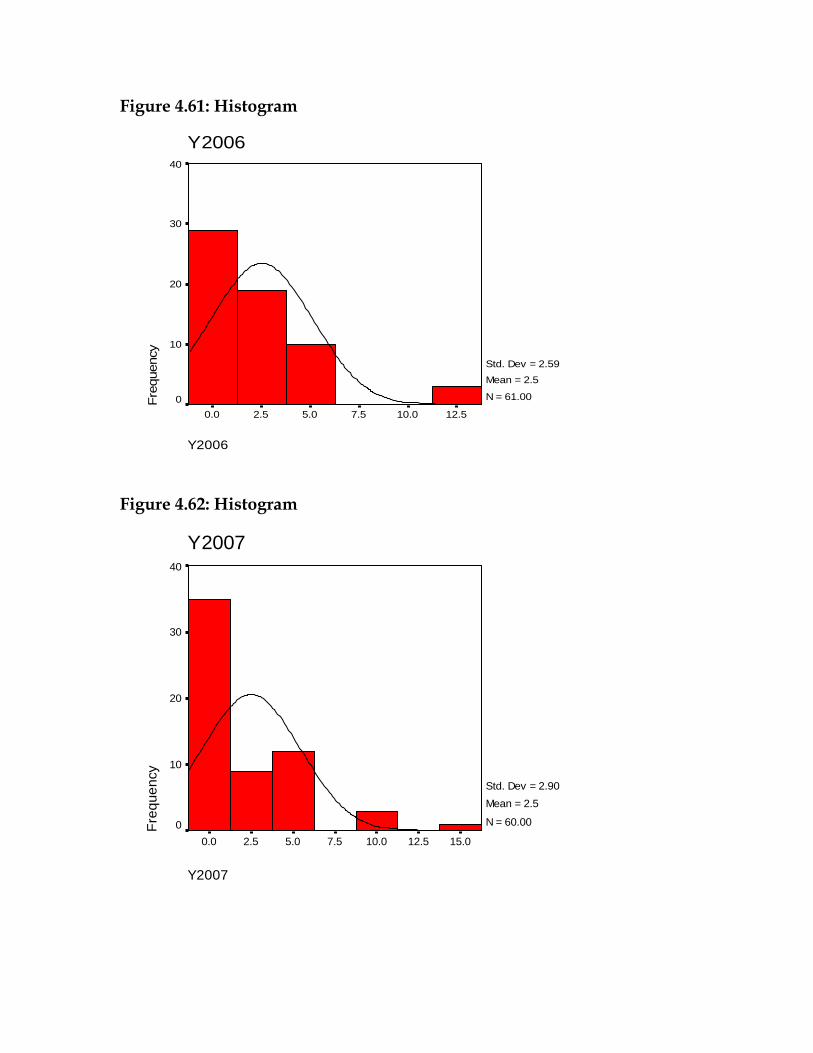
Figure 4.61: Histogram
Y2006
12.510.07.55.02.50.0
Y2006Fr
eque
ncy
40
30
20
10
0
Std. Dev = 2.59 Mean = 2.5
N = 61.00
Figure 4.62: Histogram
Y2007
15.012.510.07.55.02.50.0
Y2007
Freq
uenc
y
40
30
20
10
0
Std. Dev = 2.90 Mean = 2.5
N = 60.00
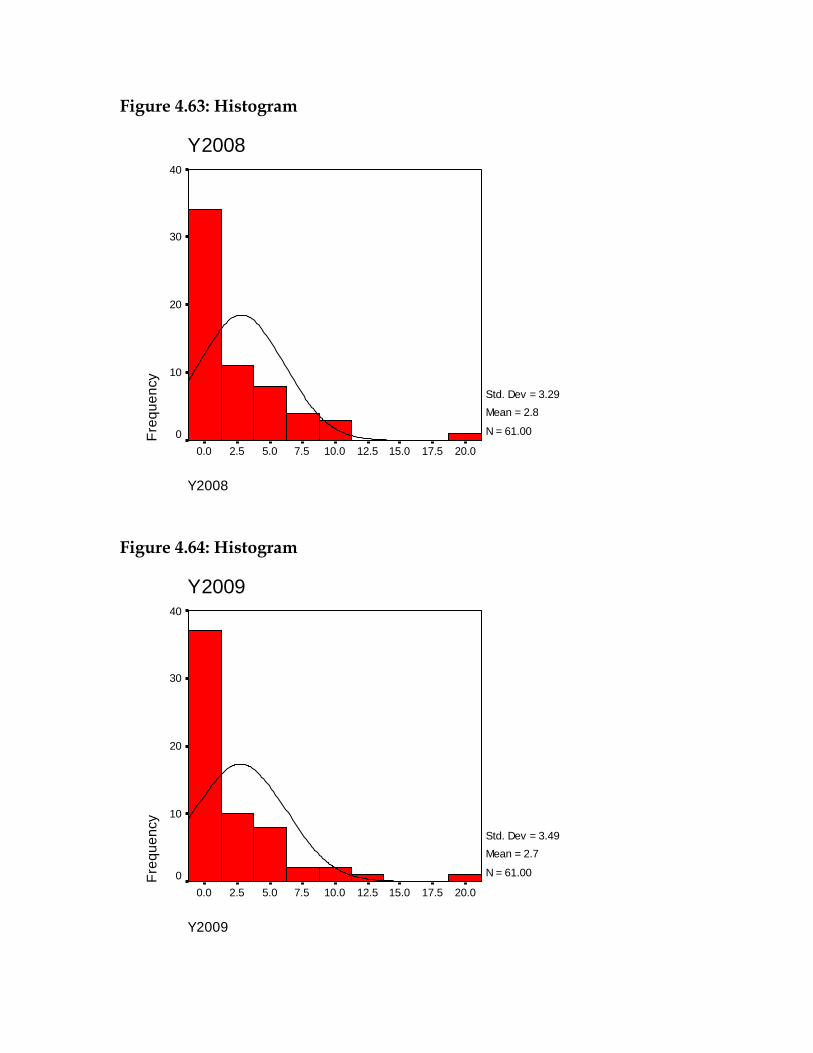
Figure 4.63: Histogram
Y2008
20.017.515.012.510.07.55.02.50.0
Y2008Fr
eque
ncy
40
30
20
10
0
Std. Dev = 3.29 Mean = 2.8
N = 61.00
Figure 4.64: Histogram
Y2009
20.017.515.012.510.07.55.02.50.0
Y2009
Freq
uenc
y
40
30
20
10
0
Std. Dev = 3.49 Mean = 2.7
N = 61.00
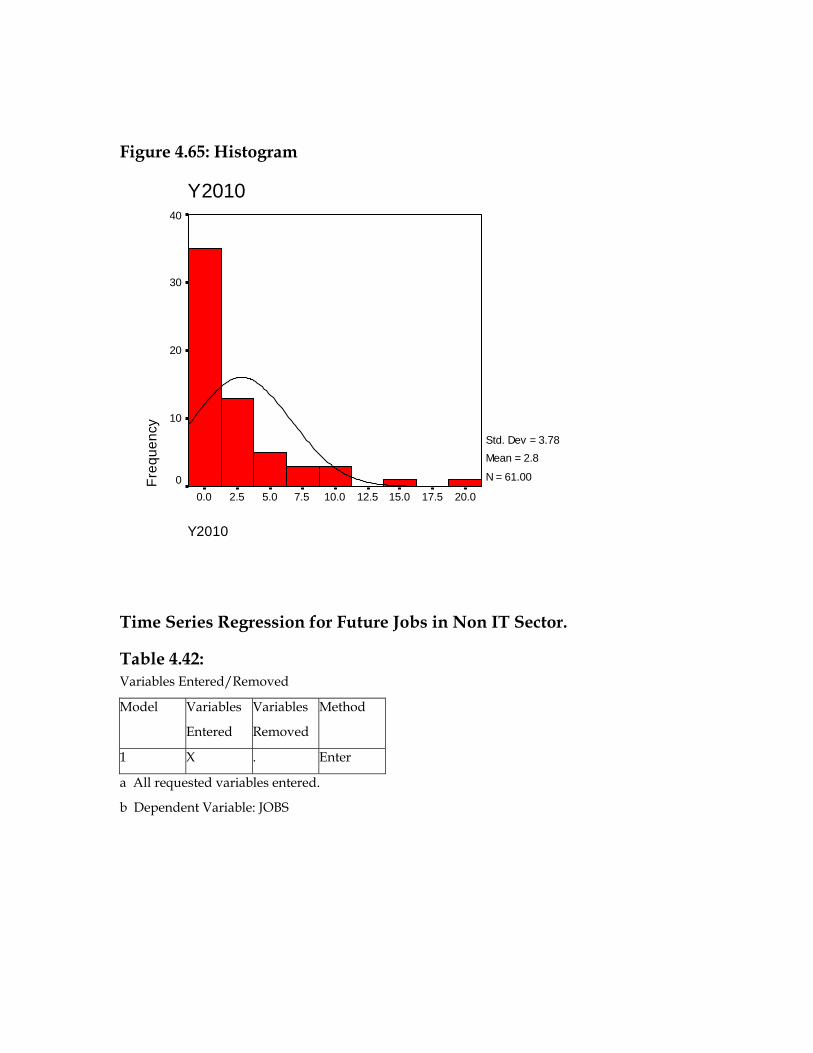
Figure 4.65: Histogram
Y2010
20.017.515.012.510.07.55.02.50.0
Y2010
Freq
uenc
y
40
30
20
10
0
Std. Dev = 3.78 Mean = 2.8
N = 61.00
Time Series Regression for Future Jobs in Non IT Sector.
Table 4.42: Variables Entered/Removed
Model Variables
Entered
Variables
Removed
Method
1 X . Enter
a All requested variables entered.
b Dependent Variable: JOBS
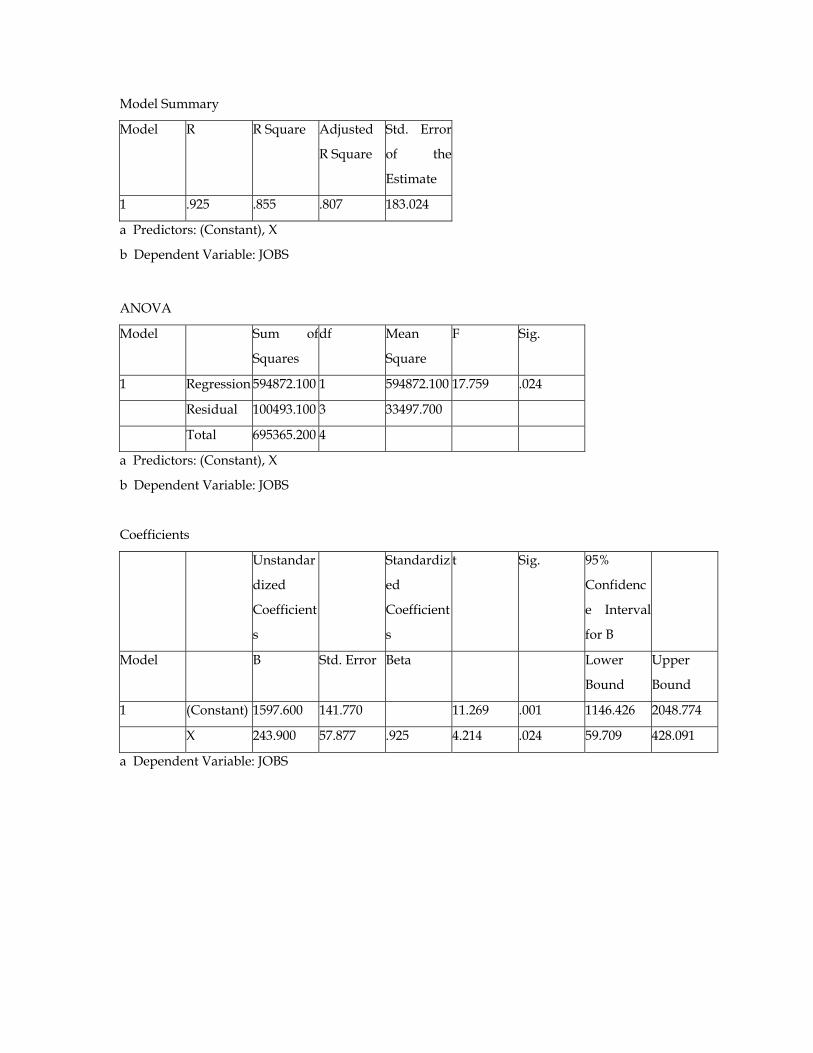
Model Summary
Model R R Square Adjusted
R Square
Std. Error
of the
Estimate
1 .925 .855 .807 183.024
a Predictors: (Constant), X
b Dependent Variable: JOBS
ANOVA
Model Sum of
Squares
df Mean
Square
F Sig.
1 Regression 594872.100 1 594872.100 17.759 .024
Residual 100493.100 3 33497.700
Total 695365.200 4
a Predictors: (Constant), X
b Dependent Variable: JOBS
Coefficients
Unstandar
dized
Coefficient
s
Standardiz
ed
Coefficient
s
t Sig. 95%
Confidenc
e Interval
for B
Model B Std. Error Beta Lower
Bound
Upper
Bound
1 (Constant) 1597.600 141.770 11.269 .001 1146.426 2048.774
X 243.900 57.877 .925 4.214 .024 59.709 428.091
a Dependent Variable: JOBS
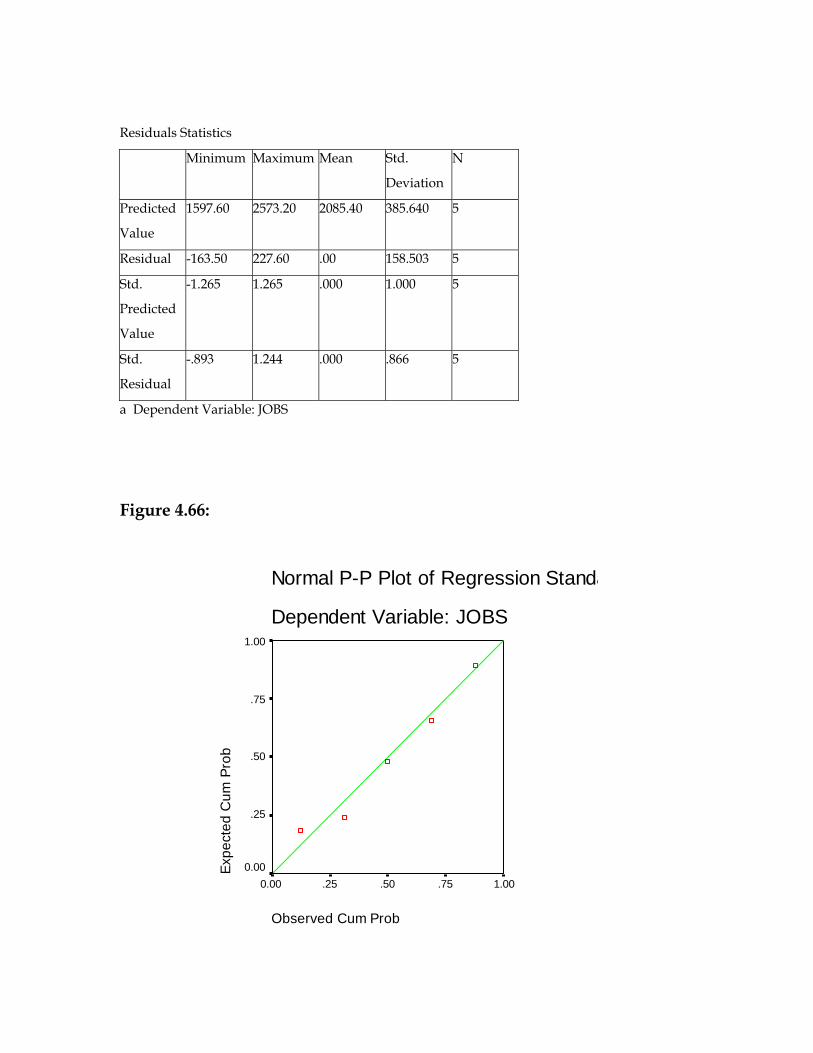
Residuals Statistics
Minimum Maximum Mean Std.
Deviation
N
Predicted
Value
1597.60 2573.20 2085.40 385.640 5
Residual -163.50 227.60 .00 158.503 5
Std.
Predicted
Value
-1.265 1.265 .000 1.000 5
Std.
Residual
-.893 1.244 .000 .866 5
a Dependent Variable: JOBS
Figure 4.66:
Normal P-P Plot of Regression Standa
Dependent Variable: JOBS
Observed Cum Prob
1.00.75.50.250.00
Expe
cted
Cum
Pro
b
1.00
.75
.50
.25
0.00
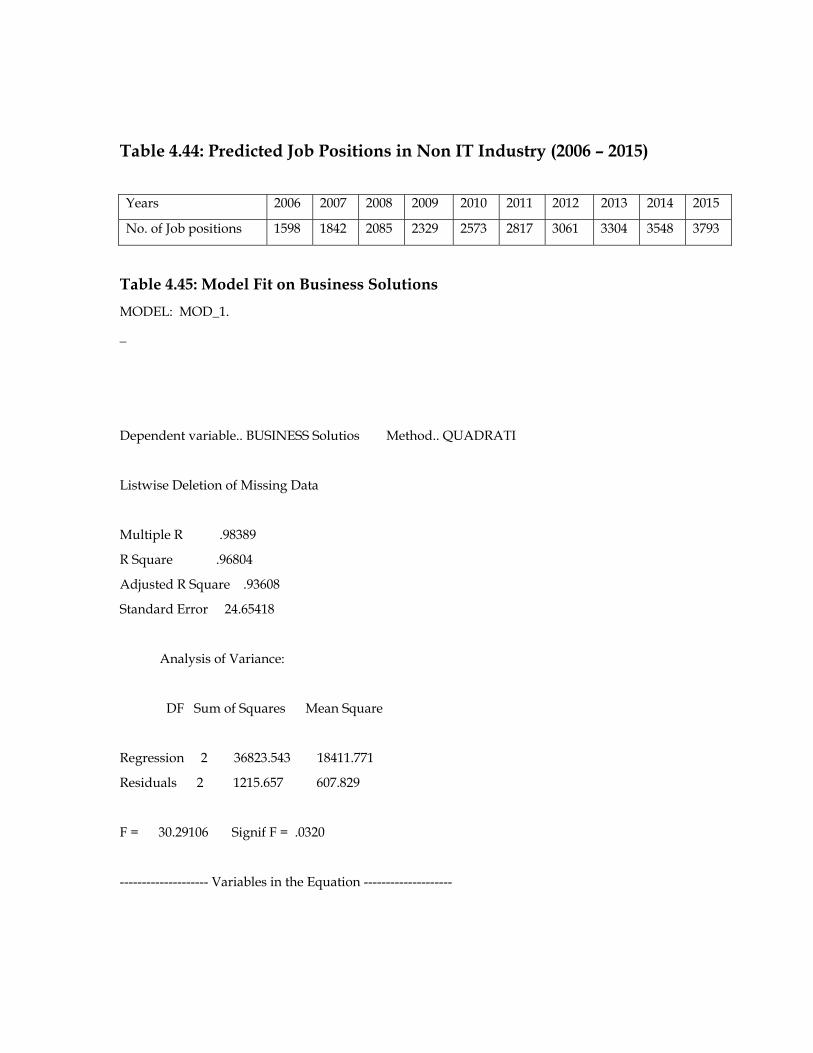
Table 4.44: Predicted Job Positions in Non IT Industry (2006 – 2015)
Years 2006 2007 2008 2009 2010 2011 2012 2013 2014 2015
No. of Job positions 1598 1842 2085 2329 2573 2817 3061 3304 3548 3793
Table 4.45: Model Fit on Business Solutions MODEL: MOD_1.
_
Dependent variable.. BUSINESS Solutios Method.. QUADRATI
Listwise Deletion of Missing Data
Multiple R .98389
R Square .96804
Adjusted R Square .93608
Standard Error 24.65418
Analysis of Variance:
DF Sum of Squares Mean Square
Regression 2 36823.543 18411.771
Residuals 2 1215.657 607.829
F = 30.29106 Signif F = .0320
-------------------- Variables in the Equation --------------------
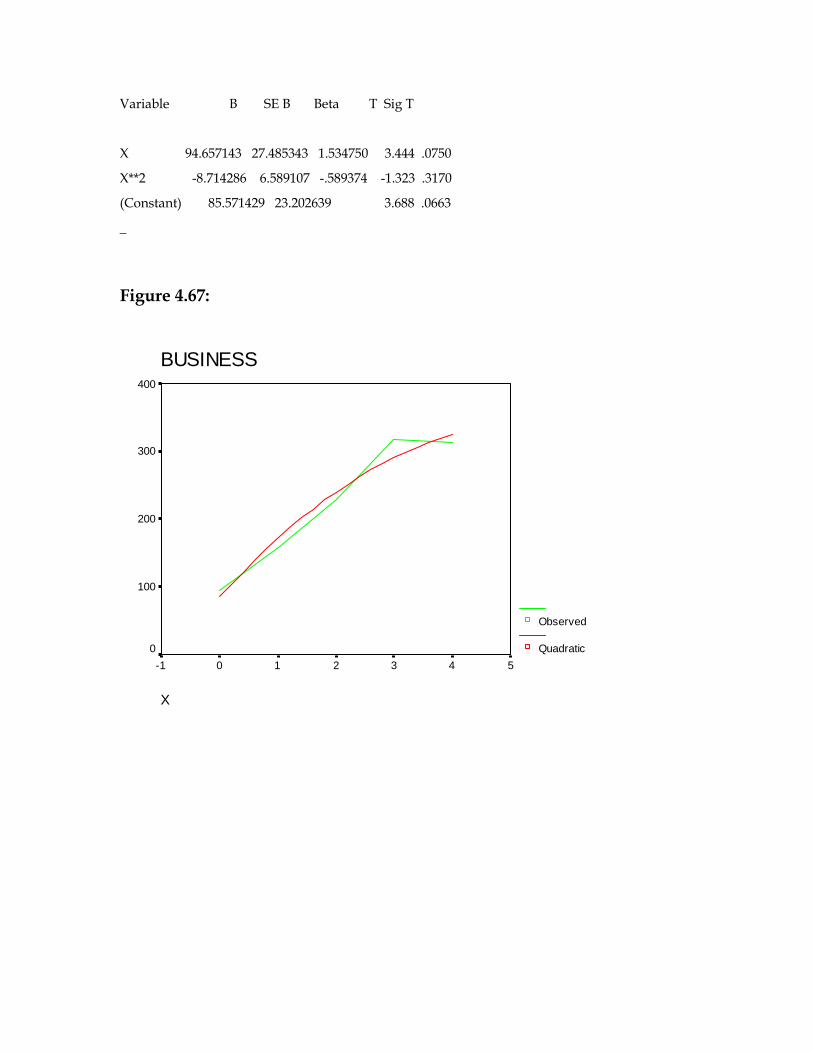
Variable B SE B Beta T Sig T
X 94.657143 27.485343 1.534750 3.444 .0750
X**2 -8.714286 6.589107 -.589374 -1.323 .3170
(Constant) 85.571429 23.202639 3.688 .0663
_
Figure 4.67:
BUSINESS
X
543210-1
400
300
200
100
0
Observed
Quadratic
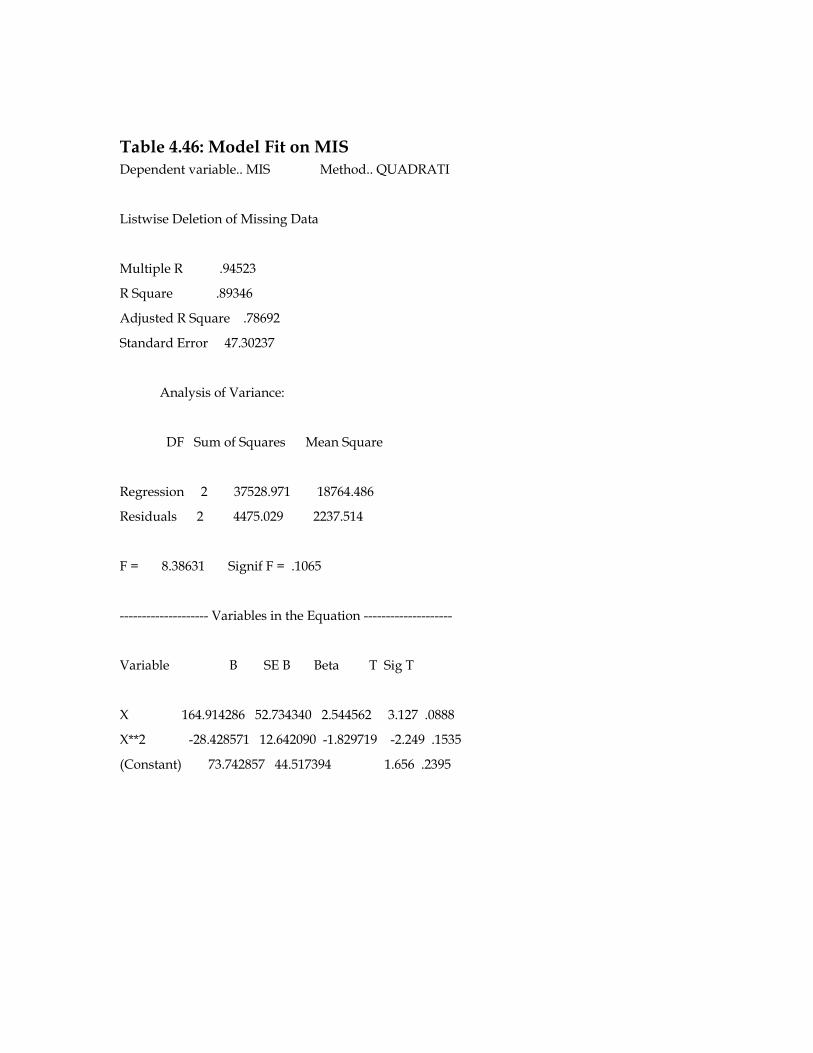
Table 4.46: Model Fit on MIS Dependent variable.. MIS Method.. QUADRATI
Listwise Deletion of Missing Data
Multiple R .94523
R Square .89346
Adjusted R Square .78692
Standard Error 47.30237
Analysis of Variance:
DF Sum of Squares Mean Square
Regression 2 37528.971 18764.486
Residuals 2 4475.029 2237.514
F = 8.38631 Signif F = .1065
-------------------- Variables in the Equation --------------------
Variable B SE B Beta T Sig T
X 164.914286 52.734340 2.544562 3.127 .0888
X**2 -28.428571 12.642090 -1.829719 -2.249 .1535
(Constant) 73.742857 44.517394 1.656 .2395
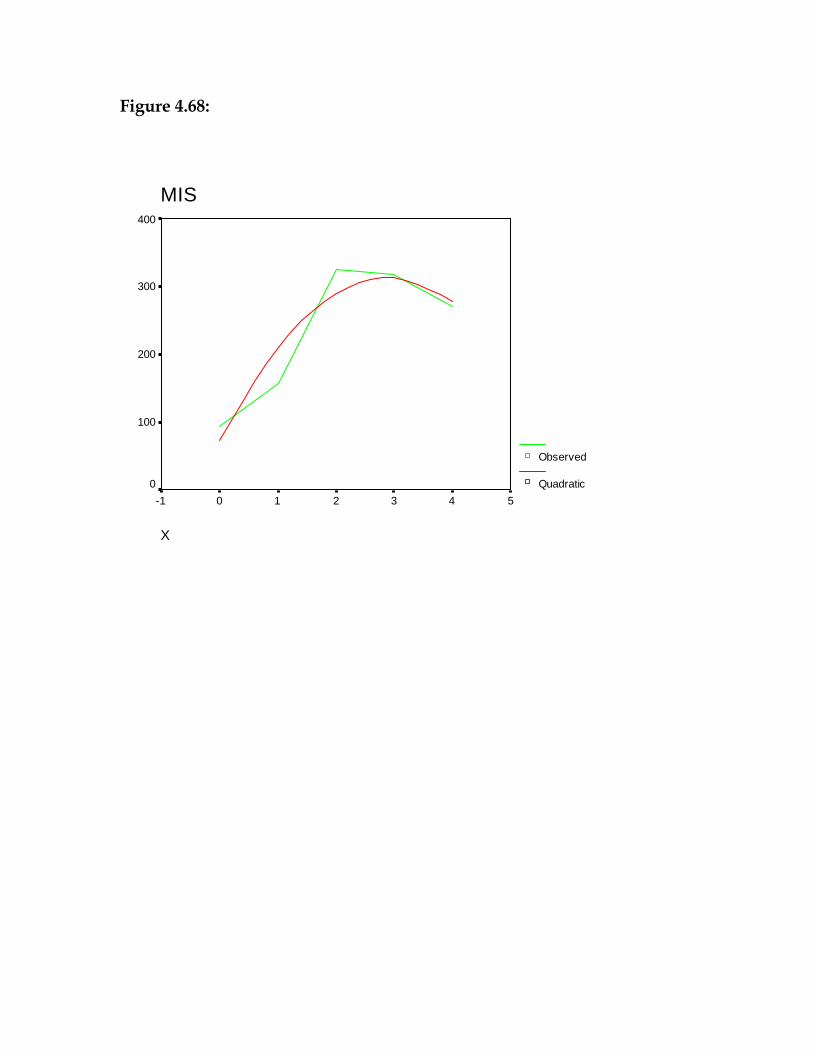
Figure 4.68:
MIS
X
543210-1
400
300
200
100
0
Observed
Quadratic
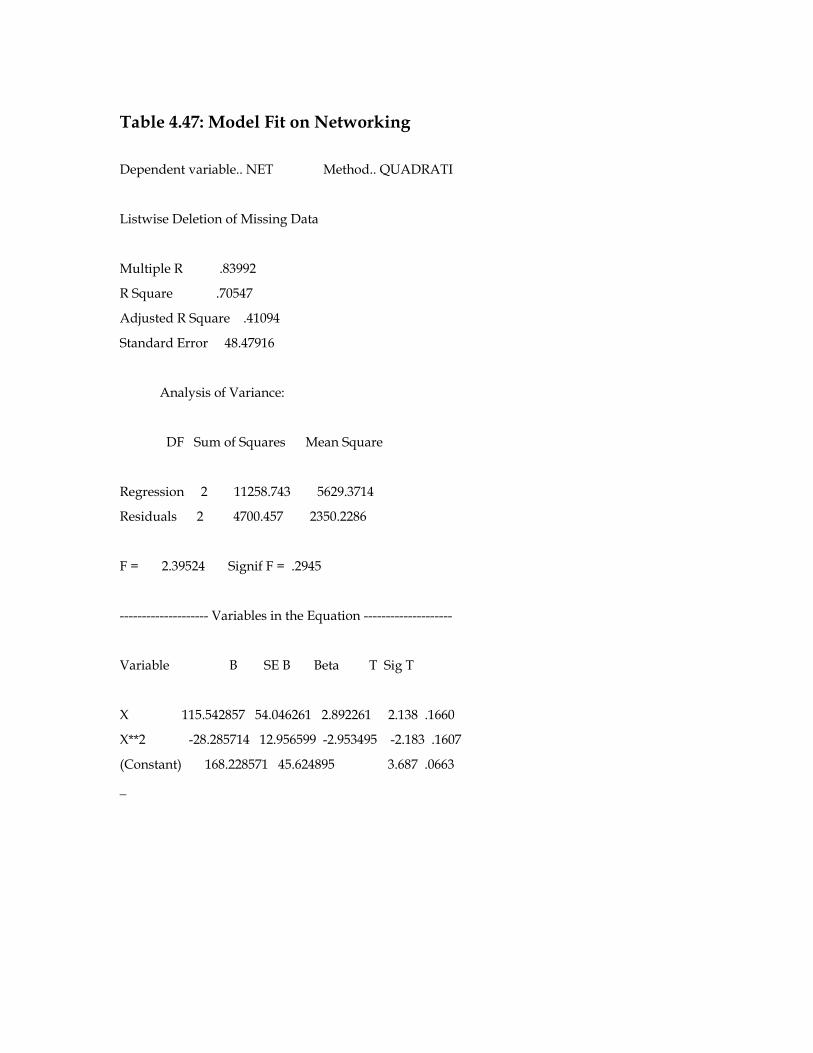
Table 4.47: Model Fit on Networking
Dependent variable.. NET Method.. QUADRATI
Listwise Deletion of Missing Data
Multiple R .83992
R Square .70547
Adjusted R Square .41094
Standard Error 48.47916
Analysis of Variance:
DF Sum of Squares Mean Square
Regression 2 11258.743 5629.3714
Residuals 2 4700.457 2350.2286
F = 2.39524 Signif F = .2945
-------------------- Variables in the Equation --------------------
Variable B SE B Beta T Sig T
X 115.542857 54.046261 2.892261 2.138 .1660
X**2 -28.285714 12.956599 -2.953495 -2.183 .1607
(Constant) 168.228571 45.624895 3.687 .0663
_
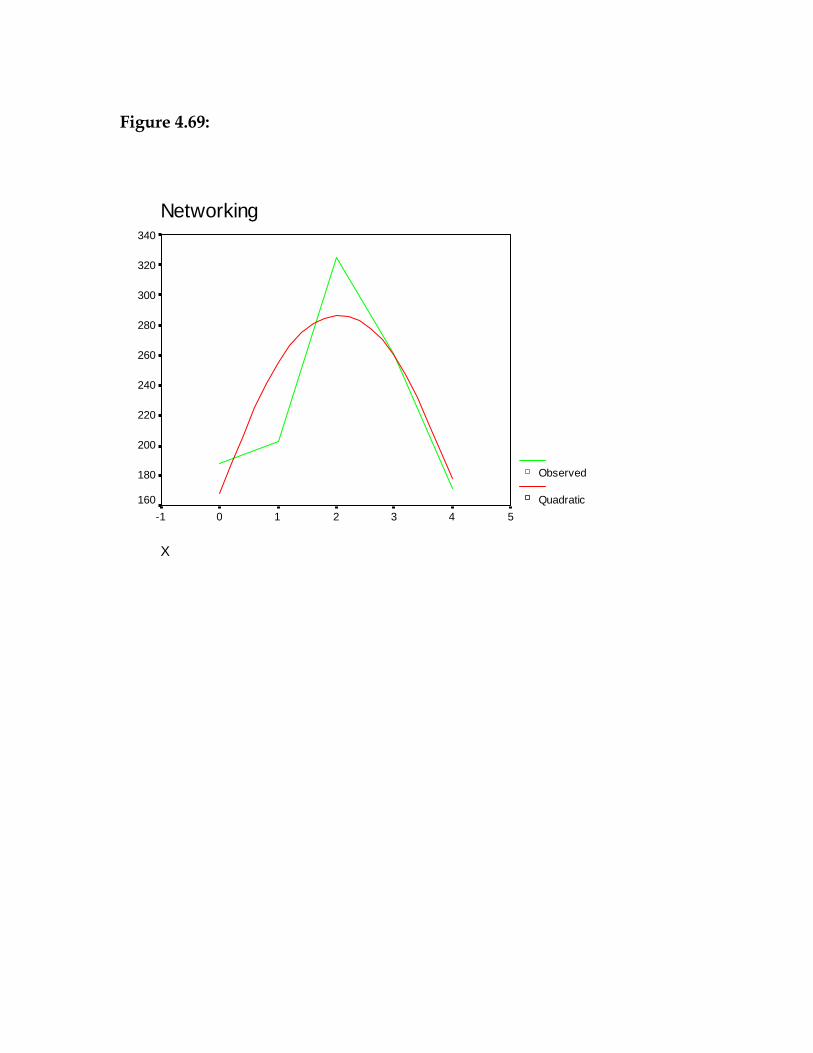
Figure 4.69:
Networking
X
543210-1
340
320
300
280
260
240
220
200
180
160
Observed
Quadratic
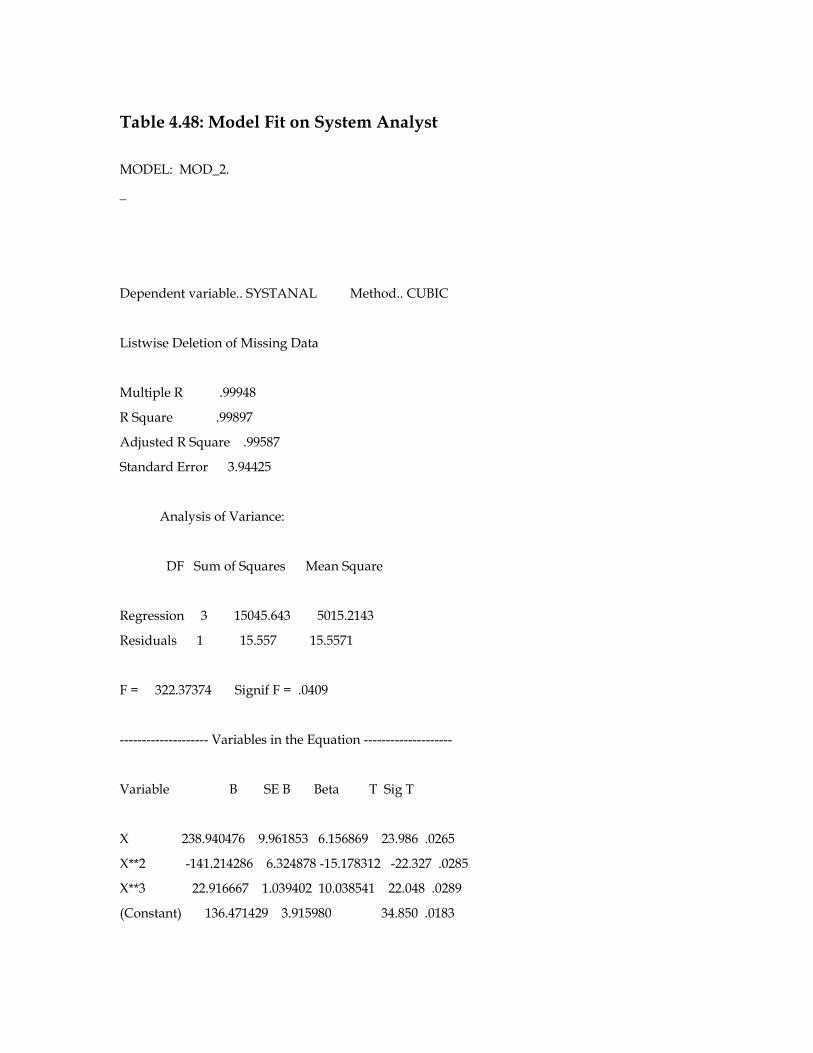
Table 4.48: Model Fit on System Analyst
MODEL: MOD_2.
_
Dependent variable.. SYSTANAL Method.. CUBIC
Listwise Deletion of Missing Data
Multiple R .99948
R Square .99897
Adjusted R Square .99587
Standard Error 3.94425
Analysis of Variance:
DF Sum of Squares Mean Square
Regression 3 15045.643 5015.2143
Residuals 1 15.557 15.5571
F = 322.37374 Signif F = .0409
-------------------- Variables in the Equation --------------------
Variable B SE B Beta T Sig T
X 238.940476 9.961853 6.156869 23.986 .0265
X**2 -141.214286 6.324878 -15.178312 -22.327 .0285
X**3 22.916667 1.039402 10.038541 22.048 .0289
(Constant) 136.471429 3.915980 34.850 .0183
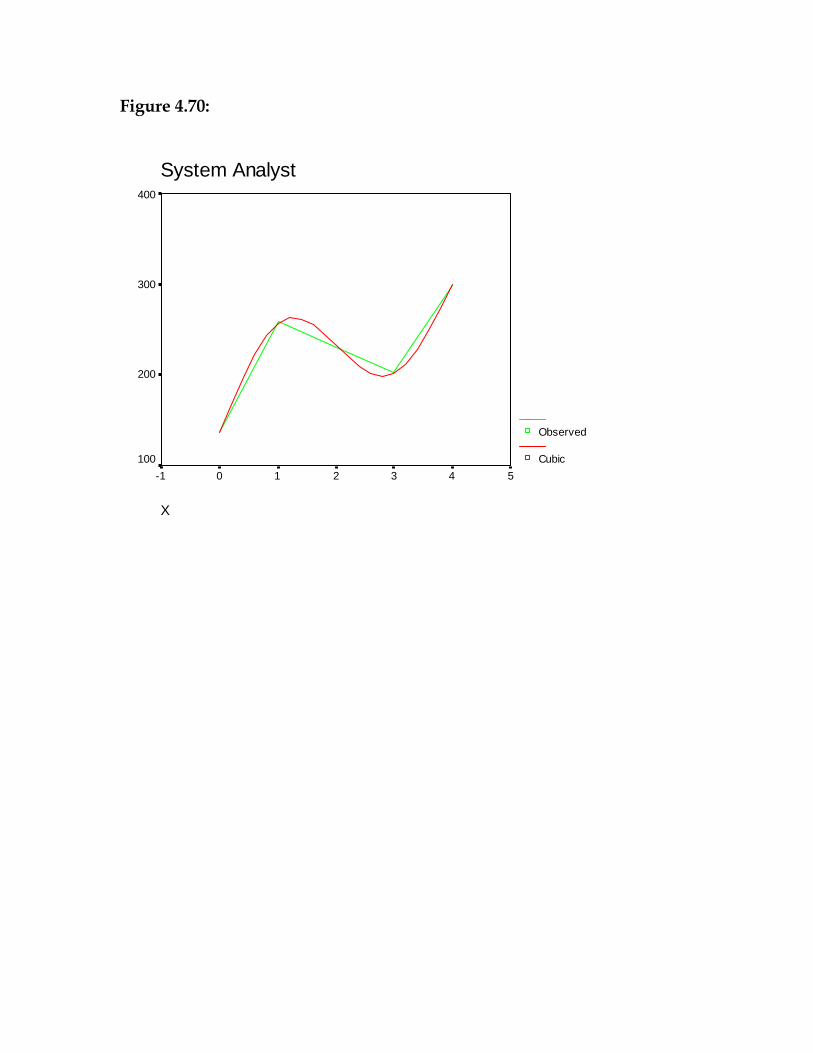
Figure 4.70:
System Analyst
X
543210-1
400
300
200
100
Observed
Cubic
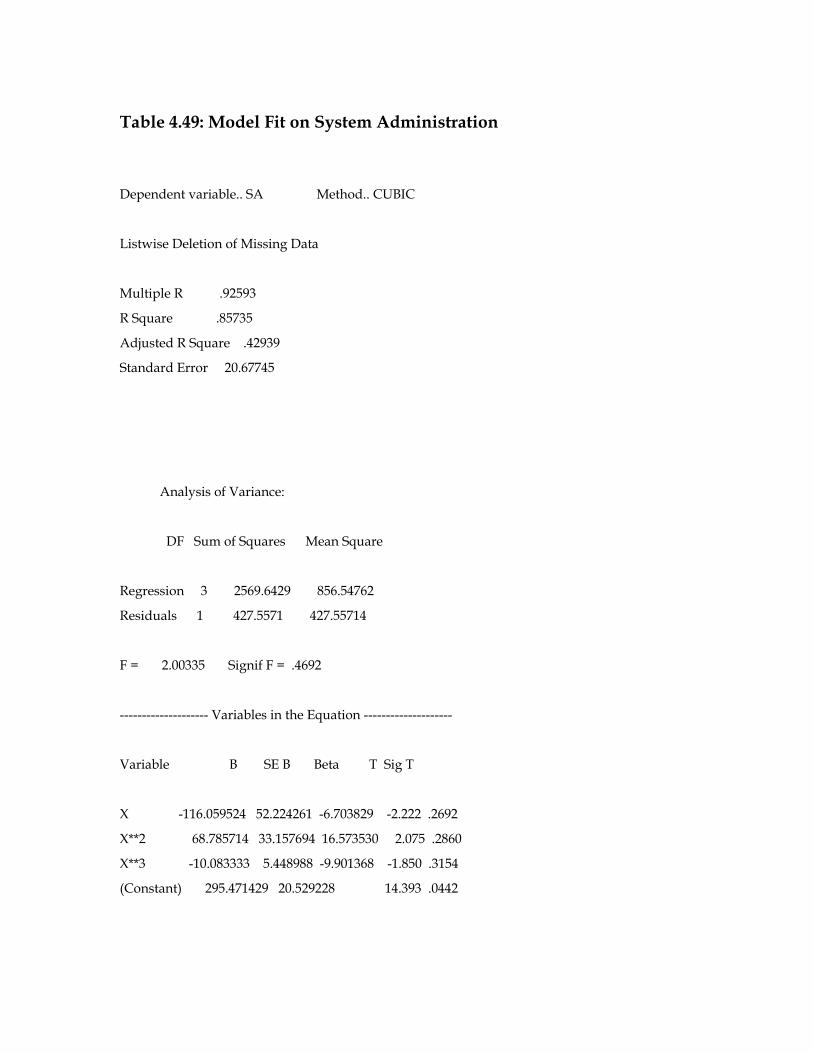
Table 4.49: Model Fit on System Administration
Dependent variable.. SA Method.. CUBIC
Listwise Deletion of Missing Data
Multiple R .92593
R Square .85735
Adjusted R Square .42939
Standard Error 20.67745
Analysis of Variance:
DF Sum of Squares Mean Square
Regression 3 2569.6429 856.54762
Residuals 1 427.5571 427.55714
F = 2.00335 Signif F = .4692
-------------------- Variables in the Equation --------------------
Variable B SE B Beta T Sig T
X -116.059524 52.224261 -6.703829 -2.222 .2692
X**2 68.785714 33.157694 16.573530 2.075 .2860
X**3 -10.083333 5.448988 -9.901368 -1.850 .3154
(Constant) 295.471429 20.529228 14.393 .0442
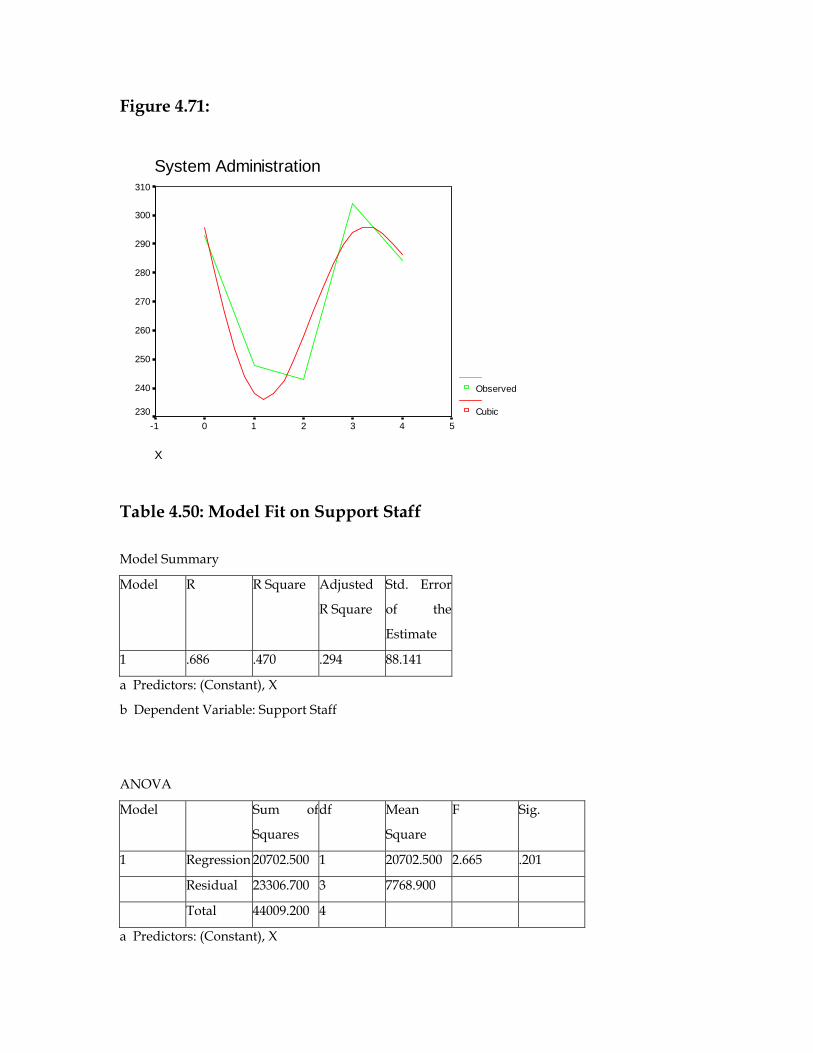
Figure 4.71:
System Administration
X
543210-1
310
300
290
280
270
260
250
240
230
Observed
Cubic
Table 4.50: Model Fit on Support Staff
Model Summary
Model R R Square Adjusted
R Square
Std. Error
of the
Estimate
1 .686 .470 .294 88.141
a Predictors: (Constant), X
b Dependent Variable: Support Staff
ANOVA
Model Sum of
Squares
df Mean
Square
F Sig.
1 Regression 20702.500 1 20702.500 2.665 .201
Residual 23306.700 3 7768.900
Total 44009.200 4
a Predictors: (Constant), X
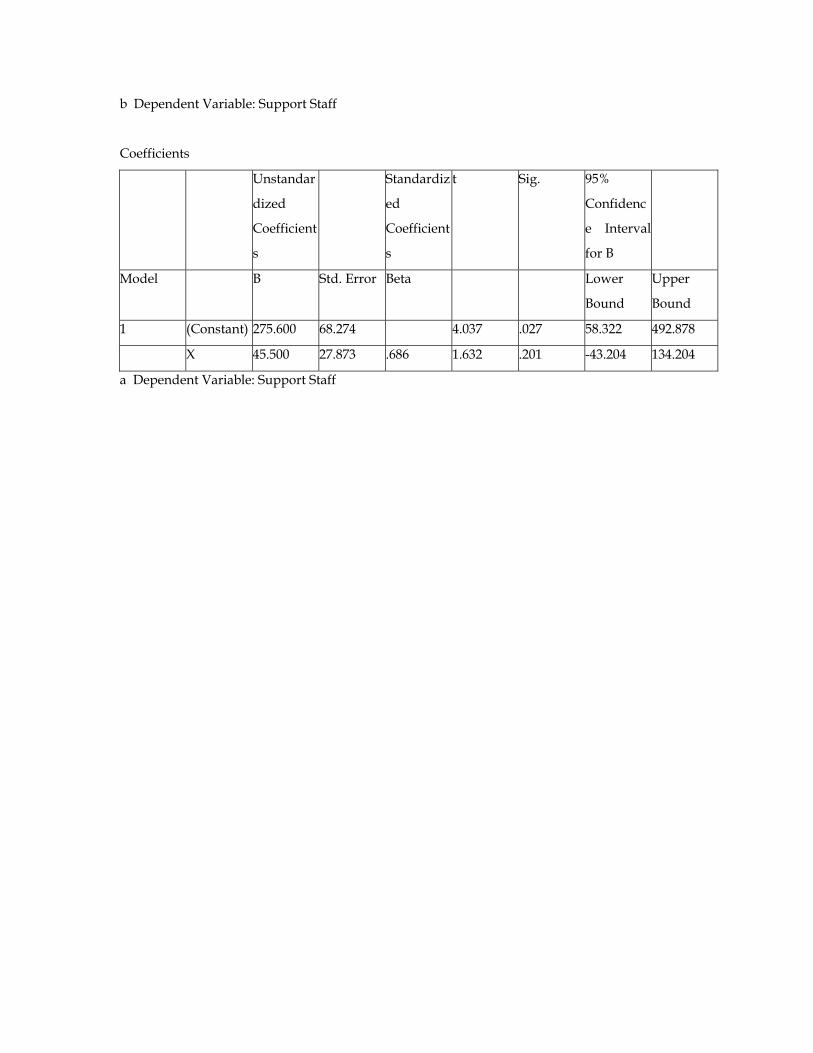
b Dependent Variable: Support Staff
Coefficients
Unstandar
dized
Coefficient
s
Standardiz
ed
Coefficient
s
t Sig. 95%
Confidenc
e Interval
for B
Model B Std. Error Beta Lower
Bound
Upper
Bound
1 (Constant) 275.600 68.274 4.037 .027 58.322 492.878
X 45.500 27.873 .686 1.632 .201 -43.204 134.204
a Dependent Variable: Support Staff
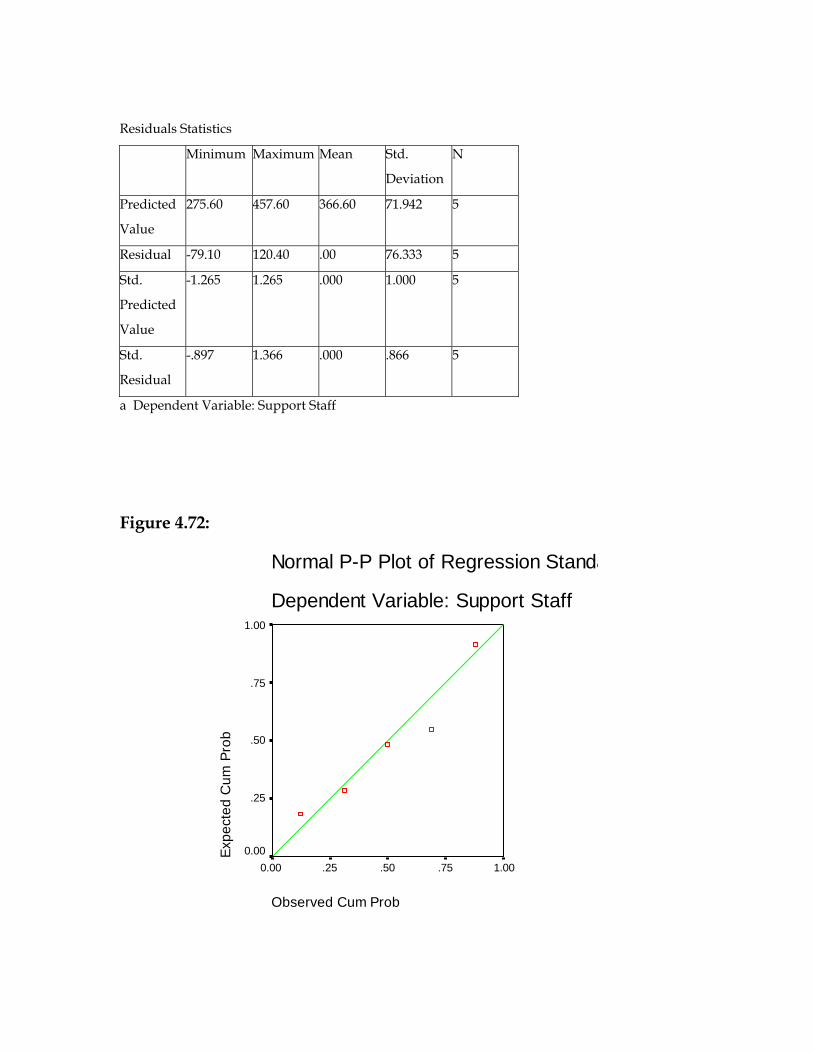
Residuals Statistics
Minimum Maximum Mean Std.
Deviation
N
Predicted
Value
275.60 457.60 366.60 71.942 5
Residual -79.10 120.40 .00 76.333 5
Std.
Predicted
Value
-1.265 1.265 .000 1.000 5
Std.
Residual
-.897 1.366 .000 .866 5
a Dependent Variable: Support Staff
Figure 4.72:
Normal P-P Plot of Regression Standa
Dependent Variable: Support Staff
Observed Cum Prob
1.00.75.50.250.00
Expe
cted
Cum
Pro
b
1.00
.75
.50
.25
0.00
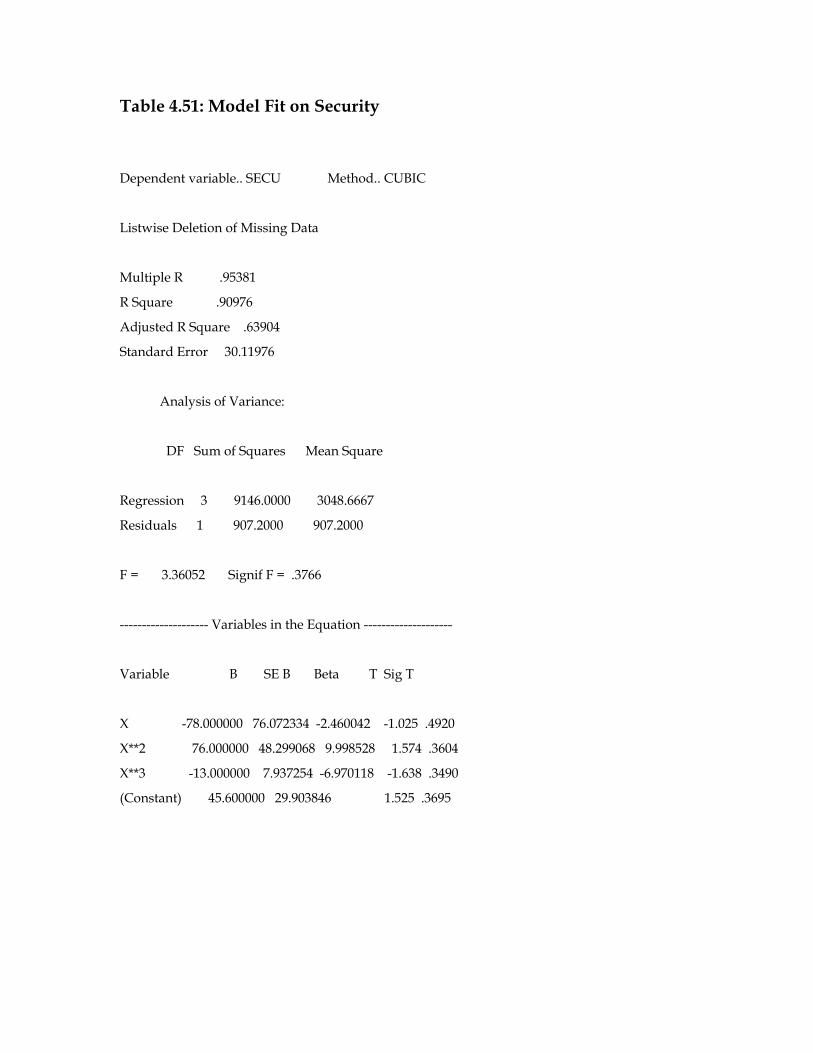
Table 4.51: Model Fit on Security
Dependent variable.. SECU Method.. CUBIC
Listwise Deletion of Missing Data
Multiple R .95381
R Square .90976
Adjusted R Square .63904
Standard Error 30.11976
Analysis of Variance:
DF Sum of Squares Mean Square
Regression 3 9146.0000 3048.6667
Residuals 1 907.2000 907.2000
F = 3.36052 Signif F = .3766
-------------------- Variables in the Equation --------------------
Variable B SE B Beta T Sig T
X -78.000000 76.072334 -2.460042 -1.025 .4920
X**2 76.000000 48.299068 9.998528 1.574 .3604
X**3 -13.000000 7.937254 -6.970118 -1.638 .3490
(Constant) 45.600000 29.903846 1.525 .3695
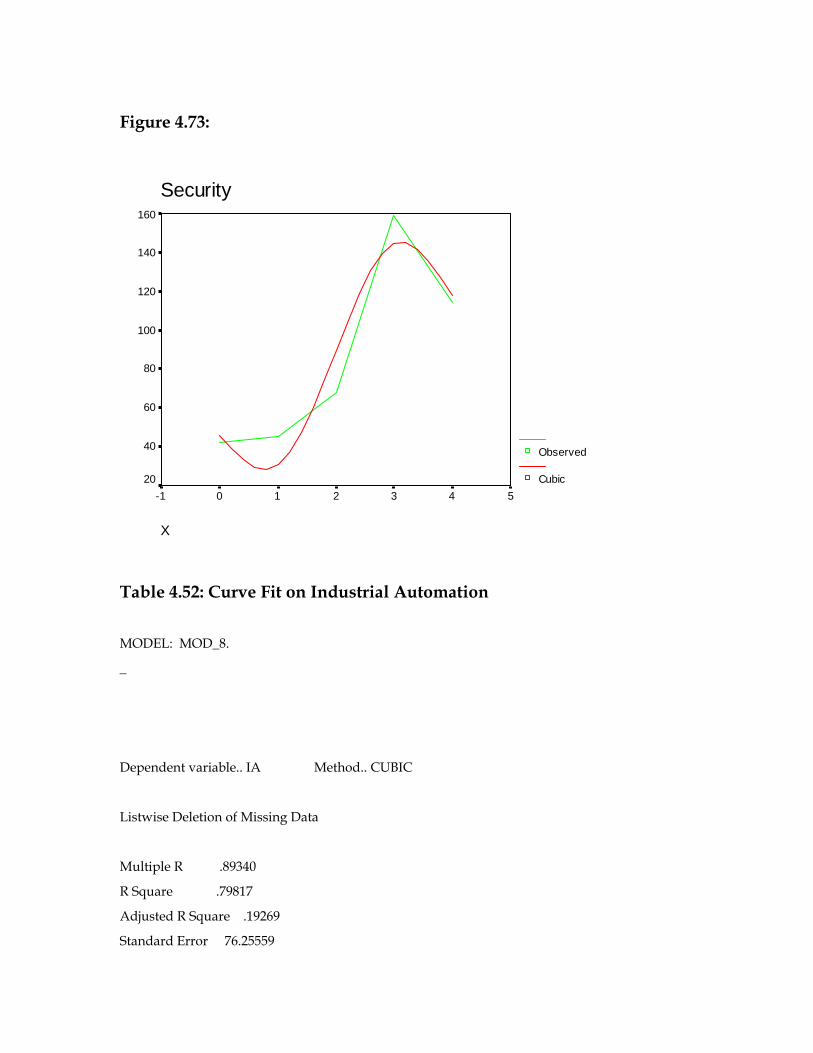
Figure 4.73:
Security
X
543210-1
160
140
120
100
80
60
40
20
Observed
Cubic
Table 4.52: Curve Fit on Industrial Automation MODEL: MOD_8.
_
Dependent variable.. IA Method.. CUBIC
Listwise Deletion of Missing Data
Multiple R .89340
R Square .79817
Adjusted R Square .19269
Standard Error 76.25559
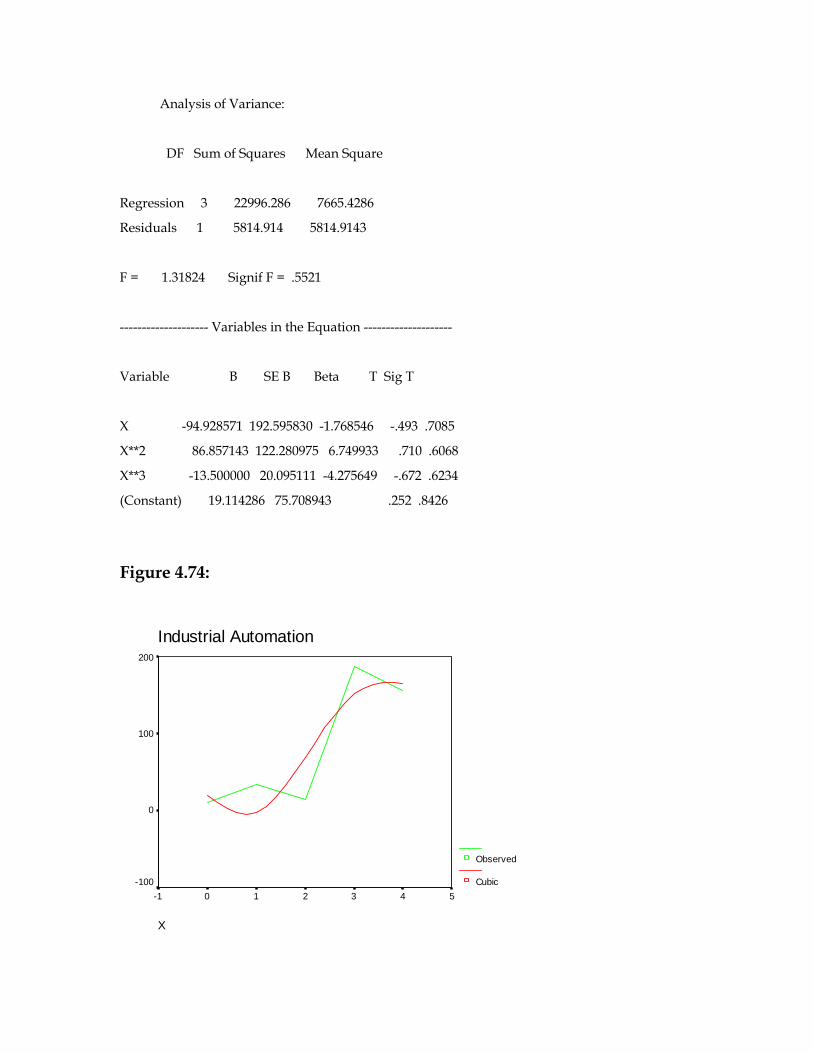
Analysis of Variance:
DF Sum of Squares Mean Square
Regression 3 22996.286 7665.4286
Residuals 1 5814.914 5814.9143
F = 1.31824 Signif F = .5521
-------------------- Variables in the Equation --------------------
Variable B SE B Beta T Sig T
X -94.928571 192.595830 -1.768546 -.493 .7085
X**2 86.857143 122.280975 6.749933 .710 .6068
X**3 -13.500000 20.095111 -4.275649 -.672 .6234
(Constant) 19.114286 75.708943 .252 .8426
Figure 4.74:
Industrial Automation
X
543210-1
200
100
0
-100
Observed
Cubic
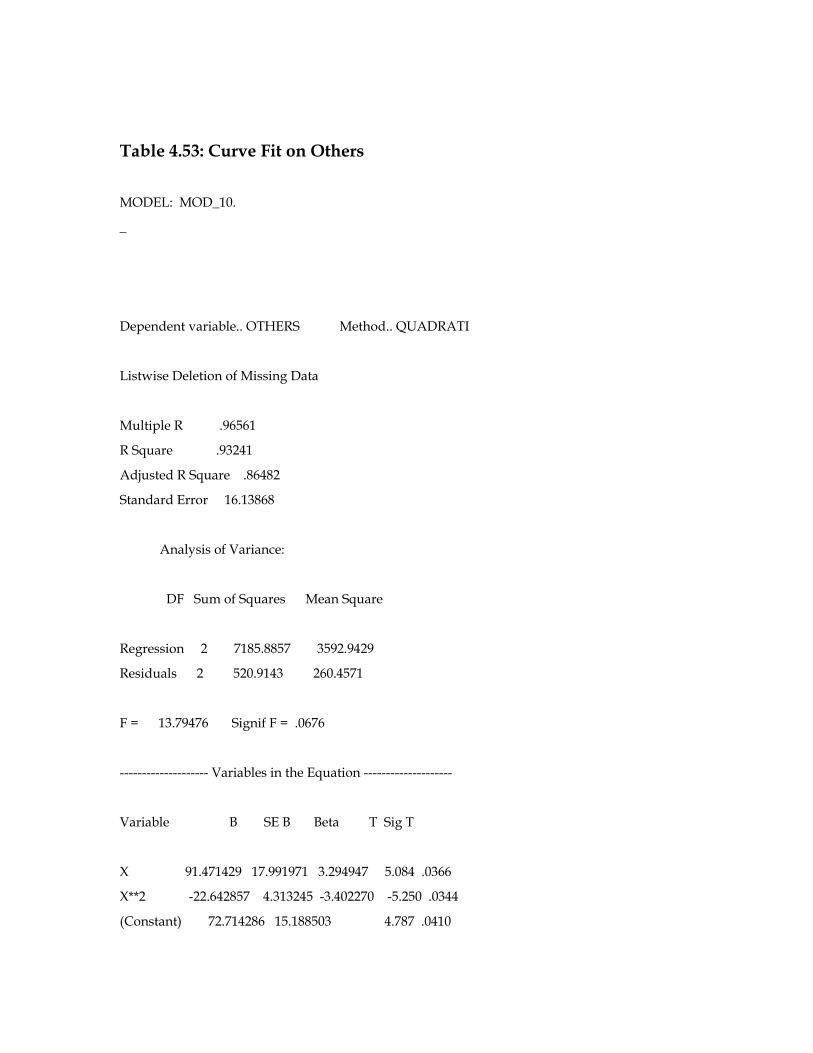
Table 4.53: Curve Fit on Others MODEL: MOD_10.
_
Dependent variable.. OTHERS Method.. QUADRATI
Listwise Deletion of Missing Data
Multiple R .96561
R Square .93241
Adjusted R Square .86482
Standard Error 16.13868
Analysis of Variance:
DF Sum of Squares Mean Square
Regression 2 7185.8857 3592.9429
Residuals 2 520.9143 260.4571
F = 13.79476 Signif F = .0676
-------------------- Variables in the Equation --------------------
Variable B SE B Beta T Sig T
X 91.471429 17.991971 3.294947 5.084 .0366
X**2 -22.642857 4.313245 -3.402270 -5.250 .0344
(Constant) 72.714286 15.188503 4.787 .0410
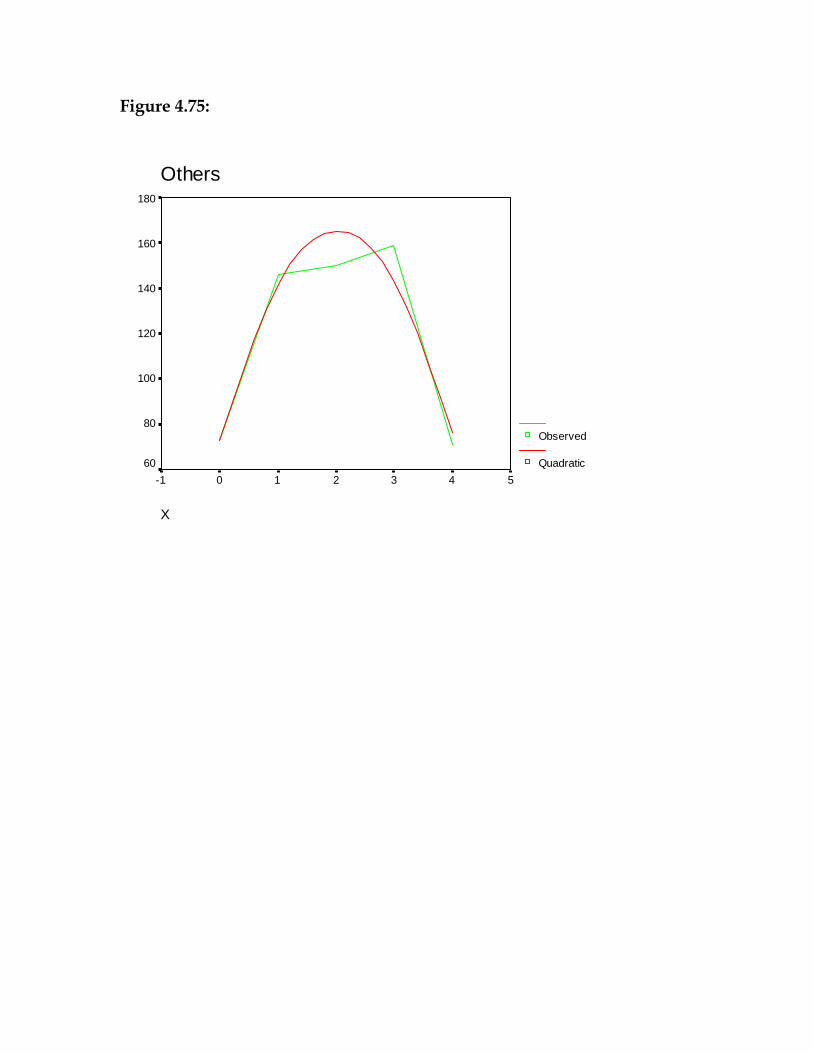
Figure 4.75:
Others
X
543210-1
180
160
140
120
100
80
60
Observed
Quadratic
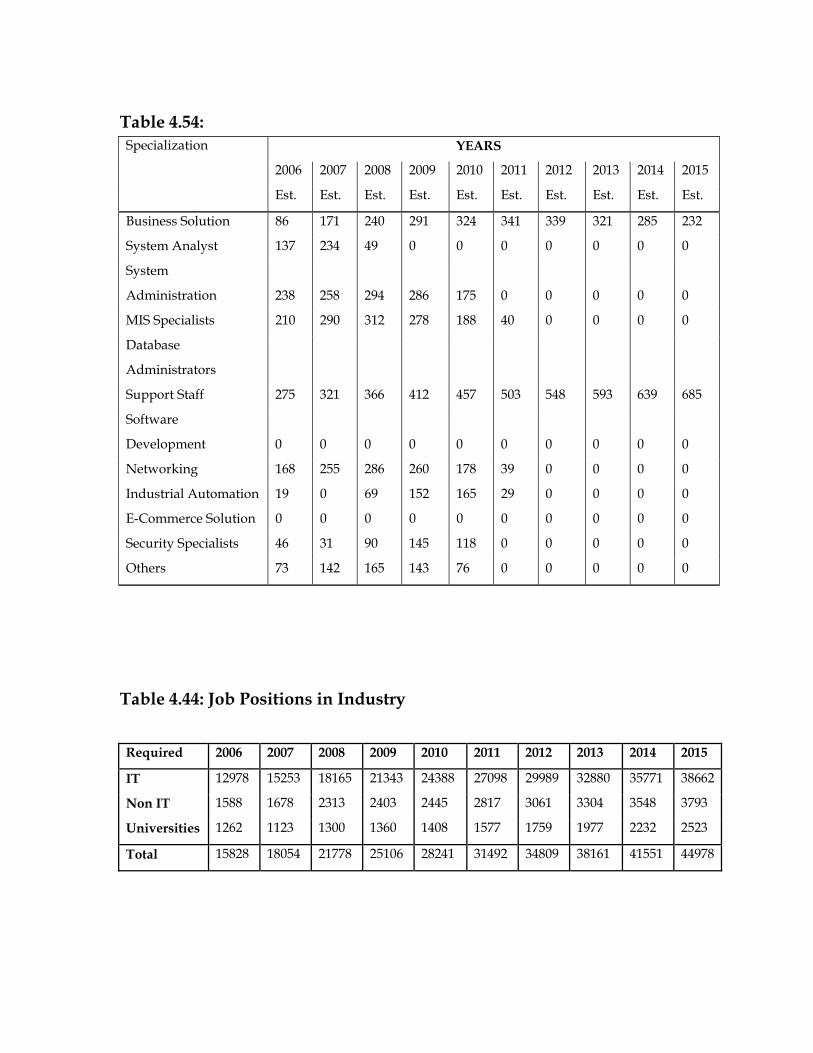
Table 4.54: Specialization YEARS
2006 2007 2008 2009 2010 2011 2012 2013 2014 2015
Est. Est. Est. Est. Est. Est. Est. Est. Est. Est.
Business Solution 86 171 240 291 324 341 339 321 285 232
System Analyst 137 234 49 0 0 0 0 0 0 0
System
Administration 238 258 294 286 175 0 0 0 0 0
MIS Specialists 210 290 312 278 188 40 0 0 0 0
Database
Administrators
Support Staff 275 321 366 412 457 503 548 593 639 685
Software
Development 0 0 0 0 0 0 0 0 0 0
Networking 168 255 286 260 178 39 0 0 0 0
Industrial Automation 19 0 69 152 165 29 0 0 0 0
E-Commerce Solution 0 0 0 0 0 0 0 0 0 0
Security Specialists 46 31 90 145 118 0 0 0 0 0
Others 73 142 165 143 76 0 0 0 0 0
Table 4.44: Job Positions in Industry
Required 2006 2007 2008 2009 2010 2011 2012 2013 2014 2015
IT 12978 15253 18165 21343 24388 27098 29989 32880 35771 38662
Non IT 1588 1678 2313 2403 2445 2817 3061 3304 3548 3793
Universities 1262 1123 1300 1360 1408 1577 1759 1977 2232 2523
Total 15828 18054 21778 25106 28241 31492 34809 38161 41551 44978
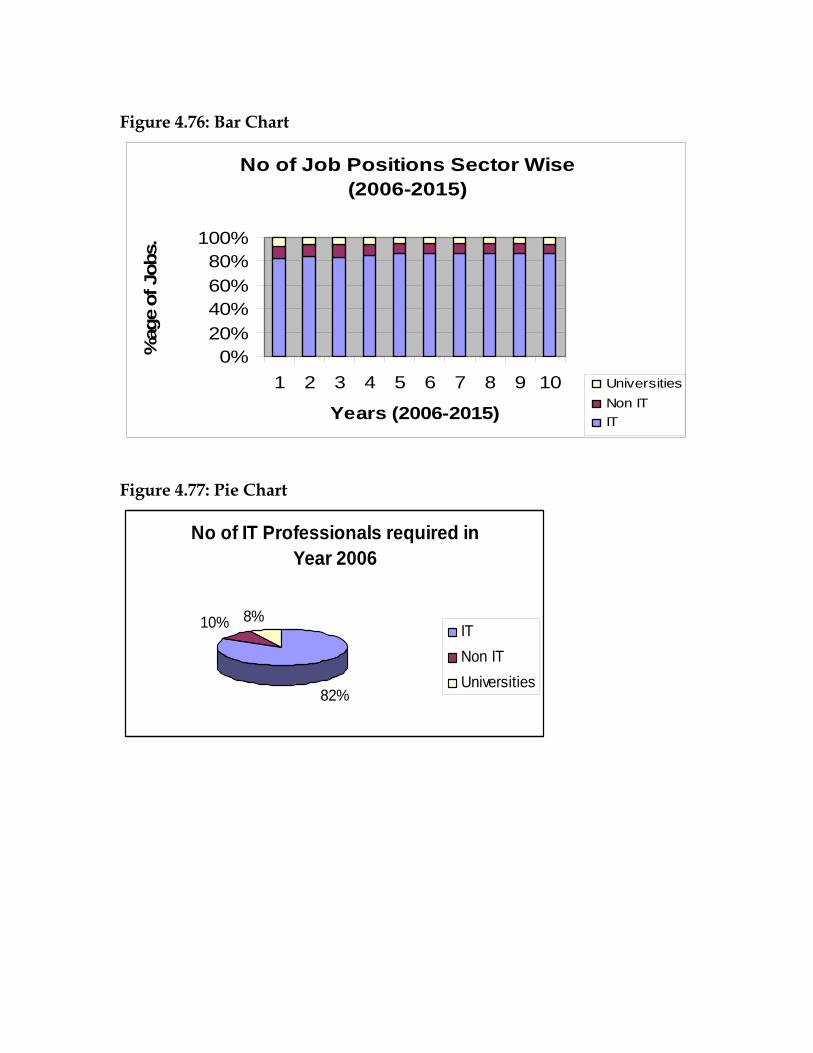
Figure 4.76: Bar Chart
Figure 4.77: Pie Chart
No of IT Professionals required in Year 2006
82%
10% 8%ITNon ITUniversities
No of Job Positions Sector Wise (2006-2015)
0%20%40%60%80%
100%
1 2 3 4 5 6 7 8 9 10
Years (2006-2015)
%ag
e of
Job
s.
UniversitiesNon ITIT
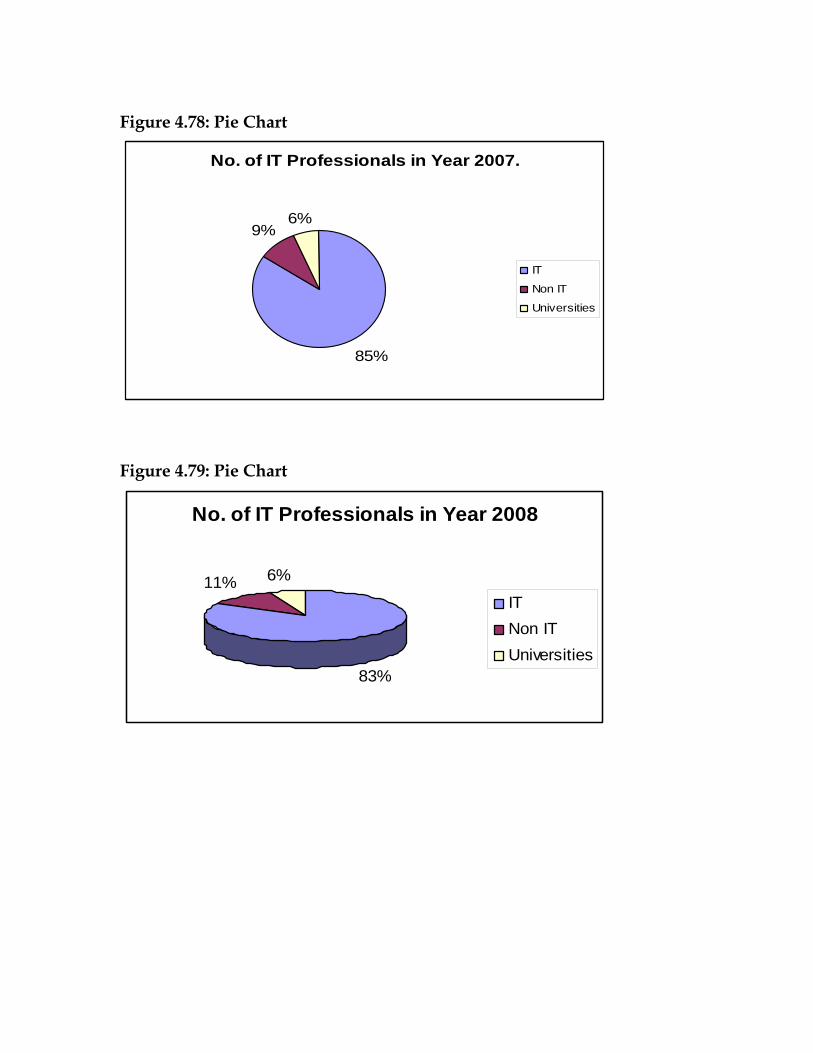
Figure 4.78: Pie Chart
No. of IT Professionals in Year 2007.
85%
9%6%
IT
Non IT
Universities
Figure 4.79: Pie Chart
No. of IT Professionals in Year 2008
83%
11% 6%
ITNon ITUniversities
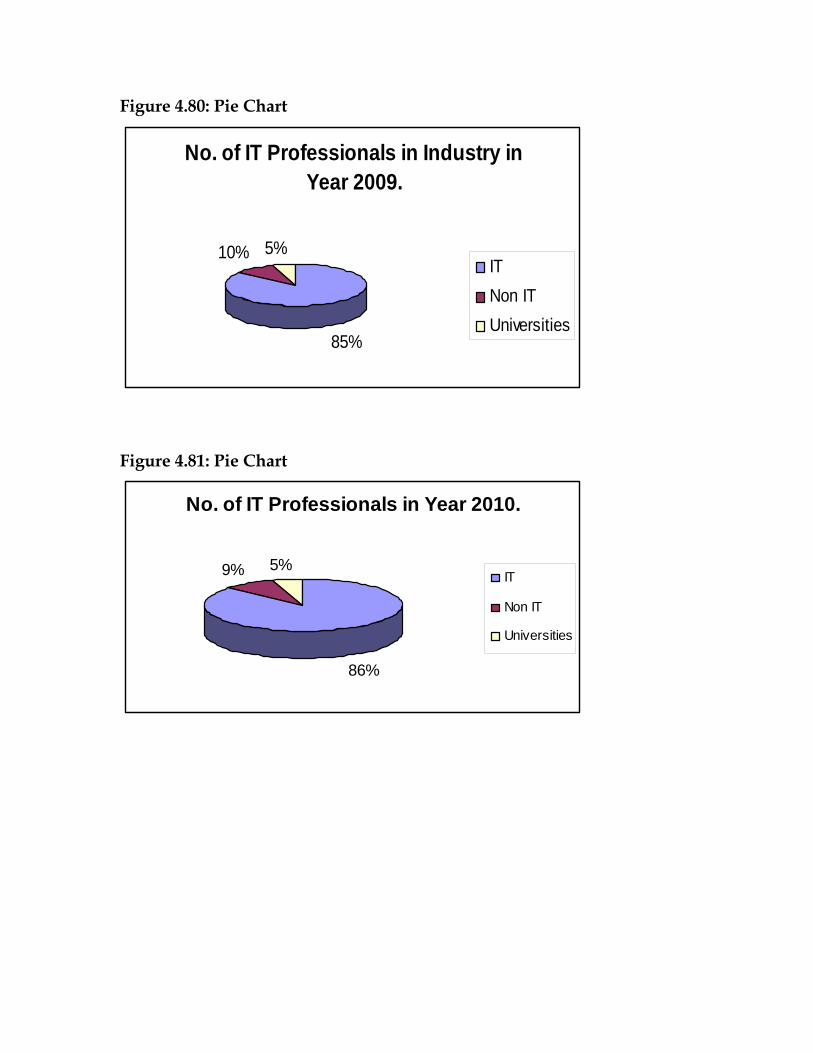
Figure 4.80: Pie Chart
No. of IT Professionals in Industry in Year 2009.
85%
10% 5%ITNon ITUniversities
Figure 4.81: Pie Chart
No. of IT Professionals in Year 2010.
86%
9% 5%IT
Non IT
Universities
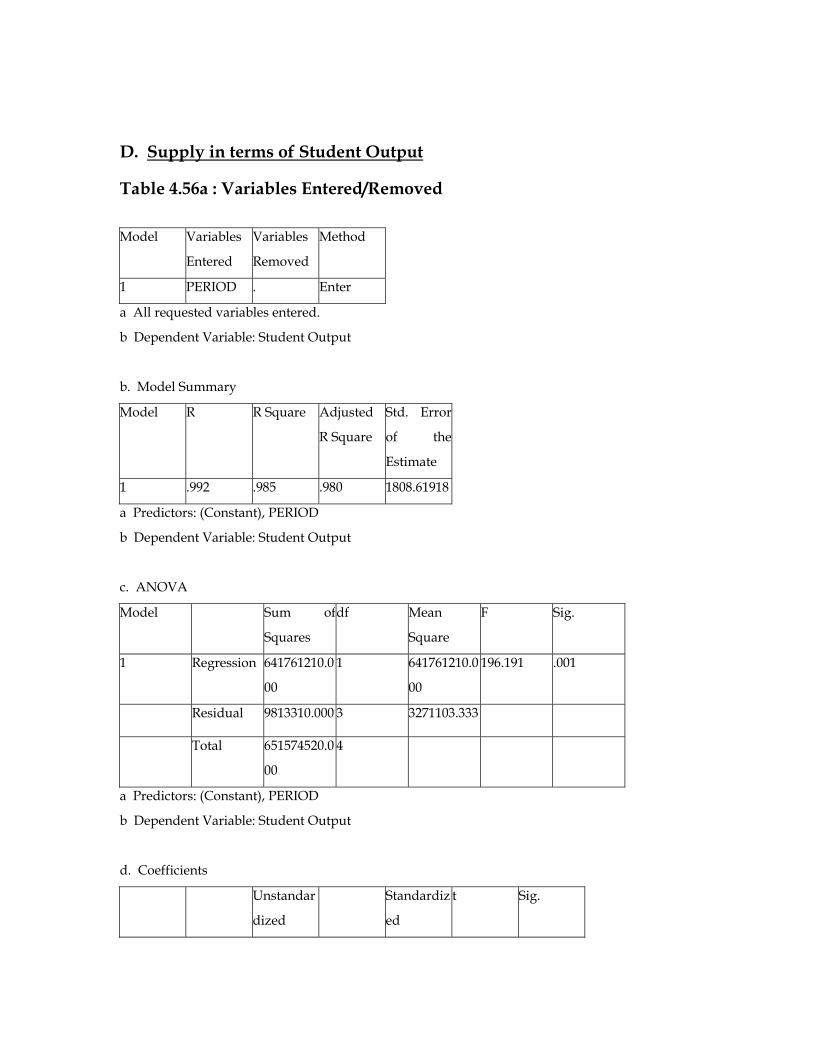
D. Supply in terms of Student Output
Table 4.56a : Variables Entered/Removed
Model Variables
Entered
Variables
Removed
Method
1 PERIOD . Enter
a All requested variables entered.
b Dependent Variable: Student Output
b. Model Summary
Model R R Square Adjusted
R Square
Std. Error
of the
Estimate
1 .992 .985 .980 1808.61918
a Predictors: (Constant), PERIOD
b Dependent Variable: Student Output
c. ANOVA
Model Sum of
Squares
df Mean
Square
F Sig.
1 Regression 641761210.0
00
1 641761210.0
00
196.191 .001
Residual 9813310.000 3 3271103.333
Total 651574520.0
00
4
a Predictors: (Constant), PERIOD
b Dependent Variable: Student Output
d. Coefficients
Unstandar
dized
Standardiz
ed
t Sig.
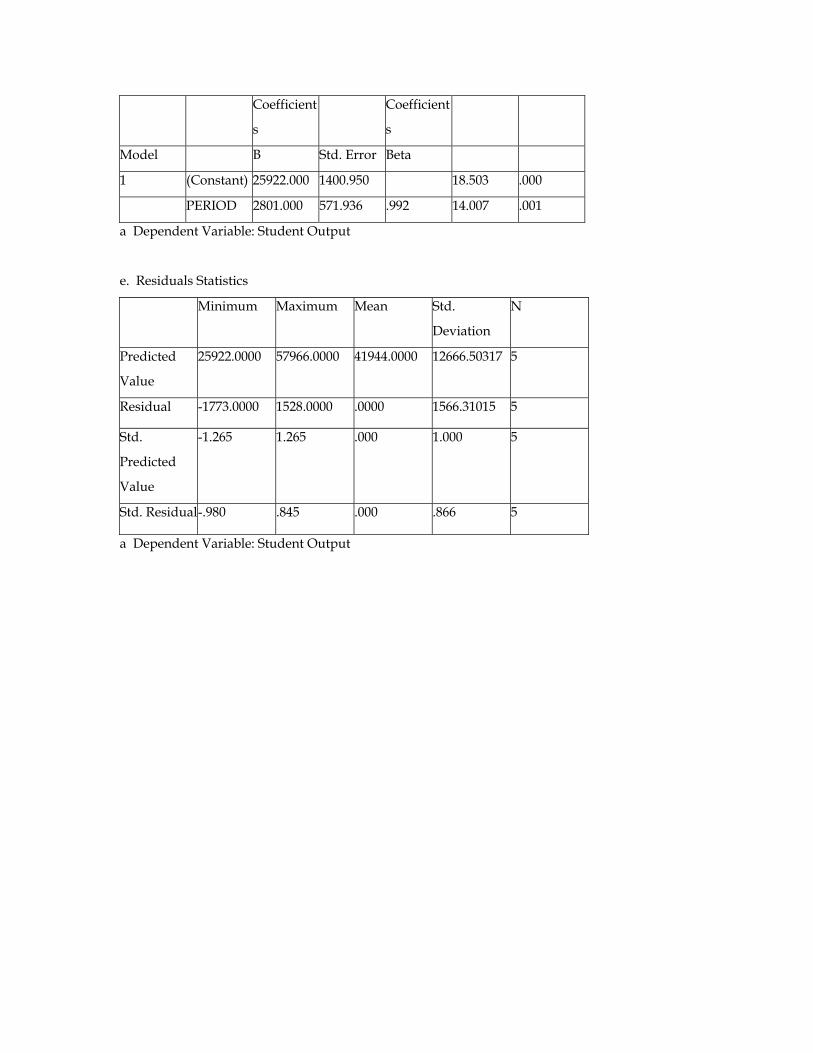
Coefficient
s
Coefficient
s
Model B Std. Error Beta
1 (Constant) 25922.000 1400.950 18.503 .000
PERIOD 2801.000 571.936 .992 14.007 .001
a Dependent Variable: Student Output
e. Residuals Statistics
Minimum Maximum Mean Std.
Deviation
N
Predicted
Value
25922.0000 57966.0000 41944.0000 12666.50317 5
Residual -1773.0000 1528.0000 .0000 1566.31015 5
Std.
Predicted
Value
-1.265 1.265 .000 1.000 5
Std. Residual-.980 .845 .000 .866 5
a Dependent Variable: Student Output
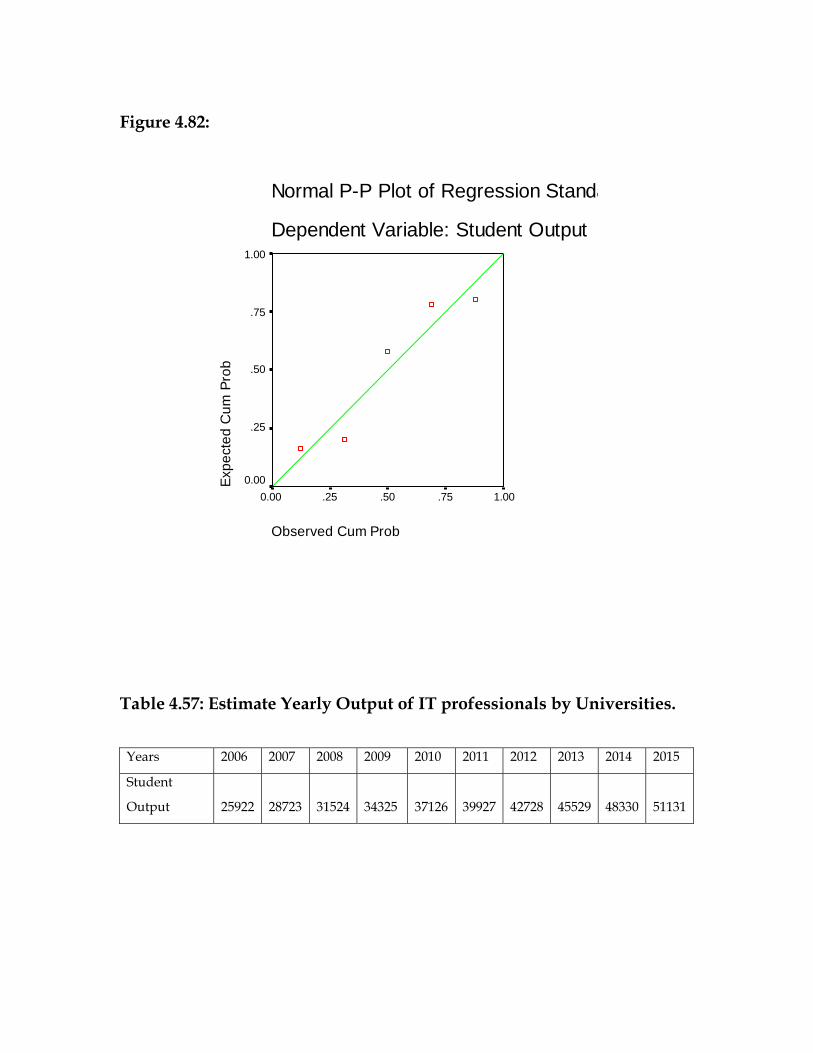
Figure 4.82:
Normal P-P Plot of Regression Standa
Dependent Variable: Student Output
Observed Cum Prob
1.00.75.50.250.00
Expe
cted
Cum
Pro
b
1.00
.75
.50
.25
0.00
Table 4.57: Estimate Yearly Output of IT professionals by Universities.
Years 2006 2007 2008 2009 2010 2011 2012 2013 2014 2015
Student
Output 25922 28723 31524 34325 37126 39927 42728 45529 48330 51131
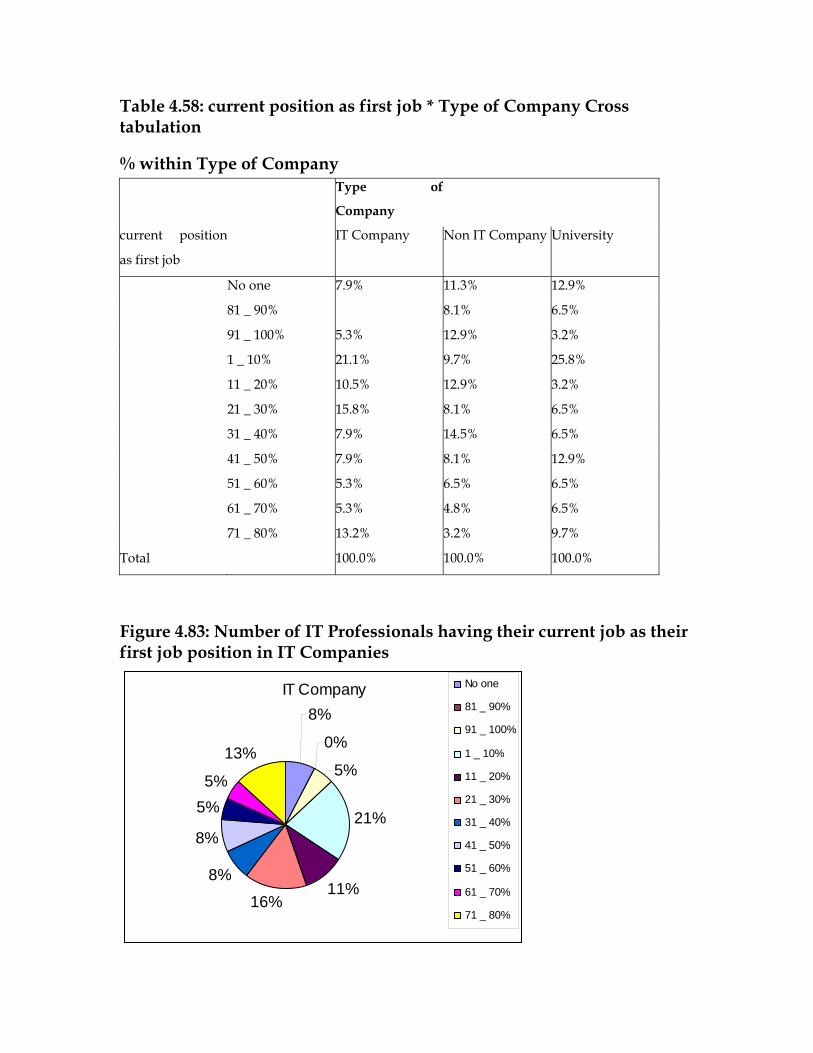
Table 4.58: current position as first job * Type of Company Cross tabulation
% within Type of Company Type of
Company
current position
as first job
IT Company Non IT Company University
No one 7.9% 11.3% 12.9%
81 _ 90% 8.1% 6.5%
91 _ 100% 5.3% 12.9% 3.2%
1 _ 10% 21.1% 9.7% 25.8%
11 _ 20% 10.5% 12.9% 3.2%
21 _ 30% 15.8% 8.1% 6.5%
31 _ 40% 7.9% 14.5% 6.5%
41 _ 50% 7.9% 8.1% 12.9%
51 _ 60% 5.3% 6.5% 6.5%
61 _ 70% 5.3% 4.8% 6.5%
71 _ 80% 13.2% 3.2% 9.7%
Total 100.0% 100.0% 100.0%
Figure 4.83: Number of IT Professionals having their current job as their first job position in IT Companies
IT Company8%
0%
5%
21%
11%16%
8%
8%
5%5%
13%
No one
81 _ 90%
91 _ 100%
1 _ 10%
11 _ 20%
21 _ 30%
31 _ 40%
41 _ 50%
51 _ 60%
61 _ 70%
71 _ 80%
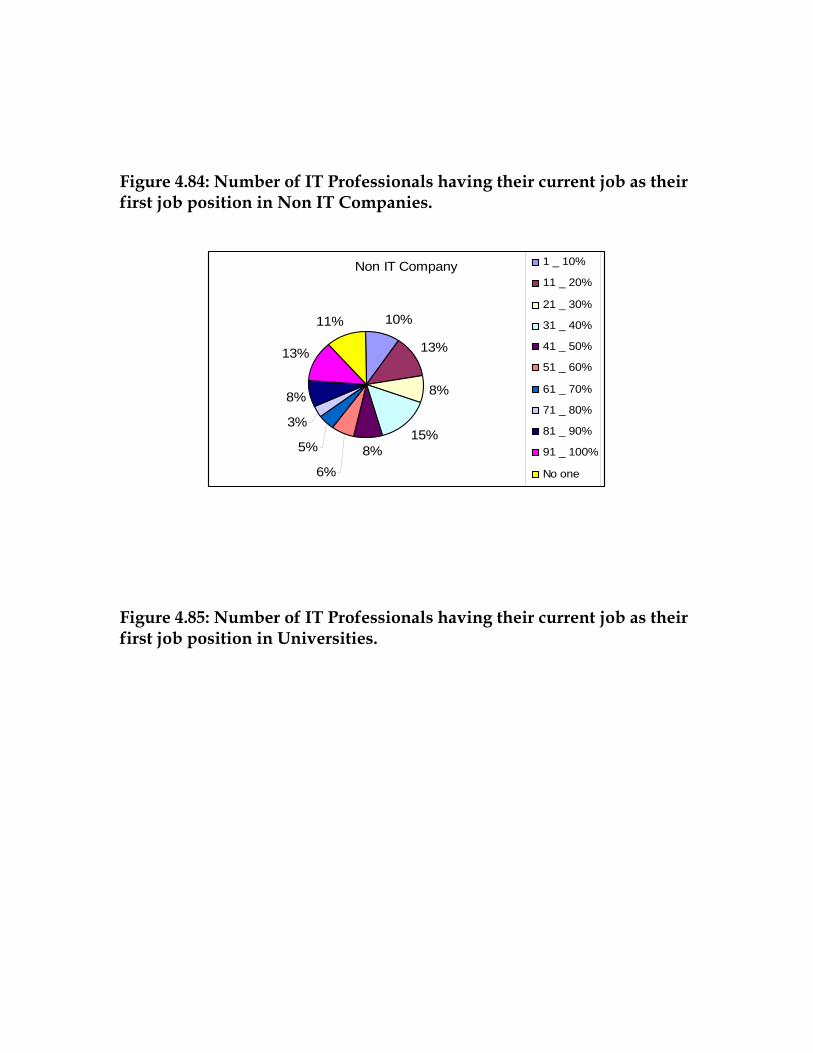
Figure 4.84: Number of IT Professionals having their current job as their first job position in Non IT Companies.
Non IT Company
10%
13%
8%
15%8%
6%
5%
3%
8%
13%
11%
1 _ 10%
11 _ 20%
21 _ 30%
31 _ 40%
41 _ 50%
51 _ 60%
61 _ 70%
71 _ 80%
81 _ 90%
91 _ 100%
No one
Figure 4.85: Number of IT Professionals having their current job as their first job position in Universities.
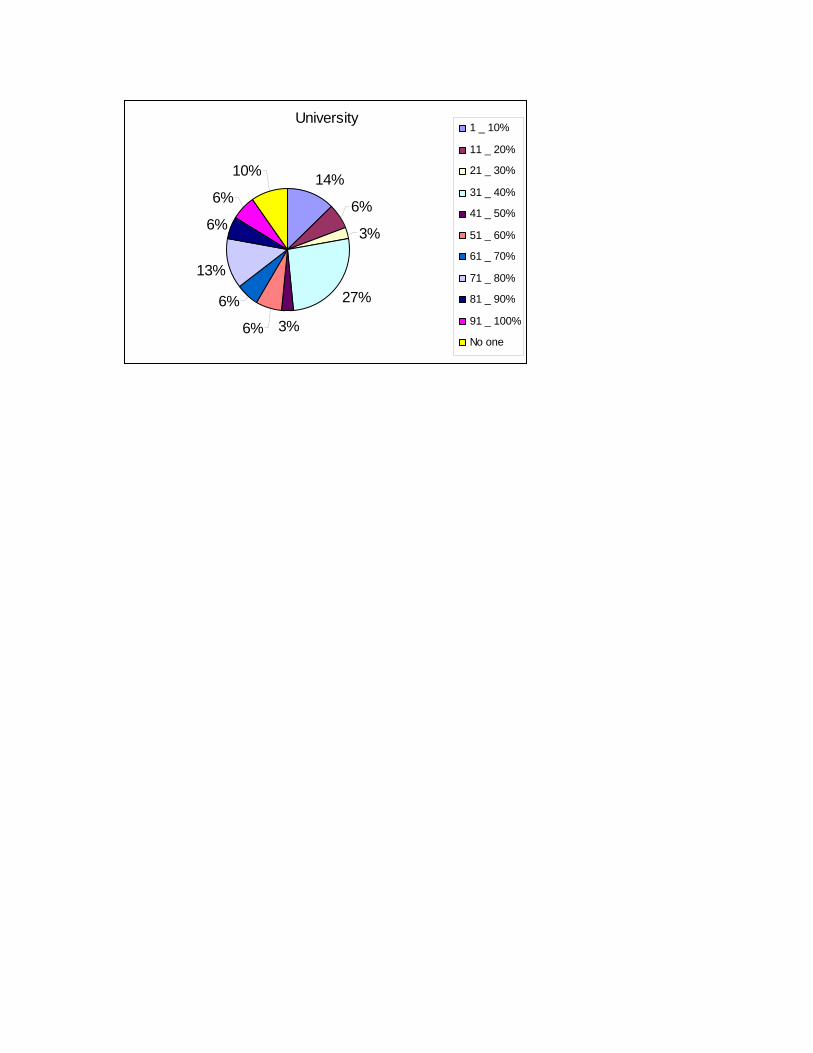
University
14%
6%
3%
27%
3%6%
6%
13%
6%
6%
10%
1 _ 10%
11 _ 20%
21 _ 30%
31 _ 40%
41 _ 50%
51 _ 60%
61 _ 70%
71 _ 80%
81 _ 90%
91 _ 100%
No one