Embed Size (px)
Citation preview

2092 IEEE TRANSACTIONS ON VISUALIZATION AND COMPUTER GRAPHICS, VOL. 20, NO. 12, DECEMBER 2014
1077-2626 © 2014 IEEE. Personal use is permitted, but republication/redistribution requires IEEE permission.See http://www.ieee.org/publications_standards/publications/rights/index.html for more information.
iVisDesigner: Expressive Interactive Design of Information
Visualizations
Donghao Ren, Tobias Hollerer and Xiaoru Yuan
(1) Beijing Air Pollution Dataset (2) Friends of a Weibo User (3) Server Monitoring Data
(6) Parametric Plot(5) Geospatial Data from Tweets(4) Parallel Coordinates
Fig. 1. Example visualization designs created in iVisDesigner.
Abstract— We present the design, implementation and evaluation of iVisDesigner, a web-based system that enables users to designinformation visualizations for complex datasets interactively, without the need for textual programming. Our system achieves highinteractive expressiveness through conceptual modularity, covering a broad information visualization design space. iVisDesignersupports the interactive design of interactive visualizations, such as provisioning for responsive graph layouts and different types ofbrushing and linking interactions. We present the system design and implementation, exemplify it through a variety of illustrativevisualization designs and discuss its limitations. A performance analysis and an informal user study are presented to evaluate thesystem.
Index Terms—Visualization design, Interactive Design, Interaction, Expressiveness, Web-based visualization
1 INTRODUCTION
Programming frameworks for information visualization such as Pro-cessing [2], Prefuse [21], ProtoVis [20] or D3.js [7] provide very use-ful abstractions for visualization designs that make programming eas-ier and more elegant. Frameworks can utilize existing programminglanguages, such as Javascript in the case of D3.js, or new programminglanguages, as in the case of Processing. However, they all require tex-
• Donghao Ren is with the Department of Computer Science, University of
California, Santa Barbara and was formerly with the School of EECS,
Peking University. E-mail: [email protected].
• Tobias Hollerer is with the Department of Computer Science, University of
California, Santa Barbara. E-mail: [email protected].
• Xiaoru Yuan is with the Key Laboratory of Machine Perception (Ministry
of Education) and School of EECS, Peking University. E-mail:
tual programming, which limits use to a population of coders, or other-wise imposes a fairly steep learning curve. Most of these frameworksrequire iterating back and forth between programming and executionstage, and thus adjustment of parameters can be cumbersome.
On the other hand, some information visualization toolkits supportinteractive ways of creating visual designs [17], from early pipeline-based systems [32] to more unified approaches [10, 18, 28]. Thesesystems are easy to use, and generally offer a What You See Is WhatYou Get editing experience, which greatly assists parameter tuning.However, compared to textual programming, they are generally lessexpressive. For example, the Flexible Linked Axes toolkit [10], whichinspired parts of our visualization functionality, only covers axis-baseddesigns for multidimensional data visualization, arguably a small por-tion of the whole design space. There is a need for highly flexibletoolkits that support a wide spectrum of visualization designs.
In this paper, we present iVisDesigner, a web-based system thatenables users to design information visualizations for heterogeneousdatasets interactively, without the need for textual programming.Compared with other approaches such as Flexible Linked Axes [10]and Gold [25], and commercial software such as Microsoft Excel andTableau, iVisDesigner focuses on expressiveness and modular visual-
For information on obtaining reprints of this article, please sende-mail to: [email protected].
Manuscript received 31 Mar. 2014; accepted 1 Aug. 2014 ate ofpublication 2014; date of current version 2014.11 Aug. 9 Nov.
D.
Digital Object Identifier 10.1109/TVCG.2014.2346291
2093REN ET AL.: IVISDESIGNER: EXPRESSIVE INTERACTIVE DESIGN OF INFORMATION VISUALIZATIONS
ization design flexibility, covering a wider range of the informationvisualization design space.
Expressiveness in iVisDesigner is supported by its underlyingframework and user interaction provisions. The framework utilizes aflexible internal representation of visualization designs, which is care-fully exposed in a unified user interface. Users specify designs viaa mouse or pen-based user interface in a web browser, utilizing dragand drop, sketching, and context menu elements. The system supportsvisual analytics tasks, such as brushing and linking, and visualizationcustomizations, both during visualization design and interactive ex-ploration of data in completed designs. Users can embed the designedvisualizations into existing websites or web-based applications by in-serting a piece of Javascript provided by iVisDesigner.
The main contribution of this work is an expressive framework torepresent visualization designs for different types of data, allowingusers to interactively arrange visual elements in different ways, com-bining and linking different types of visualizations. We discuss ourdesign decisions, implementation choices, as well as system limita-tions, and demonstrate the expressiveness of our system by presentinga variety of example applications on different types of datasets. Weprovide evaluation of our system in form of a performance analysisand an informal user study. Our prototype system exhibits high ex-pressiveness compared with existing systems, while maintaining goodperformance and usability.
The paper is organized as follows: After discussing related work,we present the design of the framework and user interaction, followedby notable implementation details. Next we discuss example appli-cations to exemplify coverage of the information visualization designspace. We then present system evaluation in the form of performancemeasurements and an informal user study. Finally, we discuss over-all results and limitations and conclude the paper with an outlook onfuture work.
2 RELATED WORK
Our work builds on top of a rich research landscape for information vi-sualization toolkits and systems. We structure our overview of relatedwork by separating discussion of influential theoretical background,programming frameworks, toolkits, and systems that are related to ourwork.
Theory: Any expressive system facilitating flexible mappings ofdata to visual variables owes a lot to the semiological research ofBertin [4, 5]. Mackinlay [24] provided further foundation and pre-sented automated tools for powerful modular visualization design.Shneiderman [30] analyzed the data types and tasks in informationvisualization, and presented a taxonomy for them. Card et al. [8] or-ganized previous visualization designs, and presented categorizationof data types and visual mappings. In our demonstrations and evalua-tions of iVisDesigner, we will highlight its coverage of the informationvisualization design space.
Data Flow Systems such as ConMan [19], AVS [32], IRIS Ex-plorer [15] and VisTrails [3] use a pipelined approach and flow di-agrams to represent the progress from data to visualization. Thesesystems are particularly good at defining data transformations, but notvery flexible for defining interlinked mappings from data to graphi-cal elements. In addition, pipeline-based systems focus on represent-ing the pipeline itself, there is little screen estate left for displayingand editing the visualizations. Our work provides an integrated rep-resentation and manipulation of graphical mappings, with all graphi-cal elements created, presented and edited in the same canvas whichdominates the user interface, allowing for better understanding of theoverall visualization design.
Programming Frameworks and Languages: Drawing APIs andtoolkits such as OpenGL, Java2D, HTML5 Canvas, and Processing [2]define programming interfaces to draw low-level elements. Even forexperienced programmers, creating visualizations with these APIs di-rectly is not straightforward. Thus visualization frameworks have beencreated for better abstraction. The InfoVis Toolkit [13] and Impro-vise [36] provide a set of basic widgets. Chi et al. [9] proposed aspreadsheet approach. “behaviorism” [14] uses three graphs to rep-
resent dynamic visualizations. To create novel designs, users needto create new widgets or inherit existing ones. Heer et al. proposedPrefuse [21, 1], a toolkit for interactive visualization. It first trans-forms abstract data into visualizable form by a filtering process, andrenders the visualizable form by using a view process. It allows foradvanced integration of existing operators to create novel techniques,but typically users will need to define new operators in the process.
Declarative models and languages for information visualizationhave been presented [38, 37]. Protovis [20, 6] provides a declarativelanguage for information visualization, designed and implemented inJava and Javascript. Bostock et al. designed D3.js [7], a Javascript li-brary for creating web-based visualization designs. It facilitates themanipulation of DOM elements with data. All of these programmingframeworks require users to write programs to combine visualizationcomponents. The framework of our system is similar to D3. Bothoperate by defining and parameterizing mappings from data items tographical elements. D3 takes a programming-oriented approach, whileour system takes an interactive design approach: users create visual-ization designs, and provision for end-user interaction via the web-based user interface.
Interactive Toolkits: Vector-based drawing software, such asAdobe Illustrator, is widely used for graphical design, and we drewsome inspiration for our user interface from such products. While itis possible to create visualizations with such design tools, there is nosupport for parameterizable mapping from data to graphics. Graphi-cal items have to be created individually. On the other hand, a lot ofcommercial software has the functionality to create visualization de-signs for data interactively, for example the chart feature in MicrosoftExcel and similar spreadsheet software. Web-based systems such asManyEyes [34], Sense.us [22], or CommentSpace [39] focus on col-laborative visual analysis. Most of these systems are focused on usingand customizing several predefined templates.
Tableau is a highly sophisticated state-of-the-art commercial visu-alization system, providing good flexibility for visualization designs.However, it is still predominately template-based, which increasesease of use for beginners but limits free-style design explorations. Incontrast, we focus on more fine-grained control and flexible combina-tion of graphical elements in the pursuit of novel design combinations.
For multivariate data, Claessen et al. [10] allow users to posi-tion axes and put scatterplots and links between them interactively.However, it only supports multivariate data and axis-based visual-ization designs. Sketch-based interactions, like in SketchStory [23]and SketchInsight [35] have been explored. While sketch-based in-teractions are very intuitive, these systems currently only support avery limited set of designs. Bret Victor presented a tool [33] that al-lows users to define drawing procedures with geometrical constraints,which are parametrized in an interactive canvas. It requires proceduralthinking, where users define loops to draw simple visualizations suchas a scatterplot. In our system, we use a declarative approach, whereloops are defined implicitly by data selectors. SageBrush [27] uses“partial prototypes” to define spatial properties for “graphemes”, andsupports editing of primitive properties. Our system expands on thistheme by enabling data transformation and generation, and support-ing interaction with designed visualizations. Lyra [28] is a very re-cent addition to the interactive visualization design landscape. Basedon the JSON-based declarative visualization grammar Vega [31], it al-lows users to define visualizations interactively by constructing scales,guides and marks. Sophisticated layouts and transformations are en-abled via transformation pipelines. Lyra and Vega only operate ontabular datasets, while our work also supports hierarchical datasetswith a fixed schema and references between data items. Lyra is moreoriented towards designing a single piece of visualization, while oursystem focuses on canvases that allow users to draw and link differentdesigns. Furthermore, our system supports designing interactions suchas brushing and linking.
3 DESIGN PHILOSOPHY
The framework of iVisDesigner is designed to represent visualizationsthat support interactive user manipulation, all within a web-based in-

2094 IEEE TRANSACTIONS ON VISUALIZATION AND COMPUTER GRAPHICS, VOL. 20, NO. 12, DECEMBER 2014
(1) Menu Bar
(3) Schema Panel
(2) Tools Panel
(5) Style Panel
(4) Objects Panel
(6) Property Panel(7) Canvas
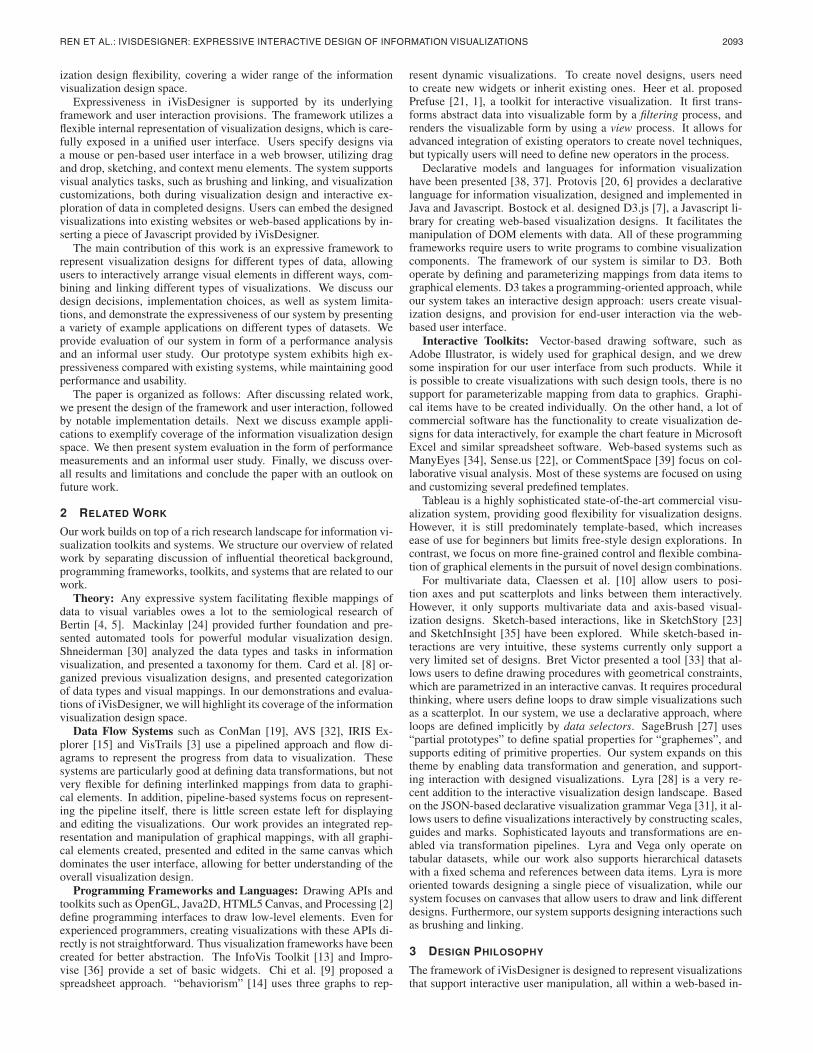
Fig. 2. The interface of iVisDesigner. (1) Menu Bar: Commands for loading or saving visualization designs, view settings, login and logout. (2)Tools Panel: Tools for moving objects around, creating new objects and changing the view. Grouped into different categories. (3) Schema Panel:Shows the structure of the dataset. Allows selection. (4) Objects Panel: Shows the objects currently in the visualization design. Allows selection.(5) Style Panel: Adjust graphical styles for currently selected objects. (6) Property Panel: Adjust properties of currently selected objects. (7) Thecanvas to draw the visualization. In this example, a visualization of Beijing Air Pollution data is presented. There are two linked views, the leftview shows the timeline plots of PM2.5 indexes for each measurement station on top of a map, the right plots shows the trends of the PM2.5indexes, wind strength, temperature and humidity. This visualization is designed solely through user interaction with iVisDesigner, without textualprogramming.
terface and canvas. The high-level design choices of iVisDesigner arebased on the following idea: Allowing for interactive visualization cre-ation, editing and interaction in an unified interface, where the space isdominated by a canvas showing the emerging visualization. We focuson enabling users to freely place graphical elements and links betweenthem, instead of simply designing a chart or template visualization.
Our overall approach can be characterized as introducing supportfor data influx and manipulation to the common usage paradigm ofinteractive vector-based drawing software. By allowing users to de-fine mappings from data to graphical elements, we enable them to di-rectly create and manipulate groups of elements simultaneously, whichtremendously reduces the amount of work to create visualizations.Transformed, aggregated, or otherwise generated data can be attachedto the dataset, providing more capabilities, such as histograms andgraph layouts. Graphical elements can be manipulated via draggingand brushing, which affects the underlying data attributes, enablingthe design of interactive visualizations.
4 DESIGN
In this section, we present the workflow and design details of iVisDe-signer. We first give an overview of our framework, which is designedto represent visualizations, render them, and allow users to manipulatethem interactively. We then discuss our user interface design, explain-ing how users can create and edit the different components.
4.1 Framework
The framework of our system is illustrated in Figure 3. Data is loadedfrom the Data Source, transformed into an internal representation, andthen enumerated or decomposed into individual elements by variousData Selectors. The decomposed elements are then passed into Ob-jects for visual mapping or data generation. For visual mapping, theresulting graphical elements are simply rendered on the canvas. Fordata generation, the results are additional data attributes (e.g., a his-togram) that can be attached back to the data representation. In addi-tion, users can create and attach new data from scratch, for example,creating a range of integers from 1 to 100 for numbering purposes.Multiple mappings and transformations can co-exist in the same visu-alization, and can refer to each other.
Our data representation is based on a hierarchical model similar toJSON, but allows for references among objects. Data items are a set of
Data Enumeration/
DecompositionMapping
Mapping
Reference/Linking
Attached Data
Aggregation, Layout, etc
Graphics
User Manipulation
Objects (Circle, Axis, Scatter, etc)
Data Selector
Generators
Modify Data by Inverse Mapping
Data Representation
Data Source
User Interaction
Fig. 3. The framework of iVisDesigner. Data is first being enumeratedby user-defined data selectors, and then passed to different mappingobjects. These objects may refer to each other, and finally generatethe graphics or attach generated data back to the data representation.Users can also manipulate the graphics, and modify the underlying dataif permitted.
key-value pairs. Each value can be a single data item, an array of dataitems, a primitive value (number or string), or a reference to anotherdata item. The structure of the dataset is defined by a fixed Schema,which stores a definition of the data structure. This requires the itemsin a single array to be homogeneous, i.e. they must be of the sametype and structure. This ensures that we can perform mappings fromeach array of objects to graphical elements in a unified way. Given thatthe arrays in a given dataset are homogeneous, it is easy to construct aschema for a dataset automatically.
This dataset definition is relatively more expressive than tabularstructures. For example, in Figure 2, the depicted dataset contains aset of air-probing stations, each with a set of measurements, which arevisualized individually on the map, and collectively on the timelineplot. Users can place small visualization designs for inner-level datawithin a larger plot.
Users can create attached data by creating special objects in thesystem. These can, for example, compute basic statistics or run aforce-directed layout algorithm.
Data Selectors, which are automatically created from user interac-

2095REN ET AL.: IVISDESIGNER: EXPRESSIVE INTERACTIVE DESIGN OF INFORMATION VISUALIZATIONS
Axis1 (MPG)
Axis2 (Displacement)
Scatter1 (MPG)
Circles1 (Cars)
Axis2
Scatter
CirclesCars
Axis1
Data Graphics
(1) Basic Scatterplot
(2) Scatterplot with Parallel Coordinates
AxisN
CurvesCars
Axis1
Data Graphics
...
Color Mapping
Fig. 4. Two basic visualization designs: (1) Scatterplot (2) SPPC, asin [40]. The scatterplot consists of two Axes, a Scatter and a Circlesobject, with Axes and Scatter objects providing location information forthe Circles object, which maps cars to circles.
tion, are used to select a set of data items or values from the dataset.While Data Selectors are created via the UI (e.g. by clicking on an en-try of the Schema panel or selecting from a dropdown menu in theProperty panel), they also do have a syntax (string representation),where [array] means an enumeration of all the elements in the ar-ray, and field means a particular field from the current object. TheData Selectors can be specified in a path-like manner, joined by “:”.For example, [cars]:acceleration means an enumeration ofall (say n) cars in the dataset, taking the value of the acceleration fieldfor each, resulting in an array of n numbers.
Reference fields can also be selected in the Data Selectors, forexample, [edges]:&source will select the source nodes forthe edges in a graph (nodes are stored in a separate array), and[edges]:&source:value will select the value attributes of thesource nodes.
A visualization consists of a set of Objects, which define mappingsfrom data to graphical elements, or generate new data attributes andattach them back to the data representation (as shown in Figure 3,Mapping and Generators). Objects in our system can be of varioustypes, specifically, they encompass Graphical objects, Guide objects,and Generator objects as discussed below.
A Graphical object represents a mapping from a set of data itemsto a set of graphical elements. Examples are Circles, Lines, Polylines,Arcs, and LineThroughs. Each Graphical object has a Data Selectorassociated that specifies the set of data items to map from, and eachitem in this set is rendered as a graphical element.
The properties of a Graphical object, such as the location and radiusfor the Circles or end points for the Lines, are provided by Guide ob-jects. These objects transform data values to various properties suchas location, width and color. Examples are Axes, Scatters, and Maps.
Generator objects attach derived data to the dataset. For exam-ple, they can calculate the average value for a group of data attributes(Statistics object), group them into bins (Aggregator object), computean expression on a set of data items (Expression object), or perform aforce-directed layout algorithm on a graph and give each node a po-sition (ForceLayout object). Generator objects mainly perform datatransformations, they attach generated values to the dataset. Guide ob-jects are displayed and edited on the canvas, and mainly deals withvisual properties. There is no exclusive separation between the twocategories, and one object might be of both kinds at the same time.
Generators can also accept user interaction. A BrushingValue ob-ject accepts brushing actions on a given visualization, and attachescorresponding data attributes to a data item that got brushed. Thesegenerated or derived values are attached to the dataset, which can then
Choose Mapping TypePlain Value
Linear
Categorical (Current)
Expression
Data Attribute to Map From
Filter
Styles
Range Filter (Current), Categorical Filter
Properties
Center
RadiusLinear Mapping (Current)
Fig. 5. The properties and styles of the objects can be defined inthe corresponding panels. Styles are drawing actions, such as Fill andStroke; properties define the shape of the object, such as Center andRadius. Both, properties and styles can be defined as plain values ormapped from data via the UI.
further be used in other parts of the visualization. For example, theycan be used to construct brushing and linking functionality for a visu-alization, enabling basic visual analytics.
Objects can be nested into a Component object, which is bound toone Data Selector and which provides local coordinates for the ob-jects inside it. Since our data representation allows for a hierarchicalstructure, users can design sub-visualizations and scatter them around.For example, one can create a component to design a small glyph forrepresenting different data items. In section 6, we show an examplethat uses components to create small timeline plots for each item (cf.Figure 2), and Figure 7 showcases some custom glyphs.
Note that object types are not mutually exclusive. One object mighthave several types simultaneously. E.g. an Axis is at the same timea Guide object and a Graphical object showing tick markers. Force-directed layout is classified as a generator object, because it generatescoordinates, but it can also be a guide object at the same time (usersindicate a rectangle for the layout region).
Our framework can be extended via programming by defining ad-ditional custom objects, ranging from primitive graphical elements tocomplex visual designs (e.g. a special type of glyph).
A comprehensive list of currently supported objects and their prop-erties, as well as the interactions to create each of them, can be foundin the supplementary material.
4.2 Interface and Interaction
We now discuss the user interactions in iVisDesigner. The overall userinterface is shown in Figure 2, together with an example design (de-tailed in subsection 6.2). It consists of a menu bar, a set of panels, astatus bar, and a drawing canvas. There are five flexible panels thatusers can freely move around, resize, minimize or hide: The Toolspanel presents a set of tools, including select/move, drag, brushing,pan/zoom, and object creating tools. The Schema panel shows theschema (hierarchical structure) of the dataset; users can select arraysor fields in the dataset. The Object panel shows a list of all graphicalobjects in the visualization and allows users to select, reorder or re-move them. The Style panel is used to define graphical styles (seriesof drawing actions) for graphical objects. The Property panel letsusers edit properties of selected objects. In addition, a data inspectorpanel is available, it can be shown when users need to examine theactual data values.
After an object is selected in the object panel or directly from thecanvas, the property and style panels let the user edit the propertiesand drawing actions.
We aimed for a uniform interface, flexible for different tasks, and

2096 IEEE TRANSACTIONS ON VISUALIZATION AND COMPUTER GRAPHICS, VOL. 20, NO. 12, DECEMBER 2014
intended to maximize the space for the drawing canvas, resulting inthe five panels above. The tools panel helps switch between differentmouse tasks (select, interact, create). The schema panel and objectpanel are for selecting data elements and visualization objects, whilethe style panel and property panel allow users to edit the selected ob-jects in an uniform way.
In the following sections, we will discuss typical steps to use oursystem, including actions to create a visualization, edit an existing de-sign, and interact with them. Since the system is flexible, users couldgo back and forth among these steps at will.
4.2.1 Creating Visualizations
A visualization is created by adding graphical objects to the canvas.Typical steps to create a graphical object include: (1) Selecting a de-sired set of data items from the schema panel. (2) Selecting the desiredtype of object from the tools panel. (3) Providing initial positioning.Other properties of the newly created object will be set to default val-ues, for later adjustment.
While in other systems, such as SageBrush, Tableau or Lyra, onedirectly assigns data properties to marker properties, and the systemwill automatically determine scales and their positioning (that mightbe changed later), we require users to create guide objects (such asAxes, Scatters) explicitly. Since our canvas is virtually infinite, andthere might be multiple existing visualization parts on it, automaticallycreating axes is not as straightforward. Therefore, to create a visual-ization, users first need to create guide objects as a frame, then addgraphical elements. For example, to create a scatterplot, users need tofirst create two orthogonal axes, add a scatter between them, and thenput, e.g., circles on the scatter.
References in the dataset can be utilized. For example, in a node-link graph visualization, the edges are defined as two references tonodes, source and target. Suppose we already visualized thenodes as a scatterplot. We now want to create lines for the edges tomake a node-link visualization. The lines are bound to the [edges]array, so each edge is drawn as a line. To specify the two end pointsfor each edge, we need to use the locations provided by the nodes’scatterplot. In this case, the user first highlights the “ref” button nextto the source reference field, indicating she/he is going to use thenode referenced by that field, and clicks on the scatterplot to specifythe first end point. Then the user highlights the “ref” button besidethe target reference field, and clicks on the scatterplot to specifythe second end point and lines are created. In short, the scatterplot de-fines a mapping from nodes to locations, and the reference field tellsthe scatterplot which node to use for the mapping. This is perhapsthe most difficult-to-understand interaction in our system. While usersin our evaluations were able to easily follow our guidance to createnode-link graphs, it proved challenging for some of them to createother forms, such as the matrix and arc-based graph visualizations inFigure 9, given just a short amount of learning time.
To reduce the burden of complex interactions to create commondesigns like a scatterplot, we defined a small set of templates (scatter-plot, timeline plot, node-link graph), that allows users to create suchvisualizations simply by selecting the data attributes and dragging arectangle on the canvas. The template will create the required graph-ical objects and guide objects for the user automatically, and the usercan adjust the design later. This also allows novices to get started withthe system more easily.
4.2.2 Editing Properties and Drawing Styles
After having created objects, users can further modify their properties.This is done via the property panel and the style panel. The propertypanel shows a grouped list of property-editing UI components. Mostof the properties for an object can be set as mappings, such as linearmapping or categorical mapping, which are guide objects created im-plicitly by the property editor, allowing users to assign mappings fromdata attributes to actual properties of each graphical element repre-sented by the object. For example, the “radius” property of the circlesobject can be assigned as a constant value, or as a linear mapping ofsome data attribute. The “center” property of the circles objects can be
set by picking a guide object or a static point on the canvas. Propertiescan be copied and pasted among objects. Pasting can be done eitherby value or by reference. If pasted by reference, changing one of themwill cause the others to change as well. For example, we might de-sign a set of parallel coordinates and a scatterplot, and share the colormapping for the parallel coordinates and the scatterplot. Through copyand paste, one can reuse the properties. However, one drawback is thatthere is no easy way to indicate what objects share the same mappingin the interface. Currently, the user has to remember that. Anotherlimitation is that our current version does not provide a straightfor-ward way to visualize the scales of the mappings. In future versions,we would like to allow users to drag the mapping properties out ontothe canvas and draw them as interactive scales. This would solve bothof the above problems.
The style panel works similar to the property panel, showing a list ofdrawing actions for a graphical object. In the rendering process, eachgraphical object generates a graphical path, for example, lines, circles,Bezier curves or composites of these, and this path is rendered to thecanvas by performing the drawing actions specified here. For example,the “Stroke” action will stroke the path, and it has four properties:width, color, line join and line cap. The “Fill” action will fill the pathwith a user-defined color. Users can add/remove actions, and reorderthem in the style pane. The properties for drawing actions in the stylepanel can also be mappings, as in the property panel. The user can addor remove these actions in the style panel. Styles can be considereda special set of properties for a graphical object frequently used invisualization designs, and they commonly consists of multiple actions.This is the main reason we separated them from the property panel intoan individual panel. Currently we only have stroke and fill actions, inthe future, we would like to support more actions, including such thatalter the path (e.g., distortion, outline, smoothing), similar to those inAdobe Illustrator.
Basically, we employ a property-editor based approach, which pro-vides a set of uniform editing steps for each type of properties. Theediting interfaces are automatically generated according to the prop-erties declared in the object types, which is particularly useful forimplementing new types of objects. From the users’ perspective, auniform editing experience helps them to learn the system effectivelyand speedily.
4.2.3 Interacting with Visualizations
In addition to creating and editing visualizations, our system allows acertain set of interactions to be designed. There are two specific toolsfor interactions on the visualization design.
Moving Elements: Users can move graphical elements in a de-signed visualization, and as a consequence, some corresponding dataattributes might be changed. This should be performed very carefully,as one could easily produce fake findings, mislead others or get con-fused when changing the original data recklessly. As a default setting,we don’t allow the original data attributes to be changed. However,certain properties can be changed without danger, such as the loca-tions produced by a force-directed layout algorithm. Another exampleconsists of users attaching a single attribute to the dataset, and using anaxis and a circle to build a “slider” to control it. Such slider-controlledattributes could be used in different situations, such as, e.g., definingthe range of a filter property, resulting in an adjustable filter.
Brushing Value
Data
Attached Data
Graphical Elements
Brushing (Lasso Tool)
Mapping
Fig. 6. The internal process of brushing. When the user brushes overa set of graphical elements with the lasso tool, they are collected andpassed to the BrushingValue object (which can be created and activatedby the user). The BrushingValue object then attaches data back to thedata representation, and the attached data can be used by mapping ob-jects, which affect the graphics. Users can define and combine multipleways of brushing in our system.

2097REN ET AL.: IVISDESIGNER: EXPRESSIVE INTERACTIVE DESIGN OF INFORMATION VISUALIZATIONS
Brushing: The lasso brushing tool is paired with the Brushing-Value object, which attaches a value to each data item, and once dataitems are brushed by selecting their graphical elements, their valueswill change. Users can then use the values to define graphical map-pings. This implements brushing and linking functionalities. For ex-ample, one could set the fill color of a scatterplot as the brushed value,and use the lasso tool to color the points. Other examples are discussedin section 6.
Our goal is to enable the design of interactions, not just supporting afixed set of interactions. This is achieved by allowing users to modifyattached data attributes in two classical ways (moving and brushing),and we show that dragging, filtering, and brushing and linking can besupported from these atomic actions. There are possibilities to definemore complex interactions beyond these, but as the complexity goesup, users have to create several related objects such as axes and ex-pressions, which makes the process a little more complicated.
4.3 Limitations
While the framework of our system is inherently modular and object-oriented, allowing new types of objects to be added easily, it still hasseveral limitations in terms of expressiveness. The framework is basedon designing and parameterizing graphical mappings from original,transformed, or user-generated data. This approach has two funda-mental limitations. (1) Designing adaptive markers, such as automati-cally determining the width of bars in a barchart based on the numberof bars and the chart width, requires writing specific mathematical ex-pressions, because this involves dividing the chart width by the num-ber of bars, which is not a property of any single data item. In general,our framework does not address the dependencies among graphicalobjects, but rather performs mappings individually, so in order to ac-commodate higher-level layout constraints such as overlap avoidance,special objects have to be designed in programming. (2) Our systemcannot, without using specific custom layout objects, design recursivedrawings such as tree maps, and as aforementioned, the system doesn’tsupport recursively defined data structures directly. One might arguethat tabular structure can represent graphs and trees as well, but ourdata selectors can only enumerate arrays of items in the data hierar-chy. It cannot follow references (such as running a graph/tree traver-sal). This is also true for other declarative approaches (e.g., ProtoVis,D3, Vega and Lyra), which are also resolved to using specific modulesfor each kind of layout. Abstractions such as [29] might be consideredin the future. These limitations currently exclude a range of possiblevisualization designs.
There are also shortcomings that are more easily solvable within thecurrent framework. (1) Our system currently is constrained in termsof the type of coordinate systems. Positional mappings are done viaaxes and scatters (the map with Mercator projection is the only excep-tion). It does not currently accommodate circle-based visualizations,nor are polar coordinates currently supported. In the future, we willseek to support different coordinate systems. (2) Axes and their scalesare currently intrinsically linked. For simple scatterplots and parallelcoordinates this works fine, but it becomes tedious, although not im-possible, to share the same scale for different data attributes. There iscurrently no way to use axes for numerical properties such as widthsor radii (and this would be useful for designs such as error bars). Thiscould be solved by additional property-editing interactions and betterseparation of axes and scales in the future. (3) There is currently noway to specify the order of data item enumeration, which would beuseful if we want to stack data items or link through them in differentmanners. This could be solved by adding a sorting attribute to the dataselectors. (4) The system currently lacks a way to specify more gen-eral graphical paths. The LineThrough object can draw paths throughdata points, which is somewhat restrictive: if we want to fill the areabelow a timeline plot, or between two of them, we need a more flexi-ble way to define paths to connect static points and sequences of pointstogether (similar to the “Pen” tool in Adobe Illustrator). The conse-quence is that our system is less expressive at defining shapes, andmore oriented towards line-based visualizations. A general “pen” toolwould be desirable.
Despite these limitations, our system can still support an extensiveset of visualizations. In section 6, we showcase a variety of examples.
5 IMPLEMENTATION
The system is implemented in HTML5 using jQuery and other open-source libraries. A backend server written in Python Django is used tostore the metadata for the datasets and saved visualizations. Here, wediscuss some notable aspects of the implementation.
Input Format: The datasets are loaded as JSON objects, wherethe references are stored as the referenced items’ ID (each data itemhaving a unique ID). For our current system, we did not focus on sup-porting multiple data formats, but conversions from CSV or Excel-likedata sources are trivial (without performing join operations). Datasetstructure will influence how well certain designs will be supported.For example, if the dataset from subsection 6.2 had been stored as aflat table instead of a hierarchy, we would not be able to create thatvisualization, unless we added a special “Grouping” generator object,similar to Lyra’s approach).
Rendering: We employ multiple layers of HTML5 Canvas. Therenderer maintains the status of these canvases, and executes the vi-sualizations on them. There are four layers in our current prototype.The Main layer contains the graphical elements, the Front layer showsselected elements, the Overlay layer shows temporary markers, suchas alignment indicators during user interaction, and the Back layer dis-plays the background color and grid. By using layers, we eliminatedthe need to redraw the entire visualization when the user selects a sin-gle element, achieving better responsiveness. In addition, the rendereralso manages a viewport, allowing users to move or zoom the visual-ization, or to export the current view as PNG or SVG files.
Serialization: The visualization is stored as a set of Javascript ob-jects internally; to save a visualization, we need to serialize them toa storable format. We implemented a general Javascript object se-rializer to support this task, which is capable of maintaining refer-ences between objects and retaining type information, which are criti-cal for correctly restoring a visualization. To enable this, we assign aunique identifier (UUID) for each object, and store object references asUUIDs. Type information is preserved by recording an identifier foreach registered object type, and restoring the “constructor” attributefor each object. The benefit is that we do not need to write a pairof serializing and deserializing functions for each object class, whichreduces programming effort and the possibility of bugs.
Backend Server: The system operates mainly in the browser, butlike every web application, it requires a backend server to provide dataand store information. The backend server manages user accounts,datasets and visualization designs. It was implemented in PythonDjango and Twisted. The Django part is responsible for managinguser credentials, storing the metadata of all datasets, and saving andloading of visualization designs. The metadata of datasets consists ofthe data description, data schema, and a URL for the data content. Weused the WAMP protocol (based on WebSockets) in a Twisted server,which is connected to a Redis database. It provides real-time updatesfor changing datasets. Changes in the dataset can be posted to theweb-based interface, and the system will update the visualization withthe changed data. One can also write scripts that collect data from theweb, and send it to iVisDesigner (either replacing original or providingincremental updates). For example, Figure 1 (3) illustrates real-timemonitoring of a server’s CPU, RAM, and network usage.
Embedding: Users can export their designs and embed them intotheir own websites or web applications. The datasets and visualizationdesigns could either be retrieved from a server, or embedded statically.
6 EXAMPLE APPLICATIONS
In this section, we present a set of visualization design examples ondifferent datasets, with the goal of illustrating the flexibility and ex-pressiveness of our system. Different types of datasets are chosen,including multidimensional data, time series data, and graph data. Wealso demonstrate a design for Sina Weibo (A Chinese microblog ser-vice similar to Twitter) user data, and even some artistic designs with-out an underlying dataset.

2098 IEEE TRANSACTIONS ON VISUALIZATION AND COMPUTER GRAPHICS, VOL. 20, NO. 12, DECEMBER 2014
Glyph Component
Horsepower
Displacement Cylinders Acceleration Model Year
Fig. 7. Glyph-embedded Multidimensional Data Visualization. Thisdesign is based on the SPPC design [40], connecting a scatterplot withparallel coordinates. The points in the scatterplot are replaced by a setof glyphs, showing four attributes for each item.
6.1 Multidimensional Data
iVisDesigner can flexibly arrange axes like Flexible Linked Axes [10],whose design space is subsumed by our system. Figure 4 (2) is an ex-ample of linked-axes and scatter-plot-based visualization designs. Thedataset used there is the 1983 ASA Data Exposition Cars dataset [11].iVisDesigner emphasizes expressiveness. For example, we can designmini-glyphs for Cars with the component object, draw the glyphs on ascatterplot, and link them to a set of parallel coordinates (Figure 7).
Fig. 8. Aggregator objects group values into numerical fields, whichcan be used to draw a histogram of a particular data attribute. In thisexample, we plotted the histograms of MPG and Displacement attributesin the Car Data, and also a 2D histogram to show their joint distribution.
Generator objects can be used to compute the statistics of a dataattribute, including basic statistics such as min/max, mean, and moreinvolved ones such as histogram. In Figure 8, we show an example us-ing the histogram generator, an Aggregator object. This object gener-ates an array of bins to form a histogram of the selected data attribute,which can be displayed in various ways.
6.2 Time Series Data
In Figure 2, we presented a visualization of the Beijing Air PollutionDataset, crawled from two websites that update hourly. The datasetcontains 36 stations, each of which has a name, a geographical loca-tion, and a time series of two weeks of measurements. The visualiza-tion consists of two different charts. The left chart is a set of timelineplots on a map, each representing a station’s measurements. It showsthe measurements for each station, allowing comparison between sta-tions at different locations. The right chart is a single timeline plot,which contains the timelines for all of the stations. This chart showsthe main trend of all the stations, while revealing some outliers. Theleft-hand visualization consists of a Map object for the geographicalcoordinates, two Axis objects, a Scatter object and a LineThrough ob-ject, connecting all the points in sequence.
6.3 Graph Data
A graph visualization with both, node-link diagram and adjacency ma-trix representations, is presented in Figure 9. The graph is based on
Fig. 9. Visualization design for the co-occurrence network graph fromLes Miserables. Left: Node-link diagram with force directed layout.Right: adjacency matrix design. A brushing and linking mechanism forthe graph edges is designed into this visualization. When the user se-lects a set of edges from either the left view or the right view, theseedges will be highlighted in both views.
character co-occurrence in Hugo’s Les Miserables1. The dataset con-tains a set of nodes and a set of edges, each edge referencing sourceand target nodes. The node-link diagram is constructed by first cre-ating a ForceLayout object, which runs the Fruchterman-Reingold al-gorithm [16] to compute the layout, and then attaching the resultingcoordinates (x and y values) to the nodes. The nodes are then drawn asa scatterplot of the attached x and y values. The edges between nodesare drawn using references to the node scatterplot.
The matrix representation is created by first assigning an index foreach node by the Expression object, then the edges are scattered asCircles with the source node’s index as the x axis, and the target node’sindex as the y axis. Since the index attached by the Expression objectcan be changed, users can use the “MoveElement” tool to drag thelabels on the left of the matrix to re-order the nodes.
This visualization design also supports brushing and linking. Weadded a BrushingValue object for the edges, so users can select a setof edges in the node-link diagram or in the matrix, and get them high-lighted in both views. Since the BrushingValue object supports brush-ing both numbers and colors, we can color the edges or change theirwidths by brushing. What graphical attribute (color, width) to brush isup to the user. With our system, users are free to design their way ofbrushing and linking, and have end-users perform it interactively.
Fig. 10. Weibo User Visualization. The datasets were crawled fromSina Weibo, including the metadata of the recent tweets of a selecteduser, their followers and friends. This visualization shows the user’s tra-jectory in a map view, and links the map view with the time axis. Scat-terplots of four joint distributions are shown. Due to privacy concerns,the data shown here is synthetic, roughly modeled on observed distri-butions only for illustrating the visualization design. Readers should notdraw any conclusion about Weibo users from this visualization.
6.4 Social Network Data
Next, we present an example with flexible linking between differentviews. We set up a data connection with WeiboEvents [26], whichcrawls data from Sina Weibo for iVisDesigner. The user can enter
1Dataset compiled by Donald Knuth, retrieved from
http://bl.ocks.org/mbostock/4062045

2099REN ET AL.: IVISDESIGNER: EXPRESSIVE INTERACTIVE DESIGN OF INFORMATION VISUALIZATIONS
P1
P2
P3
P4
Axis1
Axis2
Axis3
Axis1-2Axis2-3Axis1-2-3
Axis1 Axis2 Axis3
Axis1-2 Axis2-3
Axis1-2-3
Bézier Curve
Fig. 11. Interactive Bezier-curve illustration: users can drag the fourcontrol points to change the shape of the curve.
an account name in Weibo, then the crawler will crawl the account’stweets, friends and followers, and send the resulting dataset to iVisDe-signer, where users can create visualization designs. Figure 10 shows avisualization designed for such a dataset. It consists of a map showingthe account’s trajectory by connecting all of its geo-tagged tweets onthe map. The map is linked with a time axis, revealing where the userwas located during each time period. The right side contains severalscatterplots, showing the statistics of the account’s followers. Userscould employ our system to create and connect various components,for example, they could move the time axis around, and see the con-nections more clearly, or link the map to the bottom timeline.
6.5 Generating Data from Scratch
In iVisDesigner, users can also create graphical designs without usingan underlying dataset. This can be useful, e.g., to illustrate some math-ematical concepts. In Figure 1 (6), we plotted the Butterfly Curve [12]on the canvas. This is done by first creating a Range generator object,which creates a range of numbers from 0 to 24π . Then, we createdtwo Expression objects, each of which takes the generated numbersin the range, computes the parametric expressions for the x and y co-ordinates, and attaches the values to the Range’s items. Finally, wecreated two Axis objects, a Scatter and a LineThrough object to visual-ize the function. The radii of the Circles are also bound to the functionvalue in this case. After initial setup, users can interactively changethe Range and the Expression as well, or define other mappings suchas the color of the Circles.
In Figure 11, we created an interactive illustration of Bezier curves.We first created a Range of numbers from 0 to 1 as the t parameterin the curve, then created four Circles as the control points. Next wecreated three Axis objects connecting the four control points, then twoAxis objects between the previous three, one Axis between the previ-ous two, and finally the LineThrough that connects all the points inthe Bezier curve. After the configuration, users can move the controlpoints freely, the curve will change according to the user’s interaction.
For these examples, we didn’t employ any dataset. In our system,users can not only create data visualizations, but also create mathe-matical illustrations or even artistic designs, using a set of graphicalobjects and generator objects.
7 EVALUATION
In this section, we first present a performance evaluation of our systemand then show the results of an informal user study we conducted.
7.1 Performance Evaluation
We analyzed the overhead added by iVisDesigner’s mechanism forrendering visualizations. Our experiments were done on a MacBookPro with 2.6GHz Intel Core i7 processor, 8GB RAM, running MacOSX 10.9.2. The browser used was Google Chrome 33.0.1750.146. Wecompared the rendering performance of our system with hard-codedJavascript and D3.js.
We created three visualization designs for the test: (1) Scatterplotwith uniform size: a scatterplot for the Cars dataset (406 cars), show-ing MPG and Displacement, with circle size 5. (2) Scatterplot withmapped size: the same scatterplot, but the circle radius is mapped as
the number of cylinders. (3) Timeline: A timeline plot showing min-imum temperature in a particular place over 115 days. The times torender these visualizations are 7.3ms, 7.6ms, 0.3ms respectively. Thehardcoded version runs 5 to 7 times faster (1.7ms, 1.5ms, 0.04ms) thanour system. This is because we have an extra layer of data enumerationand mapping, which involves a lot of function calls in the code. D3.jsis around 6 to 30 times slower (61.3ms, 52.2ms, 11.1ms) than our sys-tem. Since our system uses HTML5 Canvas as the rendering engine, itis not a fair comparison with D3.js, which renders graphical elementsas SVG elements, but since D3.js is a successful programming-basedvisualization framework that is seen as reasonably efficient, we see thisresult as encouraging. We chose Canvas as the rendering engine be-cause it is very fast, and we do not rely on the simplified mouse eventsprovided by SVG, since our system itself is responsible for handlingmouse events.
We also measured the amount of time to render the visualizationsin our design examples. The Graph in Figure 9 with 77 nodes and 254edges, takes 43.54ms to render, the SPPC in Figure 4 (2) with 406 carstakes 28.61ms, and the Beijing Air Pollution visualization in Figure 2with 3132 measurements for 36 stations takes 90.49ms to render.
The results of the performance evaluation shows that our prototypesystem is able to handle visualizations with hundreds or a few thou-sands of graphical items at real-time or at least interactive frame rates.The performance can be further improved by incorporating optimiza-tion techniques, such as reducing the number of function calls andauxiliary objects in the rendering process.
7.2 Informal User Study
We conducted an informal user study for our system. The user studywas designed to solicit feedback from real users of the system, aftershowing and teaching them the basic principles. We recruited 8 users,4 male and 4 female, ranging in age from 24 to 32 years, with a medianof 25, most of whom had Computer Science backgrounds and were fa-miliar with computer-based visualization concepts. We also recruitedone of them for a supervised study in the style of a thinking-out-loudcognitive walkthrough.
The informal user study was conducted on an online web interface,with participants performing various tasks, and optionally asking thesupervisor questions. After a short introduction of the iVisDesignertool and the goal of the study, users watched an 8-minute video tu-torial (similar to the supplementary video) explaining basic steps increating a scatterplot for the Cars dataset, a graph visualization of thecharacter co-occurrence data, and some brushing and linking interac-tions on existing designs. Next, they were asked to try the system byfollowing some steps from the video to get an initial sense of the logicand interactions of the system, and then to try and create their owndesigns from what they have learned. Finally, the users were asked tocomplete a survey with Likert-scale (2 = Strongly Agree, 1, 0, -1, -2 =Strongly Disagree) questions. All in all, users spent on the order of anhour on the user study. These are the average results for the question-naires: “iVisDesigner is {expressive (1.75), easy to use (0.63), easyto understand (1.13), useful (1.88) }”, “iVisDesigner is good for { ba-sic visualizations (1.75), novel visualizations (1.25), multidimensionaldata (1.75), graph data (1.50), time-series data (1.63), visual analytics(1.00), overview (1.75), artistic designs (1.00) }”. Most of the ratingsare towards the top of the scale (2 or 1), with a few lower scores on“easy to use” and “easy to understand”. Participants believed that oursystem is very expressive and useful, and good for designing visualiza-tions for different types of data. One participant said that the system isvery flexible, he could “make combinatory data/feature selection, forexample, linking 2D and 1D elements together to create a polyline”.From their textual comments, we observed that participants made useof templates very well; basic visualization designs could be createdwithout difficulty. Ease of use and ease of understanding is more of achallenge for our system; as the participants pointed out, they had tocarefully watch the video to learn the interactions. They also requesteda more comprehensive user guide and tutorial. Usability could be im-proved by fine-tuning the user interactions. For example, one partic-ipant suggested we could enhance the highlighting when users select

2100 IEEE TRANSACTIONS ON VISUALIZATION AND COMPUTER GRAPHICS, VOL. 20, NO. 12, DECEMBER 2014
Fig. 12. A visualization design by the participant from the supervisedstudy. Each circle shows a cluster of tweets, dots between circles showthe time-dependent movement pattern between clusters.
an element, making it more visible for better guidance. The tool-tiptext in the status bar was also recommended to be moved upwards toattract more attention.
In addition, we recruited one participant, a researcher analyzingTwitter feeds for social feature extraction, for a supervised study. Wepresented three datasets for the participant to explore. The participantwas asked to construct visualization designs and try to understand thedatasets though these visualizations. During this process, the partic-ipant could ask for help on how to use the toolkit and he also com-mented on his mental processes and considerations.
The supervised study was informative and successful in the senseof user appreciation for the expressiveness, speed, and stability of thesystem. The participant experimented with the Weibo user dataset(discussed in subsection 6.4). Scatterplots were created to show thecorrelation of different attributes of a user’s friends, and the partici-pant made use of the brushing feature between two plots. Also, hetried to bind the radius of the points to the number of bidirectionalfollowers. “I could easily discover bot / celebrity clusters. Also, byvarying the radius of each circle proportional to the number of bidi-rectional followers, I was able to locate commercially used / institu-tional accounts. I was also able to locate individual / organizationalaccounts by looking at the logarithmic scatterplots by having differenttypes of attributes of users. The labeling is more flexible than other vi-sualization frameworks.”. The participant also experimented with theWeibo geographical dataset, which contains a set of users, each havingauthored a series of geo-tagged tweets. Before the experiment, the lo-cations in the dataset were clustered by a K-means algorithm, and thetrajectories of users were grouped as edges between clusters. The userproduced the visualization shown in Figure 12. “I’m able to identifyusage of Weibo on each geographical area in the city. By applyingtimeline stamps on each edge between adjacent nodes (clusters), wecan track the user movements between different locations over time.It is very interesting to see significant amount of communication andmovement between adjacent nodes which can perhaps be the reflectionof the physical proximity between the users.” “I would have spent 1–2hours to create this visualization by programming, it was done in a fewminutes using iVisDesigner.” The user also tried our system on one ofhis own Twitter datasets for a timeline plot, and identified some pre-viously undiscovered date-time conversion problems in his data pre-processing. In summary, with some supervision, the user graduallyunderstood the general process to create visualization designs in oursystem, and was able to apply his knowledge to create visualizationdesigns and understand the datasets.
8 DISCUSSION
In this work, we have presented iVisDesigner, a novel expressive in-teractive information visualization construction toolkit. iVisDesigneris able to cover a wider spectrum of possible visualization designsthan previous interactive (non-programming) toolkits. We already dis-cussed its limitations in terms of expressiveness in section 4. Here we
discuss usability concerns and possible future improvements.
As we increase expressiveness, the interactions to build a visual-ization design become more complex than required by more single-purpose toolkits such as [10], because we need to allow specificationof extra design parameters, which other toolkits predefine. Comparedto, e.g. the Flexible Linked Axes work, we need to specify what datato map from and what types of graphical elements to use, in additionto the axes and scatterplots. There is clearly a tradeoff between expres-siveness and complexity. A simple way to improve user accessibilityis to add more templates for existing designs. Users could start with acommon template, and then modify it to satisfy their own needs. Dur-ing the design and evaluation of the system, we have observed thatdesigning from scratch is much more involved than modifying an ex-isting design; providing templates certainly helps lower the barrier toentry. Another possible direction is to automate some design deci-sions by trying to predict what the user may want to show, filling insuggested informed default values for more complex parameters.
The learning curve of our system is not low. One contributing factoris that we haven’t yet optimized online help and error reporting, butwe are steadily improving on that front. However, when users haveto learn a whole set of new concepts, such as axes, references andcomponents, it will inevitably take some time for them to embrace thepossibilities and fully utilize their potential for creative designs.
In the framework of iVisDesigner, we did not yet fully consider theinteraction among graphical elements. For example, when drawing agraph, there might be multiple edges between two nodes, dependingon the dataset. In this case, users might want to define some rulesother than just placing two lines in the same place, for example, dou-ble the thickness, or use a different color. These types of designs arenot feasible in our current framework (also not in D3.js). We could in-sert a new step in the pipeline of our system, after the mapping stage.Once we have all the graphical elements, we can allow users to defineinteractions among graphical items before they get rendered.
Dynamic visualization design is another future direction. Up tonow, we have dealt predominantly with static visualizations, with theexception that we are able to re-render the visualization when thedataset is changed. However, users cannot define how a graphical el-ement appears or disappears when a corresponding data item is addedor removed. This could be achieved by adding a property on graphicalelements that would let users specify various types of transitions.
9 CONCLUSION
We presented iVisDesigner, an expressive interactive web-based infor-mation visualization construction toolkit. Our system was designed tobe a flexible tool for interactively creating information visualizations,inspired by interactive vector-based drawing tools and established in-formation visualization principles. The system allows users to freelyplace graphical elements, and links between them, on a large centralcanvas. We chose a declarative approach to avoid reliance on familiar-ity with programming and for keeping the usage simple and straight-forward. Our unified editing interface allows users to create and editgraphical, guide, and generator objects, enabling the interactive designof complex visualizations. We presented example applications to illus-trate the breadth of design possibilities, discussed the limitations andfuture improvement possibilities of our approach, and reported the re-sults of a performance evaluation and an informal user study. We hopethat this work can inspire further contributions in the field of interac-tive information visualization design.
The source code of iVisDesigner is available on Github:https://github.com/donghaoren/iVisDesigner.
ACKNOWLEDGMENTS
The authors wish to thank the anonymous reviewers for their ex-tremely helpful suggestions and criticisms. We acknowledge the par-ticipants in our user study for their valuable comments. This work waspartially supported by the U.S. Army Research Office under MURIgrant No. W911NF-09-1-0553 and the Office of Naval Research un-der contract N00014-14-1-0133.
2101REN ET AL.: IVISDESIGNER: EXPRESSIVE INTERACTIVE DESIGN OF INFORMATION VISUALIZATIONS
REFERENCES
[1] Flare. http://flare.prefuse.org/, Jan. 2014.
[2] Processing. http://processing.org/, Jan 2014.
[3] L. Bavoil, S. Callahan, P. Crossno, J. Freire, C. Scheidegger, C. Silva,
and H. Vo. Vistrails: enabling interactive multiple-view visualizations.
In Visualization, 2005. VIS 05. IEEE, pages 135–142, Oct. 2005.
[4] J. Bertin. Semiologie Graphique. Editions Gauthier-Villars, Paris, France,
1967.
[5] J. Bertin. Semiology of graphics. W. Berg, transl., University of Wiscon-
sin Press, Madison, Wisconsin, 1983.
[6] M. Bostock and J. Heer. Protovis: A graphical toolkit for visual-
ization. IEEE Transactions on Visualization and Computer Graphics,
15(6):1121–1128, Nov. 2009.
[7] M. Bostock, V. Ogievetsky, and J. Heer. D3 data-driven documents. IEEE
Transactions on Visualization and Computer Graphics, 17(12):2301–
2309, Dec. 2011.
[8] S. K. Card and J. Mackinlay. The structure of the information visualiza-
tion design space. In Proceedings of IEEE Symposium on Information
Visualization, pages 92–99, 1997.
[9] E. H.-H. Chi, P. Barry, J. Riedl, and J. Konstan. A spreadsheet approach to
information visualization. In Information Visualization, 1997. Proceed-
ings., IEEE Symposium on, pages 17–24, 1997.
[10] J. H. T. Claessen and J. J. van Wijk. Flexible linked axes for multivariate
data visualization. IEEE Transactions on Visualization and Computer
Graphics, 17(12):2310–2316, Dec. 2011.
[11] CMU StatLib. Car data. http://lib.stat.cmu.edu/datasets/cars.data.
[12] T. H. Fay. The butterfly curve. The American Mathematical Monthly,
96(5):pp. 442–443, 1989.
[13] J. Fekete. The infovis toolkit. In Information Visualization, 2004. INFO-
VIS 2004. IEEE Symposium on, pages 167–174, 2004.
[14] A. G. Forbes, T. Hollerer, and G. Legrady. “behaviorism”: a framework
for dynamic data visualization. Visualization and Computer Graphics,
IEEE Transactions on, 16(6):1164–1171, 2010.
[15] D. Foulser. Iris explorer: A framework for investigation. ACM SIG-
GRAPH Computer Graphics, 29(2):13–16, 1995.
[16] T. M. J. Fruchterman and E. M. Reingold. Graph drawing by force-
directed placement. Software-Practice and Experience, 21(11):1129–
1164, 1991.
[17] L. Grammel, C. Bennett, M. Tory, and M.-A. Storey. A survey of vi-
sualization construction user interfaces. In EuroVis-Short Papers, pages
19–23. The Eurographics Association, 2013.
[18] H. Guo, N. Mao, and X. Yuan. Wysiwyg (what you see is what you
get) volume visualization. Visualization and Computer Graphics, IEEE
Transactions on, 17(12):2106–2114, Dec. 2011.
[19] P. E. Haeberli. Conman: a visual programming language for interactive
graphics. In ACM SigGraph Computer Graphics, volume 22, pages 103–
111. ACM, 1988.
[20] J. Heer and M. Bostock. Declarative language design for interactive visu-
alization. IEEE Transactions on Visualization and Computer Graphics,
16(6):1149–1156, Nov. 2010.
[21] J. Heer, S. K. Card, and J. A. Landay. Prefuse: a toolkit for interactive
information visualization. In Proceedings of the SIGCHI conference on
Human factors in computing systems, pages 421–430. ACM, 2005.
[22] J. Heer, F. B. Viegas, and M. Wattenberg. Voyagers and voyeurs: support-
ing asynchronous collaborative information visualization. In Proceedings
of the SIGCHI conference on Human factors in computing systems, CHI
’07, pages 1029–1038, New York, NY, USA, 2007. ACM.
[23] B. Lee, R. Kazi, and G. Smith. Sketchstory: Telling more engaging sto-
ries with data through freeform sketching. Visualization and Computer
Graphics, IEEE Transactions on, 19(12):2416–2425, 2013.
[24] J. Mackinlay. Automating the design of graphical presentations of re-
lational information. ACM Transactions Graphics, 5(2):110–141, Apr.
1986.
[25] B. A. Myers, J. Goldstein, and M. A. Goldberg. Creating charts by
demonstration. In Proceedings of the SIGCHI Conference on Human
Factors in Computing Systems, CHI ’94, pages 106–111, New York, NY,
USA, 1994. ACM.
[26] D. Ren, X. Zhang, Z. Wang, J. Li, and X. Yuan. Weiboevents: A crowd
sourcing weibo visual analytic system. In Pacific Visualization Sympo-
sium (PacificVis), 2014 IEEE, pages 330–334, March 2014.
[27] S. F. Roth, J. Kolojejchick, J. Mattis, and J. Goldstein. Interactive graphic
design using automatic presentation knowledge. In Proceedings of the
SIGCHI conference on Human factors in computing systems, pages 112–
117. ACM, 1994.
[28] A. Satyanarayan and J. Heer. Lyra: An interactive visualization design
environment. In Computer Graphics Forum, volume 33. Wiley Online
Library, 2014.
[29] H.-J. Schulz, Z. Akbar, and F. Maurer. A generative layout approach
for rooted tree drawings. In Visualization Symposium (PacificVis), 2013
IEEE Pacific, pages 225–232, Feb 2013.
[30] B. Shneiderman. The eyes have it: A task by data type taxonomy for in-
formation visualizations. In In Proceedings of the 1996 IEEE Symposium
on Visual Languages, pages 336–343, 1996.
[31] Trifacta. The vega visualization grammar. http://trifacta.github.io/vega/.
[32] C. Upson, T. A. Faulhaber Jr, D. Kamins, D. Laidlaw, D. Schlegel,
J. Vroom, R. Gurwitz, and A. Van Dam. The application visualization
system: A computational environment for scientific visualization. Com-
puter Graphics and Applications, IEEE, 9(4):30–42, 1989.
[33] B. Victor. Drawing dynamic visualizations. http://vimeo.com/66085662,
Feb. 2013.
[34] F. B. Viegas, M. Wattenberg, F. van Ham, J. Kriss, and M. McKeon.
Manyeyes: a site for visualization at internet scale. IEEE Transactions
on Visualization and Computer Graphics, 13(6):1121–1128, Nov. 2007.
[35] J. Walny, B. Lee, P. Johns, N. Riche, and S. Carpendale. Understand-
ing pen and touch interaction for data exploration on interactive white-
boards. Visualization and Computer Graphics, IEEE Transactions on,
18(12):2779–2788, 2012.
[36] C. Weaver. Building highly-coordinated visualizations in improvise. In
Information Visualization, 2004. INFOVIS 2004. IEEE Symposium on,
pages 159–166, 2004.
[37] H. Wickham. ggplot2: Elegant Graphics for Data Analysis. Springer
Publishing Company, Incorporated, 2nd edition, 2009.
[38] L. Wilkinson. The grammar of graphics. Springer, 2005.
[39] W. Willett, J. Heer, J. Hellerstein, and M. Agrawala. Commentspace:
structured support for collaborative visual analysis. In Proceedings of the
2011 annual conference on Human factors in computing systems, CHI
’11, pages 3131–3140, New York, NY, USA, 2011. ACM.
[40] X. Yuan, P. Guo, H. Xiao, H. Zhou, and H. Qu. Scattering points in
parallel coordinates. IEEE Transactions on Visualization and Computer
Graphics, 15(6):1001–1008, Nov. 2009.