Embed Size (px)
Citation preview
IWMP-I VAD PROJECT MANGROL BLOCK, SURATPage -1
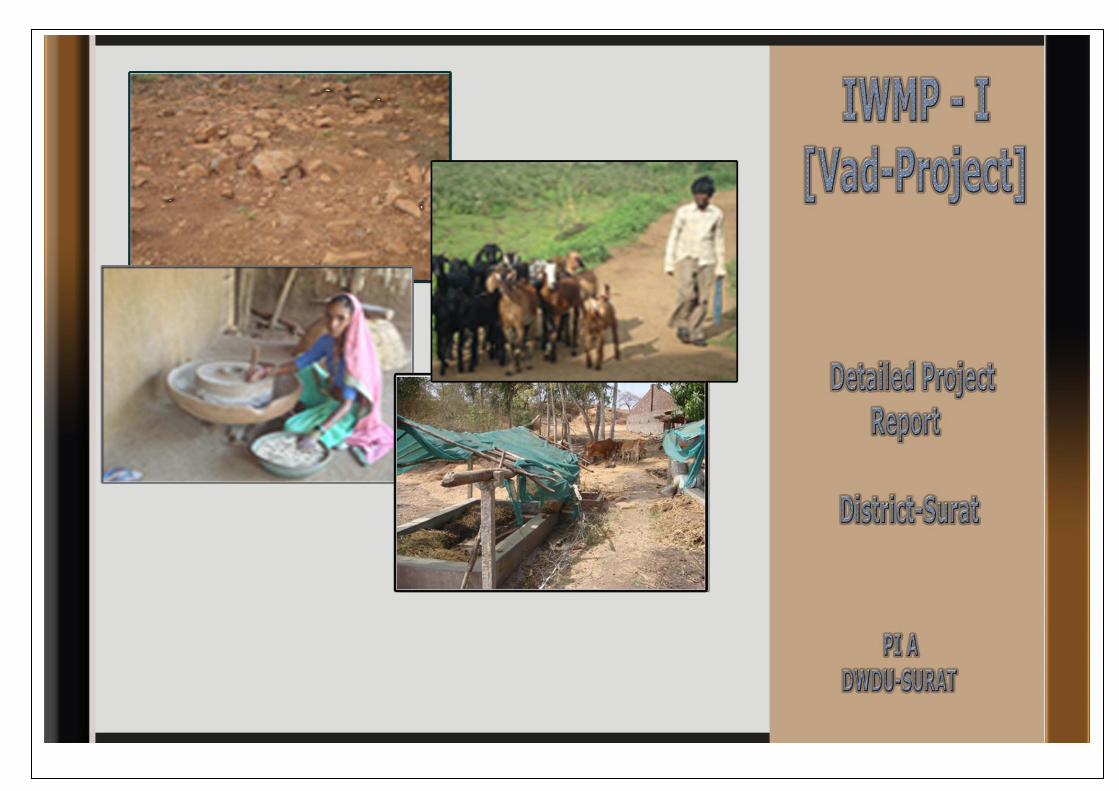
IWMP-I VAD PROJECT, MANGROL BLOCK , SURAT
DETAILED PROJECT REPORT (DPR)
IWMP-I VAD PROJECT MANGROL BLOCK, SURATPage -2
Contents Chapter-I: Project Background ..................................................................................................................................................................................................................... 11
1.1 Project Background ............................................................................................................................................................................................................................ 11
Project wise village area distribution (in Percent) ..................................................................................................................................................................................... 12
Table no.1: Basic project information ........................................................................................................................................................................................................... 13
Need of Watershed Development Programme:-....................................................................................................................................................................................... 14
Table no.2: Weight age of the project .......................................................................................................................................................................................................... 14
Table no:2.1 Criteria and weightage for selection of watershed ................................................................................................................................................................... 15
Table no.3: Watershed information ............................................................................................................................................................................................................. 17
Other Projects / Scheme running in the project area:- .............................................................................................................................................................................. 17
Table no.4: Developmental programmers running in the project area: ......................................................................................................................................................... 18
Table no. 5: Previous Watershed programmes in the project area: .............................................................................................................................................................. 19
CHAPTER-2............................................................................................................................................................................................................................................... 22
Project Implementing Agency ...................................................................................................................................................................................................................... 22
The Organization and its Objectives:- ........................................................................................................................................................................................................... 22
SWOT Analysis of DWDU .......................................................................................................................................................................................................................... 23
Strength:- ................................................................................................................................................................................................................................................ 23
Weakness:- .............................................................................................................................................................................................................................................. 23
Opportunities:- ........................................................................................................................................................................................................................................ 24
Threats:- .................................................................................................................................................................................................................................................. 24
Table no. 6: Detail PIA: ................................................................................................................................................................................................................................. 25
Table no. 7: Staff at PIA level:....................................................................................................................................................................................................................... 25
IWMP-I VAD PROJECT MANGROL BLOCK, SURATPage -3
Basic Information of Project Area:- .......................................................................................................................................................................................................... 27
Table no. 8: Land use pattern: ...................................................................................................................................................................................................................... 27
Land Use and Land Cover pattern............................................................................................................................................................................................................. 29
Soil and Topography .................................................................................................................................................................................................................................. 30
Table no. 9: Soil type and topography: ......................................................................................................................................................................................................... 30
Table no. 10: Flood and drought condition:............................................................................................................................................................................................... 31
11. Edaphic Factors .................................................................................................................................................................................................................................. 32
Table no. 11.1: Soil Salinity/Alkalinity (Salinity ingress) ................................................................................................................................................................................ 32
Land and Agriculture:- ............................................................................................................................................................................................................................... 33
Table no. 12: Climatic conditions: ................................................................................................................................................................................................................ 33
Table no. 13: Physiographic and relief .......................................................................................................................................................................................................... 34
Table no. 14: Land ownership details ........................................................................................................................................................................................................... 35
Per Household Land Availability ............................................................................................................................................................................................................... 36
Table no. 15: Detail Agriculture .................................................................................................................................................................................................................... 37
Table no. 16: Detail Irrigation .................................................................................................................................................................................................................... 38
Table no. 17 -A: Crop details: ..................................................................................................................................................................................................................... 39
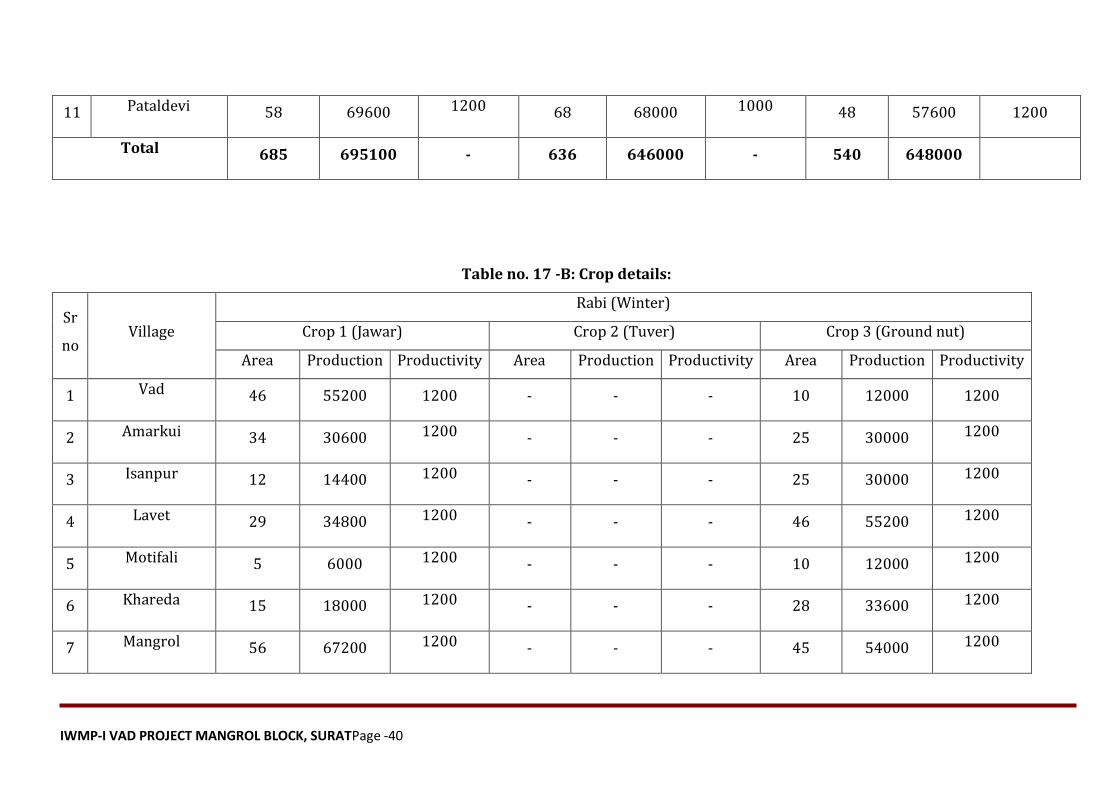
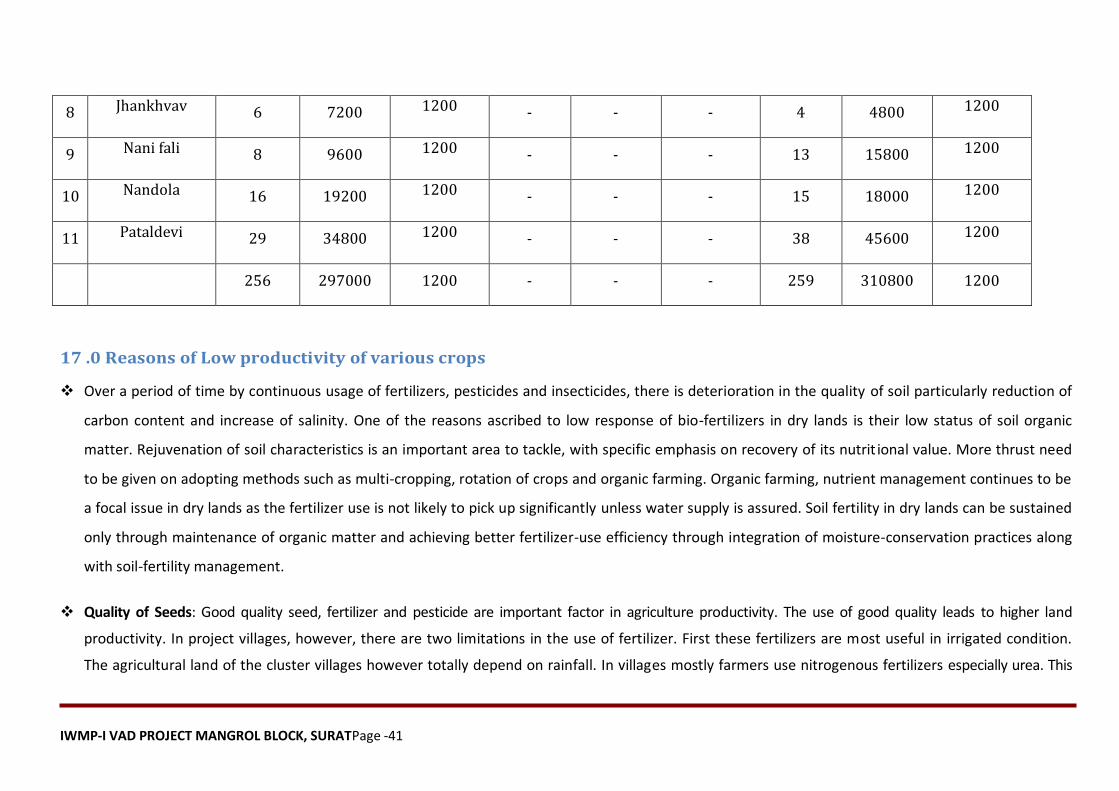
Table no. 17 -B: Crop details: ..................................................................................................................................................................................................................... 40
17 .0 Reasons of Low productivity of various crops ............................................................................................................................................................................. 41
Livestock: ............................................................................................................................................................................................................................................. 42
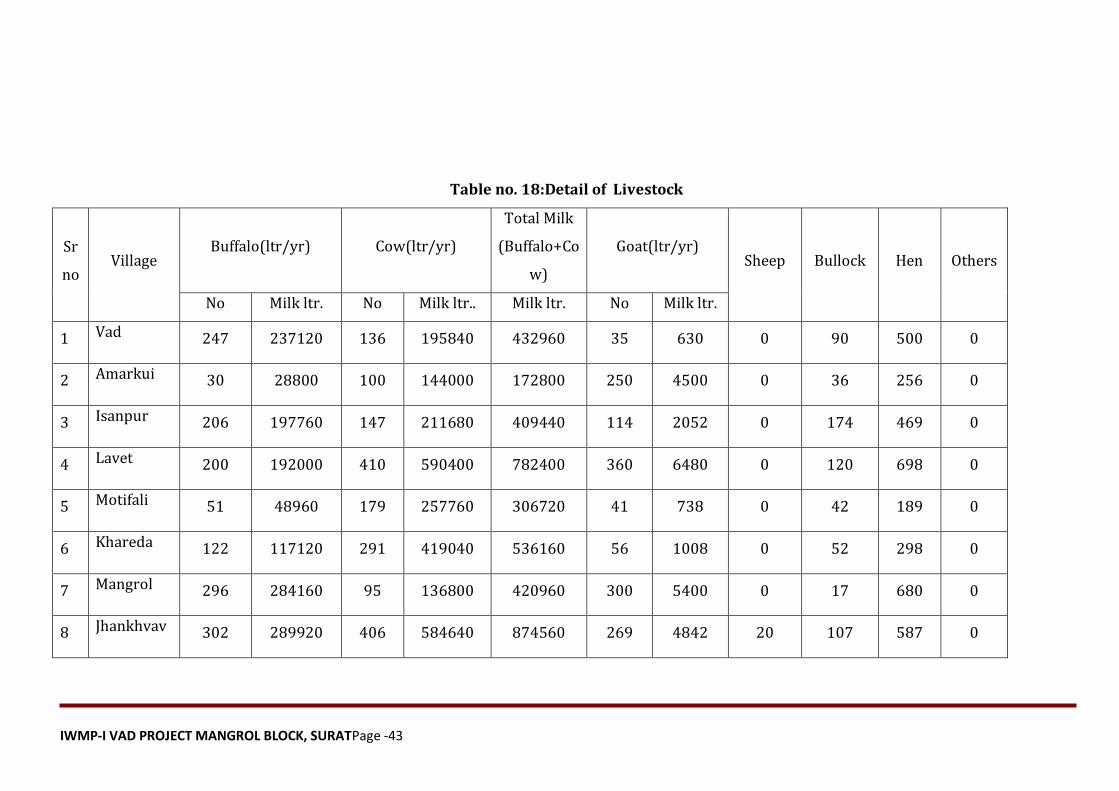
Table no. 18:Detail of Livestock ................................................................................................................................................................................................................ 43
Infrastructure Facilities:- ........................................................................................................................................................................................................................... 44
Table no. 19: Drinking water ..................................................................................................................................................................................................................... 45
IWMP-I VAD PROJECT MANGROL BLOCK, SURATPage -4
Table no. 20: Details of Common Property Resources .................................................................................................................................................................................. 46
Socio-Economic Profile ................................................................................................................................................................................................................................ 46
Demographic Status: .............................................................................................................................................................................................................................. 46
Table no. 21: Demographic information ....................................................................................................................................................................................................... 47
Population Distribution category wise ...................................................................................................................................................................................................... 48
Table no. 22: Literacy rate............................................................................................................................................................................................................................ 49
Migration Pattern:- .................................................................................................................................................................................................................................. 50
Table no. 23: Migration details..................................................................................................................................................................................................................... 50
Poverty .................................................................................................................................................................................................................................................... 51
Table no. 24: Poverty ................................................................................................................................................................................................................................... 51
25 Infrastructure facilities ........................................................................................................................................................................................................................ 52
Table no. 25: Village infrastructure .............................................................................................................................................................................................................. 53
Table no. 26 : Facilities / HH assets .............................................................................................................................................................................................................. 54
Livelihood pattern:- ..................................................................................................................................................................................................................................... 54
Table no. 27: Income ................................................................................................................................................................................................................................... 55
28. Dependence on Common Property Resource ..................................................................................................................................................................................... 55
Table no.28: Dependence on Forest/CPR ..................................................................................................................................................................................................... 56
Table no. 29: Livelihood pattern (Occupational distribution) ........................................................................................................................................................................ 57
Watershed Activities ................................................................................................................................................................................................................................ 59
Table no. 30: Details of Scientific Planning and Inputs in IWMP projects ................................................................................................................................................ 68
Institutional formation in watershed ........................................................................................................................................................................................................ 70
Table no. 31.1: Watershed Committee details in Vad Village ....................................................................................................................................................................... 71
IWMP-I VAD PROJECT MANGROL BLOCK, SURATPage -5
Table no. 31.2: Watershed Committee details in Amarkui Village ................................................................................................................................................................. 72
Table no. 31.3: Watershed Committee details in Isanpur Village .................................................................................................................................................................. 73
Table no. 31.4: Watershed Committee details in Lavet Village..................................................................................................................................................................... 74
Table no. 31.5: Watershed Committee details in Motifali Village.................................................................................................................................................................. 75
Table no. 31.6: Watershed Committee details in Khareda Village ................................................................................................................................................................. 76
Table no. 31.7: Watershed Committee details Mangrol in Village ................................................................................................................................................................ 77
Table no. 31.8: Watershed Committee details in Jhankhvav Village ............................................................................................................................................................. 78
Table no. 31.9: Watershed Committee details in Nani fali Village ................................................................................................................................................................. 79
Table no. 31.10: Watershed Committee details in Nandola Village ............................................................................................................................................................... 80
Table no. 31.11: Watershed Committee details in Pataldevi Village.............................................................................................................................................................. 81
Self Help group (SHG) ................................................................................................................................................................................................................................ 82
Table no. 32: SHG detail ............................................................................................................................................................................................................................... 83
Table no. 33: UG detail ................................................................................................................................................................................................................................ 85
Focused Group Discussion with villagers .................................................................................................................................................................................................. 88
Table no.34: Entry point activities (EPA) (All financial figures in lakh Rs.) ...................................................................................................................................................... 88
Specified by Villager for Entry Point Activity (EPA)........................................................................................................................................................................................ 90
Table no.35: Details of activities of preparatory phase (All financial figures in lakh Rs.) ............................................................................................................................... 91
36. Watershed Development Works: ....................................................................................................................................................................................................... 92
Table no.36.1: Activities related to Soil conservation in the project areas (all financial figures in lakh Rs.) .................................................................................................... 95
Table no.36.2:- Activities related to Soil conservation in the project areas (all financial figures in lakh Rs.)................................................................................................... 96
Table no.36,3:- Activities related to Soil conservation in the project areas (all financial figures in lakh Rs.)................................................................................................... 97
Table no.36.4:- Activities related to Soil conservation in the project areas (all financial figures in lakh Rs.)................................................................................................... 98
IWMP-I VAD PROJECT MANGROL BLOCK, SURATPage -6
Table no.36.5:- Activities related to Soil conservation in the project areas (all financial figures in lakh Rs.)................................................................................................... 98
Table no.36.6:- Activities related to Soil conservation in the project areas (all financial figures in lakhs Rs.) ................................................................................................. 99
Table no.36.7:- Activities related to Soil conservation in the project areas (all financial figures in lakh Rs.)................................................................................................. 100
Table no.36.8:- Activities related to Soil conservation in the project areas (all financial figures in lakh Rs.)................................................................................................. 100
Table no.36.9:- Activities related to Soil conservation in the project areas (all financial figures in lakh Rs.)................................................................................................. 101
Table no.36.10:- Activities related to Soil conservation in the project areas (all financial figures in lakh Rs.) ............................................................................................... 102
Table no.36.11:- Activities related to Soil conservation in the project areas (all financial figures in lakh Rs.) ............................................................................................... 103
Table no.37.1: Activities related to water conversation in the project areas (all financial figures in lakh Rs.) .............................................................................................. 104
Table no.37.2: Activities related to water conversation in the project areas (all financial figures in lakh Rs.) .............................................................................................. 104
Table no.37.3: Activities related to water conversation in the project areas (all financial figures in lakh Rs.) .............................................................................................. 105
Table no.37.4: Activities related to water conversation in the project areas (all financial figures in lakh Rs.) .............................................................................................. 105
Table no.37.5: Activities related to water conversation in the project areas (all financial figures in lakh Rs.) .............................................................................................. 106
Table no.37.6: Activities related to water conversation in the project areas (all financial figures in lakh Rs.) .............................................................................................. 106
Table no.37.7: Activities related to water conversation in the project areas (all financial figures in lakh Rs.) .............................................................................................. 107
Table no.37.8: Activities related to water conversation in the project areas (all financial figures in lakh Rs.) .............................................................................................. 107
Table no.37.9: Activities related to water conversation in the project areas (all financial figures in lakh Rs.) .............................................................................................. 108
Table no.37.10: Activities related to water conversation in the project areas (all financial figures in lakh Rs.) ............................................................................................ 108
Table no.37.11 Activities related to water conversation in the project areas (all financial figures in lakh Rs.) ............................................................................................. 109
Livelihood Intervention .............................................................................................................................................................................................................................. 109
Production System -1: Goatry Unit (Boer Unit) ....................................................................................................................................................................................... 109
Production System - 2: Vermi composting unit for Project villages ................................................................................................................................................................. 111
Table No-42.v: Returns from vermicomposting ...................................................................................................................................................................................... 115
IWMP-I VAD PROJECT MANGROL BLOCK, SURATPage -7
Table: 42.iv Model of a Vermi-compost Unit (10 ft *3 ft *2.5 ft) ............................................................................................................................................................. 115
Production System - 3: System For Rice Intensification (SRI Method) ......................................................................................................................................................... 117
Livelihood Intervention .......................................................................................................................................................................................................................... 121
Table no. 38: Activities related to livelihoods by Self Help Groups (SHGs) in the project areas .................................................................................................................... 125
Table no. 39: Other activities of watershed workphase proposed target .................................................................................................................................................. 127
Table no.40.1: Details of engineering structures in watershed works* ....................................................................................................................................................... 128
Table no.40.2: Details of engineering structures in watershed works* ....................................................................................................................................................... 129
Table no.40.3: Details of engineering structures in watershed works* ....................................................................................................................................................... 130
Table no.40.4: Details of engineering structures in watershed works* ....................................................................................................................................................... 131
Table no.40.5: Details of engineering structures in watershed works* ....................................................................................................................................................... 132
Table no.40.6: Details of engineering structures in watershed works* ....................................................................................................................................................... 133
Table no.40.7: Details of engineering structures in watershed works* ....................................................................................................................................................... 134
Table no.40.8: Details of engineering structures in watershed works* ....................................................................................................................................................... 135
Table no.40.9: Details of engineering structures in watershed works* ....................................................................................................................................................... 136
Table no.40.10: Details of engineering structures in watershed works* ..................................................................................................................................................... 137
Table no.40.11: Details of engineering structures in watershed works* ..................................................................................................................................................... 138
Table no.41.1: Details of activities related Afforestration in watershed works (In lakhs) ............................................................................................................................. 139
Table no.41.2: Details of activities related Afforestration in watershed works (In lakhs) ............................................................................................................................. 140
Table no.41.3: Details of activities related Afforestration in watershed works (In lakhs) ............................................................................................................................. 141
Table no.41.4: Details of activities related Afforestration in watershed works (In lakes) ............................................................................................................................. 141
Table no.41.5: Details of activities related Afforestration in watershed works (In lakes) ............................................................................................................................. 142
Table no.41.6: Details of activities related Afforestration in watershed works (In lakes) ............................................................................................................................. 143
IWMP-I VAD PROJECT MANGROL BLOCK, SURATPage -8
Table no.41.7: Details of activities related Afforestration in watershed works (In lakes) ............................................................................................................................. 143
Table no.41.8: Details of activities related Afforestration in watershed works (In lakes) ............................................................................................................................. 144
Table no.41.9: Details of activities related Afforestration in watershed works (In lakhs) ............................................................................................................................. 144
Table no.41.10: Details of activities related Afforestration in watershed works (In lakhs) ........................................................................................................................... 145
Table no.41.11: Details of activities related Afforestration in watershed works (In lakhs) ........................................................................................................................... 146
Table no.42.1: Details of allied / other activities ......................................................................................................................................................................................... 146
Table no.42.2: Details of allied / other activities ......................................................................................................................................................................................... 148
Table no.42.3: Details of allied / other activities ......................................................................................................................................................................................... 149
Table no.42.4: Details of allied / other activities ......................................................................................................................................................................................... 151
Table no.42.5: Details of allied / other activities ......................................................................................................................................................................................... 152
Table no.42.6: Details of allied / other activities ......................................................................................................................................................................................... 153
Table no.42.7: Details of allied / other activities ......................................................................................................................................................................................... 154
Table no.42.8: Details of allied / other activities ......................................................................................................................................................................................... 156
Table no.42.9: Details of allied / other activities ......................................................................................................................................................................................... 157
Table no.42.10: Details of allied / other activities ....................................................................................................................................................................................... 158
Table no.42.11: Details of allied / other activities ....................................................................................................................................................................................... 159
Table no.43: Details of activities in the CPRs in the project areas ............................................................................................................................................................... 160
4.4 Capacity building and Institutional collaboration ............................................................................................................................................................................. 163
Scope of capacity building at Project Villages ......................................................................................................................................................................................... 163
Table no. 44: Capacity Building Institution: ................................................................................................................................................................................................ 164
Table no. 45: Capacity Building plan: .......................................................................................................................................................................................................... 165
Table no.46: Information, education and Communication Activities: .......................................................................................................................................................... 166
IWMP-I VAD PROJECT MANGROL BLOCK, SURATPage -9
Table no. 47: Budget at a glance for the project ......................................................................................................................................................................................... 168
Table no. 48: Village wise- component wise budget available under IWMP (In Lacks) ........................................................................................ 168
Table no. 51: Public-Private Partnership in the IWMP projects ................................................................................................................................................................... 177
Table no. 52: Employment in Project area: ................................................................................................................................................................................................. 177
Table no. 53: Details of seasonal migration from Project area .................................................................................................................................................................... 178
Table no. 54: Details of average ground water table depth in the project areas (in meters) ....................................................................................................................... 179
Table no. 55: Status of Drinking water ....................................................................................................................................................................................................... 180
Tableno. 56: Details of Kharif crop area and yield in the project areas ........................................................................................................................................................ 181
Table no. 57: Area under horticulture ........................................................................................................................................................................................................ 186
Table no. 58: Forest/vegetative cover ....................................................................................................................................................................................................... 187
Table no. 59: Details of livestock in the project area .................................................................................................................................................................................. 188
(for fluids please mention in liters, for solids please mention in kgs. and income in Rs.) ...................................................................................................................... 188
Table no. 60: Backward-Forward linkages .............................................................................................................................................................................................. 191
Outcome analysis of the project ......................................................................................................................................................................................................... 196
7 Quality and Sustainability Issues ............................................................................................................................................................................................................. 201
7.1 Plans for Monitoring and Evaluation ................................................................................................................................................................................................. 201
7.2 Plans For Project management: ........................................................................................................................................................................................................ 202
7.3 Watershed Development Fund: ........................................................................................................................................................................................................ 202
7.4 User Charges: ................................................................................................................................................................................................................................... 202
MAPS ......................................................................................................................................................................................................................................................... 203
IWMP-I VAD PROJECT MANGROL BLOCK, SURATPage -10
CHAPTER-1 PROJECT BACKGROUND
IWMP-I VAD PROJECT MANGROL BLOCK, SURATPage -11
Chapter-I: Project Background
1.1 Project Background
Vad(IWMP-I) project is located in Mangrol Taluka, Surat District of Gujarat State. The Project is a cluster of eight micro watershed withd
with5C1B3b3b,5C1B3b3a,5C1B3b1c,5C1B3b1b,5C1B3b1d,5C1B3b1a,5C1B3a3d,5C1B3b1fas their respective codes. The total project area of the watershed is
about 6770.10 ha.of which5000 ha is proposed for treatment under Integrated Watershed Management Programme (IWMP).
Suratis the commercial capital of Gujarat and also the second-largest commercial hub of western India after Mumbai. Vad Project is situated
in Mangrol Taluka.The nearest Railway Station is Kosamba on Mumbai - Vadodara route which is around 22 km from the project area. All villages are well
connected with pacca roads on SH 166. The project includes 11villages of which largest village are the Vad after which the project is named. All the
villages are named after different water bodies which give the historical significance of water in the lives of the villagers. The project area is
homogenously populated by tribes which include Chaudhari, Vasava, Gamit, and some Muslims communities. The livelihood of these people is
primarily based on rain fed agriculture, animal husbandry, and wage labour.
The area isvery famous has industrial area due to its mining activity. GIPCL has huge power plant near Mangrol.Mininghas resulted in anuntold
havoc on the area and its geography, disturbing rivers, canalsand other water bodies. Mining has a detrimental effect on local vegetation. The
excavatedmaterial is dumped covering huge productive tracts. These overburden dumps then erode into fertile lands making them unproductive,
silt-up live water bodies.
IWMP-I VAD PROJECT MANGROL BLOCK, SURATPage -12
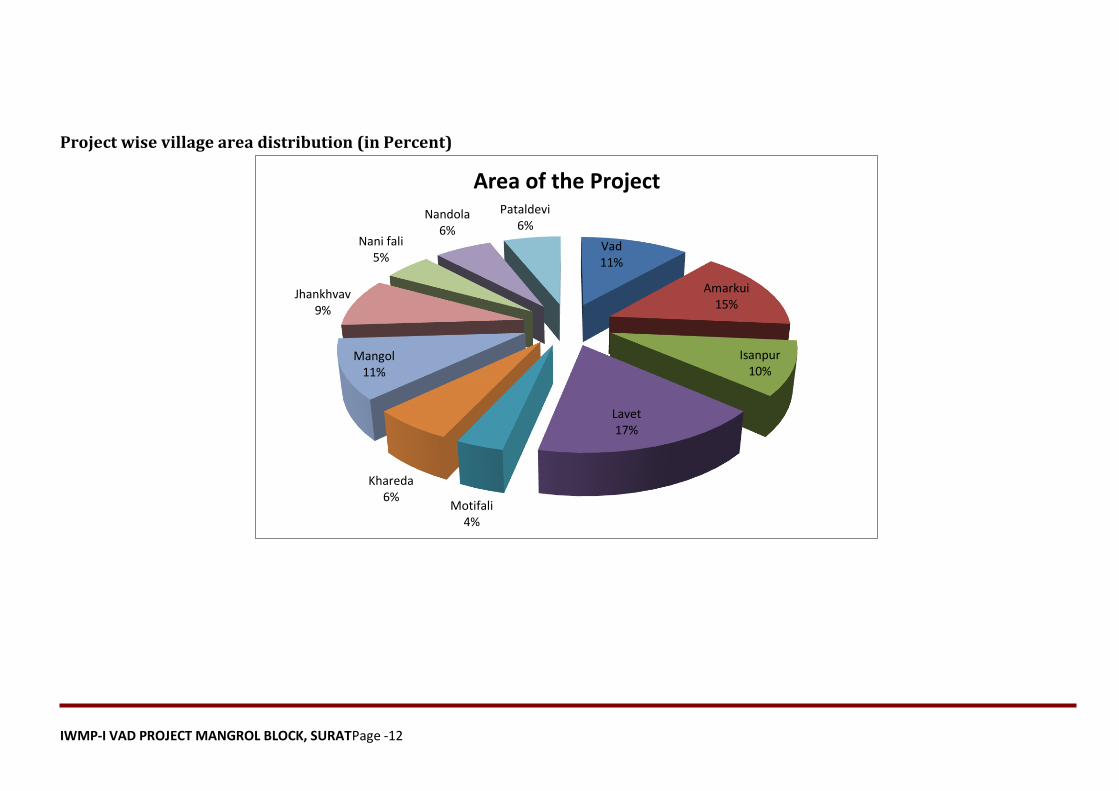
Project wise village area distribution (in Percent)
Vad 11%
Amarkui 15%
Isanpur 10%
Lavet 17%
Motifali 4%
Khareda 6%
Mangol 11%
Jhankhvav 9%
Nani fali 5%
Nandola 6%
Pataldevi 6%
Area of the Project
IWMP-I VAD PROJECT MANGROL BLOCK, SURATPage -13
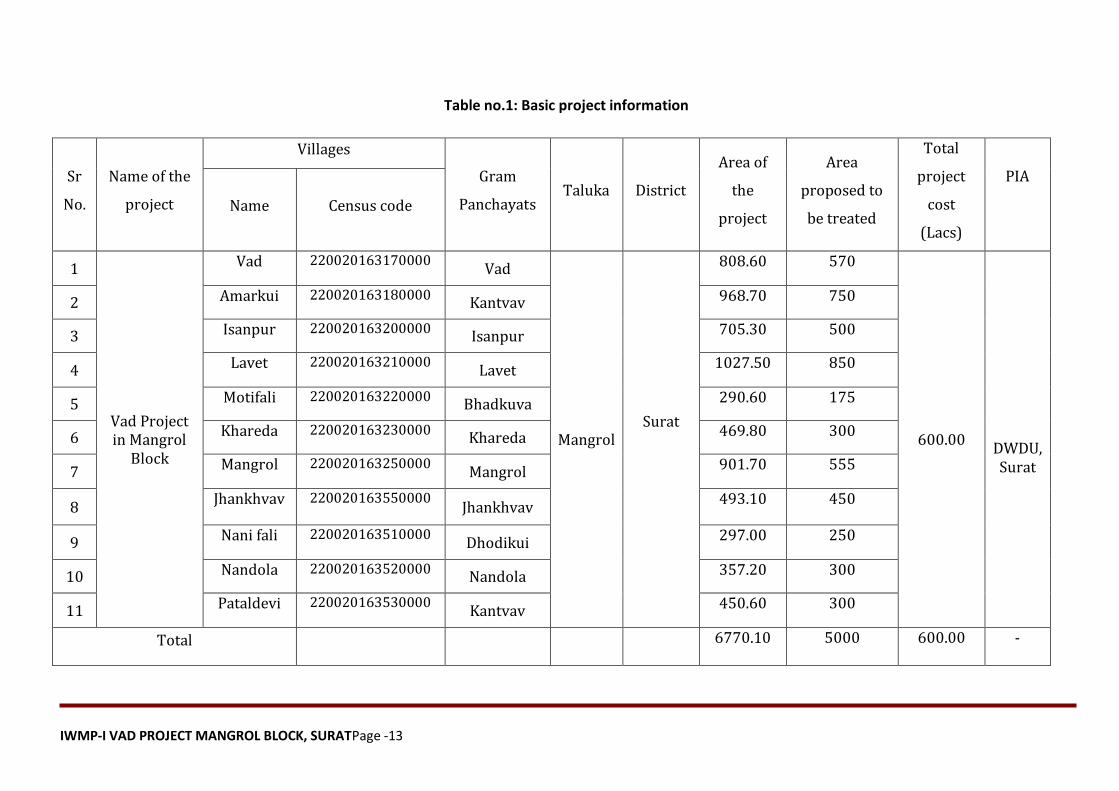
Table no.1: Basic project information
Sr
No.
Name of the
project
Villages
Gram
Panchayats Taluka District
Area of
the
project
Area
proposed to
be treated
Total
project
cost
(Lacs)
PIA
Name Census code
1
Vad Project in Mangrol
Block
Vad 220020163170000 Vad
Mangrol
Surat
808.60 570
600.00
DWDU, Surat
2 Amarkui 220020163180000 Kantvav 968.70 750
3 Isanpur 220020163200000 Isanpur 705.30 500
4 Lavet 220020163210000 Lavet 1027.50 850
5 Motifali 220020163220000 Bhadkuva 290.60 175
6 Khareda 220020163230000 Khareda 469.80 300
7 Mangrol 220020163250000 Mangrol 901.70 555
8 Jhankhvav 220020163550000
Jhankhvav 493.10 450
9 Nani fali 220020163510000 Dhodikui 297.00 250
10 Nandola 220020163520000 Nandola 357.20 300
11 Pataldevi 220020163530000 Kantvav 450.60 300
Total
6770.10 5000 600.00 -
IWMP-I VAD PROJECT MANGROL BLOCK, SURATPage -14
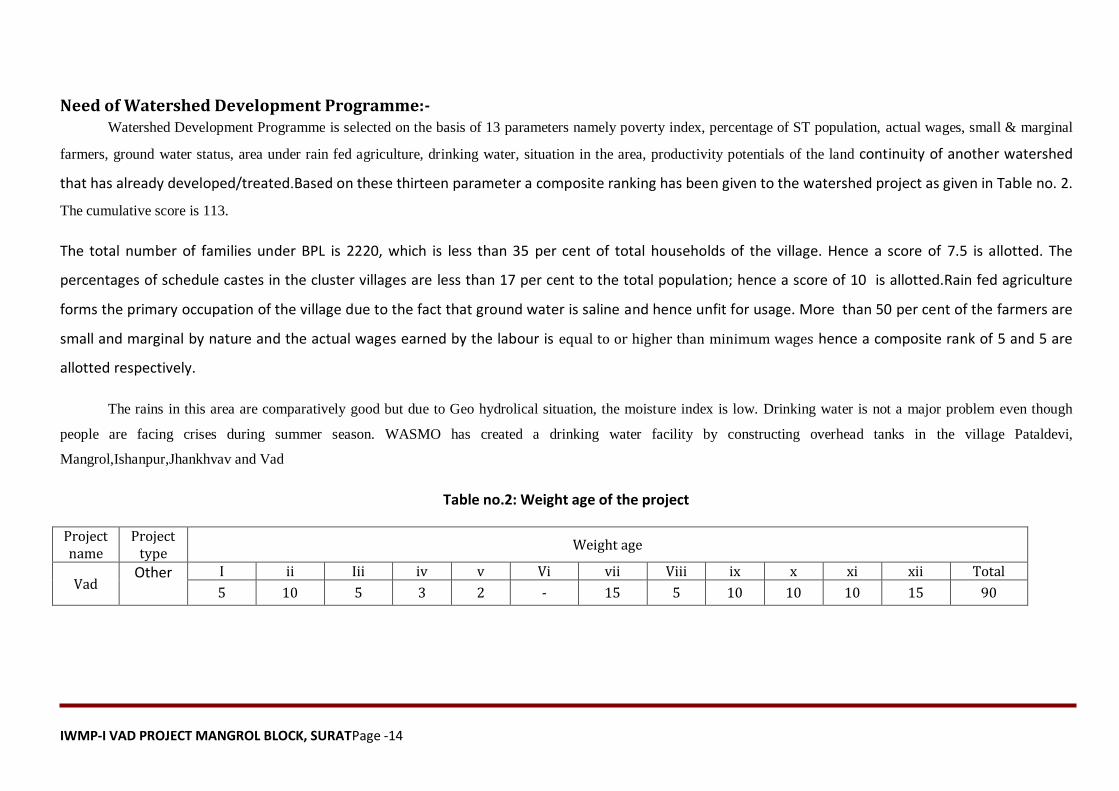
Need of Watershed Development Programme:- Watershed Development Programme is selected on the basis of 13 parameters namely poverty index, percentage of ST population, actual wages, small & marginal
farmers, ground water status, area under rain fed agriculture, drinking water, situation in the area, productivity potentials of the land continuity of another watershed
that has already developed/treated.Based on these thirteen parameter a composite ranking has been given to the watershed project as given in Table no. 2.
The cumulative score is 113.
The total number of families under BPL is 2220, which is less than 35 per cent of total households of the village. Hence a score of 7.5 is allotted. The
percentages of schedule castes in the cluster villages are less than 17 per cent to the total population; hence a score of 10 is allotted.Rain fed agriculture
forms the primary occupation of the village due to the fact that ground water is saline and hence unfit for usage. More than 50 per cent of the farmers are
small and marginal by nature and the actual wages earned by the labour is equal to or higher than minimum wages hence a composite rank of 5 and 5 are
allotted respectively.
The rains in this area are comparatively good but due to Geo hydrolical situation, the moisture index is low. Drinking water is not a major problem even though
people are facing crises during summer season. WASMO has created a drinking water facility by constructing overhead tanks in the village Pataldevi,
Mangrol,Ishanpur,Jhankhvav and Vad
Table no.2: Weight age of the project
Project name
Project type
Weight age
Vad Other I ii Iii iv v Vi vii Viii ix x xi xii Total
5 10 5 3 2 - 15 5 10 10 10 15 90
IWMP-I VAD PROJECT MANGROL BLOCK, SURATPage -15
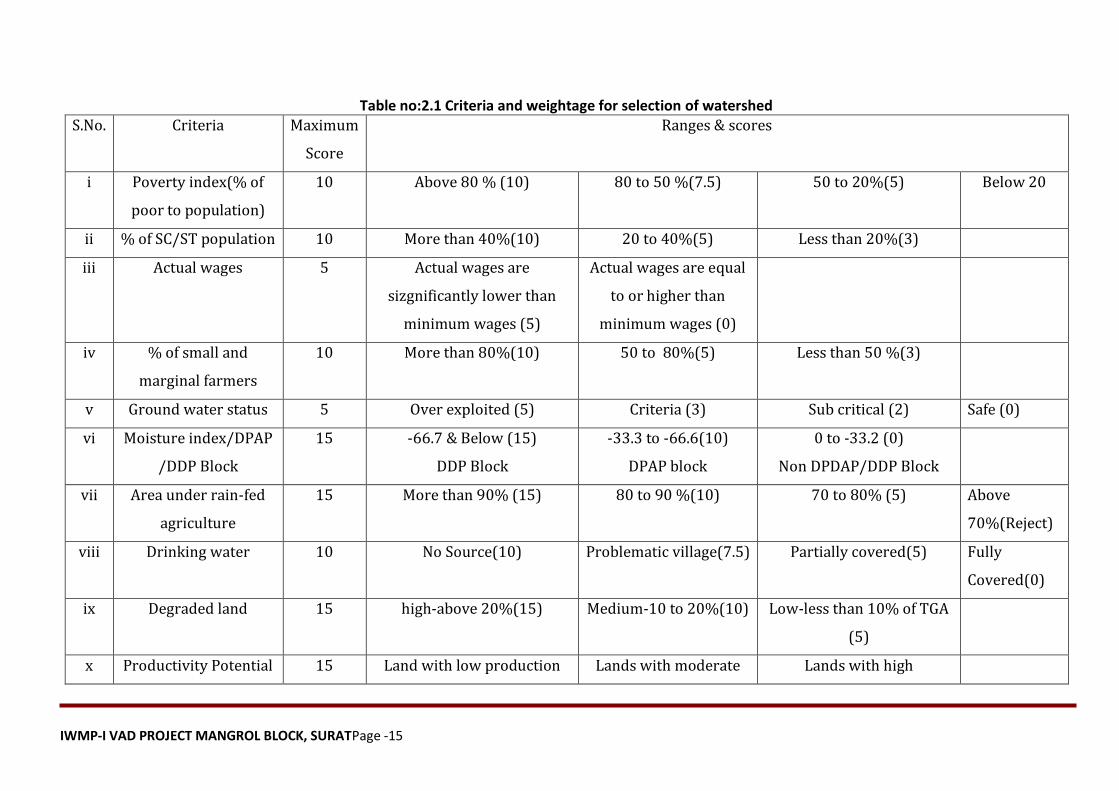
Table no:2.1 Criteria and weightage for selection of watershed S.No. Criteria Maximum
Score
Ranges & scores
i Poverty index(% of
poor to population)
10 Above 80 % (10) 80 to 50 %(7.5) 50 to 20%(5) Below 20
ii % of SC/ST population 10 More than 40%(10) 20 to 40%(5) Less than 20%(3)
iii Actual wages 5 Actual wages are
sizgnificantly lower than
minimum wages (5)
Actual wages are equal
to or higher than
minimum wages (0)
iv % of small and
marginal farmers
10 More than 80%(10) 50 to 80%(5) Less than 50 %(3)
v Ground water status 5 Over exploited (5) Criteria (3) Sub critical (2) Safe (0)
vi Moisture index/DPAP
/DDP Block
15 -66.7 & Below (15)
DDP Block
-33.3 to -66.6(10)
DPAP block
0 to -33.2 (0)
Non DPDAP/DDP Block
vii Area under rain-fed
agriculture
15 More than 90% (15) 80 to 90 %(10) 70 to 80% (5) Above
70%(Reject)
viii Drinking water 10 No Source(10) Problematic village(7.5) Partially covered(5) Fully
Covered(0)
ix Degraded land 15 high-above 20%(15) Medium-10 to 20%(10) Low-less than 10% of TGA
(5)
x Productivity Potential 15 Land with low production Lands with moderate Lands with high
IWMP-I VAD PROJECT MANGROL BLOCK, SURATPage -16
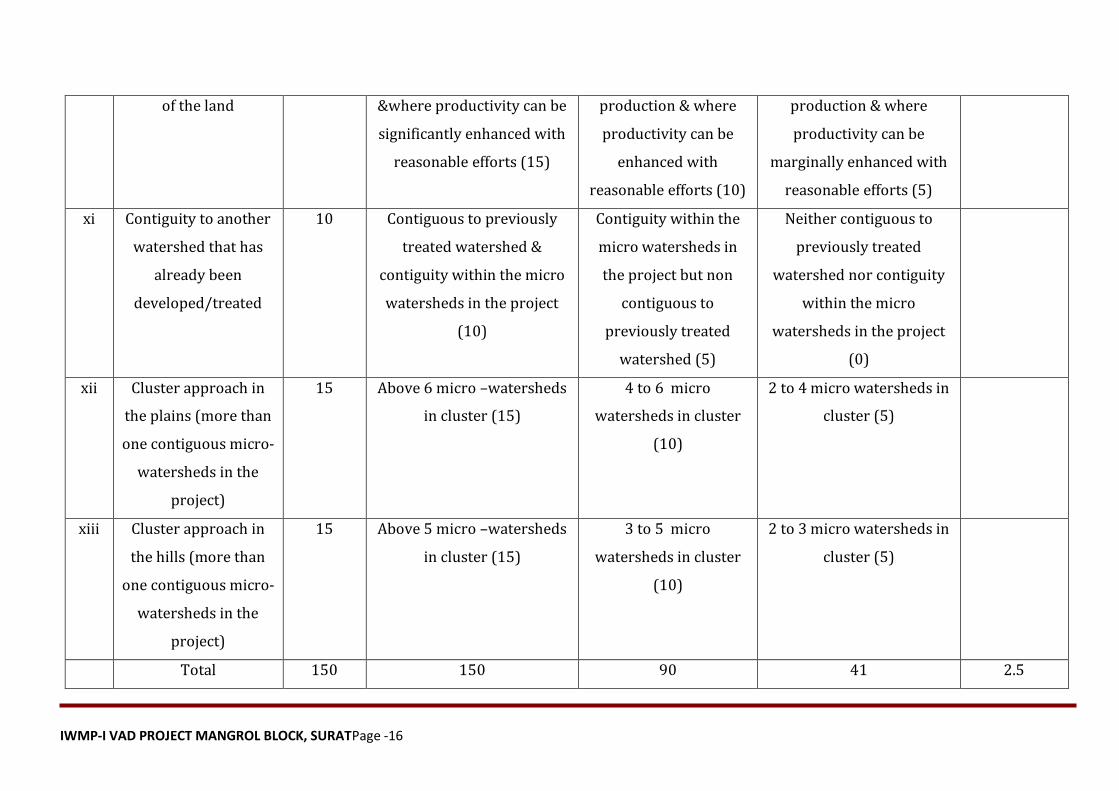
of the land &where productivity can be
significantly enhanced with
reasonable efforts (15)
production & where
productivity can be
enhanced with
reasonable efforts (10)
production & where
productivity can be
marginally enhanced with
reasonable efforts (5)
xi Contiguity to another
watershed that has
already been
developed/treated
10 Contiguous to previously
treated watershed &
contiguity within the micro
watersheds in the project
(10)
Contiguity within the
micro watersheds in
the project but non
contiguous to
previously treated
watershed (5)
Neither contiguous to
previously treated
watershed nor contiguity
within the micro
watersheds in the project
(0)
xii Cluster approach in
the plains (more than
one contiguous micro-
watersheds in the
project)
15 Above 6 micro –watersheds
in cluster (15)
4 to 6 micro
watersheds in cluster
(10)
2 to 4 micro watersheds in
cluster (5)
xiii Cluster approach in
the hills (more than
one contiguous micro-
watersheds in the
project)
15 Above 5 micro –watersheds
in cluster (15)
3 to 5 micro
watersheds in cluster
(10)
2 to 3 micro watersheds in
cluster (5)
Total 150 150 90 41 2.5
IWMP-I VAD PROJECT MANGROL BLOCK, SURATPage -17
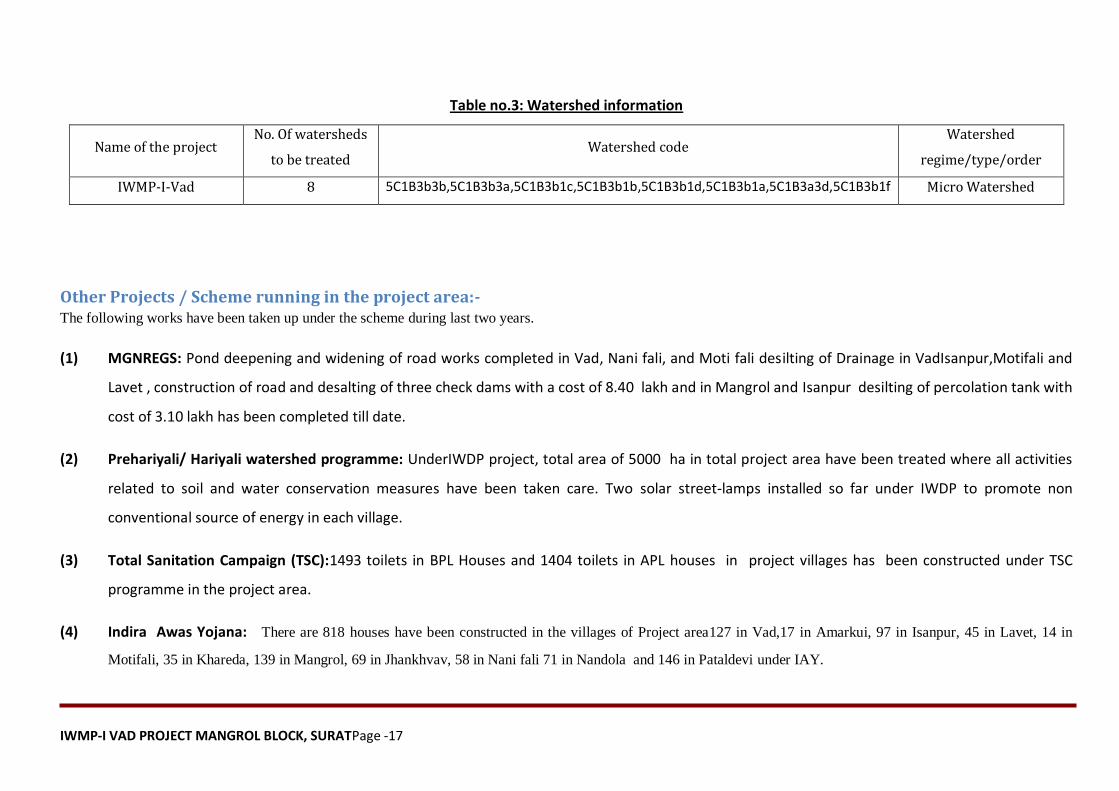
Table no.3: Watershed information
Name of the project No. Of watersheds
to be treated Watershed code
Watershed
regime/type/order
IWMP-I-Vad 8 5C1B3b3b,5C1B3b3a,5C1B3b1c,5C1B3b1b,5C1B3b1d,5C1B3b1a,5C1B3a3d,5C1B3b1f Micro Watershed
Other Projects / Scheme running in the project area:- The following works have been taken up under the scheme during last two years.
(1) MGNREGS: Pond deepening and widening of road works completed in Vad, Nani fali, and Moti fali desilting of Drainage in VadIsanpur,Motifali and
Lavet , construction of road and desalting of three check dams with a cost of 8.40 lakh and in Mangrol and Isanpur desilting of percolation tank with
cost of 3.10 lakh has been completed till date.
(2) Prehariyali/ Hariyali watershed programme: UnderIWDP project, total area of 5000 ha in total project area have been treated where all activities
related to soil and water conservation measures have been taken care. Two solar street-lamps installed so far under IWDP to promote non
conventional source of energy in each village.
(3) Total Sanitation Campaign (TSC):1493 toilets in BPL Houses and 1404 toilets in APL houses in project villages has been constructed under TSC
programme in the project area.
(4) Indira Awas Yojana: There are 818 houses have been constructed in the villages of Project area127 in Vad,17 in Amarkui, 97 in Isanpur, 45 in Lavet, 14 in
Motifali, 35 in Khareda, 139 in Mangrol, 69 in Jhankhvav, 58 in Nani fali 71 in Nandola and 146 in Pataldevi under IAY.
IWMP-I VAD PROJECT MANGROL BLOCK, SURATPage -18
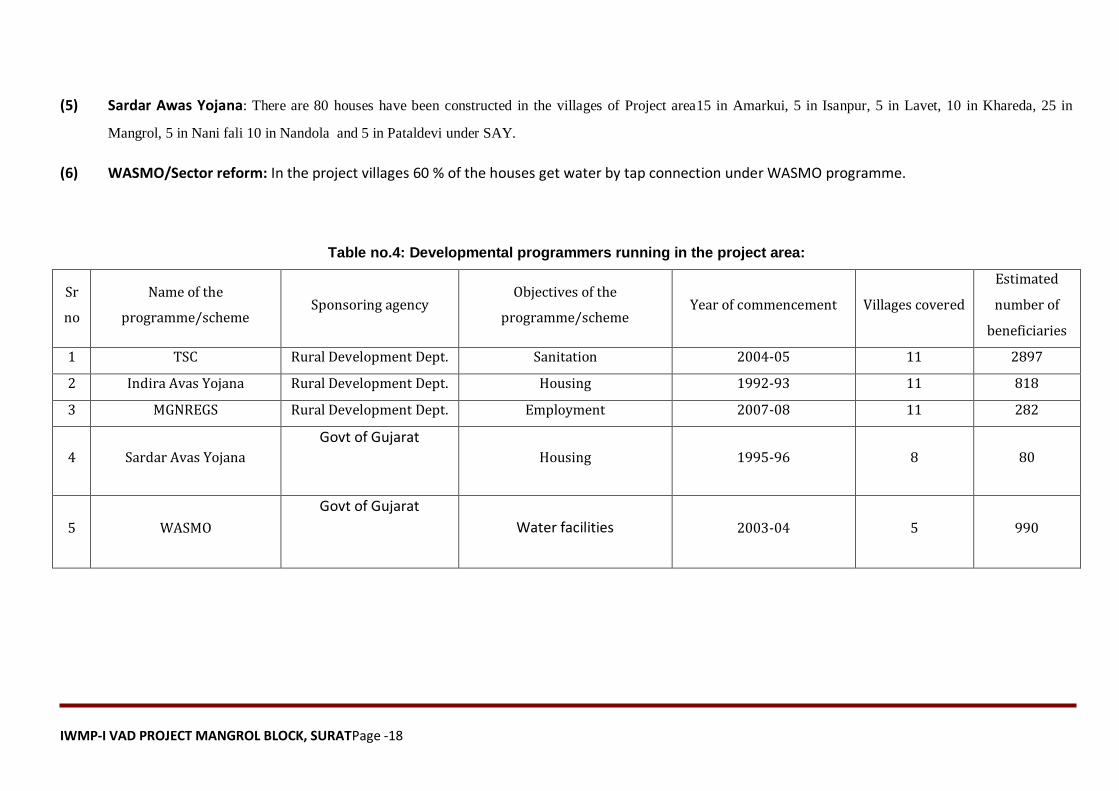
(5) Sardar Awas Yojana: There are 80 houses have been constructed in the villages of Project area15 in Amarkui, 5 in Isanpur, 5 in Lavet, 10 in Khareda, 25 in
Mangrol, 5 in Nani fali 10 in Nandola and 5 in Pataldevi under SAY.
(6) WASMO/Sector reform: In the project villages 60 % of the houses get water by tap connection under WASMO programme.
Table no.4: Developmental programmers running in the project area:
Sr
no
Name of the
programme/scheme Sponsoring agency
Objectives of the
programme/scheme Year of commencement Villages covered
Estimated
number of
beneficiaries
1 TSC Rural Development Dept. Sanitation 2004-05 11 2897
2 Indira Avas Yojana Rural Development Dept. Housing 1992-93 11 818
3 MGNREGS Rural Development Dept. Employment 2007-08 11 282
4 Sardar Avas Yojana
Govt of Gujarat
Housing 1995-96 8 80
5 WASMO
Govt of Gujarat
Water facilities 2003-04 5 990
IWMP-I VAD PROJECT MANGROL BLOCK, SURATPage -19
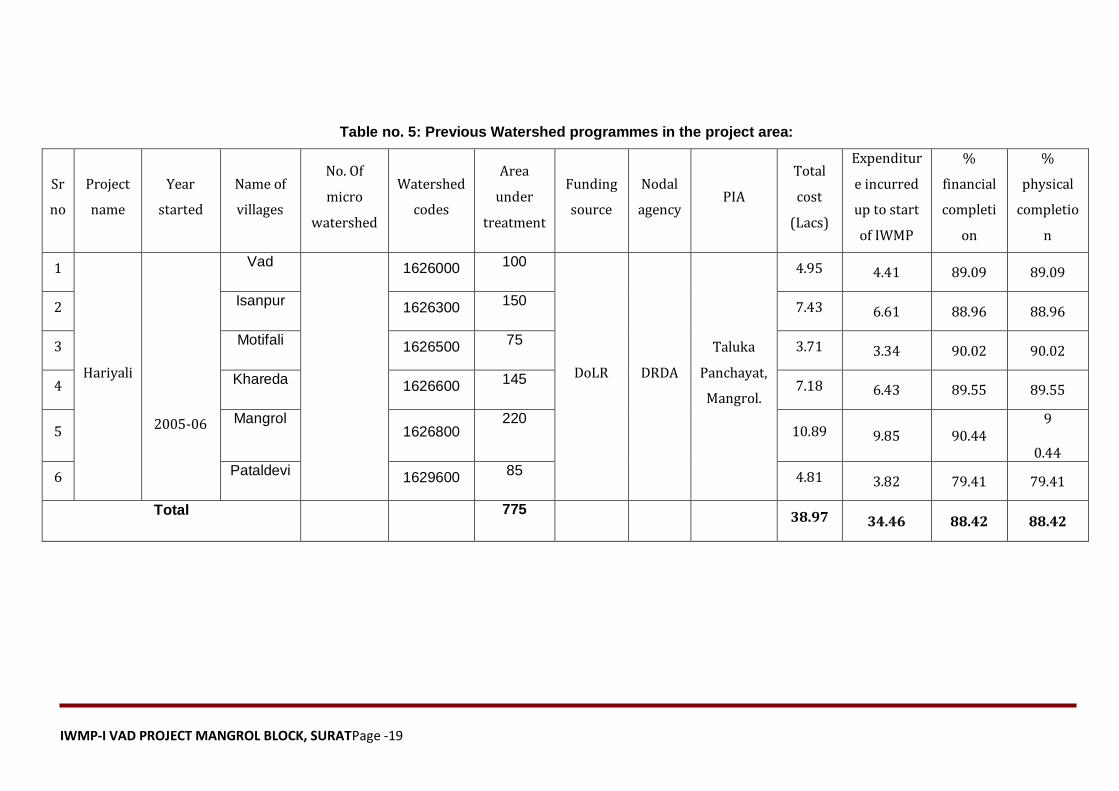
Table no. 5: Previous Watershed programmes in the project area:
Sr
no
Project
name
Year
started
Name of
villages
No. Of
micro
watershed
Watershed
codes
Area
under
treatment
Funding
source
Nodal
agency PIA
Total
cost
(Lacs)
Expenditur
e incurred
up to start
of IWMP
%
financial
completi
on
%
physical
completio
n
1
Hariyali
2005-06
Vad
1626000 100
DoLR DRDA
Taluka
Panchayat,
Mangrol.
4.95 4.41 89.09 89.09
2 Isanpur 1626300 150 7.43 6.61 88.96 88.96
3 Motifali 1626500 75 3.71 3.34 90.02 90.02
4 Khareda 1626600 145 7.18 6.43 89.55 89.55
5 Mangrol
1626800 220
10.89 9.85 90.44 9
0.44
6 Pataldevi 1629600 85 4.81 3.82 79.41 79.41
Total 775
38.97 34.46 88.42 88.42
IWMP-I VAD PROJECT MANGROL BLOCK, SURATPage -20
Back to Index
IWMP-I VAD PROJECT MANGROL BLOCK, SURATPage -21
CHAPTER-2 PROJECT IMPLEMENTING AGENCY
IWMP-I VAD PROJECT MANGROL BLOCK, SURATPage -22
CHAPTER-2 Project Implementing Agency
The Project Implementing Agency (PIA) is being selected by an appropriate mechanism by State Level Nodal Agency (SLNA). PIAs would be
responsible for implementation of watershed project. These PIAs may include relevant line departments, autonomous organizations under
State/Central Governments, Government Institutes/Research bodies, Intermediate Panchayat, Voluntary Organizations (VOs). The PIA of Vad
Watershed Project is District Watershed Development Unit, Surat
District Watershed Development Unit,Surat
Coordinator
The Organization and its Objectives:-
The District Watershed Development Unit (DWDU), Surat is a District level nodal agency and was established on 9 Dec, 2009 to oversee for the
smooth implementation of watershed projects in the district. The District Development Officer (DDO) is the chairman of the DWDU. The DWDU have
dedicated and experience staffs comprising one Project Manager (Deputation from Gujarat Forest Department) a technical expert (on contract basis)
and multidisciplinary team of agriculture expert, community mobilization expert, engineer, surveyor, accountant,computer operator and messenger
are recruited. The remaining staff i.e. MIS coordinator, system analyst and Office attendant will be requited Verysoon. The DWDU suratstaff are
temporarily sitting with the District Rural Development Agency (DRDA) at Golandaz building, nanpura, surat.s The objective of the DWDU are
supervising, planning, implementing, documenting and promoting watershed development project and related development activities in the district.
Moreover , the DWDU Surat will work as a PIA for Vad IWMP project.
IWMP-I VAD PROJECT MANGROL BLOCK, SURATPage -23
SWOT Analysis of DWDU
Strength:-
(1) Dedicated and experience staff and multidisciplinary team.
(2) Independent District Level Nodal Agency i.e DWDU Surat.
(3) Strong linkages with national and state level institutions, NavsariAgricultureUniversities, SouthGujaratUniversity and NGOs for capacity
building technical guidance.
(4) Scientific plan in watershed project with the help of BISAG, Gandhinagar.
(5) District level monitoring, coordination and cooperation committee.
(6) Well establishment of PRIs forsocial audit.
Weakness:-
(1) Insufficient funds for complete watershed project per hectare.
(2) No permanent staff.
(3) No permanent office building.
(4) Project area is located for away from District head quarter.
IWMP-I VAD PROJECT MANGROL BLOCK, SURATPage -24
Opportunities:-
(1) Sustainable livelihood generation landless and assetless.
(2) Improvement of socio economic status of poors.
(3) Awareness generation among the illiterate through IEC activities by usage of new ICT activities.
(4) Reduction of migration rate.
(5) Usage of new technologies of watershed modelling and GPS for monitoring the watershed activities.
Threats:-
(1) Lack of sustainable agriculture development.
(2) Delay of releasing project fund from the higher authority.
(3) Lack of contribution and cooperation from local people.
(4) High level of insecurity in between farmer due to land acquisition.
(5) Mining and Quarrying has resulted in water diversion and natural drainage.
(6) Low literacy rate in the project area.
IWMP-I VAD PROJECT MANGROL BLOCK, SURATPage -25
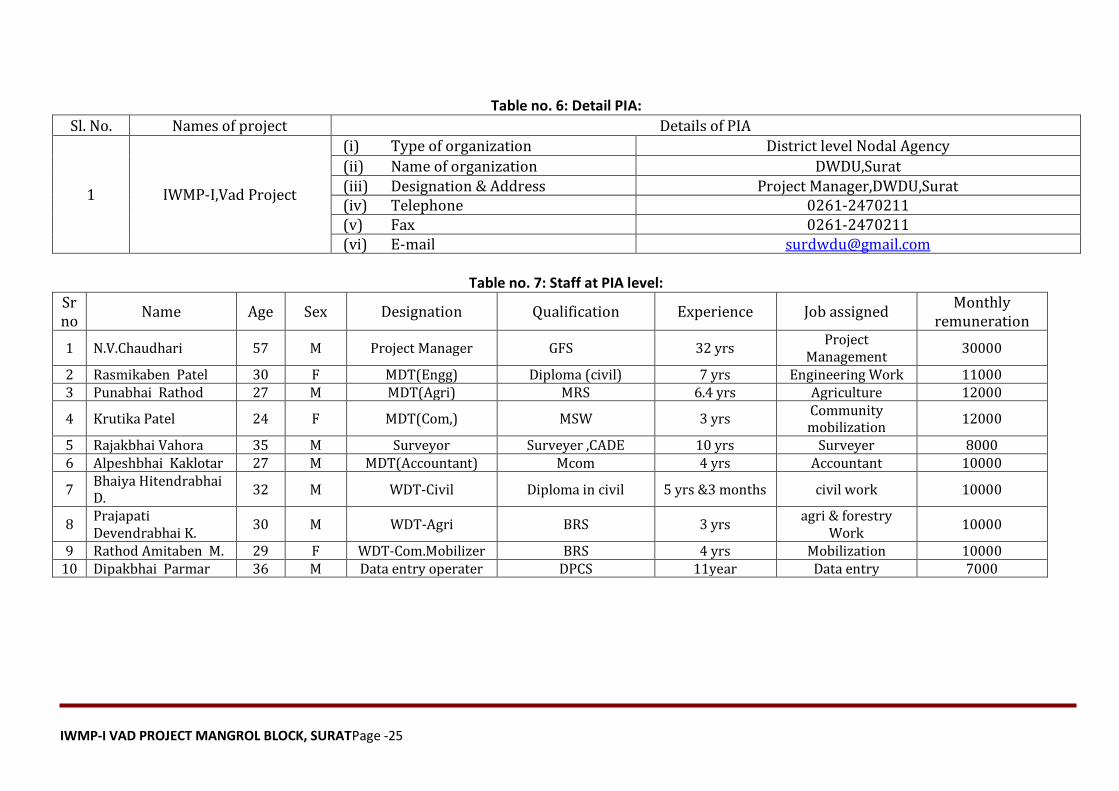
Table no. 6: Detail PIA:
Sl. No. Names of project Details of PIA
1 IWMP-I,Vad Project
(i) Type of organization District level Nodal Agency
(ii) Name of organization DWDU,Surat (iii) Designation & Address Project Manager,DWDU,Surat (iv) Telephone 0261-2470211 (v) Fax 0261-2470211 (vi) E-mail [email protected]
Table no. 7: Staff at PIA level:
Sr no
Name Age Sex Designation Qualification Experience Job assigned Monthly
remuneration
1 N.V.Chaudhari 57 M Project Manager GFS 32 yrs Project
Management 30000
2 Rasmikaben Patel 30 F MDT(Engg) Diploma (civil) 7 yrs Engineering Work 11000 3 Punabhai Rathod 27 M MDT(Agri) MRS 6.4 yrs Agriculture 12000
4 Krutika Patel 24 F MDT(Com,) MSW 3 yrs Community mobilization
12000
5 Rajakbhai Vahora 35 M Surveyor Surveyer ,CADE 10 yrs Surveyer 8000 6 Alpeshbhai Kaklotar 27 M MDT(Accountant) Mcom 4 yrs Accountant 10000
7 Bhaiya Hitendrabhai D.
32 M WDT-Civil Diploma in civil 5 yrs &3 months civil work 10000
8 Prajapati Devendrabhai K.
30 M WDT-Agri BRS 3 yrs agri & forestry
Work 10000
9 Rathod Amitaben M. 29 F WDT-Com.Mobilizer BRS 4 yrs Mobilization 10000 10 Dipakbhai Parmar 36 M Data entry operater DPCS 11year Data entry 7000
IWMP-I VAD PROJECT MANGROL BLOCK, SURATPage -26
CHAPTER-3 Basic Information of Project Area
IWMP-I VAD PROJECT MANGROL BLOCK, SURATPage -27
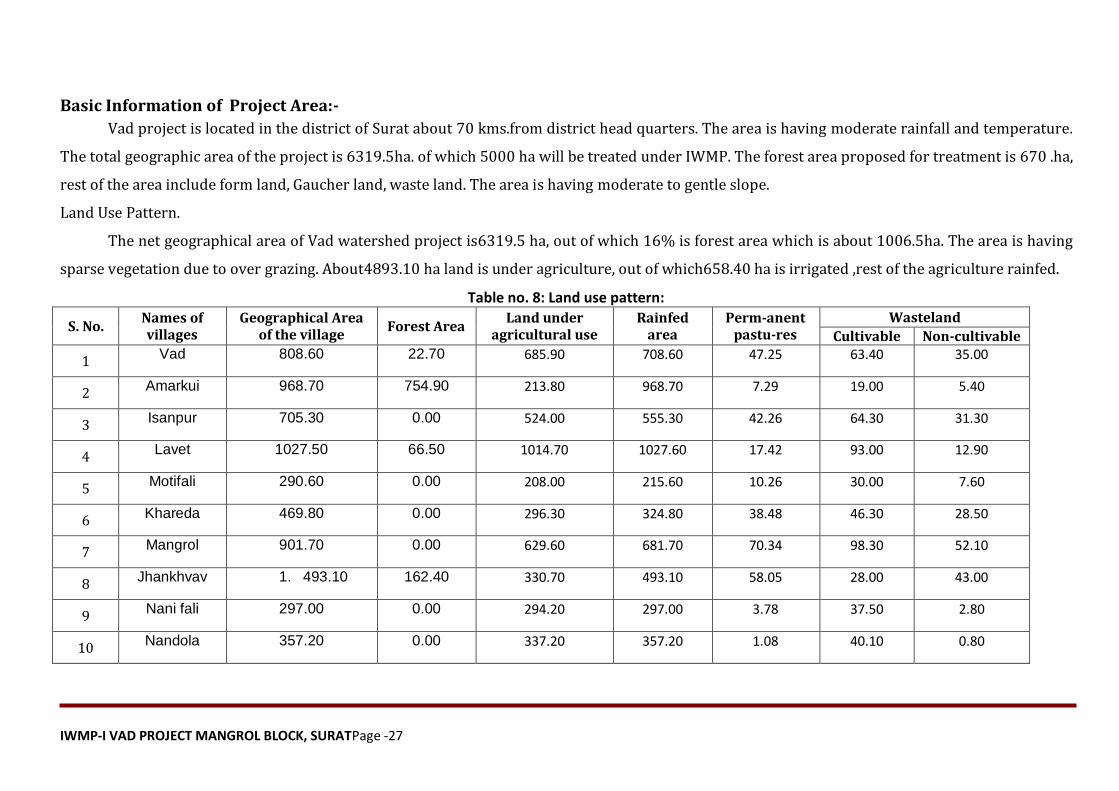
Basic Information of Project Area:-
Vad project is located in the district of Surat about 70 kms.from district head quarters. The area is having moderate rainfall and temperature.
The total geographic area of the project is 6319.5ha. of which 5000 ha will be treated under IWMP. The forest area proposed for treatment is 670 .ha,
rest of the area include form land, Gaucher land, waste land. The area is having moderate to gentle slope.
Land Use Pattern.
The net geographical area of Vad watershed project is6319.5 ha, out of which 16% is forest area which is about 1006.5ha. The area is having
sparse vegetation due to over grazing. About4893.10 ha land is under agriculture, out of which658.40 ha is irrigated ,rest of the agriculture rainfed.
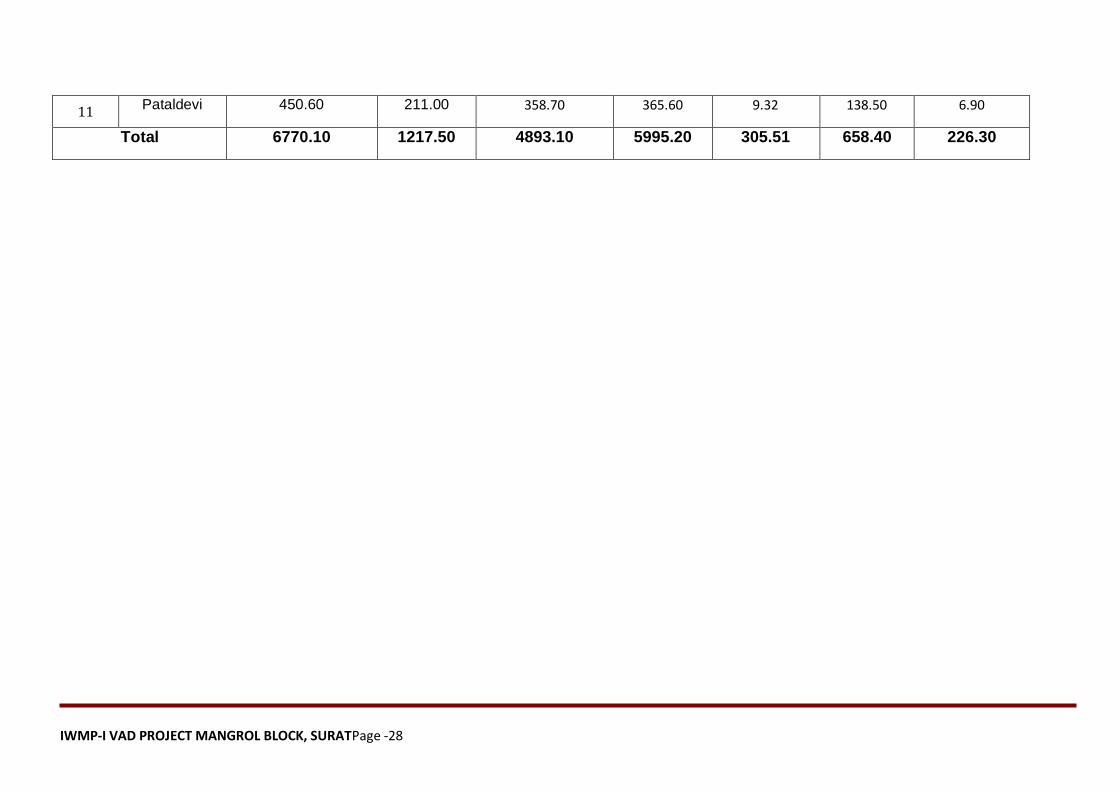
Table no. 8: Land use pattern:
S. No. Names of villages
Geographical Area of the village
Forest Area Land under
agricultural use Rainfed
area Perm-anent
pastu-res Wasteland
Cultivable Non-cultivable
1 Vad 808.60 22.70 685.90 708.60 47.25 63.40 35.00
2 Amarkui 968.70 754.90 213.80 968.70 7.29 19.00 5.40
3 Isanpur 705.30 0.00 524.00 555.30 42.26 64.30 31.30
4 Lavet 1027.50 66.50 1014.70 1027.60 17.42 93.00 12.90
5 Motifali 290.60 0.00 208.00 215.60 10.26 30.00 7.60
6 Khareda 469.80 0.00 296.30 324.80 38.48 46.30 28.50
7 Mangrol 901.70 0.00 629.60 681.70 70.34 98.30 52.10
8 Jhankhvav 1. 493.10 162.40 330.70 493.10 58.05 28.00 43.00
9 Nani fali 297.00 0.00 294.20 297.00 3.78 37.50 2.80
10 Nandola 357.20 0.00 337.20 357.20 1.08 40.10 0.80
IWMP-I VAD PROJECT MANGROL BLOCK, SURATPage -28
11 Pataldevi 450.60 211.00 358.70 365.60 9.32 138.50 6.90
Total 6770.10 1217.50 4893.10 5995.20 305.51 658.40 226.30
IWMP-I VAD PROJECT MANGROL BLOCK, SURATPage -29
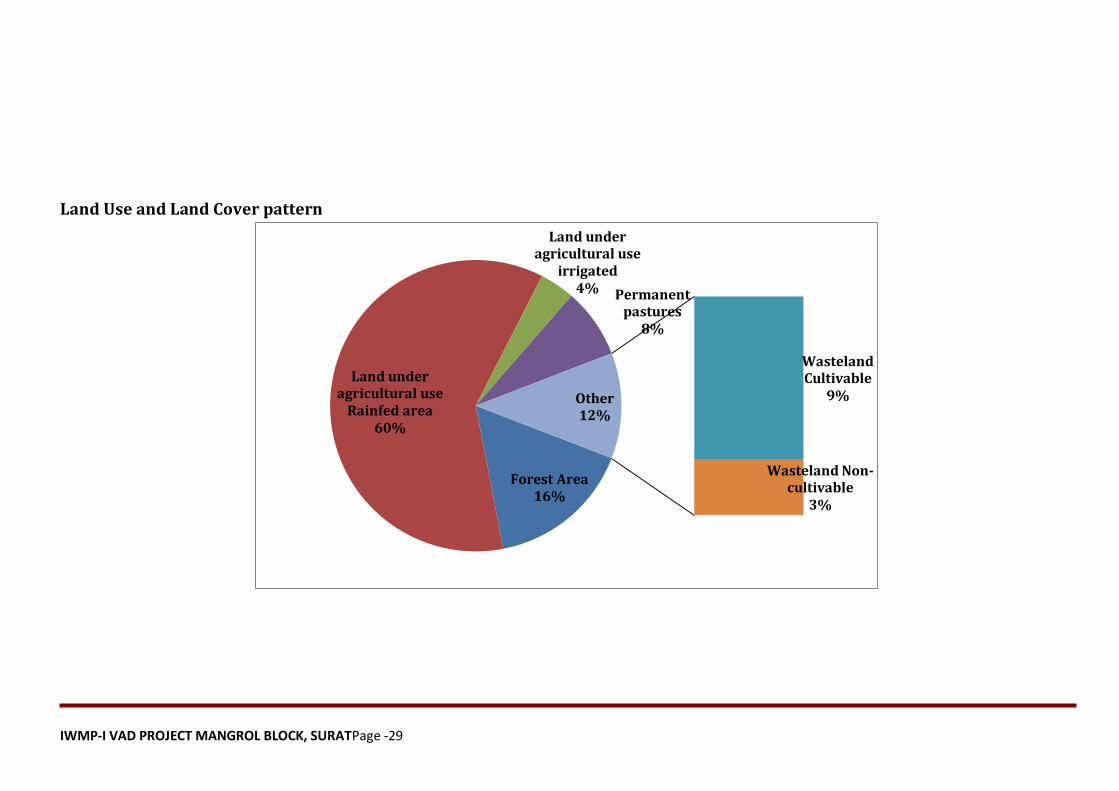
Land Use and Land Cover pattern
Forest Area 16%
Land under agricultural use
Rainfed area 60%
Land under agricultural use
irrigated 4% Permanent
pastures 8%
Wasteland Cultivable
9%
Wasteland Non-cultivable
3%
Other 12%
IWMP-I VAD PROJECT MANGROL BLOCK, SURATPage -30
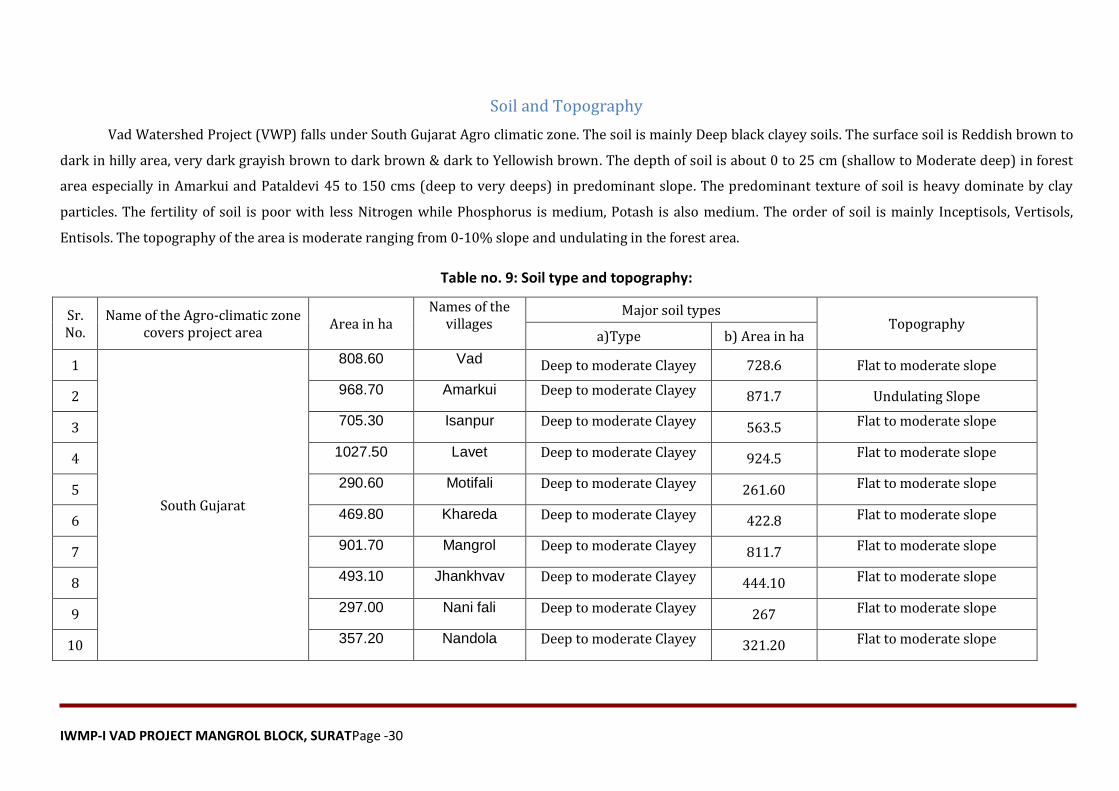
Soil and Topography
Vad Watershed Project (VWP) falls under South Gujarat Agro climatic zone. The soil is mainly Deep black clayey soils. The surface soil is Reddish brown to
dark in hilly area, very dark grayish brown to dark brown & dark to Yellowish brown. The depth of soil is about 0 to 25 cm (shallow to Moderate deep) in forest
area especially in Amarkui and Pataldevi 45 to 150 cms (deep to very deeps) in predominant slope. The predominant texture of soil is heavy dominate by clay
particles. The fertility of soil is poor with less Nitrogen while Phosphorus is medium, Potash is also medium. The order of soil is mainly Inceptisols, Vertisols,
Entisols. The topography of the area is moderate ranging from 0-10% slope and undulating in the forest area.
Table no. 9: Soil type and topography:
Sr. No.
Name of the Agro-climatic zone covers project area
Area in ha Names of the
villages
Major soil types Topography
a)Type b) Area in ha
1
South Gujarat
808.60 Vad Deep to moderate Clayey 728.6 Flat to moderate slope
2 968.70 Amarkui Deep to moderate Clayey 871.7 Undulating Slope
3 705.30 Isanpur Deep to moderate Clayey 563.5 Flat to moderate slope
4 1027.50 Lavet Deep to moderate Clayey 924.5 Flat to moderate slope
5 290.60 Motifali Deep to moderate Clayey 261.60 Flat to moderate slope
6 469.80 Khareda Deep to moderate Clayey 422.8 Flat to moderate slope
7 901.70 Mangrol Deep to moderate Clayey 811.7 Flat to moderate slope
8 493.10 Jhankhvav Deep to moderate Clayey 444.10 Flat to moderate slope
9 297.00 Nani fali Deep to moderate Clayey 267 Flat to moderate slope
10 357.20 Nandola Deep to moderate Clayey 321.20 Flat to moderate slope
IWMP-I VAD PROJECT MANGROL BLOCK, SURATPage -31
11 450.60 Pataldevi Deep to moderate Clayey 405.6 Undulating Slope
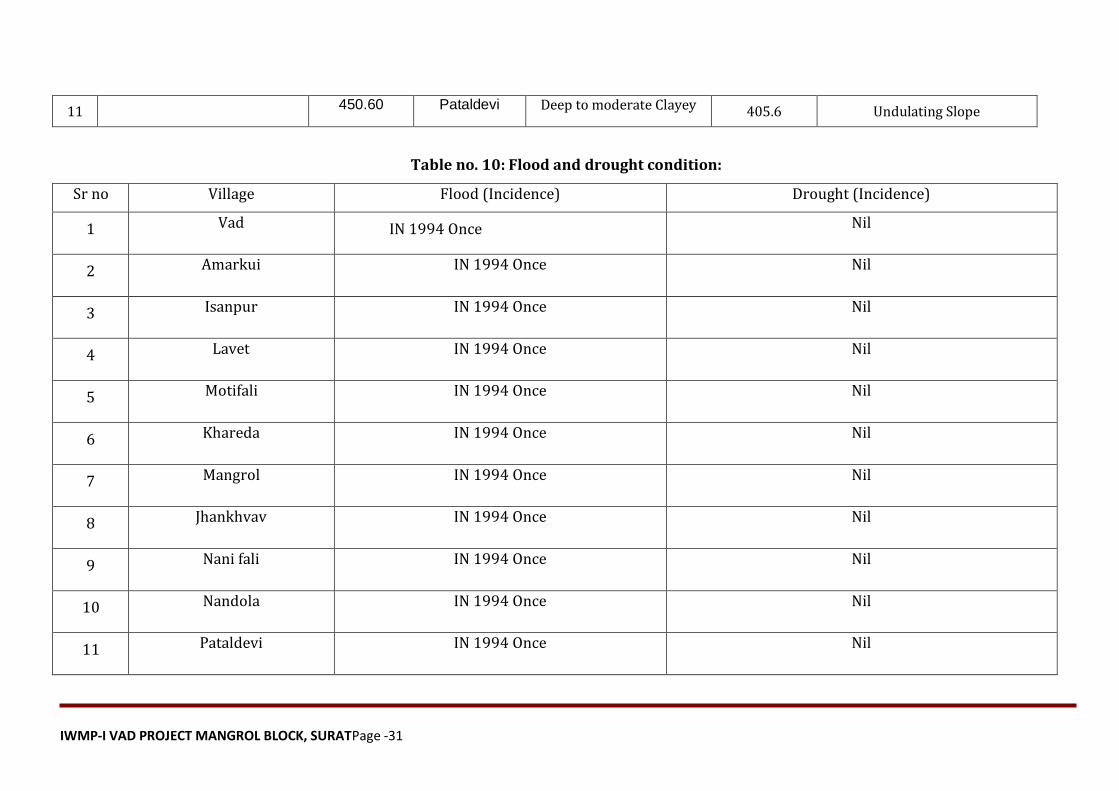
Table no. 10: Flood and drought condition:
Sr no Village Flood (Incidence) Drought (Incidence)
1 Vad IN 1994 Once Nil
2 Amarkui IN 1994 Once Nil
3 Isanpur IN 1994 Once Nil
4 Lavet IN 1994 Once Nil
5 Motifali IN 1994 Once Nil
6 Khareda IN 1994 Once Nil
7 Mangrol IN 1994 Once Nil
8 Jhankhvav IN 1994 Once Nil
9 Nani fali IN 1994 Once Nil
10 Nandola IN 1994 Once Nil
11 Pataldevi IN 1994 Once Nil
IWMP-I VAD PROJECT MANGROL BLOCK, SURATPage -32
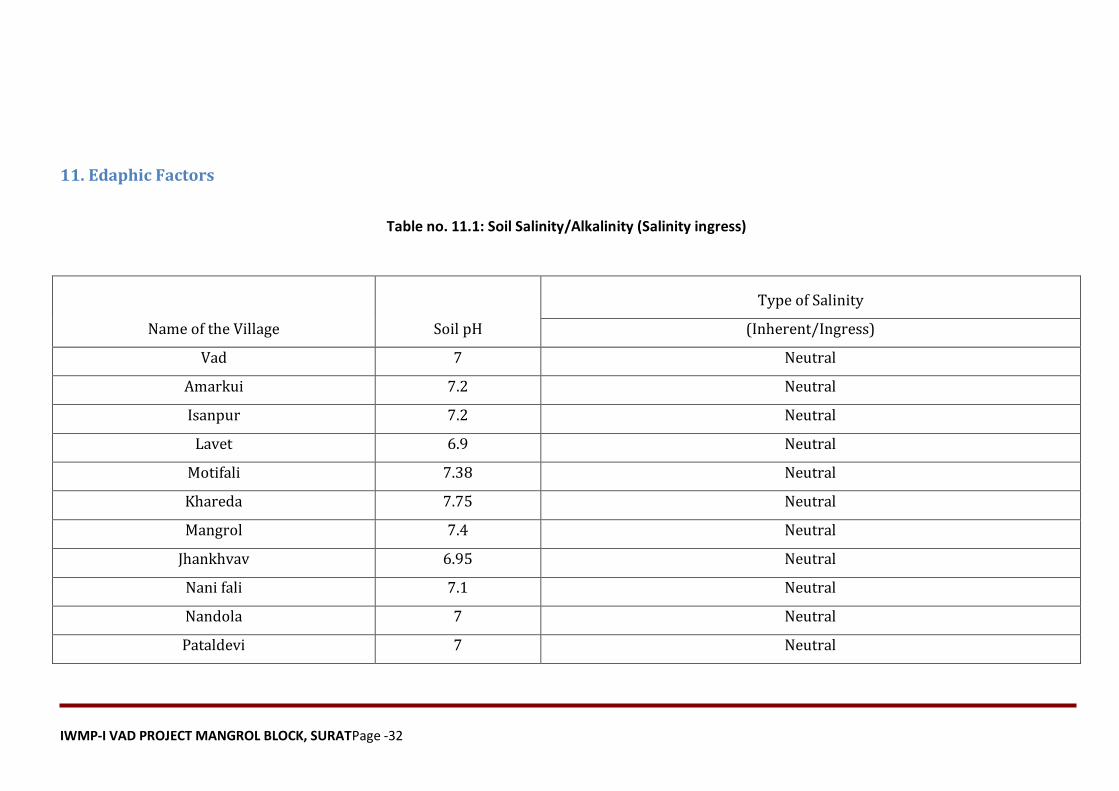
11. Edaphic Factors
Table no. 11.1: Soil Salinity/Alkalinity (Salinity ingress)
Name of the Village Soil pH
Type of Salinity
(Inherent/Ingress)
Vad 7 Neutral
Amarkui 7.2 Neutral
Isanpur 7.2 Neutral
Lavet 6.9 Neutral
Motifali 7.38 Neutral
Khareda 7.75 Neutral
Mangrol 7.4 Neutral
Jhankhvav 6.95 Neutral
Nani fali 7.1 Neutral
Nandola 7 Neutral
Pataldevi 7 Neutral
IWMP-I VAD PROJECT MANGROL BLOCK, SURATPage -33
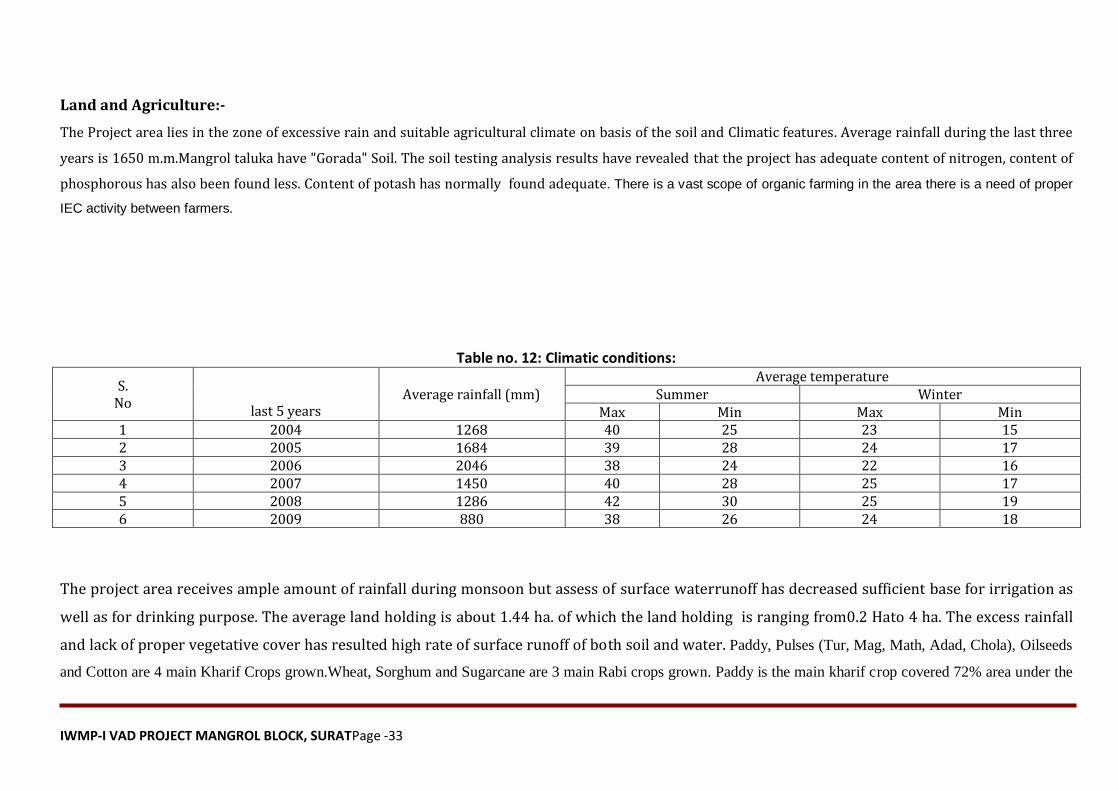
Land and Agriculture:-
The Project area lies in the zone of excessive rain and suitable agricultural climate on basis of the soil and Climatic features. Average rainfall during the last three
years is 1650 m.m.Mangrol taluka have "Gorada" Soil. The soil testing analysis results have revealed that the project has adequate content of nitrogen, content of
phosphorous has also been found less. Content of potash has normally found adequate. There is a vast scope of organic farming in the area there is a need of proper
IEC activity between farmers.
Table no. 12: Climatic conditions:
S. No
last 5 years Average rainfall (mm)
Average temperature Summer Winter
Max Min Max Min 1 2004 1268 40 25 23 15 2 2005 1684 39 28 24 17 3 2006 2046 38 24 22 16 4 2007 1450 40 28 25 17 5 2008 1286 42 30 25 19 6 2009 880 38 26 24 18
The project area receives ample amount of rainfall during monsoon but assess of surface waterrunoff has decreased sufficient base for irrigation as
well as for drinking purpose. The average land holding is about 1.44 ha. of which the land holding is ranging from0.2 Hato 4 ha. The excess rainfall
and lack of proper vegetative cover has resulted high rate of surface runoff of both soil and water. Paddy, Pulses (Tur, Mag, Math, Adad, Chola), Oilseeds
and Cotton are 4 main Kharif Crops grown.Wheat, Sorghum and Sugarcane are 3 main Rabi crops grown. Paddy is the main kharif crop covered 72% area under the
IWMP-I VAD PROJECT MANGROL BLOCK, SURATPage -34
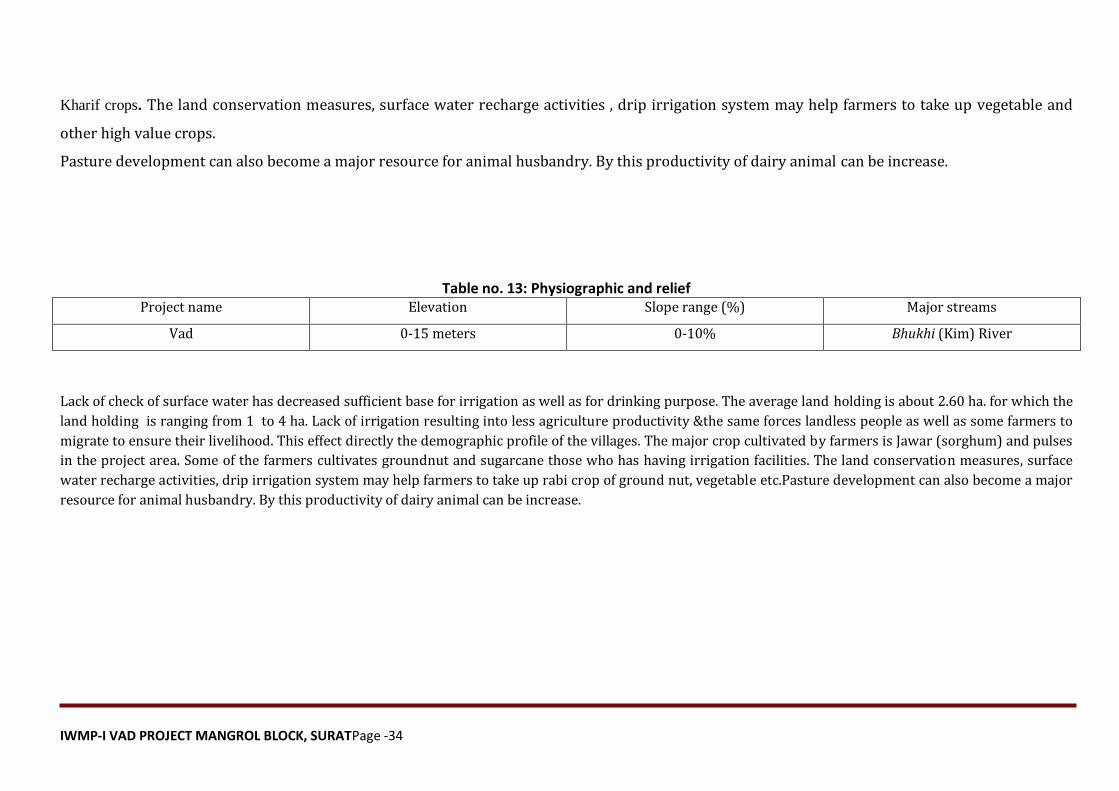
Kharif crops. The land conservation measures, surface water recharge activities , drip irrigation system may help farmers to take up vegetable and
other high value crops.
Pasture development can also become a major resource for animal husbandry. By this productivity of dairy animal can be increase.
Table no. 13: Physiographic and relief Project name Elevation Slope range (%) Major streams
Vad 0-15 meters 0-10% Bhukhi (Kim) River
Lack of check of surface water has decreased sufficient base for irrigation as well as for drinking purpose. The average land holding is about 2.60 ha. for which the
land holding is ranging from 1 to 4 ha. Lack of irrigation resulting into less agriculture productivity &the same forces landless people as well as some farmers to
migrate to ensure their livelihood. This effect directly the demographic profile of the villages. The major crop cultivated by farmers is Jawar (sorghum) and pulses
in the project area. Some of the farmers cultivates groundnut and sugarcane those who has having irrigation facilities. The land conservation measures, surface
water recharge activities, drip irrigation system may help farmers to take up rabi crop of ground nut, vegetable etc.Pasture development can also become a major
resource for animal husbandry. By this productivity of dairy animal can be increase.
IWMP-I VAD PROJECT MANGROL BLOCK, SURATPage -35
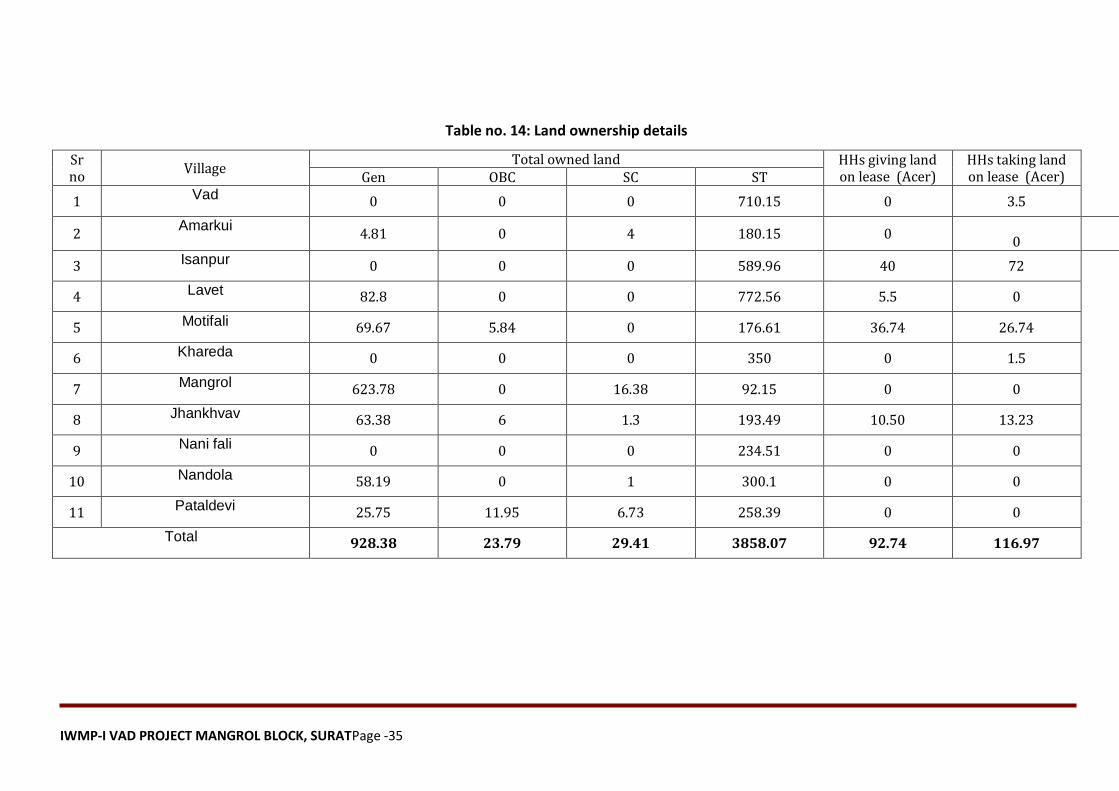
Table no. 14: Land ownership details
Sr no
Village Total owned land HHs giving land
on lease (Acer) HHs taking land on lease (Acer) Gen OBC SC ST
1 Vad 0 0 0 710.15 0 3.5
2 Amarkui
4.81 0 4 180.15 0 0
3 Isanpur 0 0 0 589.96 40 72
4 Lavet 82.8 0 0 772.56 5.5 0
5 Motifali 69.67 5.84 0 176.61 36.74 26.74
6 Khareda 0 0 0 350 0 1.5
7 Mangrol 623.78 0 16.38 92.15 0 0
8 Jhankhvav 63.38 6 1.3 193.49 10.50 13.23
9 Nani fali 0 0 0 234.51 0 0
10 Nandola 58.19 0 1 300.1 0 0
11 Pataldevi 25.75 11.95 6.73 258.39 0 0
Total 928.38 23.79 29.41 3858.07 92.74 116.97
IWMP-I VAD PROJECT MANGROL BLOCK, SURATPage -36
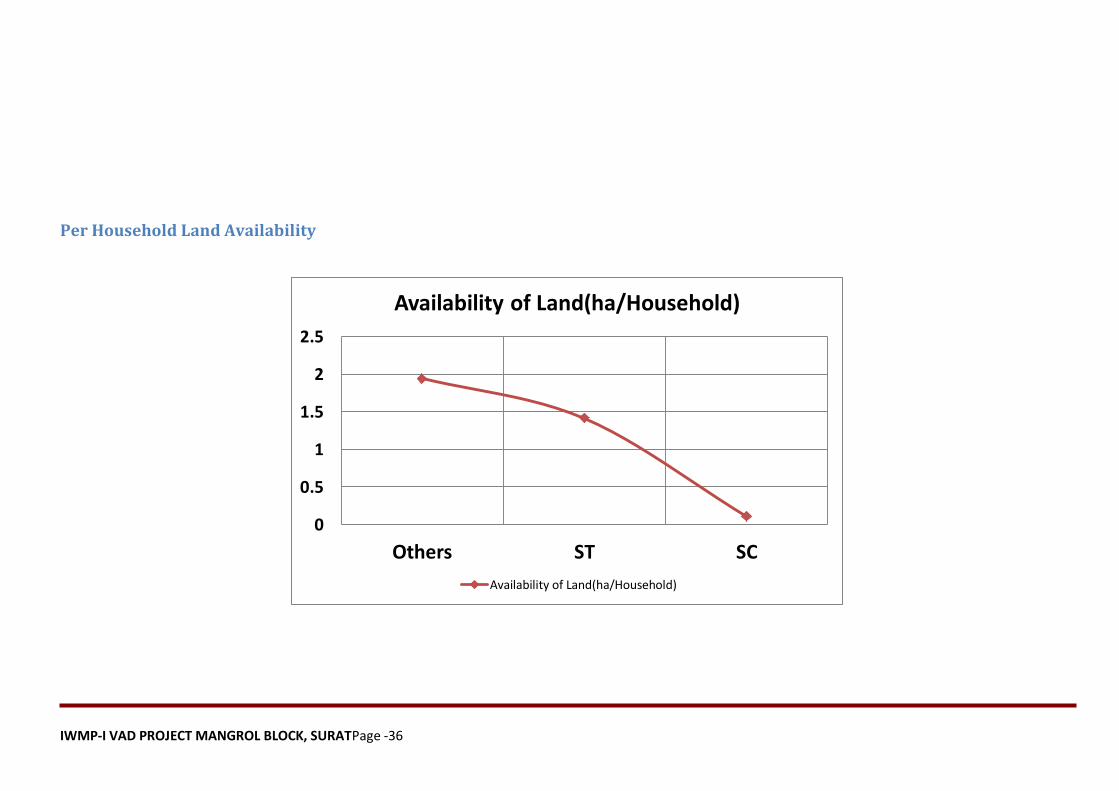
Per Household Land Availability
0
0.5
1
1.5
2
2.5
Others ST SC
Availability of Land(ha/Household)
Availability of Land(ha/Household)

IWMP-I VAD PROJECT MANGROL BLOCK, SURATPage -37
Table no. 15: Detail Agriculture
Sr no Village Net sown area
One time Two times Three times
1 Vad 710.15 268.25 0
2 Amarkui 189.4 69.14 0
3 Isanpur 589.96 324.1 0
4 Lavet 855.36 419.2 0
5 Motifali 252.12 128.0 0
6 Khareda 350.0 169.5 0
7 Mangrol 732.31 339.6 0
8 Jhankhvav 264.17 116.2 0
9 Nani fali 234.51 108.5 0
10 Nandola 359.29 189.4 0
11 Pataldevi 302.82 147.9 0
Total 4840.09 2279.79 0
Irrigation
The irrigated area is 292.21 ha, which is 4% of the total agricultural area of the village. Main source of irrigation is from previously constructed pond, check
dams ponds or wells/tubes. A few farmers of Vad and Isanpur get irrigation to their field by check dams and from earthen dams which were previously
constructed by different departments. Some farmers of Lavet, Mangrol and Nandola get water for irrigation from the main dugout pond cum earthen dam.
IWMP-I VAD PROJECT MANGROL BLOCK, SURATPage -38
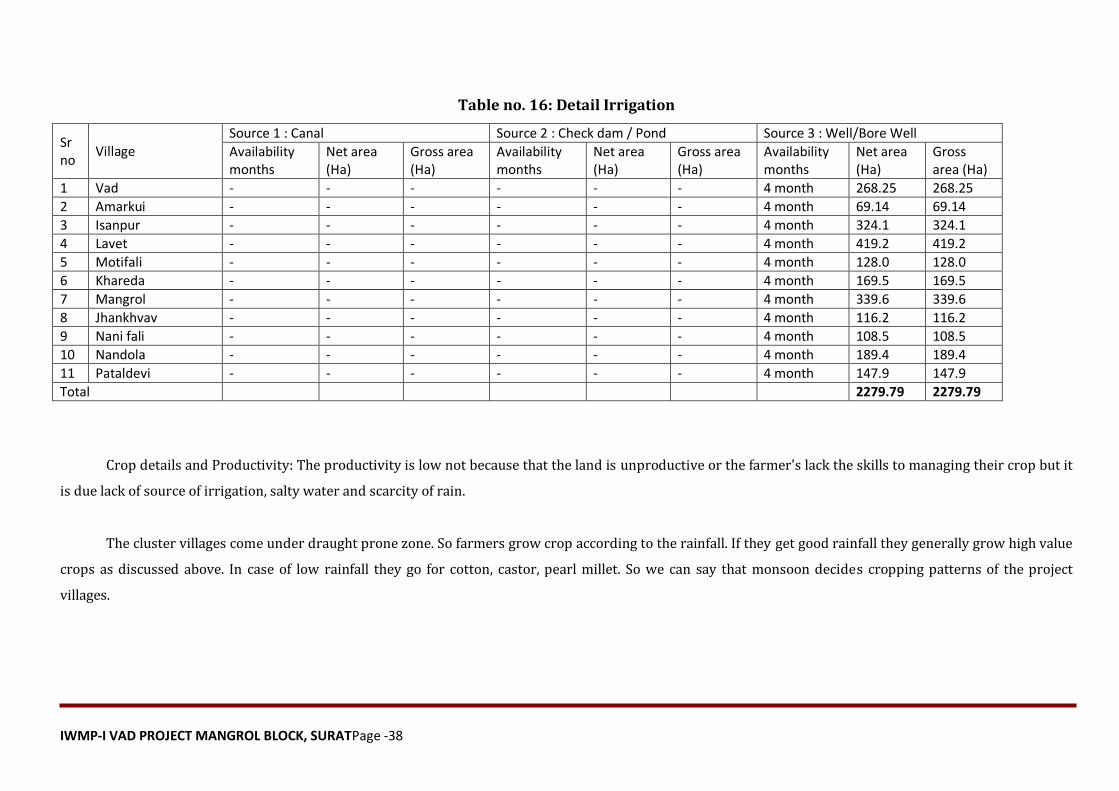
Table no. 16: Detail Irrigation
Sr no
Village Source 1 : Canal Source 2 : Check dam / Pond Source 3 : Well/Bore Well
Availability months
Net area (Ha)
Gross area (Ha)
Availability months
Net area (Ha)
Gross area (Ha)
Availability months
Net area (Ha)
Gross area (Ha)
1 Vad - - - - - - 4 month 268.25 268.25
2 Amarkui - - - - - - 4 month 69.14 69.14
3 Isanpur - - - - - - 4 month 324.1 324.1
4 Lavet - - - - - - 4 month 419.2 419.2
5 Motifali - - - - - - 4 month 128.0 128.0
6 Khareda - - - - - - 4 month 169.5 169.5
7 Mangrol - - - - - - 4 month 339.6 339.6
8 Jhankhvav - - - - - - 4 month 116.2 116.2
9 Nani fali - - - - - - 4 month 108.5 108.5
10 Nandola - - - - - - 4 month 189.4 189.4
11 Pataldevi - - - - - - 4 month 147.9 147.9
Total 2279.79 2279.79
Crop details and Productivity: The productivity is low not because that the land is unproductive or the farmer's lack the skills to managing their crop but it
is due lack of source of irrigation, salty water and scarcity of rain.
The cluster villages come under draught prone zone. So farmers grow crop according to the rainfall. If they get good rainfall they generally grow high value
crops as discussed above. In case of low rainfall they go for cotton, castor, pearl millet. So we can say that monsoon decides cropping patterns of the project
villages.
IWMP-I VAD PROJECT MANGROL BLOCK, SURATPage -39
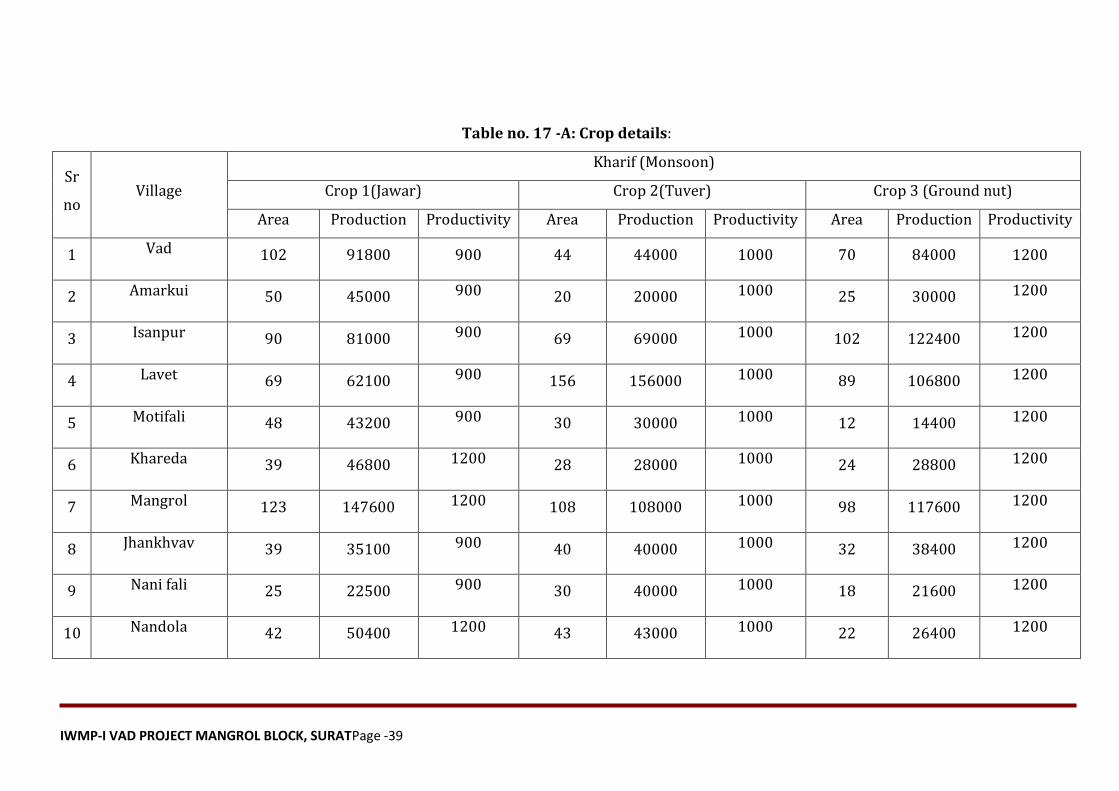
Table no. 17 -A: Crop details:
Sr
no Village
Kharif (Monsoon)
Crop 1(Jawar) Crop 2(Tuver) Crop 3 (Ground nut)
Area Production Productivity Area Production Productivity Area Production Productivity
1 Vad 102 91800 900 44 44000 1000 70 84000 1200
2 Amarkui 50 45000 900 20 20000 1000 25 30000 1200
3 Isanpur 90 81000 900 69 69000 1000 102 122400 1200
4 Lavet 69 62100 900 156 156000 1000 89 106800 1200
5 Motifali 48 43200 900 30 30000 1000 12 14400 1200
6 Khareda 39 46800 1200 28 28000 1000 24 28800 1200
7 Mangrol 123 147600 1200 108 108000 1000 98 117600 1200
8 Jhankhvav 39 35100 900 40 40000 1000 32 38400 1200
9 Nani fali 25 22500 900 30 40000 1000 18 21600 1200
10 Nandola 42 50400 1200 43 43000 1000 22 26400 1200
IWMP-I VAD PROJECT MANGROL BLOCK, SURATPage -40
11 Pataldevi 58 69600 1200 68 68000 1000 48 57600 1200
Total 685 695100 - 636 646000 - 540 648000
Table no. 17 -B: Crop details:
Sr
no Village
Rabi (Winter)
Crop 1 (Jawar) Crop 2 (Tuver) Crop 3 (Ground nut)
Area Production Productivity Area Production Productivity Area Production Productivity
1 Vad 46 55200 1200 - - - 10 12000 1200
2 Amarkui 34 30600 1200 - - - 25 30000 1200
3 Isanpur 12 14400 1200 - - - 25 30000 1200
4 Lavet 29 34800 1200 - - - 46 55200 1200
5 Motifali 5 6000 1200 - - - 10 12000 1200
6 Khareda 15 18000 1200 - - - 28 33600 1200
7 Mangrol 56 67200 1200 - - - 45 54000 1200
IWMP-I VAD PROJECT MANGROL BLOCK, SURATPage -41
8 Jhankhvav 6 7200 1200 - - - 4 4800 1200
9 Nani fali 8 9600 1200 - - - 13 15800 1200
10 Nandola 16 19200 1200 - - - 15 18000 1200
11 Pataldevi 29 34800 1200 - - - 38 45600 1200
256 297000 1200 - - - 259 310800 1200
17 .0 Reasons of Low productivity of various crops
Over a period of time by continuous usage of fertilizers, pesticides and insecticides, there is deterioration in the quality of soil particularly reduction of
carbon content and increase of salinity. One of the reasons ascribed to low response of bio-fertilizers in dry lands is their low status of soil organic
matter. Rejuvenation of soil characteristics is an important area to tackle, with specific emphasis on recovery of its nutrit ional value. More thrust need
to be given on adopting methods such as multi-cropping, rotation of crops and organic farming. Organic farming, nutrient management continues to be
a focal issue in dry lands as the fertilizer use is not likely to pick up significantly unless water supply is assured. Soil fertility in dry lands can be sustained
only through maintenance of organic matter and achieving better fertilizer-use efficiency through integration of moisture-conservation practices along
with soil-fertility management.
Quality of Seeds: Good quality seed, fertilizer and pesticide are important factor in agriculture productivity. The use of good quality leads to higher land
productivity. In project villages, however, there are two limitations in the use of fertilizer. First these fertilizers are most useful in irrigated condition.
The agricultural land of the cluster villages however totally depend on rainfall. In villages mostly farmers use nitrogenous fertilizers especially urea. This
IWMP-I VAD PROJECT MANGROL BLOCK, SURATPage -42
has resulted in disproportionate use of fertilizer depleting the quality of land.
Traditional farming methods:This is the factor that leads low productivity. There is lot of ignorance about the use of new farming methods and
technologies such as multiple cropping.
Erratic rainfall:The Villagers mainly depend on monsoon. Without monsoon they cannot get any crop because irrigation water is salty .Water is essential input in
agriculture. Due to the absence of proper irrigation facility, 100% of the total cultivated area depends on the uncertain
monsoon. Therefore the success or failure of the monsoon determines the success or failure of agriculture production.The rains,as a source of irrigation,
are unreliable due to two factors;
Untimely Rainfall: The rains are sometimes received when the crops are ready for harvesting. The ready crop may be ruineddue to untimely rain.
Lack of Rural Credit:Farmers face so many problems for rural credit and it leads to low agricultural productivity. Farmers need credit mainly for the
purchase of various inputs such as seed, fertilizers, and pesticides and for repair of implements. They use long term credit for buying land, and for
investment to improve the quality of land, buying the new implements and improving irrigation facilities.
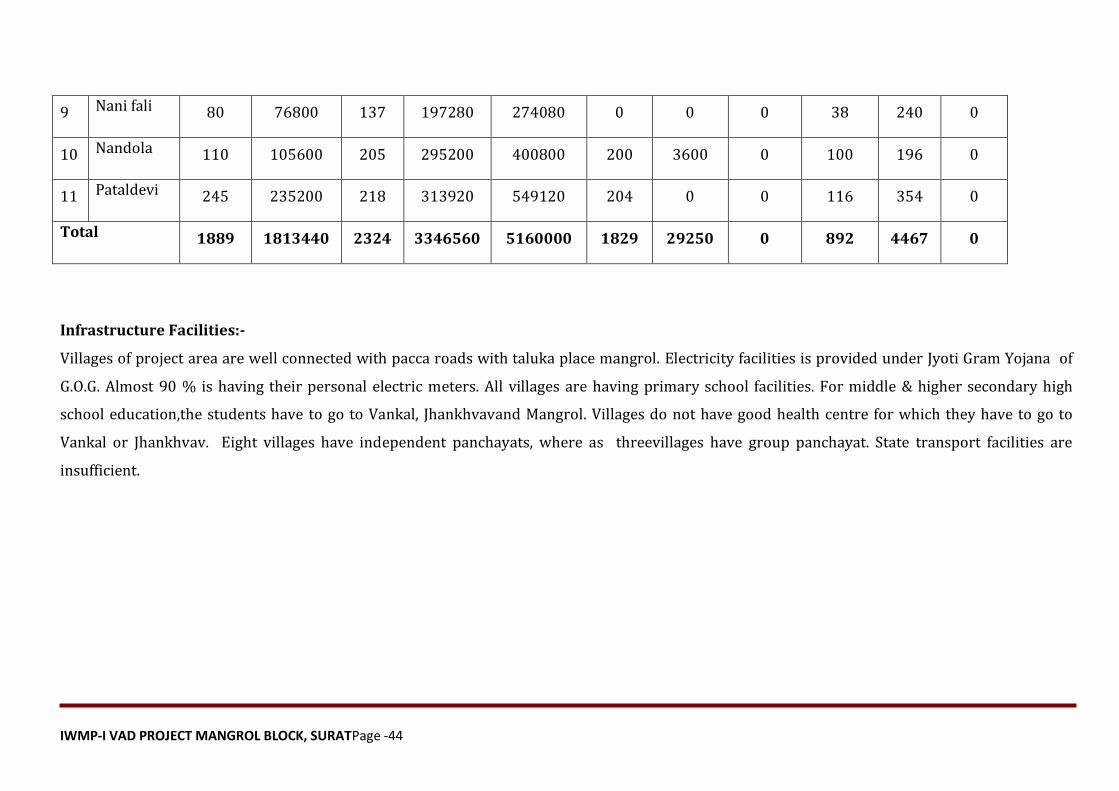
Livestock:
The project area has 2324 cows and 1889 buffaloes while the other domestic animals include 892 bullocks,1829 goats and 4467 hens. This show
there is an ample potential for producing organic manures and promote organic farming in this area. But there is need to make farmer understand the advantages of
using organic manures and practice organic farming. The need for integrating the animal husbandry with promotion of organic farming needs to be given high
priority. The productivity of milk is so less due to lack of availability of good quality of fodder due to less per capita land availability.
IWMP-I VAD PROJECT MANGROL BLOCK, SURATPage -43
Table no. 18:Detail of Livestock
Sr
no Village
Buffalo(ltr/yr) Cow(ltr/yr)
Total Milk
(Buffalo+Co
w)
Goat(ltr/yr) Sheep Bullock Hen Others
No Milk ltr. No Milk ltr.. Milk ltr. No Milk ltr.
1 Vad 247 237120 136 195840 432960 35 630 0 90 500 0
2 Amarkui 30 28800 100 144000 172800 250 4500 0 36 256 0
3 Isanpur 206 197760 147 211680 409440 114 2052 0 174 469 0
4 Lavet 200 192000 410 590400 782400 360 6480 0 120 698 0
5 Motifali 51 48960 179 257760 306720 41 738 0 42 189 0
6 Khareda 122 117120 291 419040 536160 56 1008 0 52 298 0
7 Mangrol 296 284160 95 136800 420960 300 5400 0 17 680 0
8 Jhankhvav 302 289920 406 584640 874560 269 4842 20 107 587 0
IWMP-I VAD PROJECT MANGROL BLOCK, SURATPage -44
9 Nani fali 80 76800 137 197280 274080 0 0 0 38 240 0
10 Nandola 110 105600 205 295200 400800 200 3600 0 100 196 0
11 Pataldevi 245 235200 218 313920 549120 204 0 0 116 354 0
Total 1889 1813440 2324 3346560 5160000 1829 29250 0 892 4467 0
Infrastructure Facilities:-
Villages of project area are well connected with pacca roads with taluka place mangrol. Electricity facilities is provided under Jyoti Gram Yojana of
G.O.G. Almost 90 % is having their personal electric meters. All villages are having primary school facilities. For middle & higher secondary high
school education,the students have to go to Vankal, Jhankhvavand Mangrol. Villages do not have good health centre for which they have to go to
Vankal or Jhankhvav. Eight villages have independent panchayats, where as threevillages have group panchayat. State transport facilities are
insufficient.
IWMP-I VAD PROJECT MANGROL BLOCK, SURATPage -45
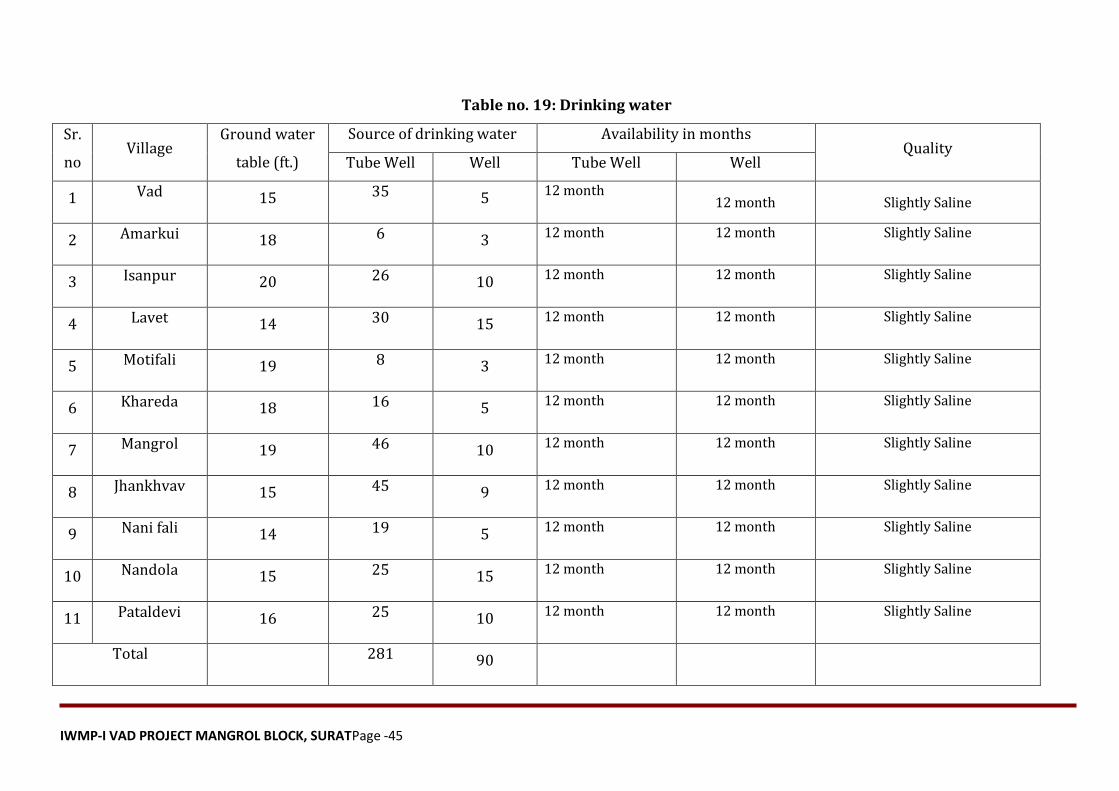
Table no. 19: Drinking water
Sr.
no Village
Ground water
table (ft.)
Source of drinking water Availability in months Quality
Tube Well Well Tube Well Well
1 Vad 15 35 5 12 month 12 month Slightly Saline
2 Amarkui 18 6 3 12 month 12 month Slightly Saline
3 Isanpur 20 26 10 12 month 12 month Slightly Saline
4 Lavet 14 30 15 12 month 12 month Slightly Saline
5 Motifali 19 8 3 12 month 12 month Slightly Saline
6 Khareda 18 16 5 12 month 12 month Slightly Saline
7 Mangrol 19 46 10 12 month 12 month Slightly Saline
8 Jhankhvav 15 45 9 12 month 12 month Slightly Saline
9 Nani fali 14 19 5 12 month 12 month Slightly Saline
10 Nandola 15 25 15 12 month 12 month Slightly Saline
11 Pataldevi 16 25 10 12 month 12 month Slightly Saline
Total 281 90
IWMP-I VAD PROJECT MANGROL BLOCK, SURATPage -46
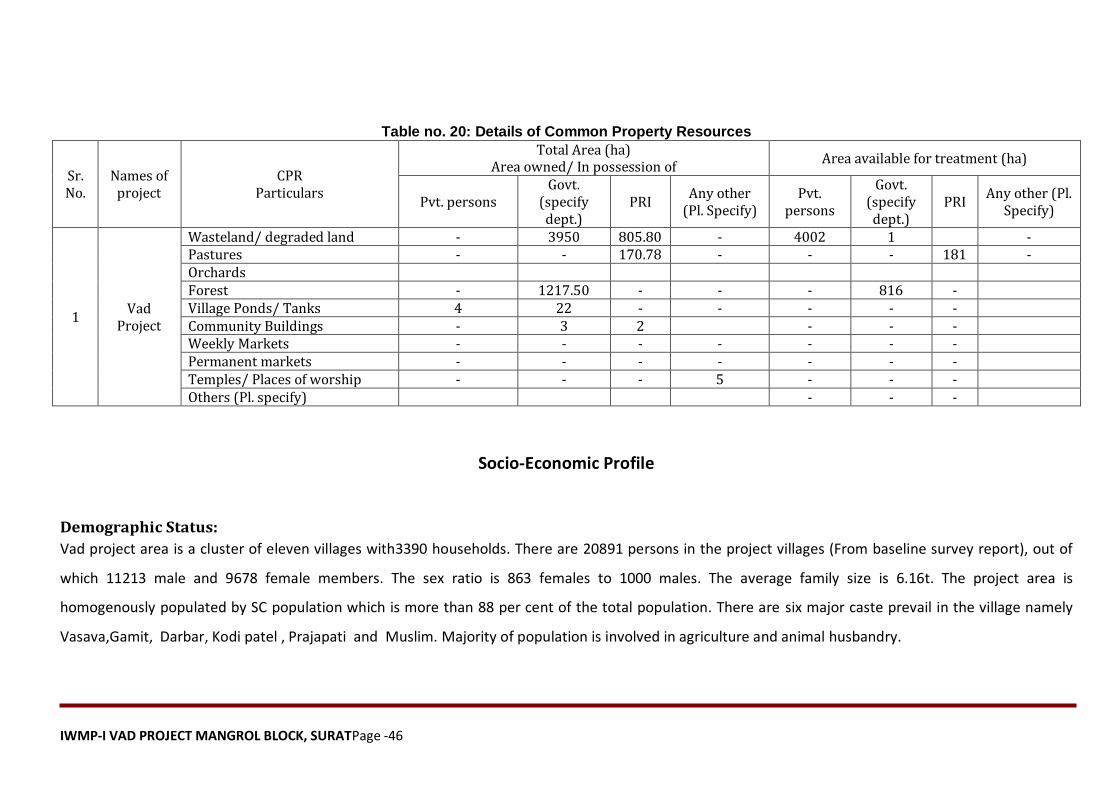
Table no. 20: Details of Common Property Resources
Sr. No.
Names of project
CPR Particulars
Total Area (ha) Area owned/ In possession of
Area available for treatment (ha)
Pvt. persons Govt.
(specify dept.)
PRI Any other
(Pl. Specify) Pvt.
persons
Govt. (specify dept.)
PRI Any other (Pl.
Specify)
1 Vad
Project
Wasteland/ degraded land - 3950 805.80 - 4002 1 - Pastures - - 170.78 - - - 181 - Orchards Forest - 1217.50 - - - 816 - Village Ponds/ Tanks 4 22 - - - - - Community Buildings - 3 2 - - - Weekly Markets - - - - - - - Permanent markets - - - - - - - Temples/ Places of worship - - - 5 - - - Others (Pl. specify) - - -
Socio-Economic Profile
Demographic Status:
Vad project area is a cluster of eleven villages with3390 households. There are 20891 persons in the project villages (From baseline survey report), out of
which 11213 male and 9678 female members. The sex ratio is 863 females to 1000 males. The average family size is 6.16t. The project area is
homogenously populated by SC population which is more than 88 per cent of the total population. There are six major caste prevail in the village namely
Vasava,Gamit, Darbar, Kodi patel , Prajapati and Muslim. Majority of population is involved in agriculture and animal husbandry.
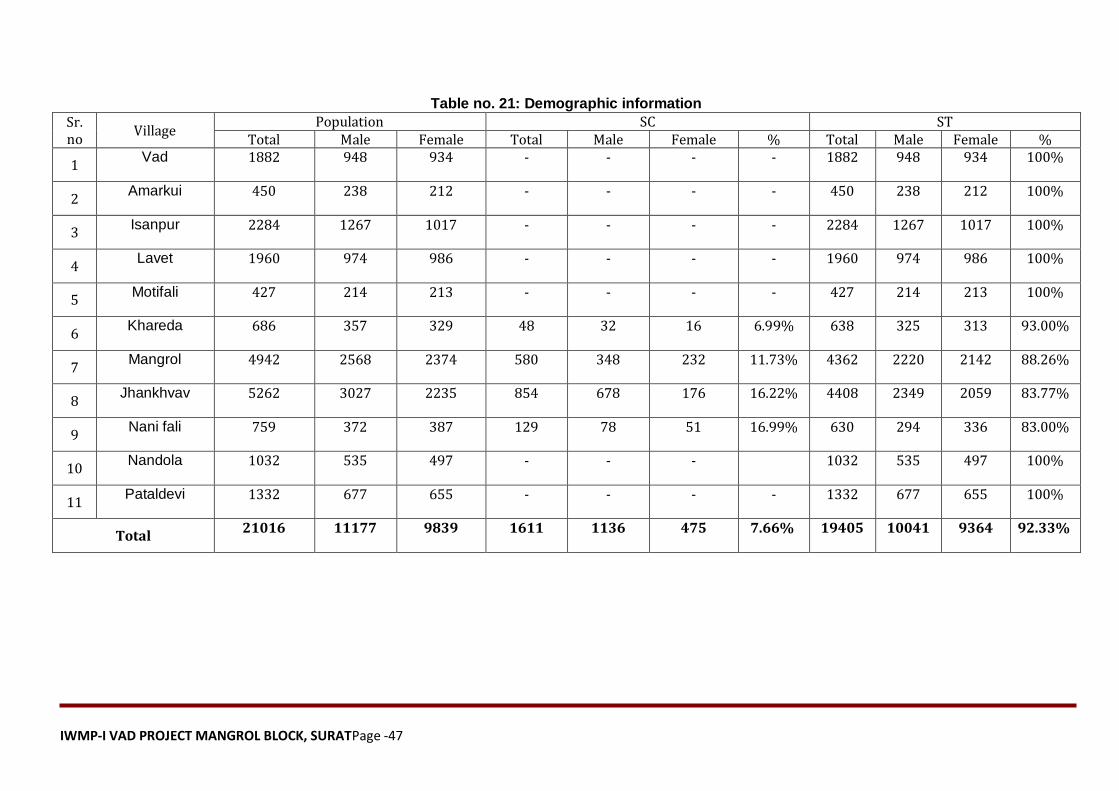
IWMP-I VAD PROJECT MANGROL BLOCK, SURATPage -47
Table no. 21: Demographic information
Sr. no
Village Population SC ST
Total Male Female Total Male Female % Total Male Female %
1 Vad 1882 948 934 - - - - 1882 948 934 100%
2 Amarkui 450 238 212 - - - - 450 238 212 100%
3 Isanpur 2284 1267 1017 - - - - 2284 1267 1017 100%
4 Lavet 1960 974 986 - - - - 1960 974 986 100%
5 Motifali 427 214 213 - - - - 427 214 213 100%
6 Khareda 686 357 329 48 32 16 6.99% 638 325 313 93.00%
7 Mangrol 4942 2568 2374 580 348 232 11.73% 4362 2220 2142 88.26%
8 Jhankhvav 5262 3027 2235 854 678 176 16.22% 4408 2349 2059 83.77%
9 Nani fali 759 372 387 129 78 51 16.99% 630 294 336 83.00%
10 Nandola 1032 535 497 - - - 1032 535 497 100%
11 Pataldevi 1332 677 655 - - - - 1332 677 655 100%
Total 21016 11177 9839 1611 1136 475 7.66% 19405 10041 9364 92.33%
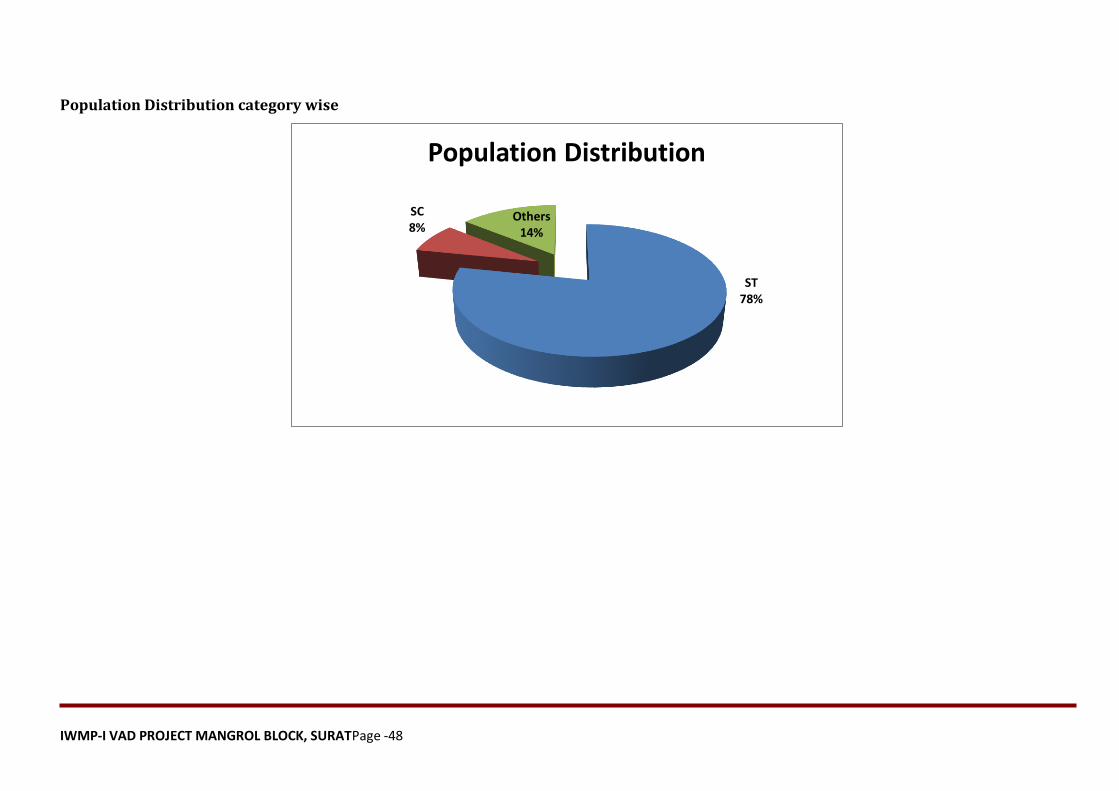
IWMP-I VAD PROJECT MANGROL BLOCK, SURATPage -48
Population Distribution category wise
ST 78%
SC 8%
Others 14%
Population Distribution

IWMP-I VAD PROJECT MANGROL BLOCK, SURATPage -49
Table no. 22: Literacy rate
Sr. no Village Literacy Literacy % above
age 14 Literacy % below
age 14 Total % Male % Female %
1 Vad 1274 67.69 684 72.15 590 63.17 82 14
2 Amarkui 330 73.33 180 75.63 150 70.75 78 16
3 Isanpur 1567 68.61 778 61.4 789 77.58 70 18
4 Lavet 1467 74.85 775 79.57 692 70.18 79 10
5 Motifali 315 73.77 175 81.78 140 65.73 72 11
6 Khareda 354 51.6 155 43.42 199 60.49 65 12
7 Mangrol 3456 69.93 1966 76.56 1490 62.76 79 13
8 Jhankhvav 3987 75.77 2580 85.23 1407 62.95 85 12
9 Nani fali 567 74.7 310 83.33 257 66.41 69 10
10 Nandola 780 75.58 480 89.72 300 60.36 80 13
11 Pataldevi 982 73.72 564 83.31 418 63.82 78 10
Total 15079 71.75 8647 77.36 6432 65.37 76 13
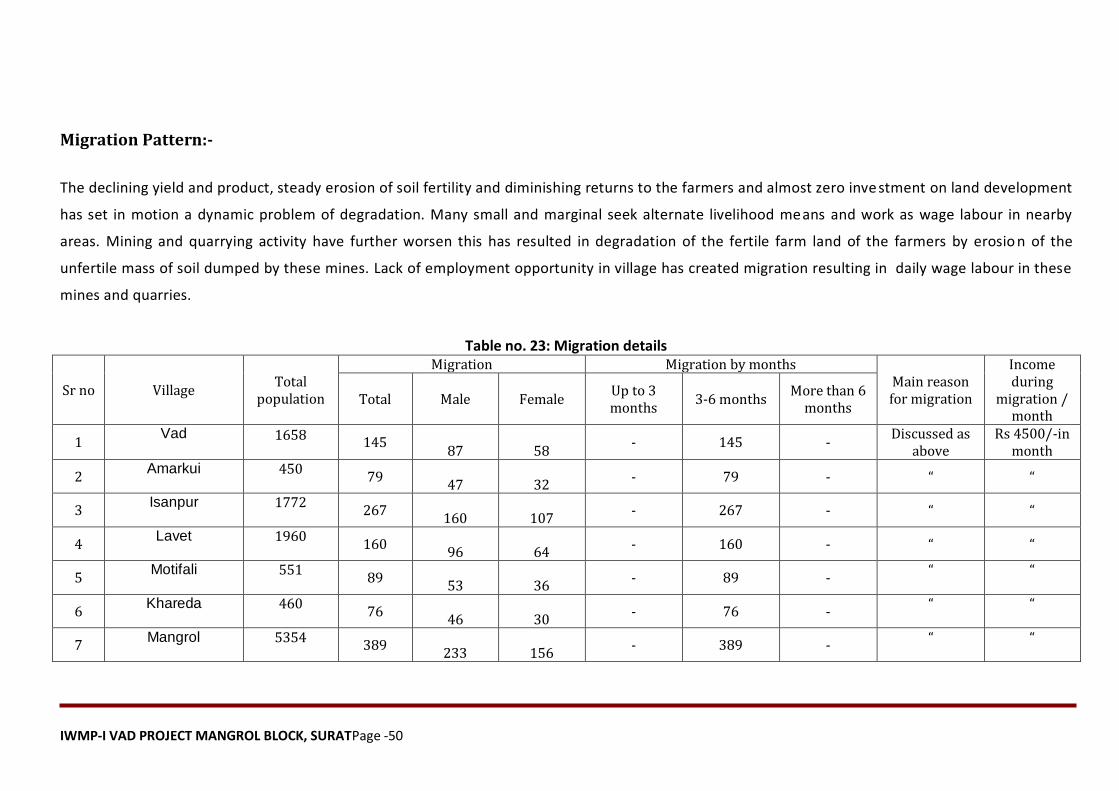
IWMP-I VAD PROJECT MANGROL BLOCK, SURATPage -50
Migration Pattern:-
The declining yield and product, steady erosion of soil fertility and diminishing returns to the farmers and almost zero inve stment on land development
has set in motion a dynamic problem of degradation. Many small and marginal seek alternate livelihood means and work as wage labour in nearby
areas. Mining and quarrying activity have further worsen this has resulted in degradation of the fertile farm land of the farmers by erosio n of the
unfertile mass of soil dumped by these mines. Lack of employment opportunity in village has created migration resulting in daily wage labour in these
mines and quarries.
Table no. 23: Migration details
Sr no Village Total
population
Migration Migration by months Main reason for migration
Income during
migration / month
Total Male Female Up to 3 months
3-6 months More than 6
months
1 Vad 1658 145
87 58 - 145 -
Discussed as above
Rs 4500/-in month
2 Amarkui 450
79 47 32
- 79 - “ “
3 Isanpur 1772
267 160 107
- 267 - “ “
4 Lavet 1960
160 96 64
- 160 - “ “
5 Motifali 551
89 53 36
- 89 - “ “
6 Khareda 460
76 46 30
- 76 - “ “
7 Mangrol 5354
389 233 156
- 389 - “ “
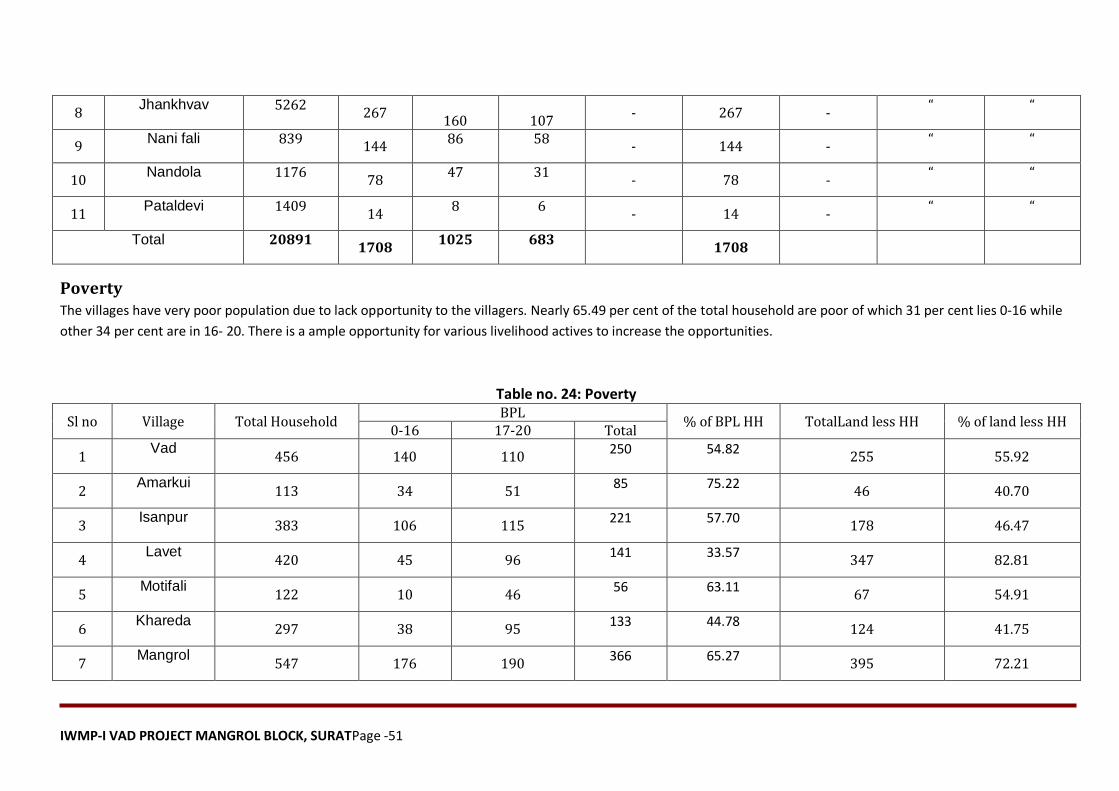
IWMP-I VAD PROJECT MANGROL BLOCK, SURATPage -51
8 Jhankhvav 5262
267 160 107
- 267 - “ “
9 Nani fali 839
144 86 58
- 144 - “ “
10 Nandola 1176
78 47 31
- 78 - “ “
11 Pataldevi 1409
14 8 6
- 14 - “ “
Total 20891 1708
1025 683 1708
Poverty The villages have very poor population due to lack opportunity to the villagers. Nearly 65.49 per cent of the total household are poor of which 31 per cent lies 0-16 while
other 34 per cent are in 16- 20. There is a ample opportunity for various livelihood actives to increase the opportunities.
Table no. 24: Poverty
Sl no Village Total Household BPL
% of BPL HH TotalLand less HH % of land less HH 0-16 17-20 Total
1 Vad
456 140 110 250 54.82
255 55.92
2 Amarkui
113 34 51 85 75.22
46 40.70
3 Isanpur
383 106 115 221 57.70
178 46.47
4 Lavet
420 45 96 141 33.57
347 82.81
5 Motifali
122 10 46 56 63.11
67 54.91
6 Khareda
297 38 95 133 44.78
124 41.75
7 Mangrol
547 176 190 366 65.27
395 72.21

IWMP-I VAD PROJECT MANGROL BLOCK, SURATPage -52
8 Jhankhvav
566 133 274 407 71.73
236 41.69
9 Nani fali
173 45 42 87 50.29
72 41.61
10 Nandola
206 77 111 188 91.26
105 50.97
11 Pataldevi
307 243 37 280 89.58
195 63.51
Total 3597 1047 1167 2214 61.55% 2020 56.15%
25 Infrastructure facilities
All watershed villages are well connected with others villages within the taluka as well as adjoining talukas like mandvi,Umarpada and Valiyataluka with
pucca roads. Each village has electricity connectivity under Jyotigram Yojana of the State Government. Nearly 90 per cent of households in the villages have
their personal electric meters. The villages have primary school with all facilities like personal computers. For middle and higher secondary education, the
students have to go to Vankal and Jhankhvavvillage which is about 5 kilometres away from Amarkui,Motifali, Nanifali,Lavet and Khareda. Out of Eleven
villaget villages are having separate GPs .with panchayat office.
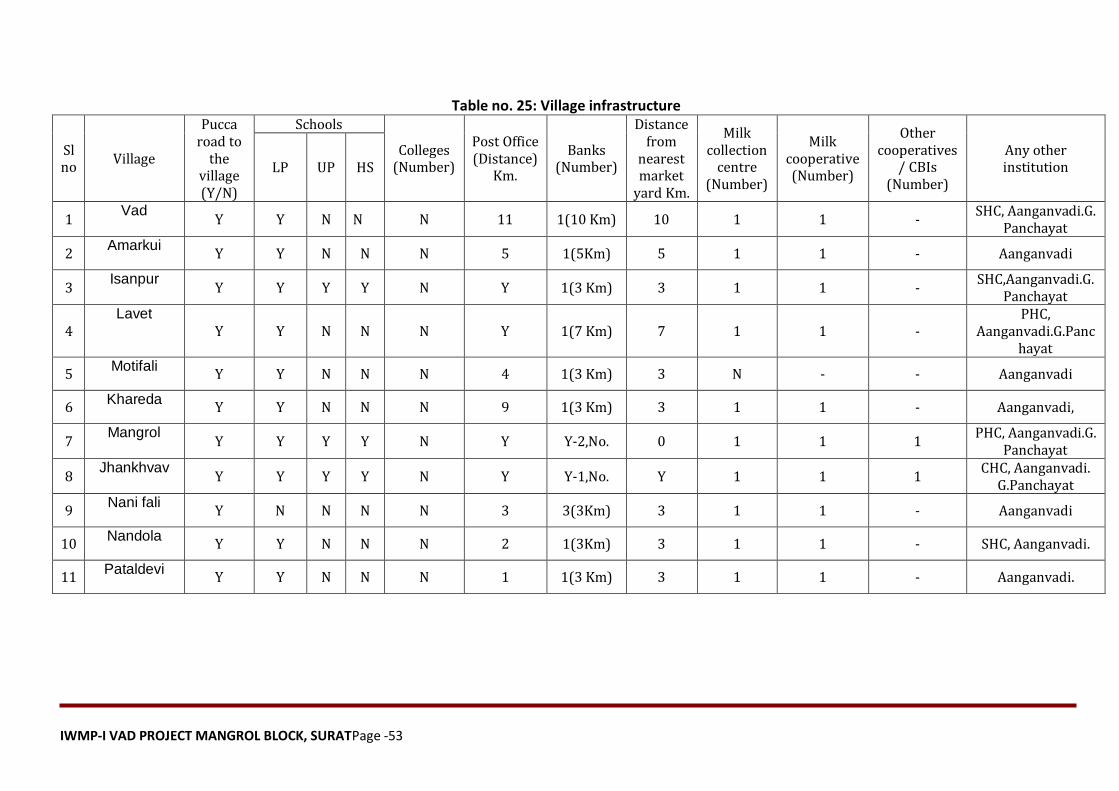
IWMP-I VAD PROJECT MANGROL BLOCK, SURATPage -53
Table no. 25: Village infrastructure
Sl no
Village
Pucca road to
the village (Y/N)
Schools
Colleges (Number)
Post Office (Distance)
Km.
Banks (Number)
Distance from
nearest market
yard Km.
Milk collection
centre (Number)
Milk cooperative (Number)
Other cooperatives
/ CBIs (Number)
Any other institution LP UP HS
1 Vad
Y Y N N N 11 1(10 Km) 10 1 1 - SHC, Aanganvadi.G.
Panchayat
2 Amarkui
Y Y N N N 5 1(5Km) 5 1 1 - Aanganvadi
3 Isanpur
Y Y Y Y N Y 1(3 Km) 3 1 1 - SHC,Aanganvadi.G.
Panchayat
4 Lavet
Y Y N N N Y 1(7 Km) 7 1 1 - PHC,
Aanganvadi.G.Panchayat
5 Motifali
Y Y N N N 4 1(3 Km) 3 N - - Aanganvadi
6 Khareda
Y Y N N N 9 1(3 Km) 3 1 1 - Aanganvadi,
7 Mangrol
Y Y Y Y N Y Y-2,No. 0 1 1 1 PHC, Aanganvadi.G.
Panchayat
8 Jhankhvav
Y Y Y Y N Y Y-1,No. Y 1 1 1 CHC, Aanganvadi.
G.Panchayat
9 Nani fali
Y N N N N 3 3(3Km) 3 1 1 - Aanganvadi
10 Nandola
Y Y N N N 2 1(3Km) 3 1 1 - SHC, Aanganvadi.
11 Pataldevi
Y Y N N N 1 1(3 Km) 3 1 1 - Aanganvadi.
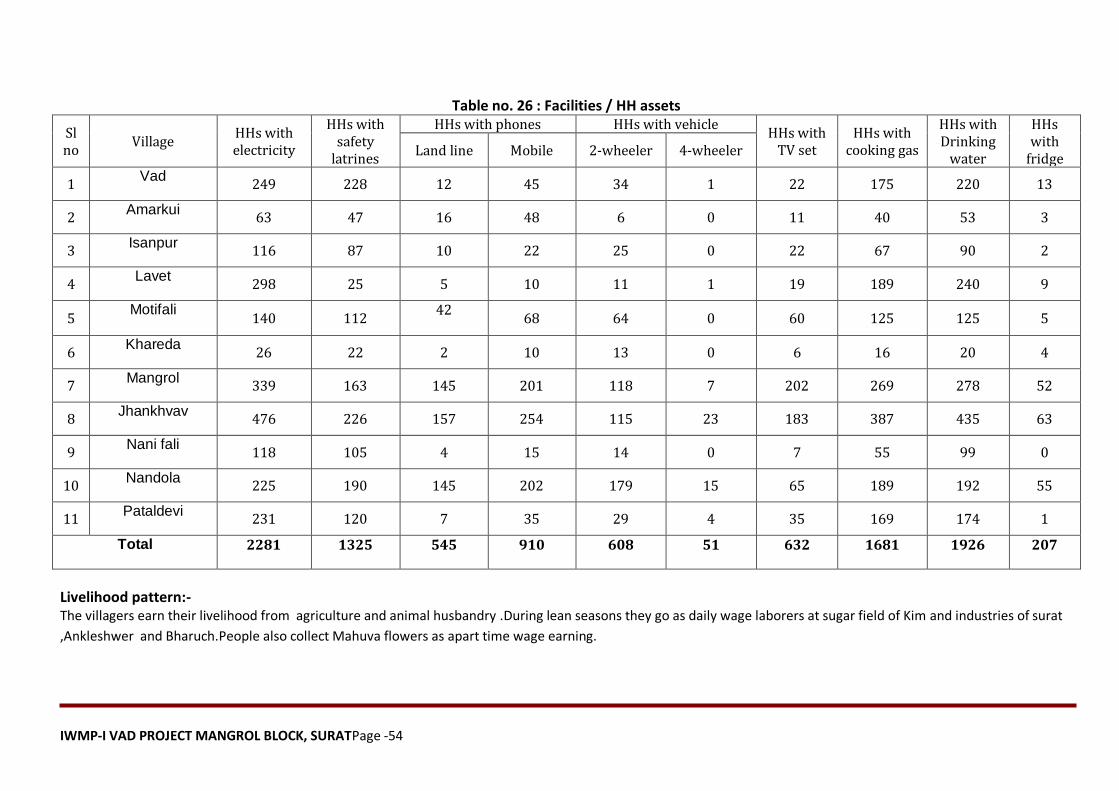
IWMP-I VAD PROJECT MANGROL BLOCK, SURATPage -54
Table no. 26 : Facilities / HH assets
Sl no
Village HHs with electricity
HHs with safety
latrines
HHs with phones HHs with vehicle HHs with
TV set HHs with
cooking gas
HHs with Drinking
water
HHs with
fridge Land line Mobile 2-wheeler 4-wheeler
1 Vad
249 228 12 45 34 1 22 175 220 13
2 Amarkui
63 47 16 48 6 0 11 40 53 3
3 Isanpur
116 87 10 22 25 0 22 67 90 2
4 Lavet
298 25 5 10 11 1 19 189 240 9
5 Motifali
140 112 42
68 64 0 60 125 125 5
6 Khareda
26 22 2 10 13 0 6 16 20 4
7 Mangrol
339 163 145 201 118 7 202 269 278 52
8 Jhankhvav
476 226 157 254 115 23 183 387 435 63
9 Nani fali
118 105 4 15 14 0 7 55 99 0
10 Nandola
225 190 145 202 179 15 65 189 192 55
11 Pataldevi
231 120 7 35 29 4 35 169 174 1
Total 2281 1325 545 910 608 51 632 1681 1926 207
Livelihood pattern:- The villagers earn their livelihood from agriculture and animal husbandry .During lean seasons they go as daily wage laborers at sugar field of Kim and industries of surat
,Ankleshwer and Bharuch.People also collect Mahuva flowers as apart time wage earning.

IWMP-I VAD PROJECT MANGROL BLOCK, SURATPage -55
Table no. 27: Income
Sr no Village Agriculture (in lacs) Animal husbandry (in
lacs) Casual labour (in
lacs) Others (in lacs) Total (in lacs)
1 Vad 23.38 7.65 11.72 0.00 42.75
2 Amarkui 2.18 1.80 3.33 0.00 7.31
3 Isanpur 12.78 6.61 10.03 0.03 29.44
4 Lavet 25.44 10.00 0.56 0.00 36.00
5 Motifali 0.10 0.90 0.80 0.01 1.81
6 Khareda 4.51 2.07 1.44 0.00 8.02
7 Mangrol 37.53 6.41 0.25 0.00 44.19
8 Jhankhvav 13.78 1.95 38.52 0.00 54.25
9 Nani fali 10.54 5.18 0.95 0.00 16.67
10 Nandola 5.68 6.70 0.68 0.00 13.06
11 Pataldevi 15.83 5.41 7.72 0.00 28.96
Total 151.75 54.69 76.00 0.04 282.47
28. Dependence on Common Property Resource
The vast majority of the denizens of this region depend on Common property resources. Most of them continue to live a virtually hand-to-mouth existence. Their pathetic poverty seems, in fact, to have further worsened in recent years, as their traditional pasture lands have been rapidly depleting due to over-grazing and encroachments. Excessive mining and quarrying in the area has also resulted in depetion of the fertile land due to
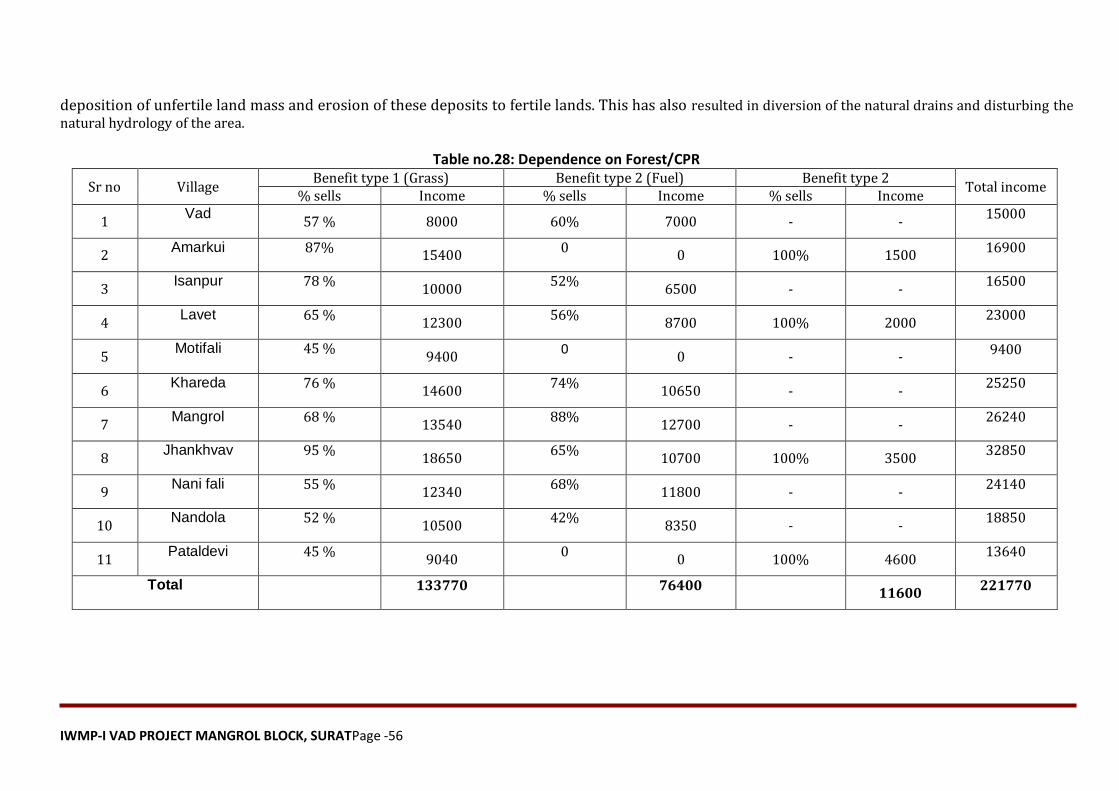
IWMP-I VAD PROJECT MANGROL BLOCK, SURATPage -56
deposition of unfertile land mass and erosion of these deposits to fertile lands. This has also resulted in diversion of the natural drains and disturbing the natural hydrology of the area.
Table no.28: Dependence on Forest/CPR
Sr no Village Benefit type 1 (Grass) Benefit type 2 (Fuel) Benefit type 2
Total income % sells Income % sells Income % sells Income
1 Vad
57 % 8000 60% 7000 - - 15000
2 Amarkui 87%
15400 0
0 100% 1500 16900
3 Isanpur 78 %
10000 52%
6500 - - 16500
4 Lavet 65 %
12300 56%
8700 100% 2000 23000
5 Motifali 45 %
9400 0
0 - - 9400
6 Khareda 76 %
14600 74%
10650 - - 25250
7 Mangrol 68 %
13540 88%
12700 - - 26240
8 Jhankhvav 95 %
18650 65%
10700 100% 3500 32850
9 Nani fali 55 %
12340 68%
11800 - - 24140
10 Nandola 52 %
10500 42%
8350 - - 18850
11 Pataldevi 45 %
9040 0
0 100% 4600 13640
Total
133770 76400 11600
221770
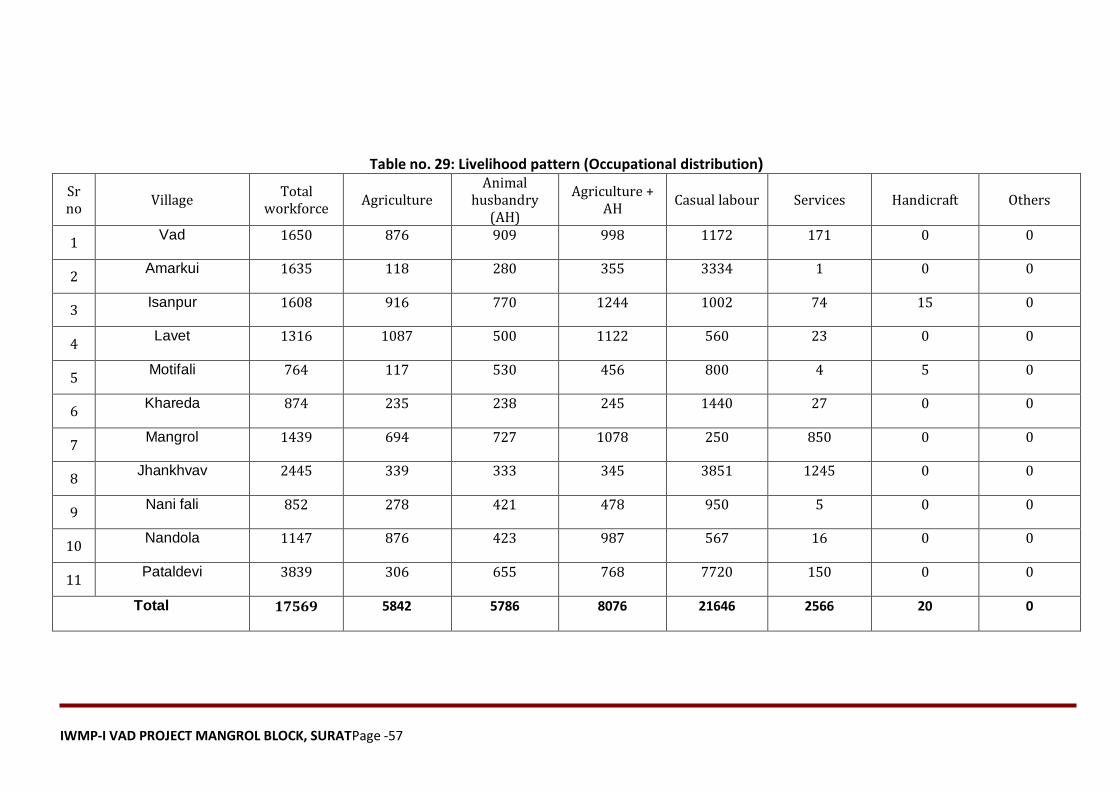
IWMP-I VAD PROJECT MANGROL BLOCK, SURATPage -57
Table no. 29: Livelihood pattern (Occupational distribution)
Sr no
Village Total
workforce Agriculture
Animal husbandry
(AH)
Agriculture + AH
Casual labour Services Handicraft Others
1 Vad 1650 876 909 998 1172 171 0 0
2 Amarkui 1635 118 280 355 3334 1 0 0
3 Isanpur 1608 916 770 1244 1002 74 15 0
4 Lavet 1316 1087 500 1122 560 23 0 0
5 Motifali 764 117 530 456 800 4 5 0
6 Khareda 874 235 238 245 1440 27 0 0
7 Mangrol 1439 694 727 1078 250 850 0 0
8 Jhankhvav 2445 339 333 345 3851 1245 0 0
9 Nani fali 852 278 421 478 950 5 0 0
10 Nandola 1147 876 423 987 567 16 0 0
11 Pataldevi 3839 306 655 768 7720 150 0 0
Total 17569 5842 5786 8076 21646 2566 20 0
IWMP-I VAD PROJECT MANGROL BLOCK, SURATPage -58
CHAPTER-4 Watershed Activities
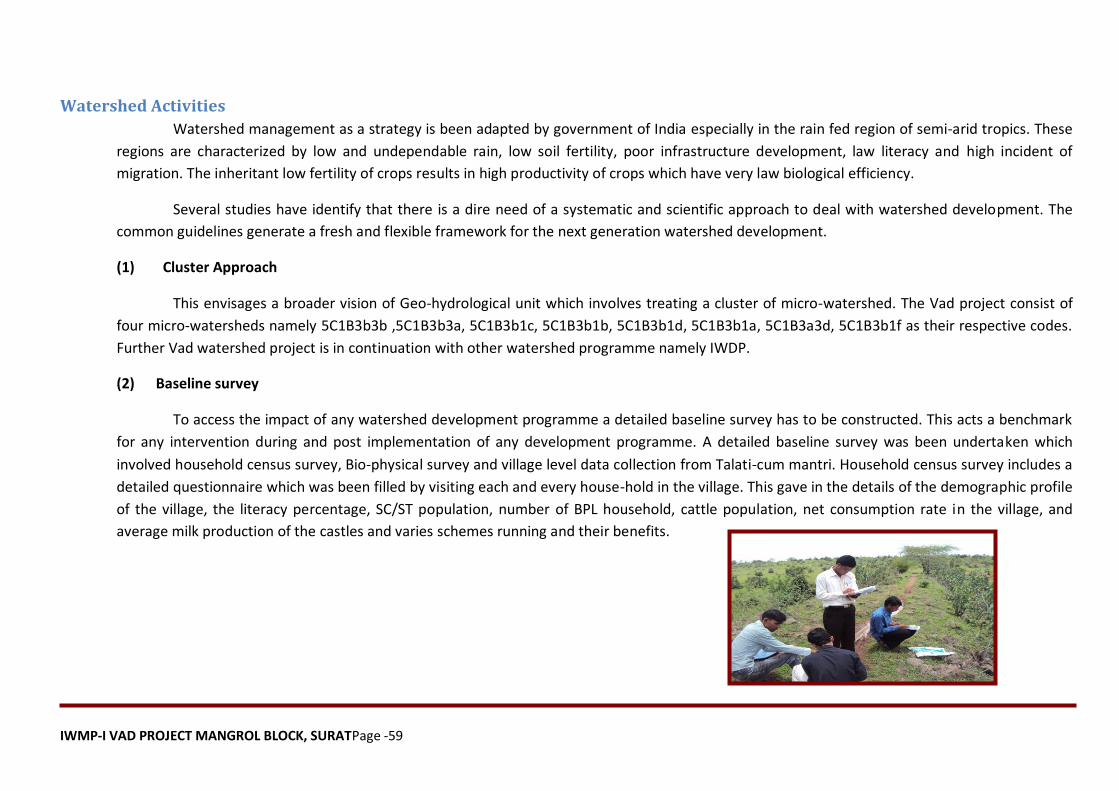
IWMP-I VAD PROJECT MANGROL BLOCK, SURATPage -59
Watershed Activities
Watershed management as a strategy is been adapted by government of India especially in the rain fed region of semi-arid tropics. These
regions are characterized by low and undependable rain, low soil fertility, poor infrastructure development, law literacy and high incident of
migration. The inheritant low fertility of crops results in high productivity of crops which have very law biological efficiency.
Several studies have identify that there is a dire need of a systematic and scientific approach to deal with watershed development. The
common guidelines generate a fresh and flexible framework for the next generation watershed development.
(1) Cluster Approach
This envisages a broader vision of Geo-hydrological unit which involves treating a cluster of micro-watershed. The Vad project consist of
four micro-watersheds namely 5C1B3b3b ,5C1B3b3a, 5C1B3b1c, 5C1B3b1b, 5C1B3b1d, 5C1B3b1a, 5C1B3a3d, 5C1B3b1f as their respective codes.
Further Vad watershed project is in continuation with other watershed programme namely IWDP.
(2) Baseline survey
To access the impact of any watershed development programme a detailed baseline survey has to be constructed. This acts a benchmark
for any intervention during and post implementation of any development programme. A detailed baseline survey was been undertaken which
involved household census survey, Bio-physical survey and village level data collection from Talati-cum mantri. Household census survey includes a
detailed questionnaire which was been filled by visiting each and every house-hold in the village. This gave in the details of the demographic profile
of the village, the literacy percentage, SC/ST population, number of BPL household, cattle population, net consumption rate in the village, and
average milk production of the castles and varies schemes running and their benefits.

IWMP-I VAD PROJECT MANGROL BLOCK, SURATPage -60
Bio-physical survey was been undertake to identify various natural resources available in the village. It included the soil typology, well in
the area, crop taken in the field, cropping pattern, fertilizer used and various sources of irrigation in the field.`
a) Door to Door Survey
The primary data was generated through questionnaire surveys in all the villages. The questionnaire was structured so as to derive the information related
to the objectives set forth. Mostly talked to
• Head of the families
• Mostly females (between 65% and 70%)
• Mostly younger adults (Age group : 25 – 44)
• High School education
• Sarpanch and Talati of respective Gram Panchayats.
• Farmers, Agricultural labours, Diamond polishing workers, handicraft unit workers, electric drum making units and workers of thresher units.
• Cattle Breeders
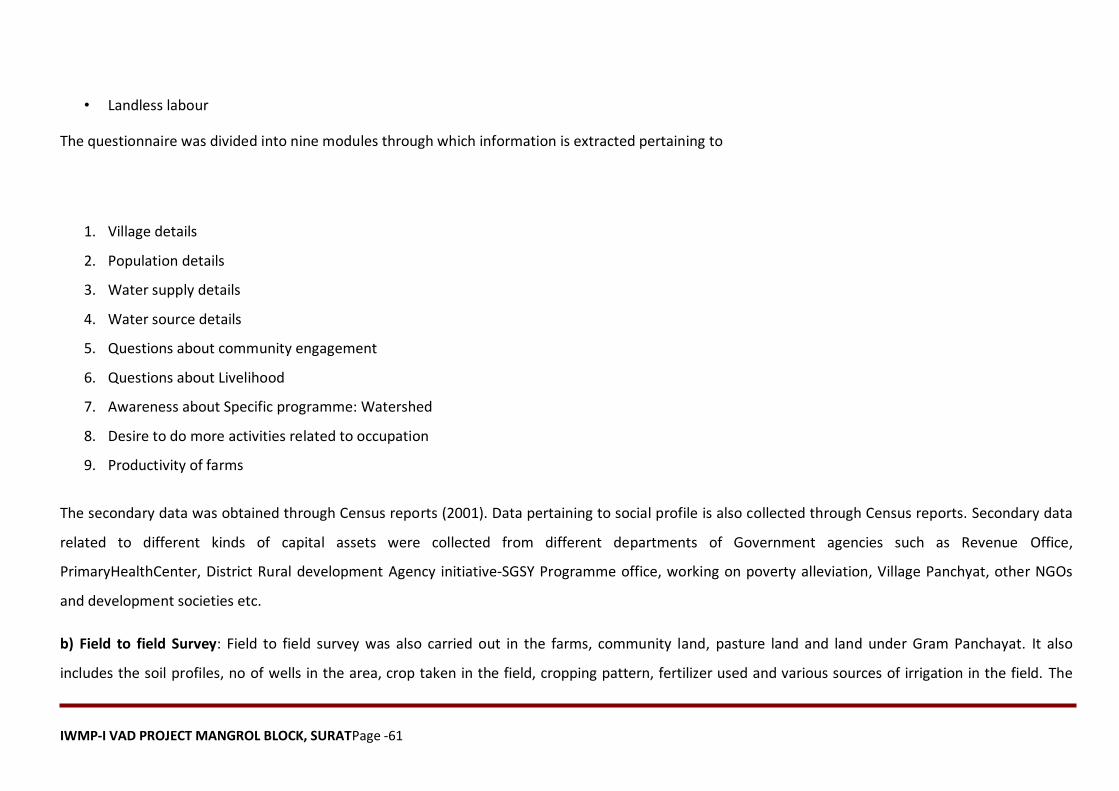
IWMP-I VAD PROJECT MANGROL BLOCK, SURATPage -61
• Landless labour
The questionnaire was divided into nine modules through which information is extracted pertaining to
1. Village details
2. Population details
3. Water supply details
4. Water source details
5. Questions about community engagement
6. Questions about Livelihood
7. Awareness about Specific programme: Watershed
8. Desire to do more activities related to occupation
9. Productivity of farms
The secondary data was obtained through Census reports (2001). Data pertaining to social profile is also collected through Census reports. Secondary data
related to different kinds of capital assets were collected from different departments of Government agencies such as Revenue Office,
PrimaryHealthCenter, District Rural development Agency initiative-SGSY Programme office, working on poverty alleviation, Village Panchyat, other NGOs
and development societies etc.
b) Field to field Survey: Field to field survey was also carried out in the farms, community land, pasture land and land under Gram Panchayat. It also
includes the soil profiles, no of wells in the area, crop taken in the field, cropping pattern, fertilizer used and various sources of irrigation in the field. The
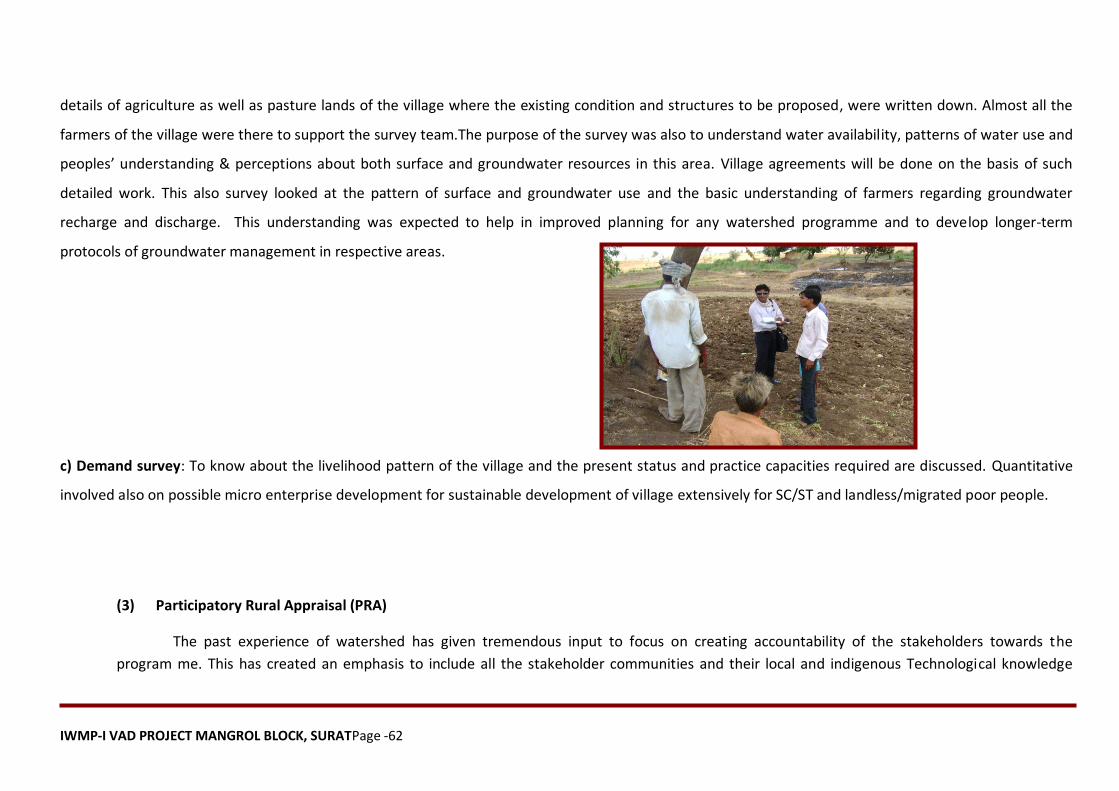
IWMP-I VAD PROJECT MANGROL BLOCK, SURATPage -62
details of agriculture as well as pasture lands of the village where the existing condition and structures to be proposed, were written down. Almost all the
farmers of the village were there to support the survey team.The purpose of the survey was also to understand water availability, patterns of water use and
peoples’ understanding & perceptions about both surface and groundwater resources in this area. Village agreements will be done on the basis of such
detailed work. This also survey looked at the pattern of surface and groundwater use and the basic understanding of farmers regarding groundwater
recharge and discharge. This understanding was expected to help in improved planning for any watershed programme and to develop longer-term
protocols of groundwater management in respective areas.
c) Demand survey: To know about the livelihood pattern of the village and the present status and practice capacities required are discussed. Quantitative
involved also on possible micro enterprise development for sustainable development of village extensively for SC/ST and landless/migrated poor people.
(3) Participatory Rural Appraisal (PRA)
The past experience of watershed has given tremendous input to focus on creating accountability of the stakeholders towards the
program me. This has created an emphasis to include all the stakeholder communities and their local and indigenous Technological knowledge
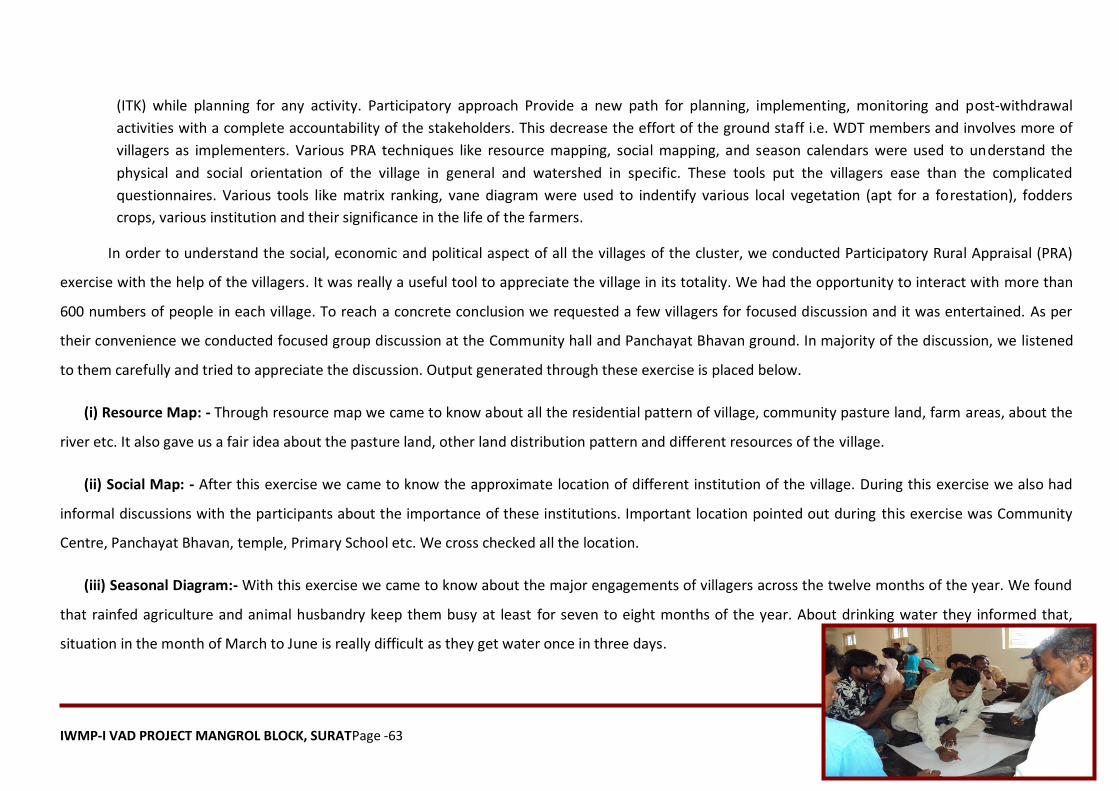
IWMP-I VAD PROJECT MANGROL BLOCK, SURATPage -63
(ITK) while planning for any activity. Participatory approach Provide a new path for planning, implementing, monitoring and post-withdrawal
activities with a complete accountability of the stakeholders. This decrease the effort of the ground staff i.e. WDT members and involves more of
villagers as implementers. Various PRA techniques like resource mapping, social mapping, and season calendars were used to understand the
physical and social orientation of the village in general and watershed in specific. These tools put the villagers ease than the complicated
questionnaires. Various tools like matrix ranking, vane diagram were used to indentify various local vegetation (apt for a forestation), fodders
crops, various institution and their significance in the life of the farmers.
In order to understand the social, economic and political aspect of all the villages of the cluster, we conducted Participatory Rural Appraisal (PRA)
exercise with the help of the villagers. It was really a useful tool to appreciate the village in its totality. We had the opportunity to interact with more than
600 numbers of people in each village. To reach a concrete conclusion we requested a few villagers for focused discussion and it was entertained. As per
their convenience we conducted focused group discussion at the Community hall and Panchayat Bhavan ground. In majority of the discussion, we listened
to them carefully and tried to appreciate the discussion. Output generated through these exercise is placed below.
(i) Resource Map: - Through resource map we came to know about all the residential pattern of village, community pasture land, farm areas, about the
river etc. It also gave us a fair idea about the pasture land, other land distribution pattern and different resources of the village.
(ii) Social Map: - After this exercise we came to know the approximate location of different institution of the village. During this exercise we also had
informal discussions with the participants about the importance of these institutions. Important location pointed out during this exercise was Community
Centre, Panchayat Bhavan, temple, Primary School etc. We cross checked all the location.
(iii) Seasonal Diagram:- With this exercise we came to know about the major engagements of villagers across the twelve months of the year. We found
that rainfed agriculture and animal husbandry keep them busy at least for seven to eight months of the year. About drinking water they informed that,
situation in the month of March to June is really difficult as they get water once in three days.
IWMP-I VAD PROJECT MANGROL BLOCK, SURATPage -64
(iv) Tree matrix:- We came to know about different trees of the villages and their respective utilities as fruit, fuel, fodder, medicine , timber etc. Major
trees pointed out by villagers under this exercise were Pipal, Neem, Bor, Lemon, Banyan and Pipara etc. Taking into consideration all the utilities it was
found that the tree having maximum utility is Chiku and lemon.
(v) Crop Pattern:- Agriculture is the primary source of liveihood for more than 70% household . After this exercise we came to know that there are two
major cropping pattern Kharif and partially in Rabbi. Under Kharif cotton,ground nut and fodder crops andin rabi, major crops grown are wheat, cumin,
gram and vegetables.
(vi) Income-Expenditure Pot: - Under this exercise we came to know about the different sources of income of villagers and how the money earned by
the villagers is being spent under different heads. It was found that major source of earning among villagers are farming, dairy, service etc. Major
expenditure component were food, fuel, fodder, schooling of children, medicines, festivals, relatives, and paan etc.
One focussed group discussion was organised to understand the status of different Self help Group operating in the village. This discussion concentrated
around the activities of SHG, terms and conditions of membership, working pattern of different SHG and their role in the development of society etc
Another curiosity in our mind was about the political institution of the village. Apart from different institution discussion was concentrated about
gram panchayat issue. Here the major discussion point was participation of women and deprived section of the society in the decision making process, their
representation in the panchayat. How the panchayat facilitates the process of development and poverty alleviation. In this process its relation with
different institution of village like dispensary, Aanganwari Kendra, Primary School and High school was also discussed.
The whole purpose was to identify the employment opportunities available during thedifferent seasons in a year, income, expenditure, crisis management,
daily activitiesand time allotted to each activity, the leisure time of men and women, and market network for agricultural produce etc. In the gender
analysis, an attempt was made tofind out the gendered division of labour, the status of women in relation to the right to use, to own and sell different
IWMP-I VAD PROJECT MANGROL BLOCK, SURATPage -65
household properties, the means of production ofthe household, and the role and participation of women in decision-making at intrahouseholdand
community levels.
To identify different problems faced by villagers a separate focussed discussion was carried out. The villagers were grouped in to different types as shown
below to know all the details of the village in a stipulated time.
Small and marginal farmers
Large farmers
Landless farmers
Women
Gram Panchayat members
Cattle grazing population
Business man and women
Problems Identification
After analysis the information collected during PRA exercise, the main problems identified as
Poor fertility of soil and low agricultural productivity
Soil Erosion from farm land
IWMP-I VAD PROJECT MANGROL BLOCK, SURATPage -66
Improper Crop Rotation
Less use of bio-fertilizers
Almost negligible cultivation of arid fruits
Less cultivation of vegetables
Low milk production and rearing of non descript breeds
No use of vermi compost
Lack of value addition practices
Drinking Water
Less availability of fodder
Market (No nearby)
Migration
Sanitation Problems
Less Nutritional Level
Malnutrition in few farm families
(4) Use of GIS and Remote sensing for planning
IWMP-I VAD PROJECT MANGROL BLOCK, SURATPage -67
Use of various high science tools has been promoted at various stages of watershed development.
a) prioritization
Geographical Information System (GIS) has been used for prioritization process. Various layer maps were created like Geo-morphological, Soil, BPL
population, ST/ST population, Ground water status, and Drinking water situation slope percent. These were all given proper weight ages according to the DoLR
specification. This helped in prioritization of various watershed areas.
b) Planning
A action plan matrix was been formulated by State Level Nodal Agency(SLNA) taking into account various features like the slope percent, soil depth,
Soil Texture, Soil erosion in the area for wasteland, forest land and agriculture land.
Global Positioning System (GPS) was used to identify each and every water conservation structures available in the project area. This will be used to
create a map. Contour map of vertical interval of 1 meter at a scale of 1:8000 was used for identifying various location specific for soil and water conservation
structures.
C) Hydrological modelling
Hydrological modelling technique was being used for locating drainage, stream length, flow direction, sink, and Flow accumulation. This model overlaid
over cadastral map hell to calculate the catchment area of each structures like the check dam etc. This has helped to remove the human error which generally
occurring while calculating the catchment area of a check dam.

IWMP-I VAD PROJECT MANGROL BLOCK, SURATPage -68
Table no. 30: Details of Scientific Planning and Inputs in IWMP projects
S. No. Scientific criteria/ inputs used Whether scientific criteria was
used
(A) Planning
Cluster approach Yes
Whether technical back-stopping for the project has been arranged? If yes, mention the name of the
Institute Yes
Baseline survey Yes
Hydro-geological survey Yes
Contour mapping Yes
Participatory Net Planning (PNP) Yes
Remote sensing data-especially soil/ crop/ run-off cover -
Ridge to Valley treatment Yes
Online IT connectivity between
(1) Project and DRDA cell/ZP Yes
(2) DRDA and SLNA Yes
(3) SLNA and DoLR Yes
Availability of GIS layers
1. Cadastral map Yes
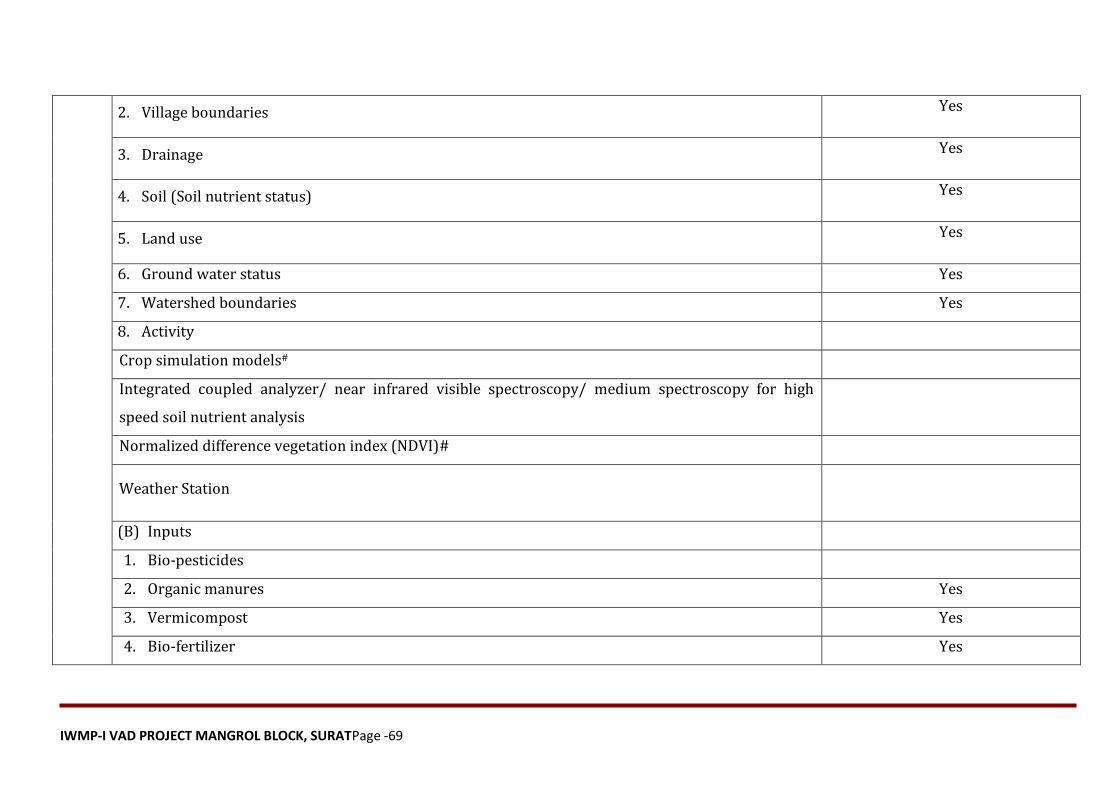
IWMP-I VAD PROJECT MANGROL BLOCK, SURATPage -69
2. Village boundaries Yes
3. Drainage Yes
4. Soil (Soil nutrient status) Yes
5. Land use Yes
6. Ground water status Yes
7. Watershed boundaries Yes
8. Activity
Crop simulation models#
Integrated coupled analyzer/ near infrared visible spectroscopy/ medium spectroscopy for high
speed soil nutrient analysis
Normalized difference vegetation index (NDVI)#
Weather Station
(B) Inputs
1. Bio-pesticides
2. Organic manures Yes
3. Vermicompost Yes
4. Bio-fertilizer Yes
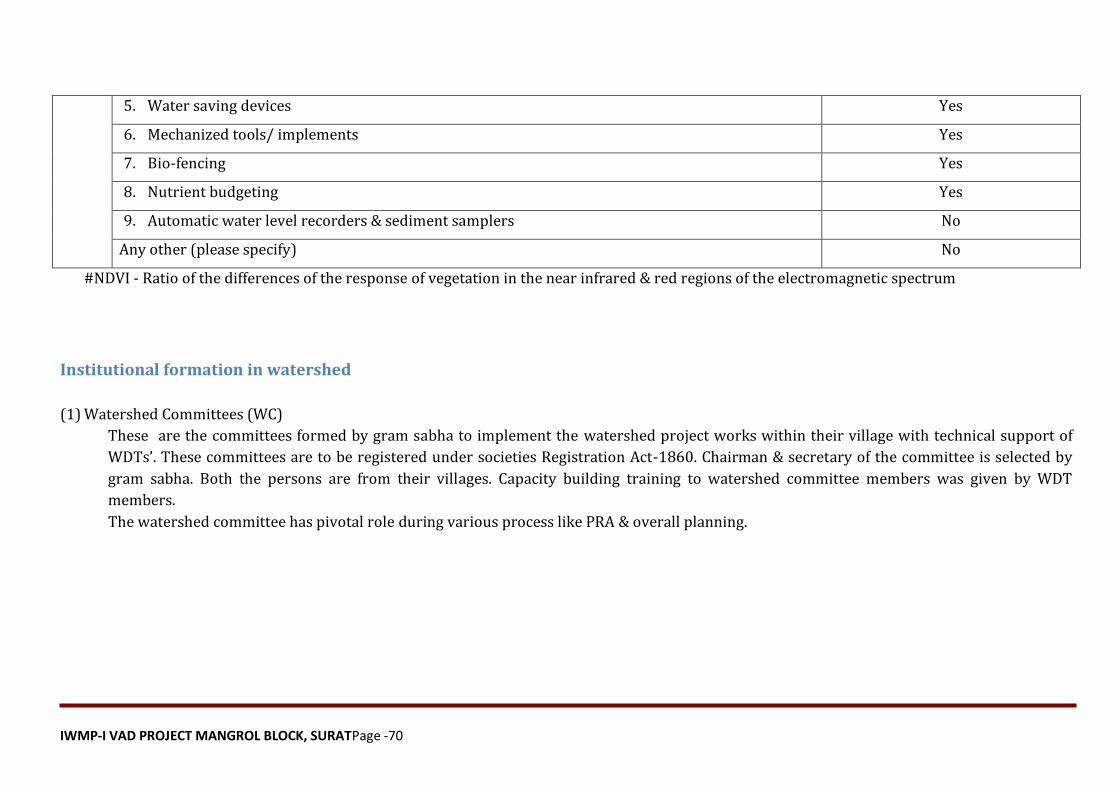
IWMP-I VAD PROJECT MANGROL BLOCK, SURATPage -70
5. Water saving devices Yes
6. Mechanized tools/ implements Yes
7. Bio-fencing Yes
8. Nutrient budgeting Yes
9. Automatic water level recorders & sediment samplers No
Any other (please specify) No
#NDVI - Ratio of the differences of the response of vegetation in the near infrared & red regions of the electromagnetic spectrum
Institutional formation in watershed
(1) Watershed Committees (WC)
These are the committees formed by gram sabha to implement the watershed project works within their village with technical support of
WDTs’. These committees are to be registered under societies Registration Act-1860. Chairman & secretary of the committee is selected by
gram sabha. Both the persons are from their villages. Capacity building training to watershed committee members was given by WDT
members.
The watershed committee has pivotal role during various process like PRA & overall planning.
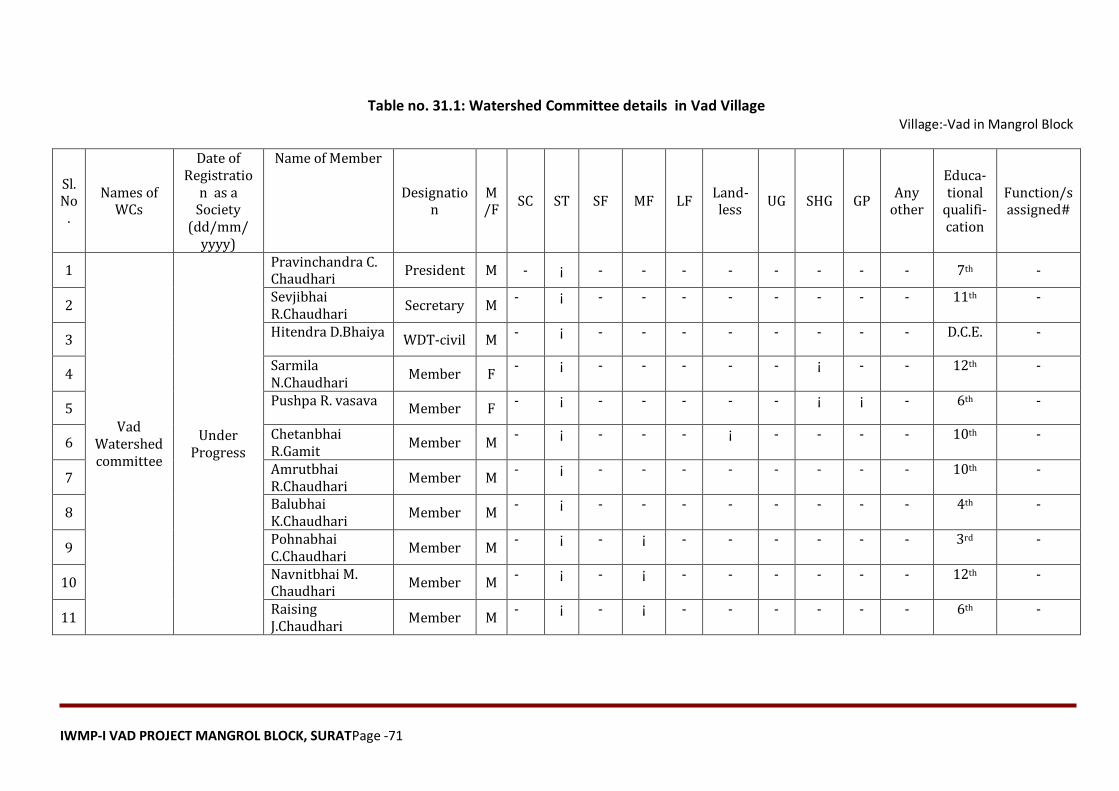
IWMP-I VAD PROJECT MANGROL BLOCK, SURATPage -71
Table no. 31.1: Watershed Committee details in Vad Village Village:-Vad in Mangrol Block
Sl. No
.
Names of WCs
Date of Registratio
n as a Society
(dd/mm/ yyyy)
Name of Member
Designation
M/F
SC ST SF MF LF Land-less
UG SHG GP Any
other
Educa-tional
qualifi-cation
Function/s assigned#
1
Vad Watershed committee
Under Progress
Pravinchandra C. Chaudhari
President M - ¡ - - - - - - - - 7th -
2 Sevjibhai R.Chaudhari
Secretary M - ¡ - - - - - - - - 11th -
3 Hitendra D.Bhaiya
WDT-civil M - ¡ - - - - - - - - D.C.E. -
4 Sarmila N.Chaudhari
Member F - ¡ - - - - - ¡ - - 12th -
5 Pushpa R. vasava
Member F - ¡ - - - - - ¡ ¡ - 6th -
6 Chetanbhai R.Gamit
Member M - ¡ - - - ¡ - - - - 10th -
7 Amrutbhai R.Chaudhari
Member M - ¡ - - - - - - - - 10th -
8 Balubhai K.Chaudhari
Member M - ¡ - - - - - - - - 4th -
9 Pohnabhai C.Chaudhari
Member M - ¡ - ¡ - - - - - - 3rd -
10 Navnitbhai M. Chaudhari
Member M - ¡ - ¡ - - - - - - 12th -
11 Raising J.Chaudhari
Member M - ¡ - ¡ - - - - - - 6th -
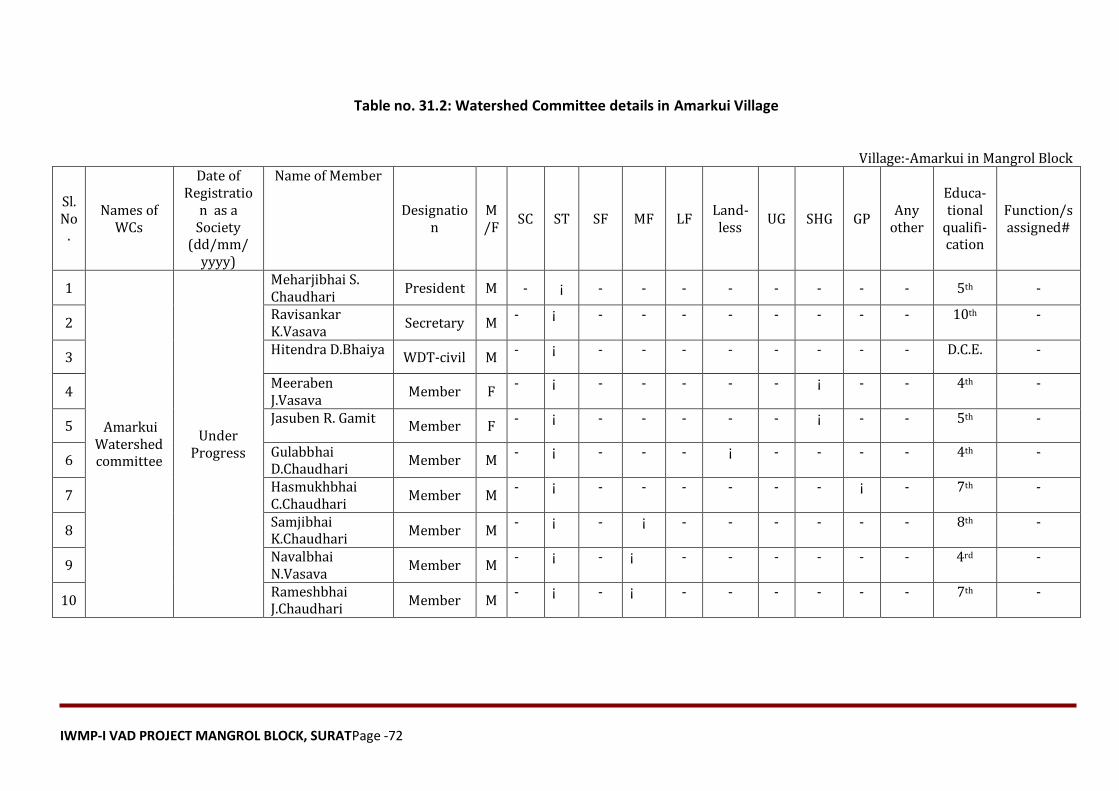
IWMP-I VAD PROJECT MANGROL BLOCK, SURATPage -72
Table no. 31.2: Watershed Committee details in Amarkui Village
Village:-Amarkui in Mangrol Block
Sl. No
.
Names of WCs
Date of Registratio
n as a Society
(dd/mm/ yyyy)
Name of Member
Designation
M/F
SC ST SF MF LF Land-less
UG SHG GP Any
other
Educa-tional
qualifi-cation
Function/s assigned#
1
Amarkui Watershed committee
Under Progress
Meharjibhai S. Chaudhari
President M - ¡ - - - - - - - - 5th -
2 Ravisankar K.Vasava
Secretary M - ¡ - - - - - - - - 10th -
3 Hitendra D.Bhaiya
WDT-civil M - ¡ - - - - - - - - D.C.E. -
4 Meeraben J.Vasava
Member F - ¡ - - - - - ¡ - - 4th -
5 Jasuben R. Gamit
Member F - ¡ - - - - - ¡ - - 5th -
6 Gulabbhai D.Chaudhari
Member M - ¡ - - - ¡ - - - - 4th -
7 Hasmukhbhai C.Chaudhari
Member M - ¡ - - - - - - ¡ - 7th -
8 Samjibhai K.Chaudhari
Member M - ¡ - ¡ - - - - - - 8th -
9 Navalbhai N.Vasava
Member M - ¡ - ¡ - - - - - - 4rd -
10 Rameshbhai J.Chaudhari
Member M - ¡ - ¡ - - - - - - 7th -
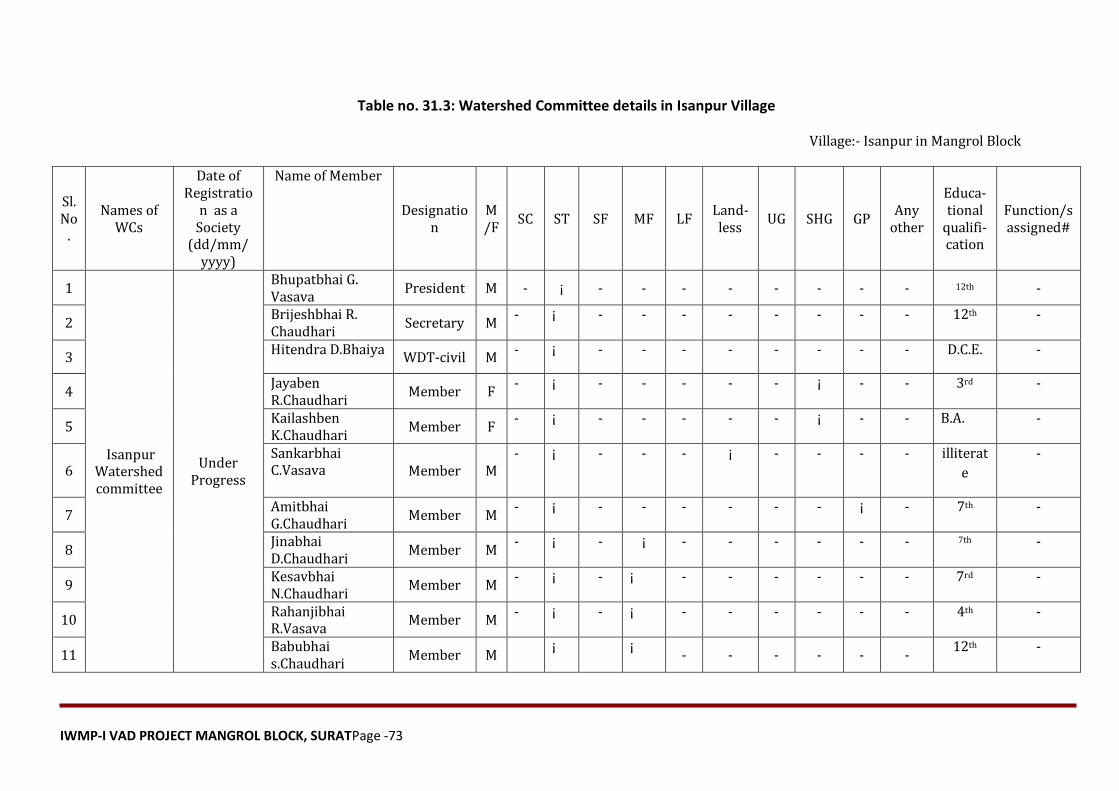
IWMP-I VAD PROJECT MANGROL BLOCK, SURATPage -73
Table no. 31.3: Watershed Committee details in Isanpur Village Village:- Isanpur in Mangrol Block
Sl. No
.
Names of WCs
Date of Registratio
n as a Society
(dd/mm/ yyyy)
Name of Member
Designation
M/F
SC ST SF MF LF Land-less
UG SHG GP Any
other
Educa-tional
qualifi-cation
Function/s assigned#
1
Isanpur Watershed committee
Under Progress
Bhupatbhai G. Vasava
President M - ¡ - - - - - - - - 12th -
2 Brijeshbhai R. Chaudhari
Secretary M - ¡ - - - - - - - - 12th -
3 Hitendra D.Bhaiya
WDT-civil M - ¡ - - - - - - - - D.C.E. -
4 Jayaben R.Chaudhari
Member F - ¡ - - - - - ¡ - - 3rd -
5 Kailashben K.Chaudhari
Member F - ¡ - - - - - ¡ - - B.A. -
6 Sankarbhai C.Vasava Member M
- ¡ - - - ¡ - - - - illiterat
e
-
7 Amitbhai G.Chaudhari
Member M - ¡ - - - - - - ¡ - 7th -
8 Jinabhai D.Chaudhari
Member M - ¡ - ¡ - - - - - - 7th -
9 Kesavbhai N.Chaudhari
Member M - ¡ - ¡ - - - - - - 7rd -
10 Rahanjibhai R.Vasava
Member M - ¡ - ¡ - - - - - - 4th -
11 Babubhai s.Chaudhari
Member M ¡ ¡
- - - - - - 12th -
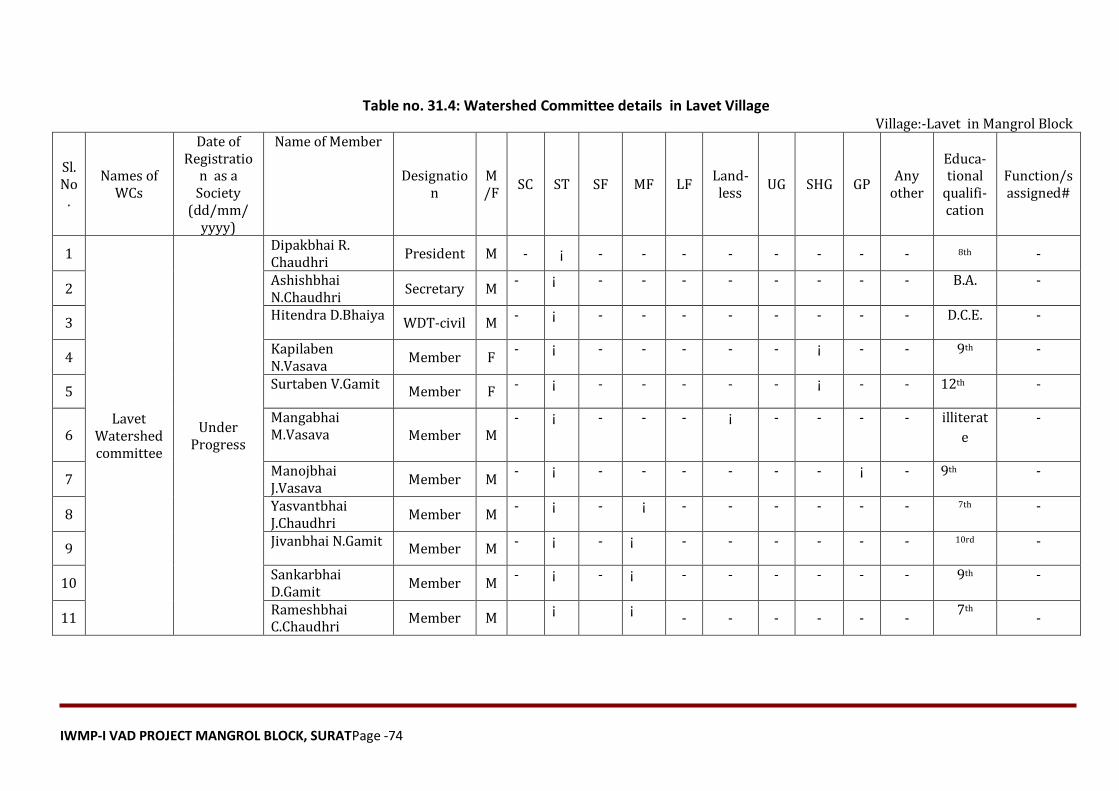
IWMP-I VAD PROJECT MANGROL BLOCK, SURATPage -74
Table no. 31.4: Watershed Committee details in Lavet Village Village:-Lavet in Mangrol Block
Sl. No
.
Names of WCs
Date of Registratio
n as a Society
(dd/mm/ yyyy)
Name of Member
Designation
M/F
SC ST SF MF LF Land-less
UG SHG GP Any
other
Educa-tional
qualifi-cation
Function/s assigned#
1
Lavet Watershed committee
Under Progress
Dipakbhai R. Chaudhri
President M - ¡ - - - - - - - - 8th -
2 Ashishbhai N.Chaudhri
Secretary M - ¡ - - - - - - - - B.A. -
3 Hitendra D.Bhaiya
WDT-civil M - ¡ - - - - - - - - D.C.E. -
4 Kapilaben N.Vasava
Member F - ¡ - - - - - ¡ - - 9th -
5 Surtaben V.Gamit
Member F - ¡ - - - - - ¡ - - 12th -
6 Mangabhai M.Vasava Member M
- ¡ - - - ¡ - - - - illiterat
e
-
7 Manojbhai J.Vasava
Member M - ¡ - - - - - - ¡ - 9th -
8 Yasvantbhai J.Chaudhri
Member M - ¡ - ¡ - - - - - - 7th -
9 Jivanbhai N.Gamit
Member M - ¡ - ¡ - - - - - - 10rd -
10 Sankarbhai D.Gamit
Member M - ¡ - ¡ - - - - - - 9th -
11 Rameshbhai C.Chaudhri
Member M ¡ ¡
- - - - - - 7th
-
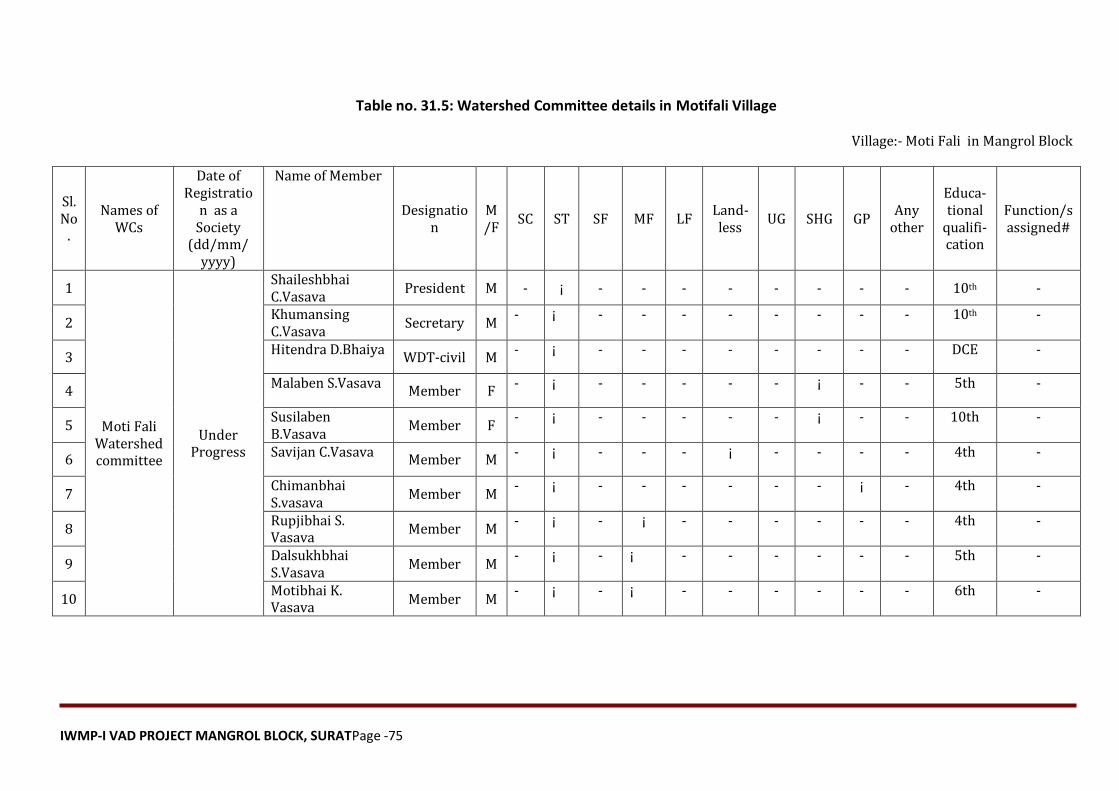
IWMP-I VAD PROJECT MANGROL BLOCK, SURATPage -75
Table no. 31.5: Watershed Committee details in Motifali Village
Village:- Moti Fali in Mangrol Block
Sl. No
.
Names of WCs
Date of Registratio
n as a Society
(dd/mm/ yyyy)
Name of Member
Designation
M/F
SC ST SF MF LF Land-less
UG SHG GP Any
other
Educa-tional
qualifi-cation
Function/s assigned#
1
Moti Fali Watershed committee
Under Progress
Shaileshbhai C.Vasava
President M - ¡ - - - - - - - - 10th -
2 Khumansing C.Vasava
Secretary M - ¡ - - - - - - - - 10th -
3 Hitendra D.Bhaiya
WDT-civil M - ¡ - - - - - - - - DCE -
4 Malaben S.Vasava
Member F - ¡ - - - - - ¡ - - 5th -
5 Susilaben B.Vasava
Member F - ¡ - - - - - ¡ - - 10th -
6 Savijan C.Vasava
Member M - ¡ - - - ¡ - - - - 4th -
7 Chimanbhai S.vasava
Member M - ¡ - - - - - - ¡ - 4th -
8 Rupjibhai S. Vasava
Member M - ¡ - ¡ - - - - - - 4th -
9 Dalsukhbhai S.Vasava
Member M - ¡ - ¡ - - - - - - 5th -
10 Motibhai K. Vasava
Member M - ¡ - ¡ - - - - - - 6th -
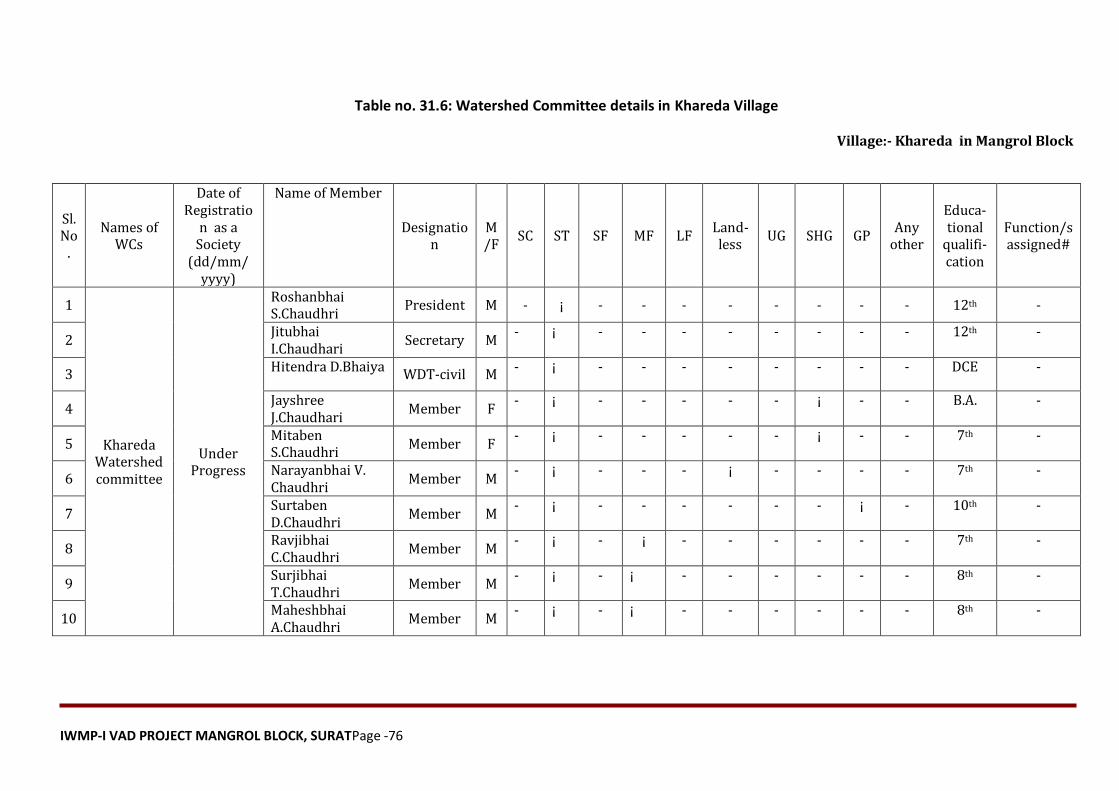
IWMP-I VAD PROJECT MANGROL BLOCK, SURATPage -76
Table no. 31.6: Watershed Committee details in Khareda Village
Village:- Khareda in Mangrol Block
Sl. No
.
Names of WCs
Date of Registratio
n as a Society
(dd/mm/ yyyy)
Name of Member
Designation
M/F
SC ST SF MF LF Land-less
UG SHG GP Any
other
Educa-tional
qualifi-cation
Function/s assigned#
1
Khareda Watershed committee
Under Progress
Roshanbhai S.Chaudhri
President M - ¡ - - - - - - - - 12th -
2 Jitubhai I.Chaudhari
Secretary M - ¡ - - - - - - - - 12th -
3 Hitendra D.Bhaiya
WDT-civil M - ¡ - - - - - - - - DCE -
4 Jayshree J.Chaudhari
Member F - ¡ - - - - - ¡ - - B.A. -
5 Mitaben S.Chaudhri
Member F - ¡ - - - - - ¡ - - 7th -
6 Narayanbhai V. Chaudhri
Member M - ¡ - - - ¡ - - - - 7th -
7 Surtaben D.Chaudhri
Member M - ¡ - - - - - - ¡ - 10th -
8 Ravjibhai C.Chaudhri
Member M - ¡ - ¡ - - - - - - 7th -
9 Surjibhai T.Chaudhri
Member M - ¡ - ¡ - - - - - - 8th -
10 Maheshbhai A.Chaudhri
Member M - ¡ - ¡ - - - - - - 8th -

IWMP-I VAD PROJECT MANGROL BLOCK, SURATPage -77
Table no. 31.7: Watershed Committee details Mangrol in Village Village:- Mangrol in Mangrol Block
Sl. No
.
Names of WCs
Date of Registratio
n as a Society
(dd/mm/ yyyy)
Name of Member
Designation
M/F
SC ST SF MF LF Land-less
UG SHG GP Any
other
Educa-tional
qualifi-cation
Function/s
assigned#
1
Mangrol Watershed committee
Under Progress
Udesing M.Vasava President M - ¡ - - - - - - - - 5th -
2 Satishbhai G. Kataria
Secretary M - ¡ - - - - - - - - 10th -
3 Hitendra D.Bhaiya
WDT-civil M - ¡ - - - - - - - - DCE -
4 Urmilaben D. Vasava
Member F - ¡ - - - - - ¡ - - 9th -
5 Ushaben S. Vasava
Member F - ¡ - - - - - ¡ - - illiterate -
6 Natvarbhai V. Vasava
Member M - ¡ - - - ¡ - - - - 3rd -
7 Saraben S. Sidat
Member F - ¡ - - - - - - ¡ - 12th -
8 Ganpat D. Kataria
Member M - ¡ - ¡ - - - - - - 10th -
9 Govindbhai b. Gamit
Member M - ¡ - ¡ - - - - - - 7th -
10 Kalidas G. Vasava
Member M - ¡ - ¡ - - - - - - illiterate -
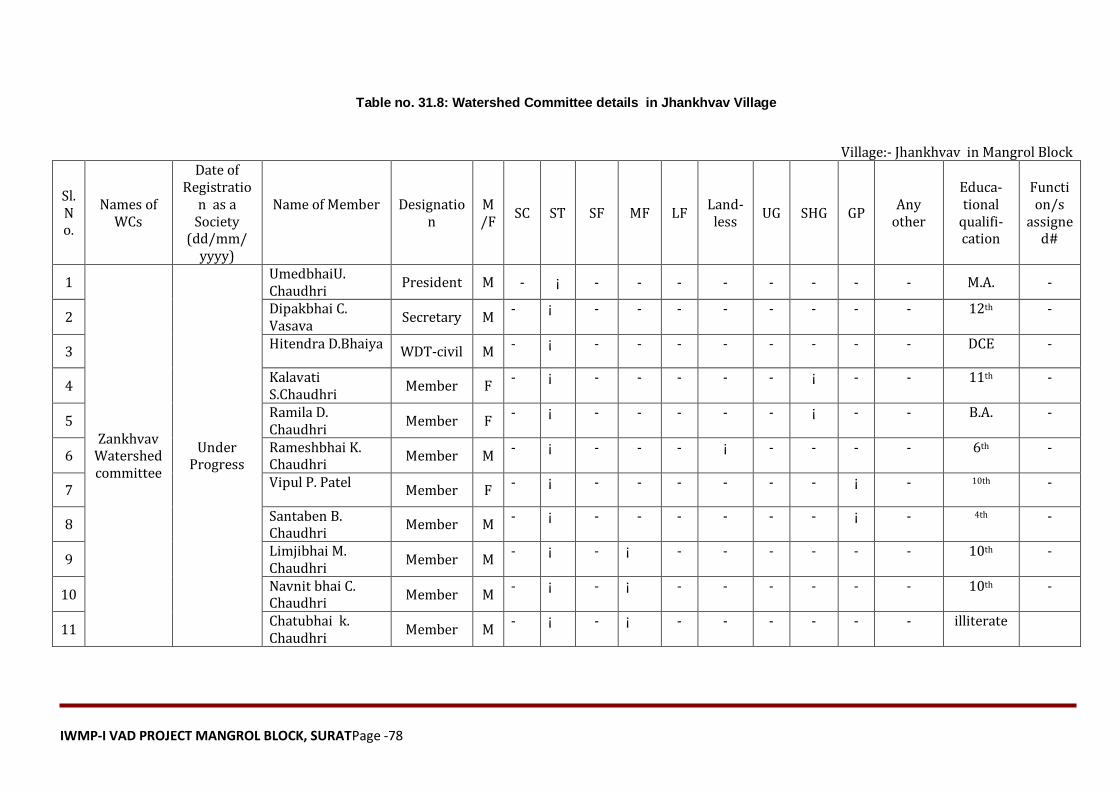
IWMP-I VAD PROJECT MANGROL BLOCK, SURATPage -78
Table no. 31.8: Watershed Committee details in Jhankhvav Village
Village:- Jhankhvav in Mangrol Block
Sl. No.
Names of WCs
Date of Registratio
n as a Society
(dd/mm/ yyyy)
Name of Member Designation
M/F
SC ST SF MF LF Land-less
UG SHG GP Any
other
Educa-tional
qualifi-cation
Function/s
assigned#
1
Zankhvav Watershed committee
Under Progress
UmedbhaiU. Chaudhri
President M - ¡ - - - - - - - - M.A. -
2 Dipakbhai C. Vasava
Secretary M - ¡ - - - - - - - - 12th -
3 Hitendra D.Bhaiya
WDT-civil M - ¡ - - - - - - - - DCE -
4 Kalavati S.Chaudhri
Member F - ¡ - - - - - ¡ - - 11th -
5 Ramila D. Chaudhri
Member F - ¡ - - - - - ¡ - - B.A. -
6 Rameshbhai K. Chaudhri
Member M - ¡ - - - ¡ - - - - 6th -
7 Vipul P. Patel
Member F - ¡ - - - - - - ¡ - 10th -
8 Santaben B. Chaudhri
Member M - ¡ - - - - - - ¡ - 4th -
9 Limjibhai M. Chaudhri
Member M - ¡ - ¡ - - - - - - 10th -
10 Navnit bhai C. Chaudhri
Member M - ¡ - ¡ - - - - - - 10th -
11 Chatubhai k. Chaudhri
Member M - ¡ - ¡ - - - - - - illiterate
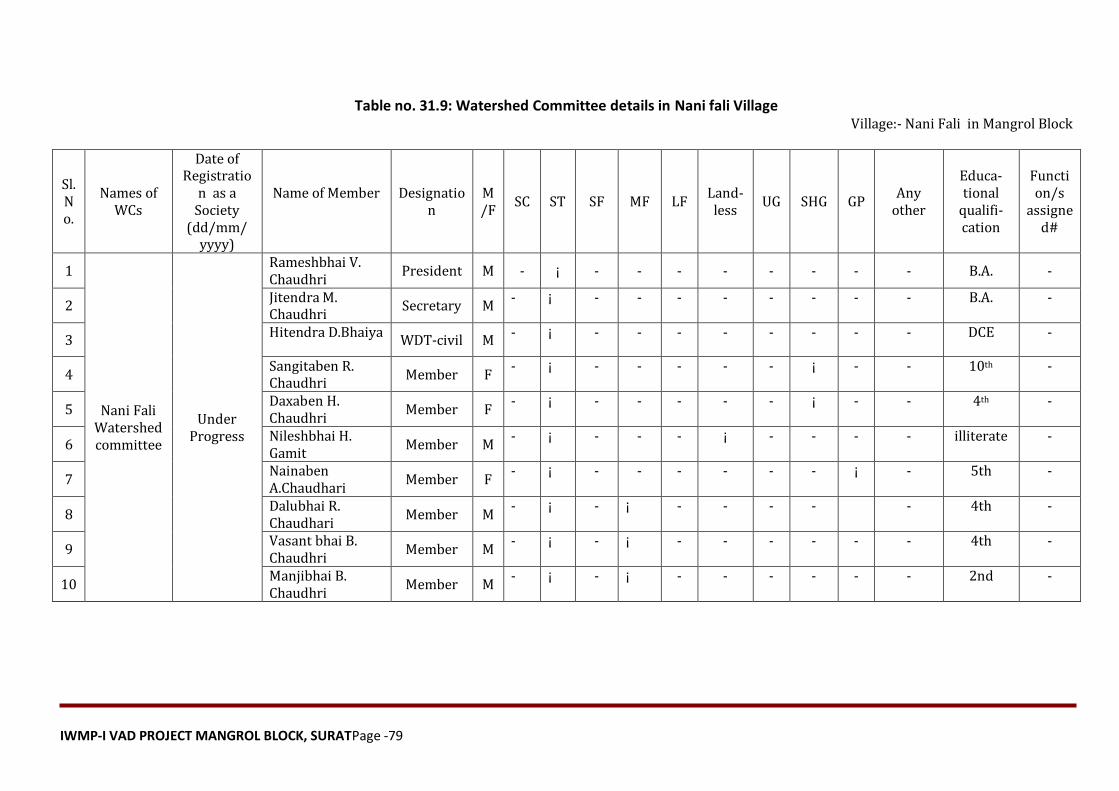
IWMP-I VAD PROJECT MANGROL BLOCK, SURATPage -79
Table no. 31.9: Watershed Committee details in Nani fali Village Village:- Nani Fali in Mangrol Block
Sl. No.
Names of WCs
Date of Registratio
n as a Society
(dd/mm/ yyyy)
Name of Member Designation
M/F
SC ST SF MF LF Land-less
UG SHG GP Any
other
Educa-tional
qualifi-cation
Function/s
assigned#
1
Nani Fali Watershed committee
Under Progress
Rameshbhai V. Chaudhri
President M - ¡ - - - - - - - - B.A. -
2 Jitendra M. Chaudhri
Secretary M - ¡ - - - - - - - - B.A. -
3 Hitendra D.Bhaiya
WDT-civil M - ¡ - - - - - - - - DCE -
4 Sangitaben R. Chaudhri
Member F - ¡ - - - - - ¡ - - 10th -
5 Daxaben H. Chaudhri
Member F - ¡ - - - - - ¡ - - 4th -
6 Nileshbhai H. Gamit
Member M - ¡ - - - ¡ - - - - illiterate -
7 Nainaben A.Chaudhari
Member F - ¡ - - - - - - ¡ - 5th -
8 Dalubhai R. Chaudhari
Member M - ¡ - ¡ - - - - - 4th -
9 Vasant bhai B. Chaudhri
Member M - ¡ - ¡ - - - - - - 4th -
10 Manjibhai B. Chaudhri
Member M - ¡ - ¡ - - - - - - 2nd -
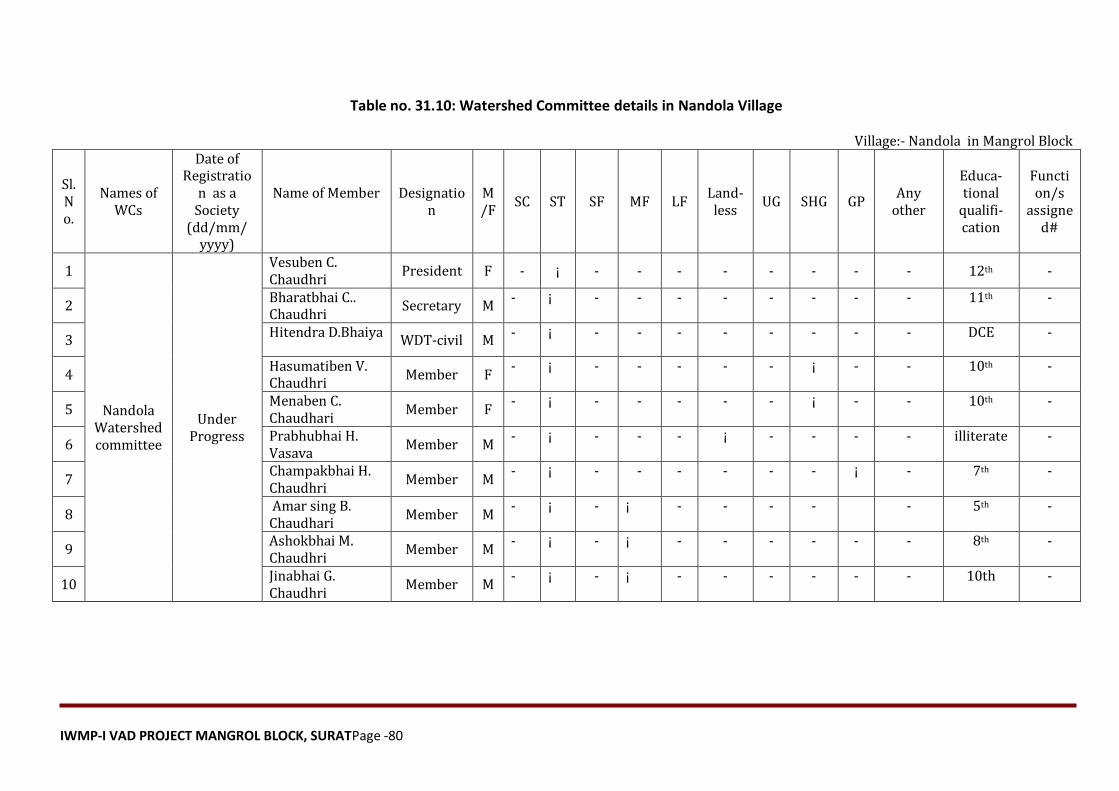
IWMP-I VAD PROJECT MANGROL BLOCK, SURATPage -80
Table no. 31.10: Watershed Committee details in Nandola Village
Village:- Nandola in Mangrol Block
Sl. No.
Names of WCs
Date of Registratio
n as a Society
(dd/mm/ yyyy)
Name of Member Designation
M/F
SC ST SF MF LF Land-less
UG SHG GP Any
other
Educa-tional
qualifi-cation
Function/s
assigned#
1
Nandola Watershed committee
Under Progress
Vesuben C. Chaudhri
President F - ¡ - - - - - - - - 12th -
2 Bharatbhai C.. Chaudhri
Secretary M - ¡ - - - - - - - - 11th -
3 Hitendra D.Bhaiya
WDT-civil M - ¡ - - - - - - - - DCE -
4 Hasumatiben V. Chaudhri
Member F - ¡ - - - - - ¡ - - 10th -
5 Menaben C. Chaudhari
Member F - ¡ - - - - - ¡ - - 10th -
6 Prabhubhai H. Vasava
Member M - ¡ - - - ¡ - - - - illiterate -
7 Champakbhai H. Chaudhri
Member M - ¡ - - - - - - ¡ - 7th -
8 Amar sing B. Chaudhari
Member M - ¡ - ¡ - - - - - 5th -
9 Ashokbhai M. Chaudhri
Member M - ¡ - ¡ - - - - - - 8th -
10 Jinabhai G. Chaudhri
Member M - ¡ - ¡ - - - - - - 10th -
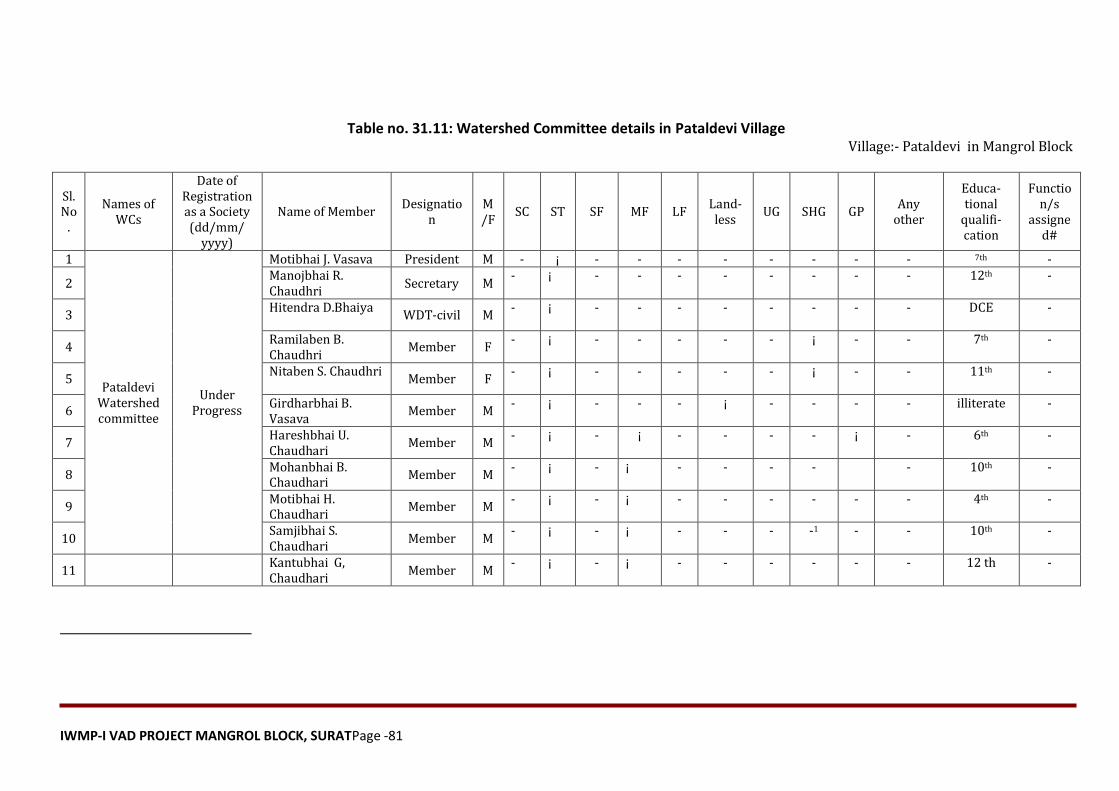
IWMP-I VAD PROJECT MANGROL BLOCK, SURATPage -81
Table no. 31.11: Watershed Committee details in Pataldevi Village
Village:- Pataldevi in Mangrol Block
Sl. No
.
Names of WCs
Date of Registration as a Society (dd/mm/
yyyy)
Name of Member Designatio
n M/F
SC ST SF MF LF Land-less
UG SHG GP Any
other
Educa-tional
qualifi-cation
Function/s
assigned#
1
Pataldevi Watershed committee
Under Progress
Motibhai J. Vasava President M - ¡ - - - - - - - - 7th -
2 Manojbhai R. Chaudhri
Secretary M - ¡ - - - - - - - - 12th -
3 Hitendra D.Bhaiya
WDT-civil M - ¡ - - - - - - - - DCE -
4 Ramilaben B. Chaudhri
Member F - ¡ - - - - - ¡ - - 7th -
5 Nitaben S. Chaudhri
Member F - ¡ - - - - - ¡ - - 11th -
6 Girdharbhai B. Vasava
Member M - ¡ - - - ¡ - - - - illiterate -
7 Hareshbhai U. Chaudhari
Member M - ¡ - ¡ - - - - ¡ - 6th -
8 Mohanbhai B. Chaudhari
Member M - ¡ - ¡ - - - - - 10th -
9 Motibhai H. Chaudhari
Member M - ¡ - ¡ - - - - - - 4th -
10 Samjibhai S. Chaudhari
Member M - ¡ - ¡ - - - -1 - - 10th -
11 Kantubhai G, Chaudhari
Member M - ¡ - ¡ - - - - - - 12 th -
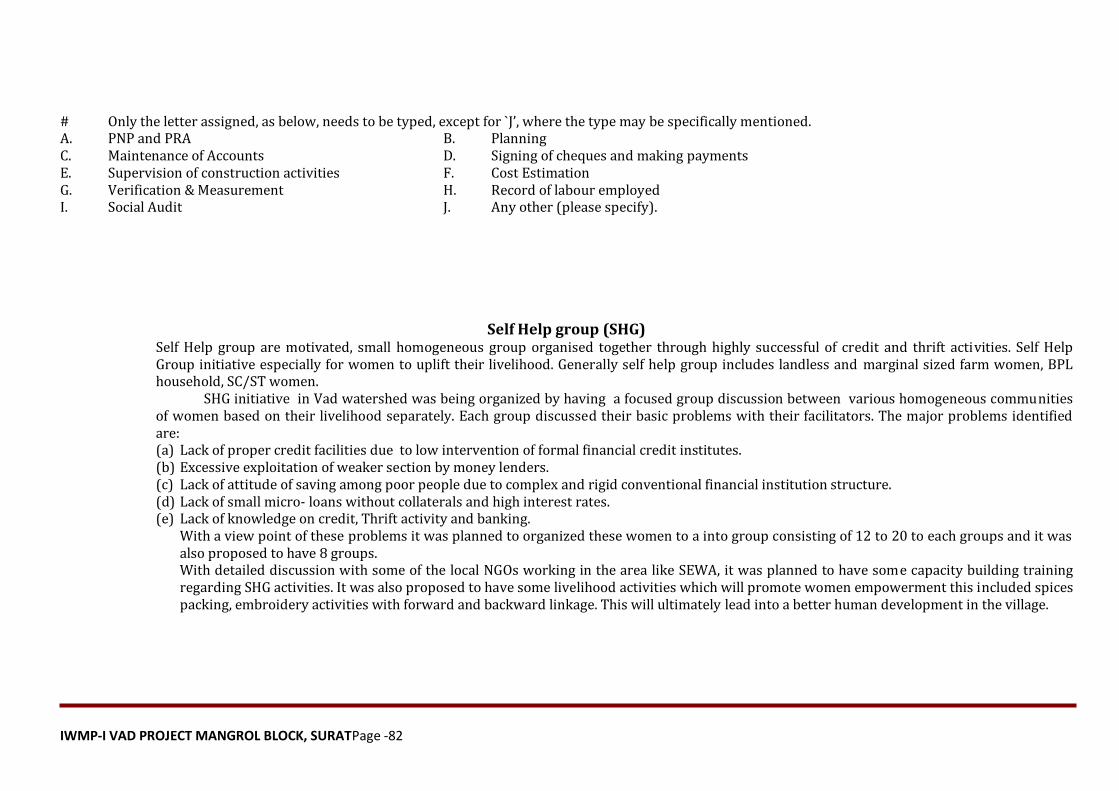
IWMP-I VAD PROJECT MANGROL BLOCK, SURATPage -82
# Only the letter assigned, as below, needs to be typed, except for `J’, where the type may be specifically mentioned. A. PNP and PRA B. Planning C. Maintenance of Accounts D. Signing of cheques and making payments E. Supervision of construction activities F. Cost Estimation G. Verification & Measurement H. Record of labour employed I. Social Audit J. Any other (please specify).
Self Help group (SHG) Self Help group are motivated, small homogeneous group organised together through highly successful of credit and thrift activities. Self Help Group initiative especially for women to uplift their livelihood. Generally self help group includes landless and marginal sized farm women, BPL household, SC/ST women. SHG initiative in Vad watershed was being organized by having a focused group discussion between various homogeneous communities of women based on their livelihood separately. Each group discussed their basic problems with their facilitators. The major problems identified are: (a) Lack of proper credit facilities due to low intervention of formal financial credit institutes. (b) Excessive exploitation of weaker section by money lenders. (c) Lack of attitude of saving among poor people due to complex and rigid conventional financial institution structure. (d) Lack of small micro- loans without collaterals and high interest rates. (e) Lack of knowledge on credit, Thrift activity and banking.
With a view point of these problems it was planned to organized these women to a into group consisting of 12 to 20 to each groups and it was also proposed to have 8 groups. With detailed discussion with some of the local NGOs working in the area like SEWA, it was planned to have some capacity building training regarding SHG activities. It was also proposed to have some livelihood activities which will promote women empowerment this included spices packing, embroidery activities with forward and backward linkage. This will ultimately lead into a better human development in the village.
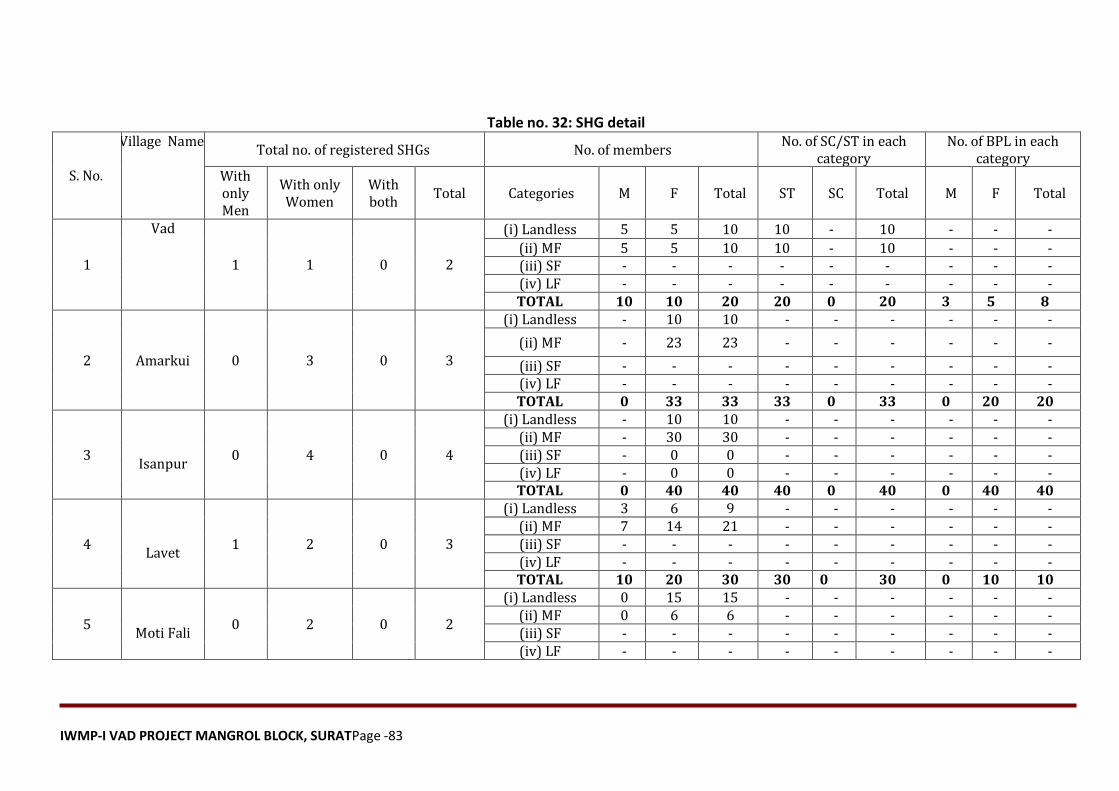
IWMP-I VAD PROJECT MANGROL BLOCK, SURATPage -83
Table no. 32: SHG detail
S. No.
Village Name Total no. of registered SHGs No. of members
No. of SC/ST in each category
No. of BPL in each category
With only Men
With only Women
With both
Total Categories M F Total ST SC Total M F Total
1
Vad
1 1 0 2
(i) Landless 5 5 10 10 - 10 - - -
(ii) MF 5 5 10 10 - 10 - - - (iii) SF - - - - - - - - - (iv) LF - - - - - - - - - TOTAL 10 10 20 20 0 20 3 5 8
2 Amarkui 0 3 0 3
(i) Landless - 10 10 - - - - - -
(ii) MF - 23 23 - - - - - -
(iii) SF - - - - - - - - - (iv) LF - - - - - - - - - TOTAL 0 33 33 33 0 33 0 20 20
3
Isanpur 0 4 0 4
(i) Landless - 10 10 - - - - - - (ii) MF - 30 30 - - - - - - (iii) SF - 0 0 - - - - - - (iv) LF - 0 0 - - - - - - TOTAL 0 40 40 40 0 40 0 40 40
4
Lavet 1 2 0 3
(i) Landless 3 6 9 - - - - - - (ii) MF 7 14 21 - - - - - - (iii) SF - - - - - - - - - (iv) LF - - - - - - - - - TOTAL 10 20 30 30 0 30 0 10 10
5
Moti Fali 0 2 0 2
(i) Landless 0 15 15 - - - - - - (ii) MF 0 6 6 - - - - - - (iii) SF - - - - - - - - - (iv) LF - - - - - - - - -
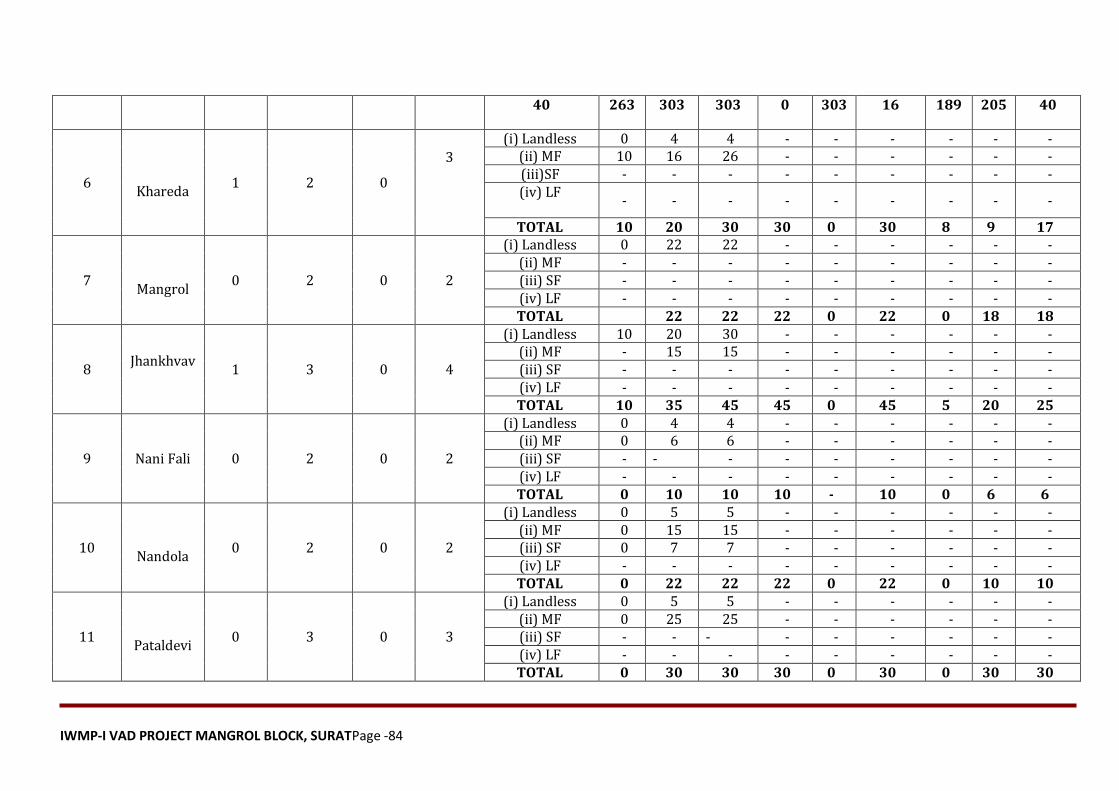
IWMP-I VAD PROJECT MANGROL BLOCK, SURATPage -84
40 263 303 303 0 303 16 189 205 40
6
Khareda 1 2 0
3
(i) Landless 0 4 4 - - - - - - (ii) MF 10 16 26 - - - - - - (iii)SF - - - - - - - - - (iv) LF
- - - - - - - - -
TOTAL 10 20 30 30 0 30 8 9 17
7
Mangrol 0 2 0 2
(i) Landless 0 22 22 - - - - - - (ii) MF - - - - - - - - - (iii) SF - - - - - - - - - (iv) LF - - - - - - - - - TOTAL 22 22 22 0 22 0 18 18
8 Jhankhvav
1 3 0 4
(i) Landless 10 20 30 - - - - - - (ii) MF - 15 15 - - - - - - (iii) SF - - - - - - - - - (iv) LF - - - - - - - - - TOTAL 10 35 45 45 0 45 5 20 25
9 Nani Fali 0 2 0 2
(i) Landless 0 4 4 - - - - - - (ii) MF 0 6 6 - - - - - - (iii) SF - - - - - - - - - (iv) LF - - - - - - - - - TOTAL 0 10 10 10 - 10 0 6 6
10
Nandola 0 2 0 2
(i) Landless 0 5 5 - - - - - - (ii) MF 0 15 15 - - - - - - (iii) SF 0 7 7 - - - - - - (iv) LF - - - - - - - - - TOTAL 0 22 22 22 0 22 0 10 10
11
Pataldevi 0 3 0 3
(i) Landless 0 5 5 - - - - - - (ii) MF 0 25 25 - - - - - - (iii) SF - - - - - - - - - (iv) LF - - - - - - - - - TOTAL 0 30 30 30 0 30 0 30 30
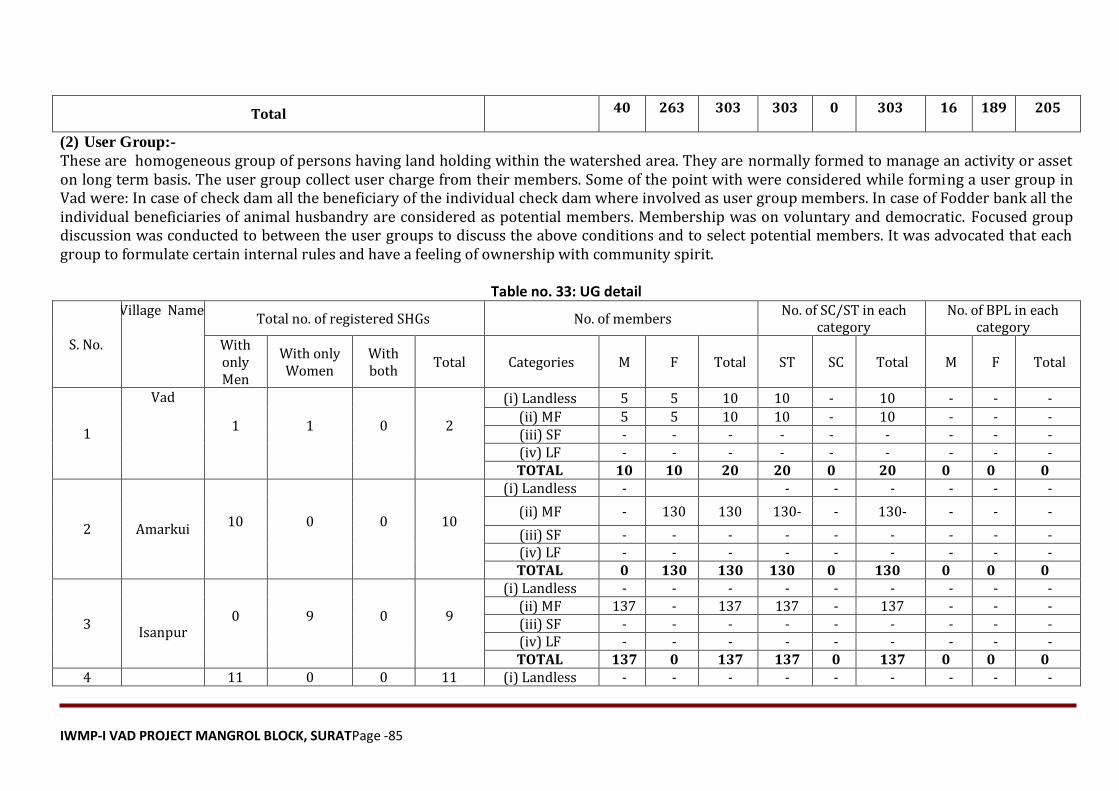
IWMP-I VAD PROJECT MANGROL BLOCK, SURATPage -85
Total 40 263 303 303 0 303 16 189 205
(2) User Group:-
These are homogeneous group of persons having land holding within the watershed area. They are normally formed to manage an activity or asset on long term basis. The user group collect user charge from their members. Some of the point with were considered while forming a user group in Vad were: In case of check dam all the beneficiary of the individual check dam where involved as user group members. In case of Fodder bank all the individual beneficiaries of animal husbandry are considered as potential members. Membership was on voluntary and democratic. Focused group discussion was conducted to between the user groups to discuss the above conditions and to select potential members. It was advocated that each group to formulate certain internal rules and have a feeling of ownership with community spirit.
Table no. 33: UG detail
S. No.
Village Name Total no. of registered SHGs No. of members
No. of SC/ST in each category
No. of BPL in each category
With only Men
With only Women
With both
Total Categories M F Total ST SC Total M F Total
1
Vad
1 1 0 2
(i) Landless 5 5 10 10 - 10 - - -
(ii) MF 5 5 10 10 - 10 - - - (iii) SF - - - - - - - - - (iv) LF - - - - - - - - - TOTAL 10 10 20 20 0 20 0 0 0
2 Amarkui 10 0 0 10
(i) Landless - - - - - - -
(ii) MF - 130 130 130- - 130- - - -
(iii) SF - - - - - - - - - (iv) LF - - - - - - - - - TOTAL 0 130 130 130 0 130 0 0 0
3
Isanpur 0 9 0 9
(i) Landless - - - - - - - - - (ii) MF 137 - 137 137 - 137 - - - (iii) SF - - - - - - - - - (iv) LF - - - - - - - - - TOTAL 137 0 137 137 0 137 0 0 0
4 11 0 0 11 (i) Landless - - - - - - - - -
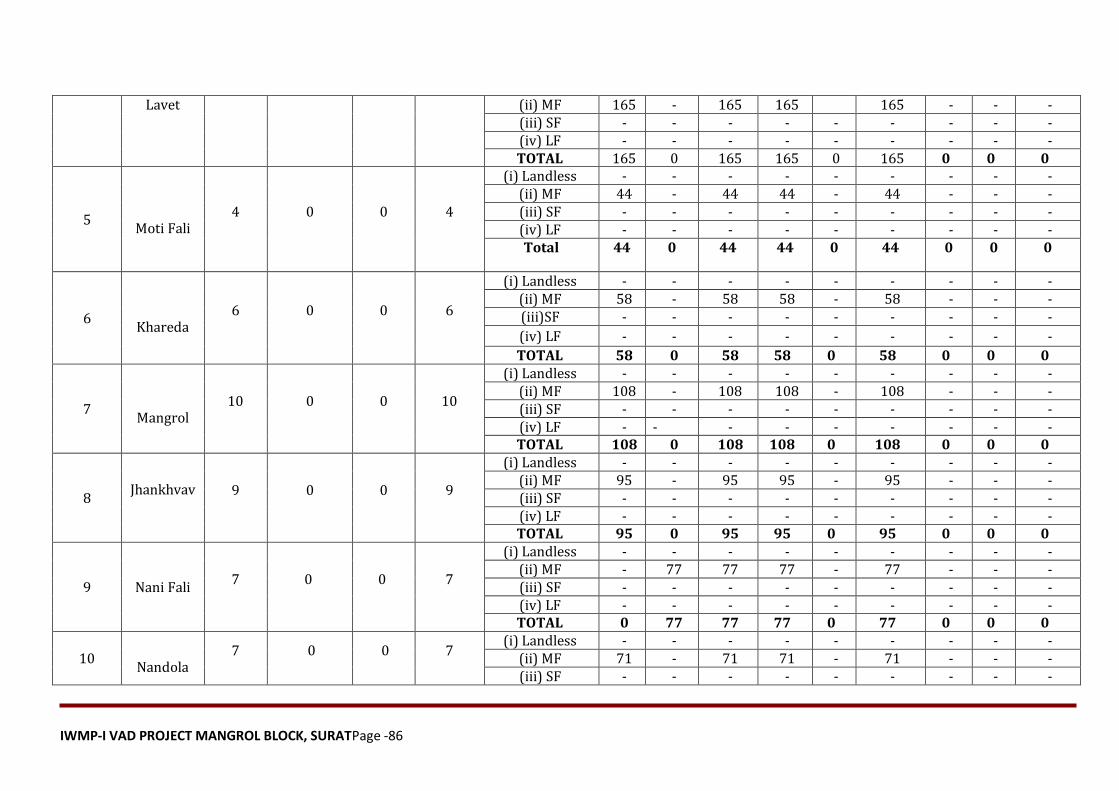
IWMP-I VAD PROJECT MANGROL BLOCK, SURATPage -86
Lavet (ii) MF 165 - 165 165 165 - - - (iii) SF - - - - - - - - - (iv) LF - - - - - - - - - TOTAL 165 0 165 165 0 165 0 0 0
5
Moti Fali 4 0 0 4
(i) Landless - - - - - - - - - (ii) MF 44 - 44 44 - 44 - - - (iii) SF - - - - - - - - - (iv) LF - - - - - - - - - Total 44 0 44 44 0 44 0 0 0
6
Khareda 6 0 0 6
(i) Landless - - - - - - - - - (ii) MF 58 - 58 58 - 58 - - - (iii)SF - - - - - - - - -
(iv) LF - - - - - - - - -
TOTAL 58 0 58 58 0 58 0 0 0
7
Mangrol 10 0 0 10
(i) Landless - - - - - - - - - (ii) MF 108 - 108 108 - 108 - - - (iii) SF - - - - - - - - - (iv) LF - - - - - - - - - TOTAL 108 0 108 108 0 108 0 0 0
8 Jhankhvav
9 0 0 9
(i) Landless - - - - - - - - - (ii) MF 95 - 95 95 - 95 - - - (iii) SF - - - - - - - - - (iv) LF - - - - - - - - - TOTAL 95 0 95 95 0 95 0 0 0
9 Nani Fali 7 0 0 7
(i) Landless - - - - - - - - - (ii) MF - 77 77 77 - 77 - - - (iii) SF - - - - - - - - - (iv) LF - - - - - - - - - TOTAL 0 77 77 77 0 77 0 0 0
10
Nandola 7 0 0 7
(i) Landless - - - - - - - - - (ii) MF 71 - 71 71 - 71 - - - (iii) SF - - - - - - - - -
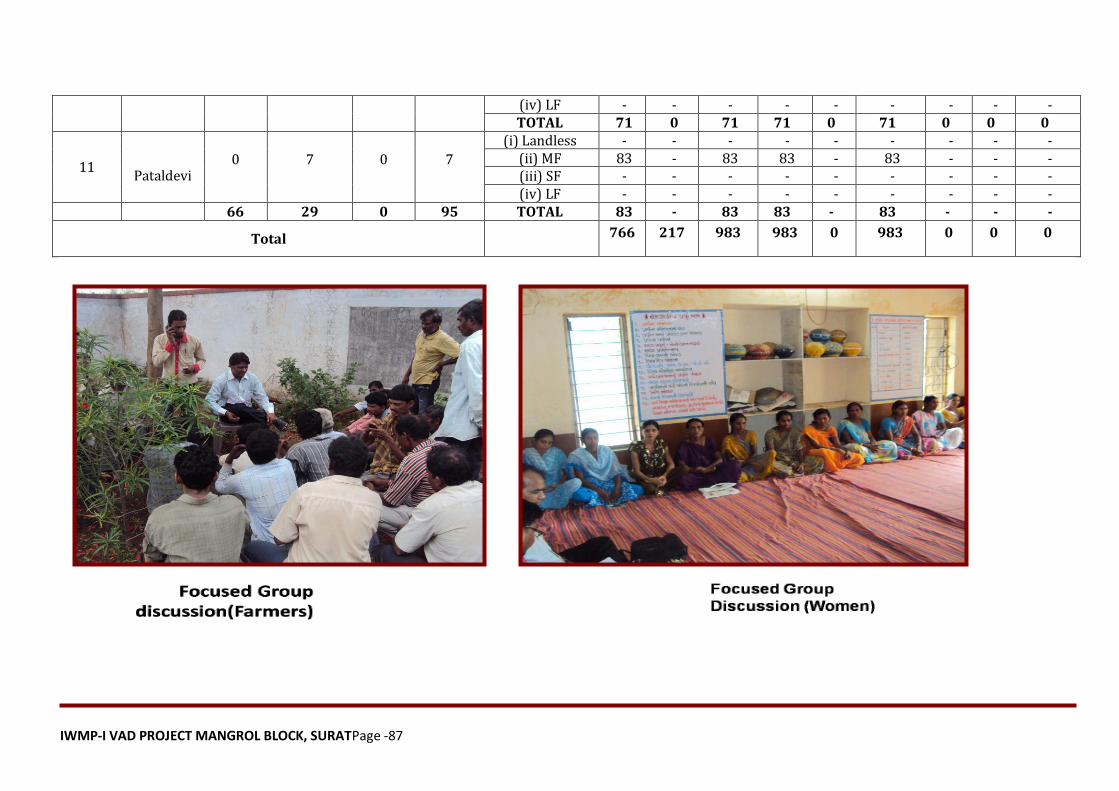
IWMP-I VAD PROJECT MANGROL BLOCK, SURATPage -87
(iv) LF - - - - - - - - - TOTAL 71 0 71 71 0 71 0 0 0
11
Pataldevi 0 7 0 7
(i) Landless - - - - - - - - - (ii) MF 83 - 83 83 - 83 - - - (iii) SF - - - - - - - - - (iv) LF - - - - - - - - -
66 29 0 95 TOTAL 83 - 83 83 - 83 - - -
Total 766 217 983 983 0 983 0 0 0
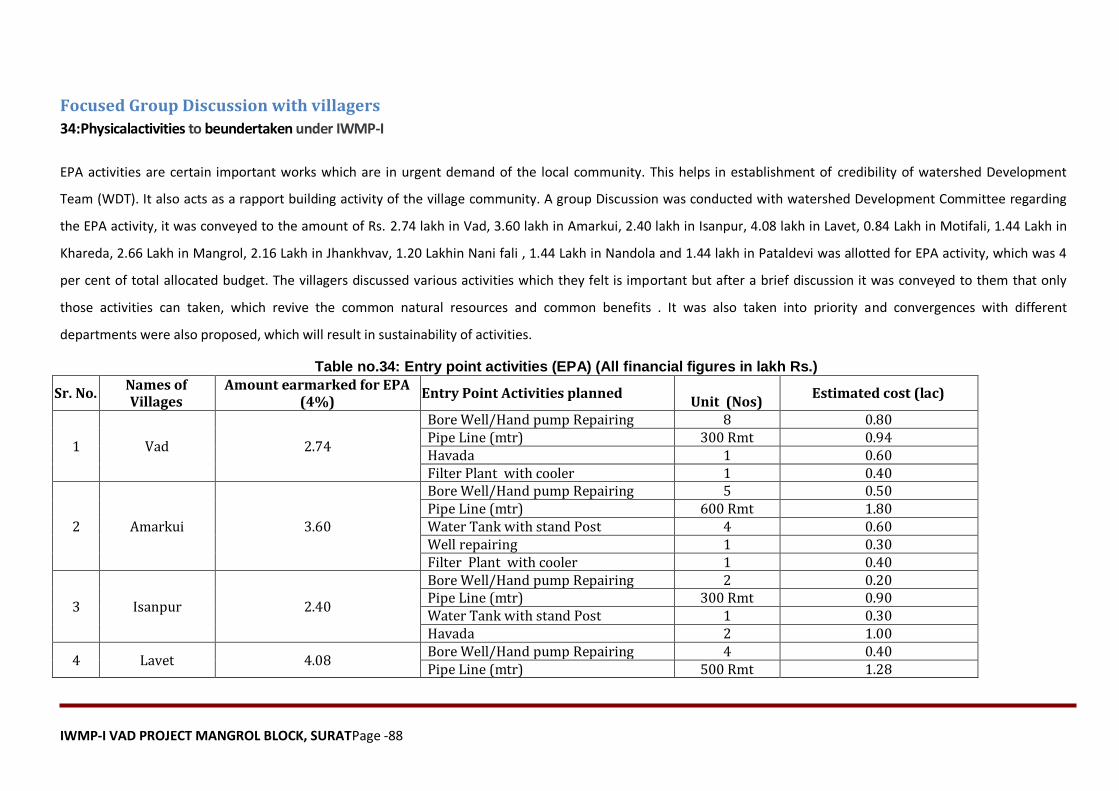
IWMP-I VAD PROJECT MANGROL BLOCK, SURATPage -88
Focused Group Discussion with villagers
34:Physicalactivities to beundertaken under IWMP-I
EPA activities are certain important works which are in urgent demand of the local community. This helps in establishment of credibility of watershed Development
Team (WDT). It also acts as a rapport building activity of the village community. A group Discussion was conducted with watershed Development Committee regarding
the EPA activity, it was conveyed to the amount of Rs. 2.74 lakh in Vad, 3.60 lakh in Amarkui, 2.40 lakh in Isanpur, 4.08 lakh in Lavet, 0.84 Lakh in Motifali, 1.44 Lakh in
Khareda, 2.66 Lakh in Mangrol, 2.16 Lakh in Jhankhvav, 1.20 Lakhin Nani fali , 1.44 Lakh in Nandola and 1.44 lakh in Pataldevi was allotted for EPA activity, which was 4
per cent of total allocated budget. The villagers discussed various activities which they felt is important but after a brief discussion it was conveyed to them that only
those activities can taken, which revive the common natural resources and common benefits . It was also taken into priority and convergences with different
departments were also proposed, which will result in sustainability of activities.
Table no.34: Entry point activities (EPA) (All financial figures in lakh Rs.)
Sr. No. Names of Villages
Amount earmarked for EPA (4%)
Entry Point Activities planned
Unit (Nos) Estimated cost (lac)
1 Vad 2.74
Bore Well/Hand pump Repairing 8 0.80 Pipe Line (mtr) 300 Rmt 0.94 Havada 1 0.60 Filter Plant with cooler 1 0.40
2 Amarkui 3.60
Bore Well/Hand pump Repairing 5 0.50 Pipe Line (mtr) 600 Rmt 1.80 Water Tank with stand Post 4 0.60 Well repairing 1 0.30 Filter Plant with cooler 1 0.40
3 Isanpur 2.40
Bore Well/Hand pump Repairing 2 0.20 Pipe Line (mtr) 300 Rmt 0.90 Water Tank with stand Post 1 0.30 Havada 2 1.00
4 Lavet 4.08 Bore Well/Hand pump Repairing 4 0.40 Pipe Line (mtr) 500 Rmt 1.28
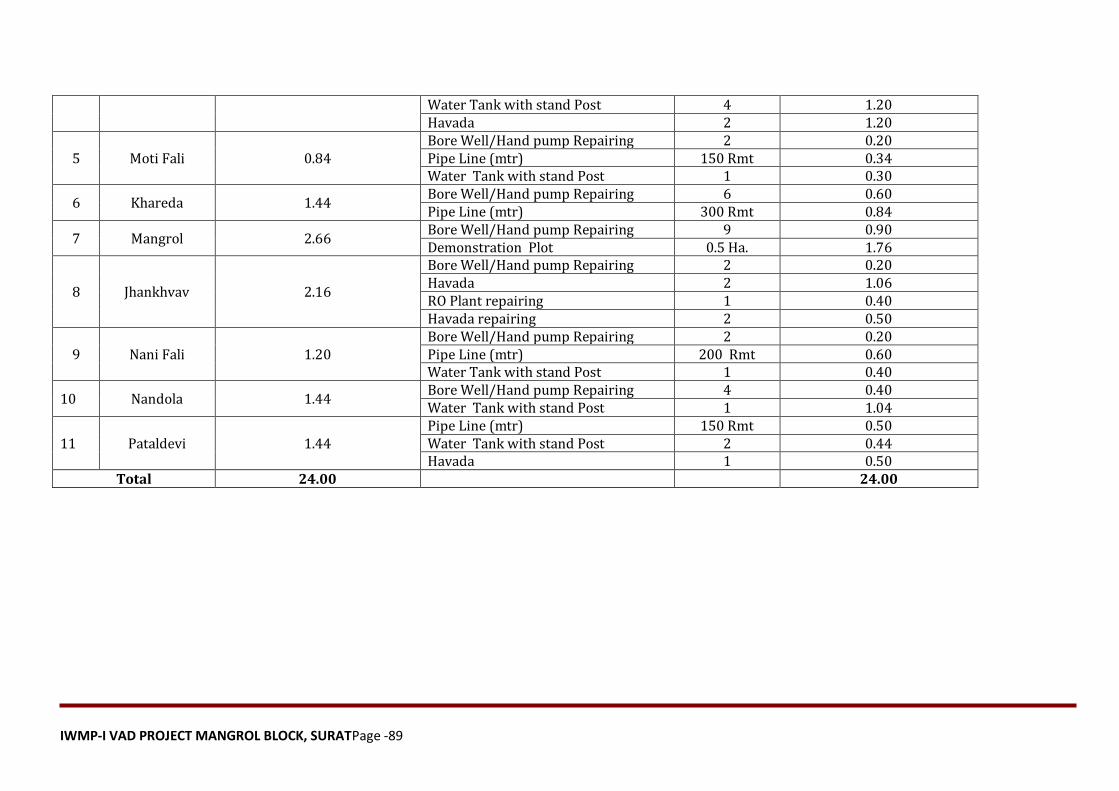
IWMP-I VAD PROJECT MANGROL BLOCK, SURATPage -89
Water Tank with stand Post 4 1.20 Havada 2 1.20
5 Moti Fali 0.84 Bore Well/Hand pump Repairing 2 0.20 Pipe Line (mtr) 150 Rmt 0.34 Water Tank with stand Post 1 0.30
6 Khareda 1.44 Bore Well/Hand pump Repairing 6 0.60 Pipe Line (mtr) 300 Rmt 0.84
7 Mangrol 2.66 Bore Well/Hand pump Repairing 9 0.90 Demonstration Plot 0.5 Ha. 1.76
8 Jhankhvav 2.16
Bore Well/Hand pump Repairing 2 0.20 Havada 2 1.06 RO Plant repairing 1 0.40 Havada repairing 2 0.50
9 Nani Fali 1.20 Bore Well/Hand pump Repairing 2 0.20 Pipe Line (mtr) 200 Rmt 0.60 Water Tank with stand Post 1 0.40
10 Nandola 1.44 Bore Well/Hand pump Repairing 4 0.40 Water Tank with stand Post 1 1.04
11 Pataldevi 1.44 Pipe Line (mtr) 150 Rmt 0.50 Water Tank with stand Post 2 0.44 Havada 1 0.50
Total 24.00 24.00
IWMP-I VAD PROJECT MANGROL BLOCK, SURATPage -90
Specified by Villager for Entry Point Activity (EPA)
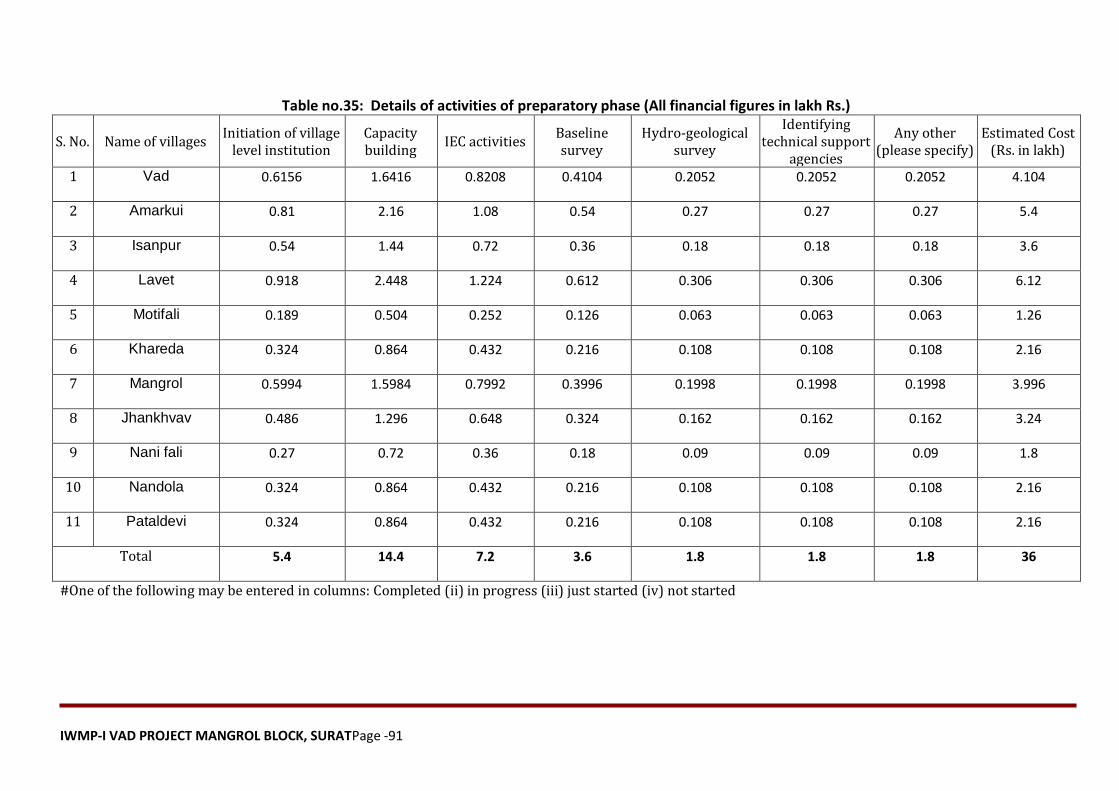
IWMP-I VAD PROJECT MANGROL BLOCK, SURATPage -91
Table no.35: Details of activities of preparatory phase (All financial figures in lakh Rs.)
S. No. Name of villages Initiation of village
level institution Capacity building
IEC activities Baseline survey
Hydro-geological survey
Identifying technical support
agencies
Any other (please specify)
Estimated Cost (Rs. in lakh)
1 Vad 0.6156 1.6416 0.8208 0.4104 0.2052 0.2052 0.2052 4.104
2 Amarkui 0.81 2.16 1.08 0.54 0.27 0.27 0.27 5.4
3 Isanpur 0.54 1.44 0.72 0.36 0.18 0.18 0.18 3.6
4 Lavet 0.918 2.448 1.224 0.612 0.306 0.306 0.306 6.12
5 Motifali 0.189 0.504 0.252 0.126 0.063 0.063 0.063 1.26
6 Khareda 0.324 0.864 0.432 0.216 0.108 0.108 0.108 2.16
7 Mangrol 0.5994 1.5984 0.7992 0.3996 0.1998 0.1998 0.1998 3.996
8 Jhankhvav 0.486 1.296 0.648 0.324 0.162 0.162 0.162 3.24
9 Nani fali 0.27 0.72 0.36 0.18 0.09 0.09 0.09 1.8
10 Nandola 0.324 0.864 0.432 0.216 0.108 0.108 0.108 2.16
11 Pataldevi 0.324 0.864 0.432 0.216 0.108 0.108 0.108 2.16
Total 5.4 14.4 7.2 3.6 1.8 1.8 1.8 36
#One of the following may be entered in columns: Completed (ii) in progress (iii) just started (iv) not started
IWMP-I VAD PROJECT MANGROL BLOCK, SURATPage -92
36. Watershed Development Works:
Watershed development works is to be done during implementation phase of watershed. Treatments begin from the highest point of the watershed and move
progressively downwards (ridge to valley), starting with the smallest stream and culminating in the main river of the watershed.Work is location-specific, varying
according to slope and geology as also the size of the stream being treated.The aim is to weave interventions into the contours of nature, not to seek mastery over
it.A net budget of 50 percent is allotted for this work.
36.1 Ridge Area Treatment Plans
In a watershed, the slopes falling from the ridge to the beginning of the plains are called ridge area. It is very important to treat the higher reaches of the ridge
has this is where the major water resources originate. This involves mainlyhighly and forest region in the watershed. Various watershed managing structures
should be build to arrest the erosion anddegradation of forest with grasses in upper ridges.
1. Contour Bund/trench
2. Boulder Checks
3. Gabions
4. Grass seedling/planatation
1. Gabions
Gabion structures are rock and wire dams constructed across drainage lines with a catchment area of 50-500 ha. They are also constructed to reinforce highly
erodible stream embankments.The main aim of constructing gabion structures is to reduce the velocity of water flowing through the drainage line. By reducing
the velocity of runoff, gabion structures help in
IWMP-I VAD PROJECT MANGROL BLOCK, SURATPage -93
1. Reduction in soil erosion
2. Trapping silt, which reduces the rate of siltation in water harvesting structures inthe lower reaches of the watershed.
3. Increasing recharge of groundwater and
4. Increasing the duration of flow in the drainage line. Therefore, the capacity ofthe water harvesting structures created downstream on the drainage line is
utilized more fully as they get many more refills.
4.3.2.2Drainage line Treatment and water harvesting for land development:
The second tier treatment is the slope treatment. This is generally agricultural land or waste lands. These are generally water conservation or surface
water storage structures. These being highly labour intensive will involve more of manual labour so schemes like National Rural Employment Guarantee
Scheme (NREGS) can be taken.Following structures has been proposed in the project villages.
1. Check dams
2. Waste Weir
1. Check dams
Check dams are constructed across small streams having slope the selected should have sufficient thickness of permeable bed or weathered formation to
facilitate recharge of stored water within short span of time. The water stored in these structures is mostly confined to stream course and the height is
normally less than 2m and excess water is allowed to flow over the wall in order to avoid scouring from excess runoff water cushions are provided at
IWMP-I VAD PROJECT MANGROL BLOCK, SURATPage -94
downstream side. To harness the maximum run off in the stream series of such check dams are to be constructed to have recharge on regional scale in
project villages.
2. Waste weirs
These are constructed for giving a safe passage to the excess runoff from the field and also store some amount of water in the field. The water stored in
these structures is mostly confined in field and height is normally less than 0. 5 mt. and excess water is allowed to flow over the wall.
4.3.2.3 Plains or Flat level/Field level:
1. Percolation tank
2. Farm bund
3. Afforestation
1) Percolation tank
Percolation Tank: Percolation dams are constructed for recharging groundwater. Such structures are usually made on the upper part of the catchment
area. Water stored here percolates to wells and tube wells located in the lower part of the catchment. Such dams can also be made in the immediate
upstream portion of wells and tube wells. Depending on the capacity of the dam and duration of water storage, the dam can have secondary benefits (such
as pisciculture) that are vital for the livelihood security of marginal farmers and landless labourers.
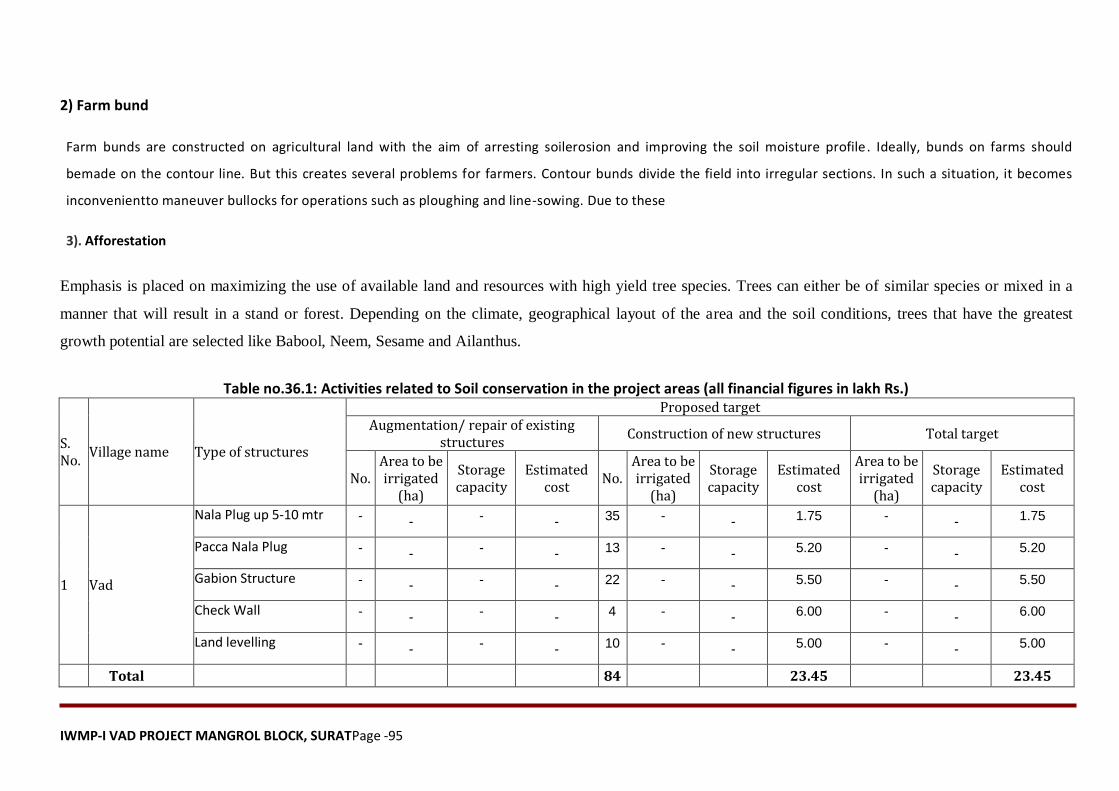
IWMP-I VAD PROJECT MANGROL BLOCK, SURATPage -95
2) Farm bund
Farm bunds are constructed on agricultural land with the aim of arresting soilerosion and improving the soil moisture profile . Ideally, bunds on farms should
bemade on the contour line. But this creates several problems for farmers. Contour bunds divide the field into irregular sections. In such a situation, it becomes
inconvenientto maneuver bullocks for operations such as ploughing and line-sowing. Due to these
3). Afforestation
Emphasis is placed on maximizing the use of available land and resources with high yield tree species. Trees can either be of similar species or mixed in a
manner that will result in a stand or forest. Depending on the climate, geographical layout of the area and the soil conditions, trees that have the greatest
growth potential are selected like Babool, Neem, Sesame and Ailanthus.
Table no.36.1: Activities related to Soil conservation in the project areas (all financial figures in lakh Rs.)
S. No.
Village name Type of structures
Proposed target Augmentation/ repair of existing
structures Construction of new structures Total target
No. Area to be irrigated
(ha)
Storage capacity
Estimated cost
No. Area to be irrigated
(ha)
Storage capacity
Estimated cost
Area to be irrigated
(ha)
Storage capacity
Estimated cost
1 Vad
Nala Plug up 5-10 mtr - - - - 35 - - 1.75 - - 1.75
Pacca Nala Plug - - - - 13 - - 5.20 - - 5.20
Gabion Structure - - - - 22 - - 5.50 - - 5.50
Check Wall - - - - 4 - - 6.00 - - 6.00
Land levelling - - - - 10 - - 5.00 - - 5.00
Total 84 23.45 23.45
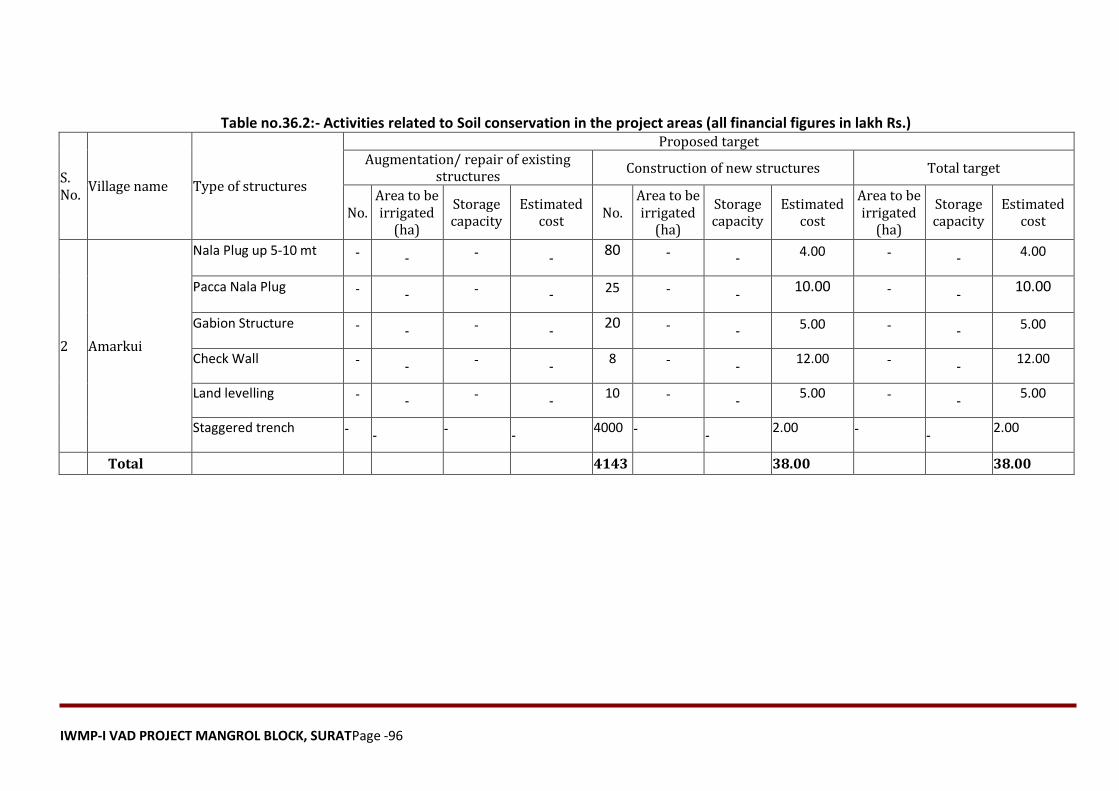
IWMP-I VAD PROJECT MANGROL BLOCK, SURATPage -96
Table no.36.2:- Activities related to Soil conservation in the project areas (all financial figures in lakh Rs.)
S. No.
Village name Type of structures
Proposed target Augmentation/ repair of existing
structures Construction of new structures Total target
No. Area to be irrigated
(ha)
Storage capacity
Estimated cost
No. Area to be irrigated
(ha)
Storage capacity
Estimated cost
Area to be irrigated
(ha)
Storage capacity
Estimated cost
2 Amarkui
Nala Plug up 5-10 mt - - - - 80 - - 4.00 - - 4.00
Pacca Nala Plug - - - - 25 - - 10.00 - -
10.00
Gabion Structure - - - - 20 - - 5.00 - - 5.00
Check Wall - - - - 8 - -
12.00 - - 12.00
Land levelling - - - - 10 - -
5.00 - - 5.00
Staggered trench - - - - 4000 - -
2.00 - - 2.00
Total 4143 38.00 38.00
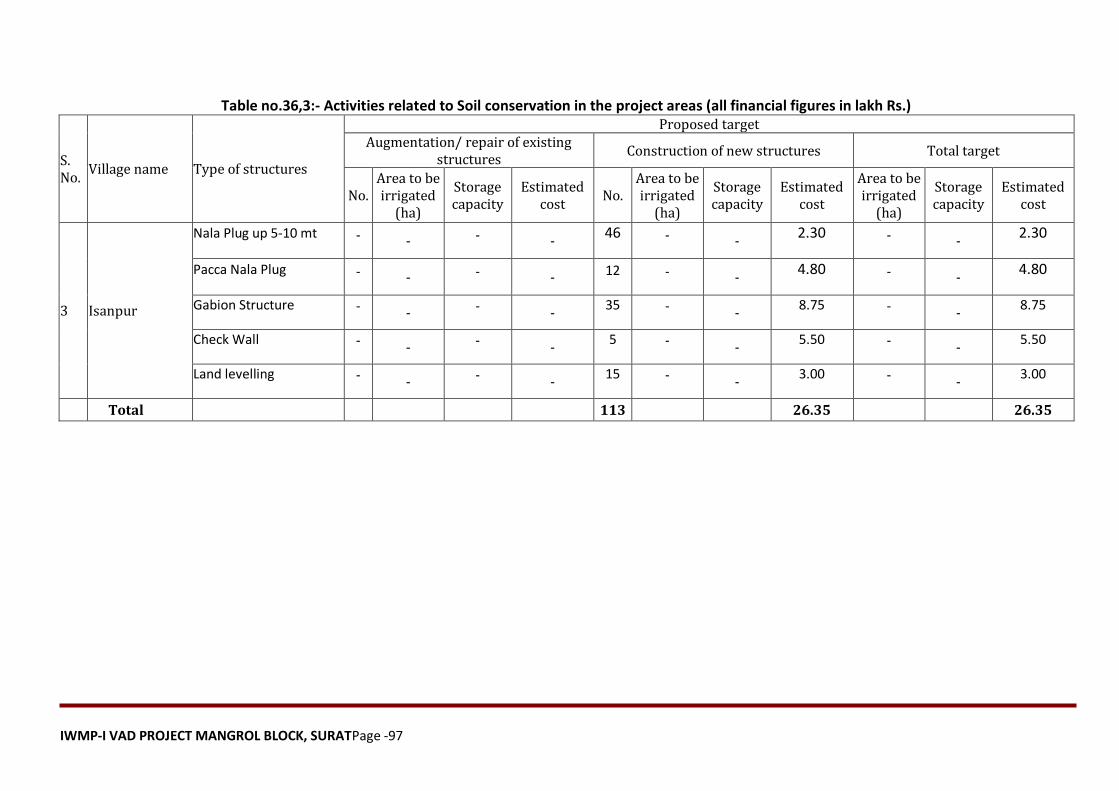
IWMP-I VAD PROJECT MANGROL BLOCK, SURATPage -97
Table no.36,3:- Activities related to Soil conservation in the project areas (all financial figures in lakh Rs.)
S. No.
Village name Type of structures
Proposed target Augmentation/ repair of existing
structures Construction of new structures Total target
No. Area to be irrigated
(ha)
Storage capacity
Estimated cost
No. Area to be irrigated
(ha)
Storage capacity
Estimated cost
Area to be irrigated
(ha)
Storage capacity
Estimated cost
3 Isanpur
Nala Plug up 5-10 mt - - - - 46 - -
2.30 - - 2.30
Pacca Nala Plug - - - - 12 - - 4.80 - -
4.80
Gabion Structure - - - - 35 - -
8.75 - - 8.75
Check Wall - - - - 5 - -
5.50 - - 5.50
Land levelling - - - - 15 - -
3.00 - - 3.00
Total 113 26.35 26.35
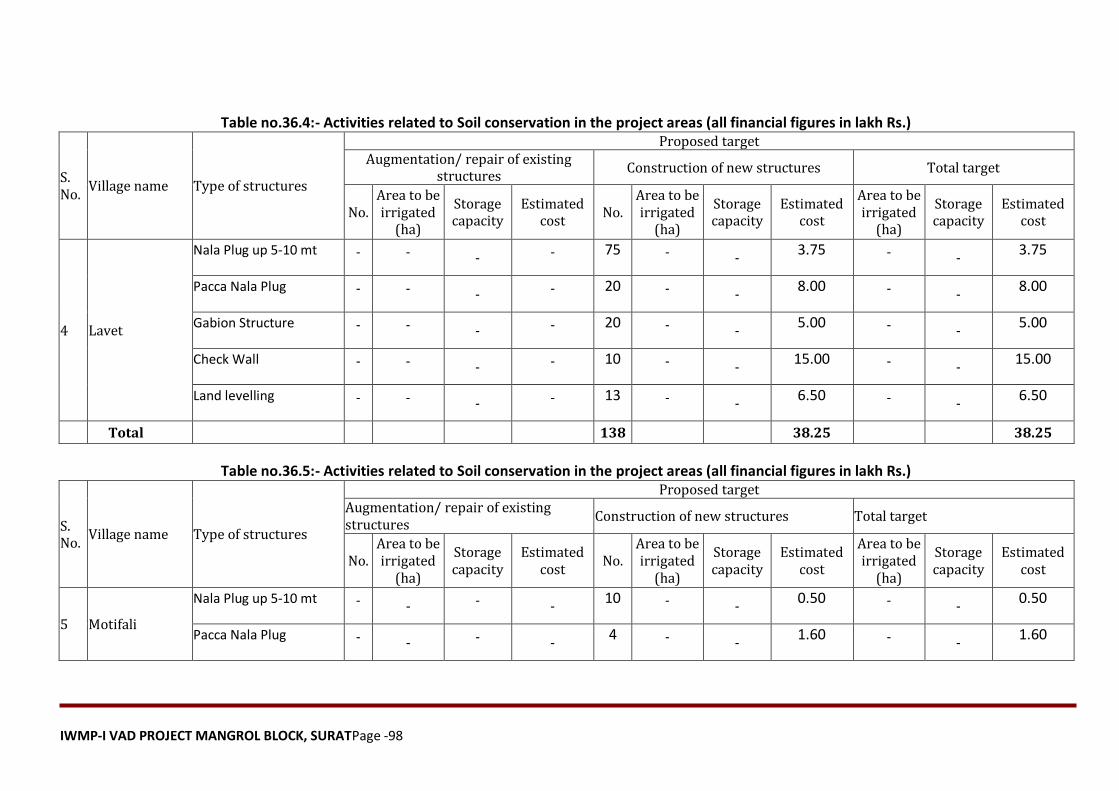
IWMP-I VAD PROJECT MANGROL BLOCK, SURATPage -98
Table no.36.4:- Activities related to Soil conservation in the project areas (all financial figures in lakh Rs.)
S. No.
Village name Type of structures
Proposed target Augmentation/ repair of existing
structures Construction of new structures Total target
No. Area to be irrigated
(ha)
Storage capacity
Estimated cost
No. Area to be irrigated
(ha)
Storage capacity
Estimated cost
Area to be irrigated
(ha)
Storage capacity
Estimated cost
4 Lavet
Nala Plug up 5-10 mt - - - - 75 - - 3.75 - -
3.75
Pacca Nala Plug - - - - 20 - - 8.00 - -
8.00
Gabion Structure - - - - 20 - - 5.00 - -
5.00
Check Wall - - - - 10 - - 15.00 - -
15.00
Land levelling - - - - 13 - - 6.50 - -
6.50
Total 138 38.25 38.25
Table no.36.5:- Activities related to Soil conservation in the project areas (all financial figures in lakh Rs.)
S. No.
Village name Type of structures
Proposed target Augmentation/ repair of existing structures
Construction of new structures Total target
No. Area to be irrigated
(ha)
Storage capacity
Estimated cost
No. Area to be irrigated
(ha)
Storage capacity
Estimated cost
Area to be irrigated
(ha)
Storage capacity
Estimated cost
5 Motifali
Nala Plug up 5-10 mt - - - - 10 - -
0.50 - - 0.50
Pacca Nala Plug - - - - 4 - -
1.60 - - 1.60
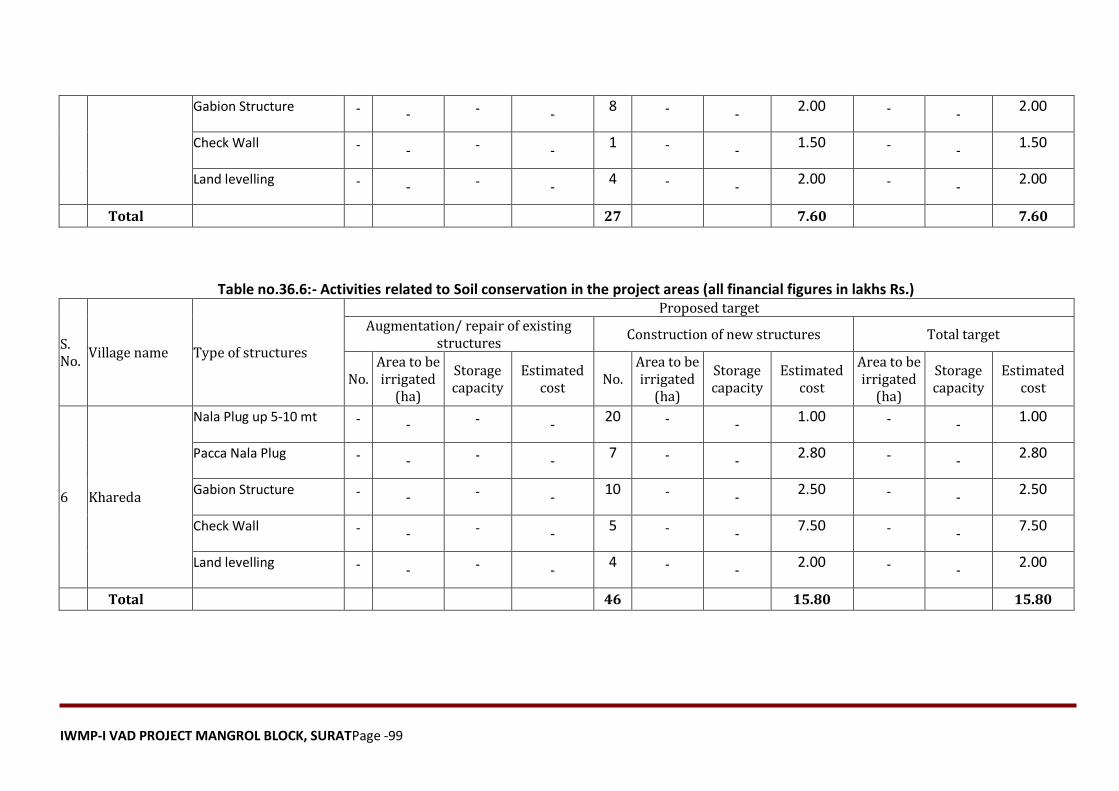
IWMP-I VAD PROJECT MANGROL BLOCK, SURATPage -99
Gabion Structure - - - - 8 - -
2.00 - - 2.00
Check Wall - - - - 1 - -
1.50 - - 1.50
Land levelling - - - - 4 - -
2.00 - - 2.00
Total 27 7.60 7.60
Table no.36.6:- Activities related to Soil conservation in the project areas (all financial figures in lakhs Rs.)
S. No.
Village name Type of structures
Proposed target Augmentation/ repair of existing
structures Construction of new structures Total target
No. Area to be irrigated
(ha)
Storage capacity
Estimated cost
No. Area to be irrigated
(ha)
Storage capacity
Estimated cost
Area to be irrigated
(ha)
Storage capacity
Estimated cost
6 Khareda
Nala Plug up 5-10 mt - - - - 20 - -
1.00 - - 1.00
Pacca Nala Plug - - - - 7 - -
2.80 - - 2.80
Gabion Structure - - - - 10 - -
2.50 - - 2.50
Check Wall - - - - 5 - -
7.50 - - 7.50
Land levelling - - - - 4 - -
2.00 - - 2.00
Total 46 15.80 15.80
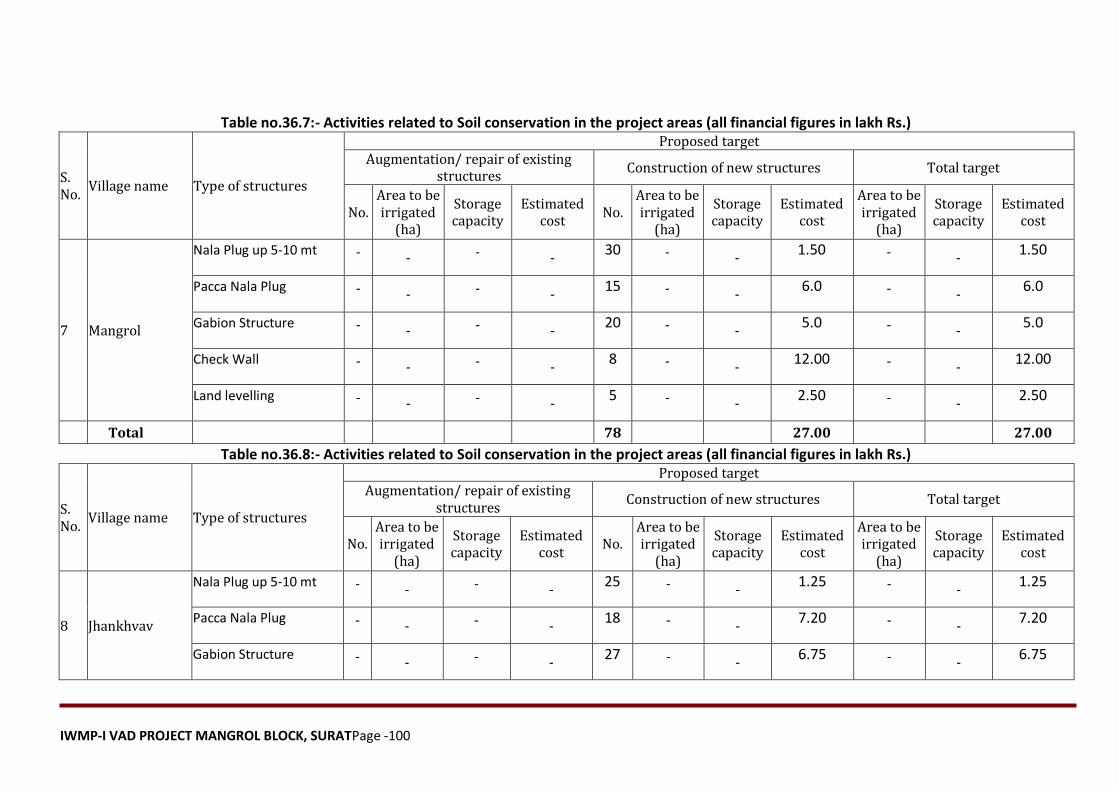
IWMP-I VAD PROJECT MANGROL BLOCK, SURATPage -100
Table no.36.7:- Activities related to Soil conservation in the project areas (all financial figures in lakh Rs.)
S. No.
Village name Type of structures
Proposed target Augmentation/ repair of existing
structures Construction of new structures Total target
No. Area to be irrigated
(ha)
Storage capacity
Estimated cost
No. Area to be irrigated
(ha)
Storage capacity
Estimated cost
Area to be irrigated
(ha)
Storage capacity
Estimated cost
7 Mangrol
Nala Plug up 5-10 mt - - - - 30 - -
1.50 - - 1.50
Pacca Nala Plug - - - - 15 - -
6.0 - - 6.0
Gabion Structure - - - - 20 - -
5.0 - - 5.0
Check Wall - - - - 8 - -
12.00 - - 12.00
Land levelling - - - - 5 - -
2.50 - - 2.50
Total 78 27.00 27.00
Table no.36.8:- Activities related to Soil conservation in the project areas (all financial figures in lakh Rs.)
S. No.
Village name Type of structures
Proposed target Augmentation/ repair of existing
structures Construction of new structures Total target
No. Area to be irrigated
(ha)
Storage capacity
Estimated cost
No. Area to be irrigated
(ha)
Storage capacity
Estimated cost
Area to be irrigated
(ha)
Storage capacity
Estimated cost
8 Jhankhvav
Nala Plug up 5-10 mt - - - - 25 - -
1.25 - - 1.25
Pacca Nala Plug - - - - 18 - -
7.20 - - 7.20
Gabion Structure - - - - 27 - -
6.75 - - 6.75
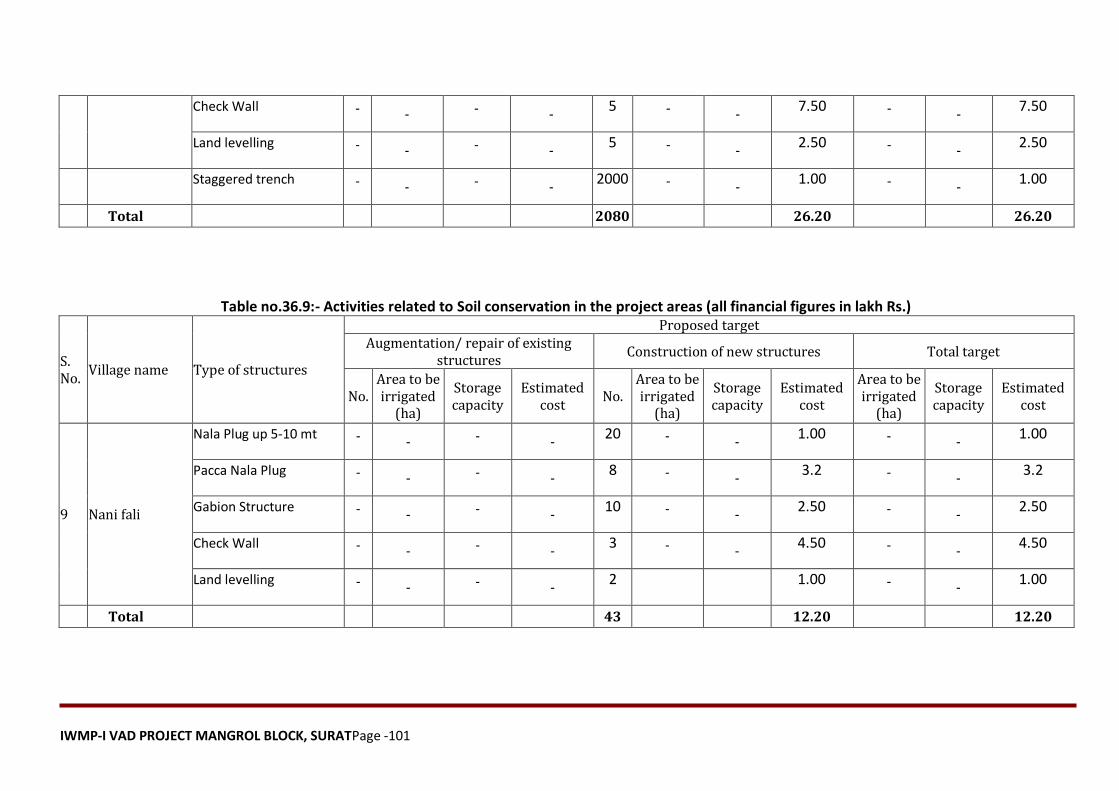
IWMP-I VAD PROJECT MANGROL BLOCK, SURATPage -101
Check Wall - - - - 5 - -
7.50 - - 7.50
Land levelling - - - - 5 - -
2.50 - - 2.50
Staggered trench - - - -
2000 - - 1.00 - -
1.00
Total 2080 26.20 26.20
Table no.36.9:- Activities related to Soil conservation in the project areas (all financial figures in lakh Rs.)
S. No.
Village name Type of structures
Proposed target Augmentation/ repair of existing
structures Construction of new structures Total target
No. Area to be irrigated
(ha)
Storage capacity
Estimated cost
No. Area to be irrigated
(ha)
Storage capacity
Estimated cost
Area to be irrigated
(ha)
Storage capacity
Estimated cost
9 Nani fali
Nala Plug up 5-10 mt - - - - 20 - -
1.00 - - 1.00
Pacca Nala Plug - - - - 8 - -
3.2 - - 3.2
Gabion Structure - - - - 10 - -
2.50 - - 2.50
Check Wall - - - - 3 - -
4.50 - - 4.50
Land levelling - - - - 2
1.00 - - 1.00
Total 43 12.20 12.20
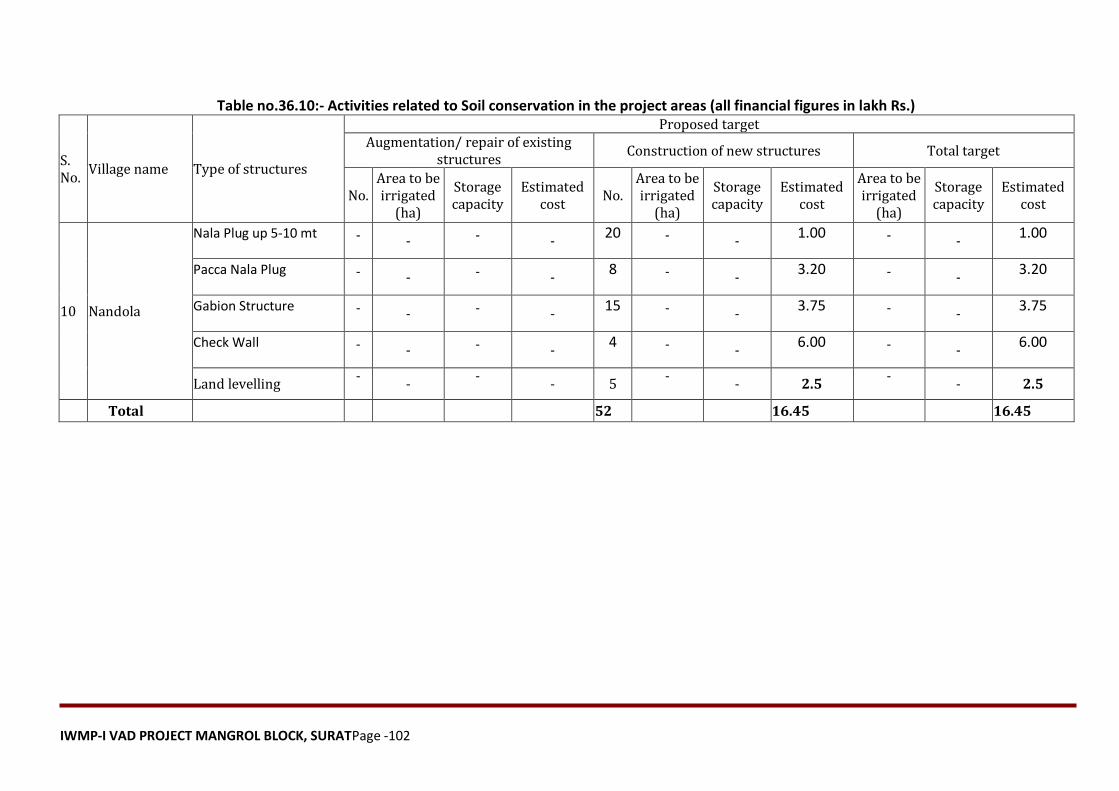
IWMP-I VAD PROJECT MANGROL BLOCK, SURATPage -102
Table no.36.10:- Activities related to Soil conservation in the project areas (all financial figures in lakh Rs.)
S. No.
Village name Type of structures
Proposed target Augmentation/ repair of existing
structures Construction of new structures Total target
No. Area to be irrigated
(ha)
Storage capacity
Estimated cost
No. Area to be irrigated
(ha)
Storage capacity
Estimated cost
Area to be irrigated
(ha)
Storage capacity
Estimated cost
10 Nandola
Nala Plug up 5-10 mt - - - - 20 - -
1.00 - - 1.00
Pacca Nala Plug - - - - 8 - -
3.20 - - 3.20
Gabion Structure - - - - 15 - -
3.75 - - 3.75
Check Wall - - - - 4 - -
6.00 - - 6.00
Land levelling -
- -
- 5 -
- 2.5 -
- 2.5
Total 52 16.45 16.45
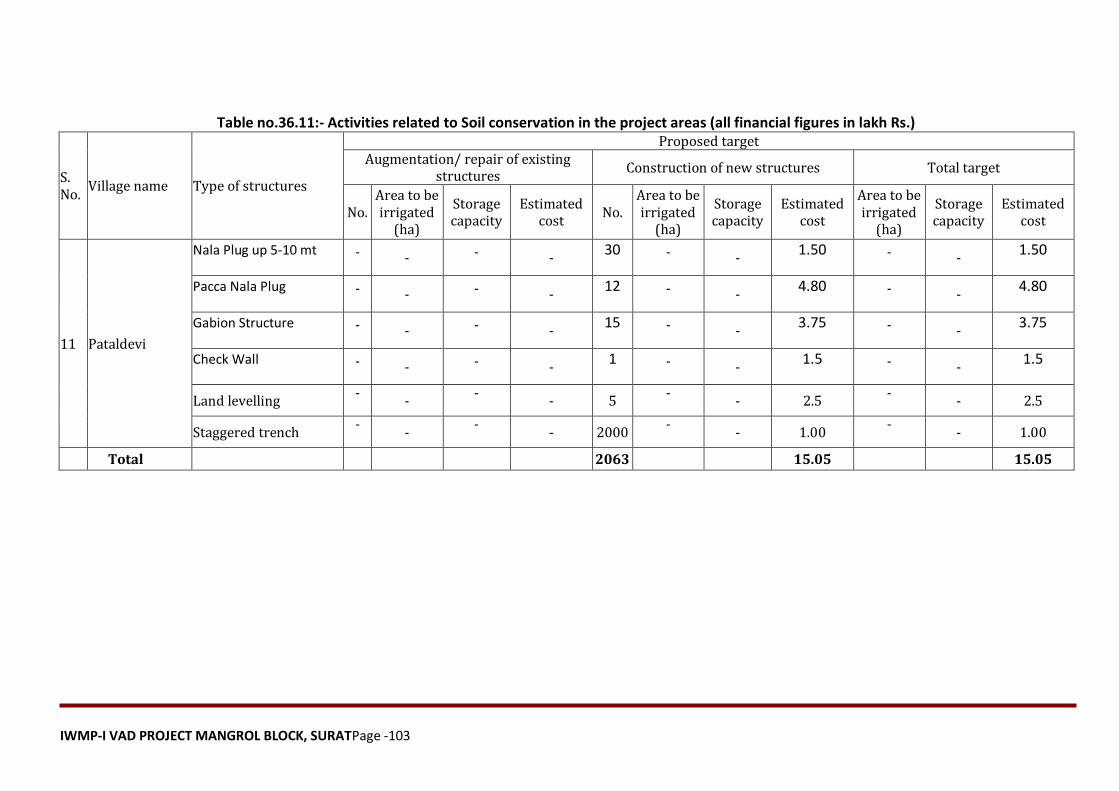
IWMP-I VAD PROJECT MANGROL BLOCK, SURATPage -103
Table no.36.11:- Activities related to Soil conservation in the project areas (all financial figures in lakh Rs.)
S. No.
Village name Type of structures
Proposed target Augmentation/ repair of existing
structures Construction of new structures Total target
No. Area to be irrigated
(ha)
Storage capacity
Estimated cost
No. Area to be irrigated
(ha)
Storage capacity
Estimated cost
Area to be irrigated
(ha)
Storage capacity
Estimated cost
11 Pataldevi
Nala Plug up 5-10 mt - - - - 30 - -
1.50 - - 1.50
Pacca Nala Plug - - - - 12 - -
4.80 - - 4.80
Gabion Structure - - - - 15 - -
3.75 - - 3.75
Check Wall - - - - 1 - -
1.5 - - 1.5
Land levelling -
- -
- 5 -
- 2.5 -
- 2.5
Staggered trench -
- -
- 2000 -
- 1.00 -
- 1.00
Total 2063 15.05 15.05
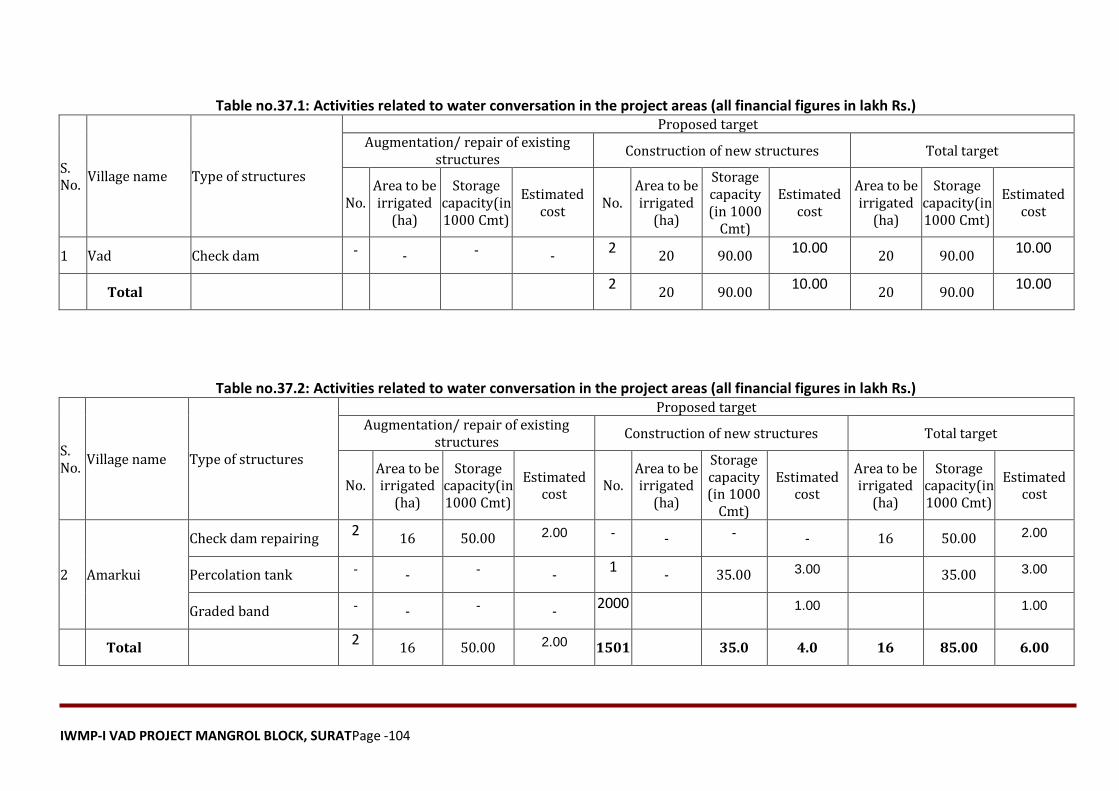
IWMP-I VAD PROJECT MANGROL BLOCK, SURATPage -104
Table no.37.1: Activities related to water conversation in the project areas (all financial figures in lakh Rs.)
S. No.
Village name Type of structures
Proposed target Augmentation/ repair of existing
structures Construction of new structures Total target
No. Area to be irrigated
(ha)
Storage capacity(in 1000 Cmt)
Estimated cost
No. Area to be irrigated
(ha)
Storage capacity (in 1000
Cmt)
Estimated cost
Area to be irrigated
(ha)
Storage capacity(in 1000 Cmt)
Estimated cost
1 Vad Check dam - - - - 2
20 90.00 10.00
20 90.00 10.00
Total 2
20 90.00 10.00
20 90.00 10.00
Table no.37.2: Activities related to water conversation in the project areas (all financial figures in lakh Rs.)
S. No.
Village name Type of structures
Proposed target Augmentation/ repair of existing
structures Construction of new structures Total target
No. Area to be irrigated
(ha)
Storage capacity(in 1000 Cmt)
Estimated cost
No. Area to be irrigated
(ha)
Storage capacity (in 1000
Cmt)
Estimated cost
Area to be irrigated
(ha)
Storage capacity(in 1000 Cmt)
Estimated cost
2 Amarkui
Check dam repairing 2
16 50.00 2.00 - - - - 16 50.00 2.00
Percolation tank - - - - 1
- 35.00 3.00 35.00 3.00
Graded band - - - - 2000
1.00 1.00
Total 2
16 50.00 2.00 1501 35.0 4.0 16 85.00 6.00
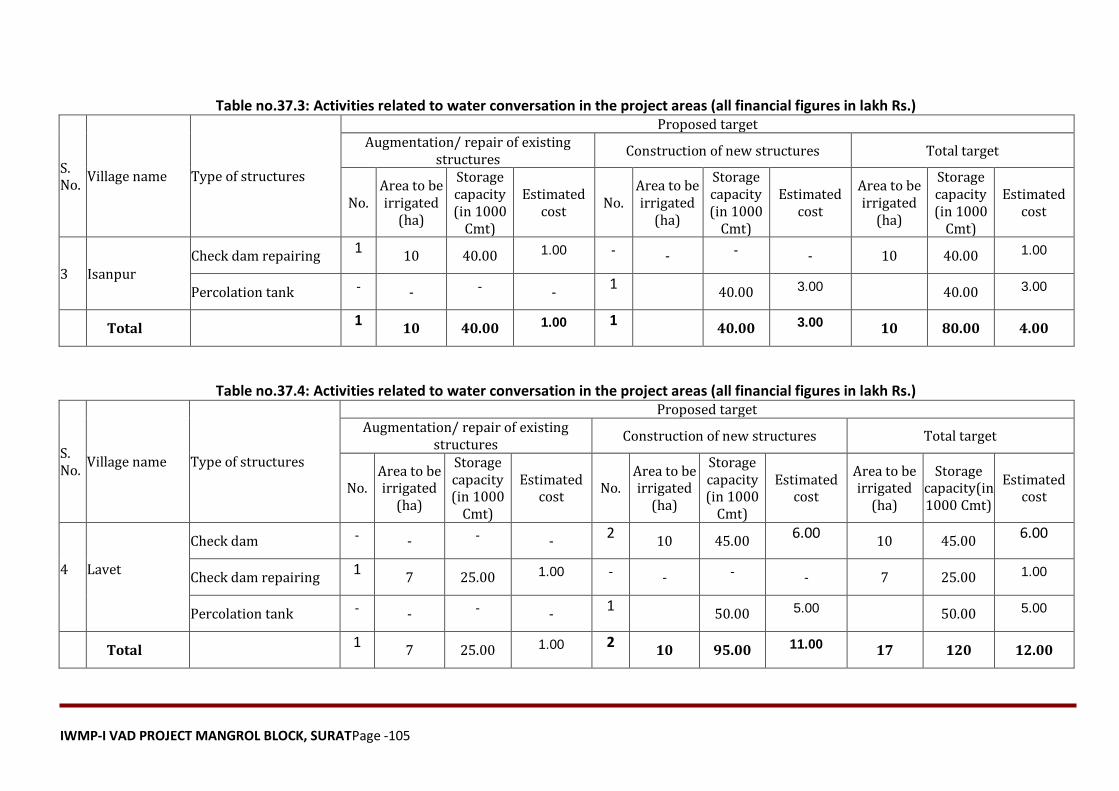
IWMP-I VAD PROJECT MANGROL BLOCK, SURATPage -105
Table no.37.3: Activities related to water conversation in the project areas (all financial figures in lakh Rs.)
S. No.
Village name Type of structures
Proposed target Augmentation/ repair of existing
structures Construction of new structures Total target
No. Area to be irrigated
(ha)
Storage capacity (in 1000
Cmt)
Estimated cost
No. Area to be irrigated
(ha)
Storage capacity (in 1000
Cmt)
Estimated cost
Area to be irrigated
(ha)
Storage capacity (in 1000
Cmt)
Estimated cost
3 Isanpur Check dam repairing
1 10 40.00 1.00 - - - - 10 40.00 1.00
Percolation tank - - - - 1
40.00 3.00 40.00 3.00
Total 1
10 40.00 1.00 1 40.00 3.00 10 80.00 4.00
Table no.37.4: Activities related to water conversation in the project areas (all financial figures in lakh Rs.)
S. No.
Village name Type of structures
Proposed target Augmentation/ repair of existing
structures Construction of new structures Total target
No. Area to be irrigated
(ha)
Storage capacity (in 1000
Cmt)
Estimated cost
No. Area to be irrigated
(ha)
Storage capacity (in 1000
Cmt)
Estimated cost
Area to be irrigated
(ha)
Storage capacity(in 1000 Cmt)
Estimated cost
4 Lavet
Check dam - - - - 2
10 45.00 6.00
10 45.00 6.00
Check dam repairing 1
7 25.00 1.00 - - - - 7 25.00 1.00
Percolation tank - - - - 1
50.00 5.00 50.00 5.00
Total 1
7 25.00 1.00 2 10 95.00 11.00 17 120 12.00
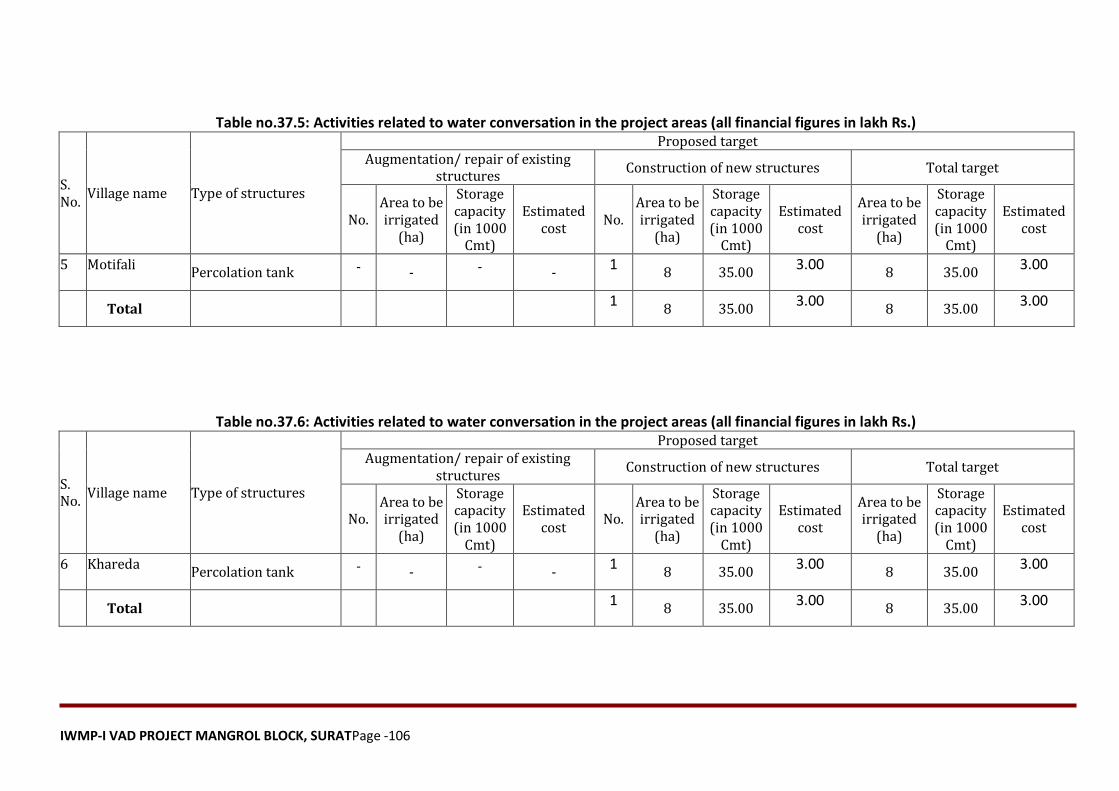
IWMP-I VAD PROJECT MANGROL BLOCK, SURATPage -106
Table no.37.5: Activities related to water conversation in the project areas (all financial figures in lakh Rs.)
S. No.
Village name Type of structures
Proposed target Augmentation/ repair of existing
structures Construction of new structures Total target
No. Area to be irrigated
(ha)
Storage capacity (in 1000
Cmt)
Estimated cost
No. Area to be irrigated
(ha)
Storage capacity (in 1000
Cmt)
Estimated cost
Area to be irrigated
(ha)
Storage capacity (in 1000
Cmt)
Estimated cost
5 Motifali Percolation tank - - - -
1 8 35.00
3.00 8 35.00
3.00
Total
1 8 35.00
3.00 8 35.00
3.00
Table no.37.6: Activities related to water conversation in the project areas (all financial figures in lakh Rs.)
S. No.
Village name Type of structures
Proposed target Augmentation/ repair of existing
structures Construction of new structures Total target
No. Area to be irrigated
(ha)
Storage capacity (in 1000
Cmt)
Estimated cost
No. Area to be irrigated
(ha)
Storage capacity (in 1000
Cmt)
Estimated cost
Area to be irrigated
(ha)
Storage capacity (in 1000
Cmt)
Estimated cost
6 Khareda Percolation tank - - - -
1 8 35.00
3.00 8 35.00
3.00
Total
1 8 35.00
3.00 8 35.00
3.00
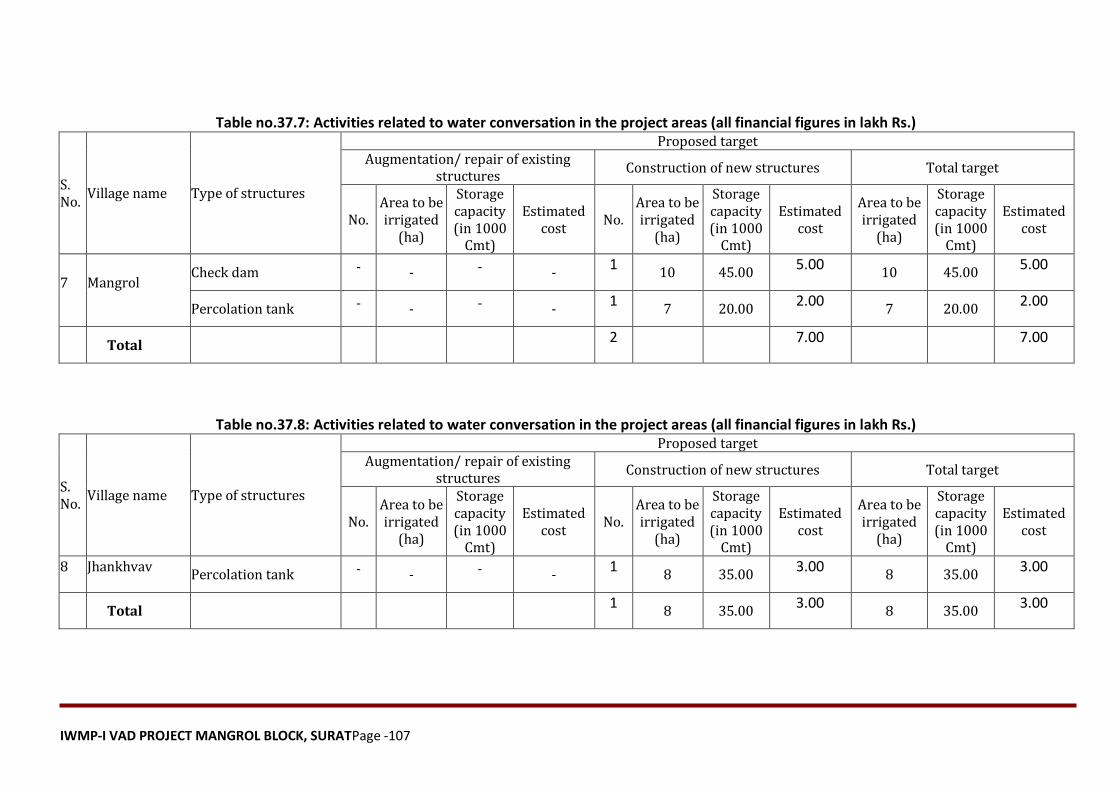
IWMP-I VAD PROJECT MANGROL BLOCK, SURATPage -107
Table no.37.7: Activities related to water conversation in the project areas (all financial figures in lakh Rs.)
S. No.
Village name Type of structures
Proposed target Augmentation/ repair of existing
structures Construction of new structures Total target
No. Area to be irrigated
(ha)
Storage capacity (in 1000
Cmt)
Estimated cost
No. Area to be irrigated
(ha)
Storage capacity (in 1000
Cmt)
Estimated cost
Area to be irrigated
(ha)
Storage capacity (in 1000
Cmt)
Estimated cost
7 Mangrol Check dam - - - -
1 10 45.00
5.00 10 45.00
5.00
Percolation tank - - - - 1
7 20.00 2.00
7 20.00 2.00
Total
2
7.00
7.00
Table no.37.8: Activities related to water conversation in the project areas (all financial figures in lakh Rs.)
S. No.
Village name Type of structures
Proposed target Augmentation/ repair of existing
structures Construction of new structures Total target
No. Area to be irrigated
(ha)
Storage capacity (in 1000
Cmt)
Estimated cost
No. Area to be irrigated
(ha)
Storage capacity (in 1000
Cmt)
Estimated cost
Area to be irrigated
(ha)
Storage capacity (in 1000
Cmt)
Estimated cost
8 Jhankhvav Percolation tank - - - -
1 8 35.00
3.00 8 35.00
3.00
Total
1 8 35.00
3.00 8 35.00
3.00
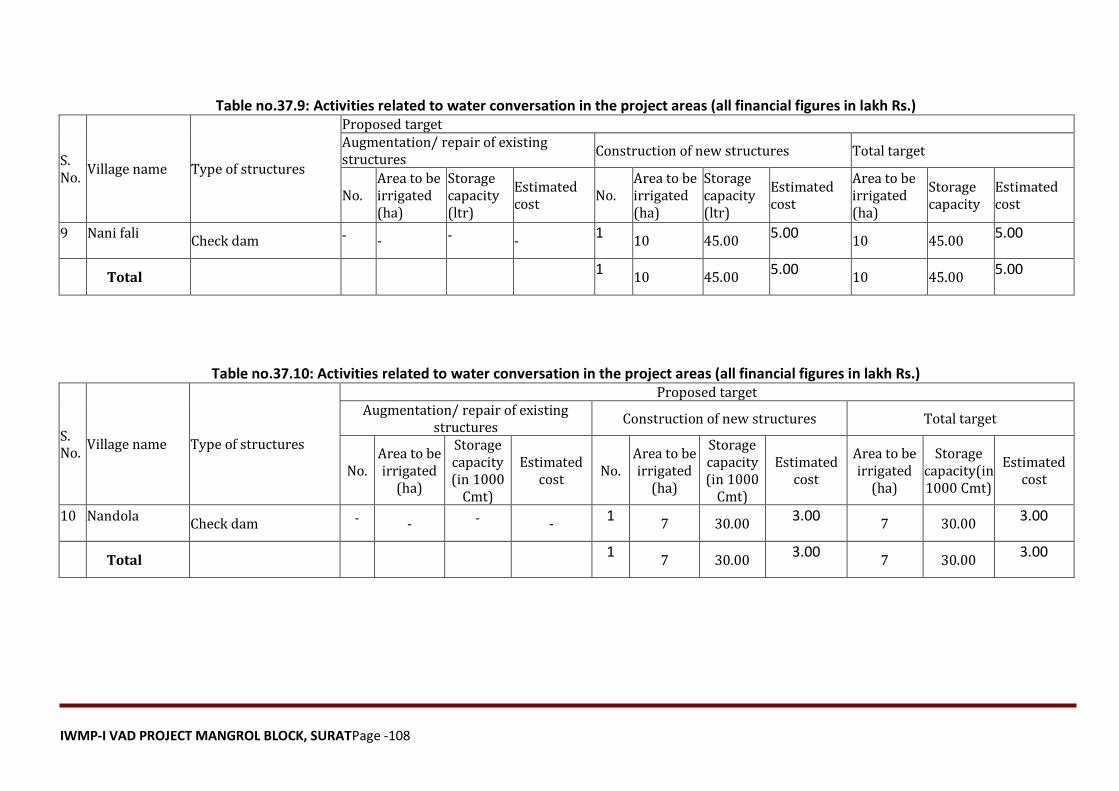
IWMP-I VAD PROJECT MANGROL BLOCK, SURATPage -108
Table no.37.9: Activities related to water conversation in the project areas (all financial figures in lakh Rs.)
S. No.
Village name Type of structures
Proposed target Augmentation/ repair of existing structures
Construction of new structures Total target
No. Area to be irrigated (ha)
Storage capacity (ltr)
Estimated cost
No. Area to be irrigated (ha)
Storage capacity (ltr)
Estimated cost
Area to be irrigated (ha)
Storage capacity
Estimated cost
9 Nani fali Check dam - - - -
1 10 45.00
5.00 10 45.00
5.00
Total
1 10 45.00
5.00 10 45.00
5.00
Table no.37.10: Activities related to water conversation in the project areas (all financial figures in lakh Rs.)
S. No.
Village name Type of structures
Proposed target Augmentation/ repair of existing
structures Construction of new structures Total target
No. Area to be irrigated
(ha)
Storage capacity (in 1000
Cmt)
Estimated cost
No. Area to be irrigated
(ha)
Storage capacity (in 1000
Cmt)
Estimated cost
Area to be irrigated
(ha)
Storage capacity(in 1000 Cmt)
Estimated cost
10 Nandola Check dam - - - -
1 7 30.00
3.00 7 30.00
3.00
Total
1 7 30.00
3.00 7 30.00
3.00
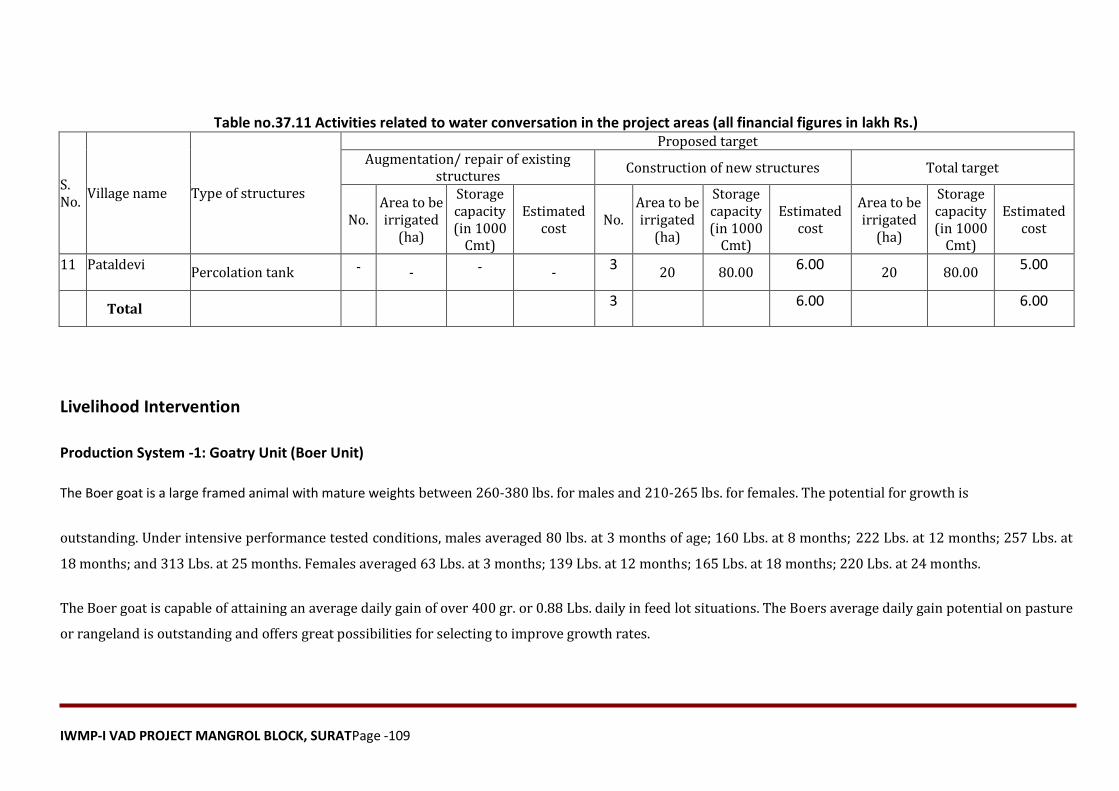
IWMP-I VAD PROJECT MANGROL BLOCK, SURATPage -109
Table no.37.11 Activities related to water conversation in the project areas (all financial figures in lakh Rs.)
S. No.
Village name Type of structures
Proposed target Augmentation/ repair of existing
structures Construction of new structures Total target
No. Area to be irrigated
(ha)
Storage capacity (in 1000
Cmt)
Estimated cost
No. Area to be irrigated
(ha)
Storage capacity (in 1000
Cmt)
Estimated cost
Area to be irrigated
(ha)
Storage capacity (in 1000
Cmt)
Estimated cost
11 Pataldevi Percolation tank - - - -
3 20 80.00
6.00 20 80.00
5.00
Total
3
6.00
6.00
Livelihood Intervention
Production System -1: Goatry Unit (Boer Unit)
The Boer goat is a large framed animal with mature weights between 260-380 lbs. for males and 210-265 lbs. for females. The potential for growth is
outstanding. Under intensive performance tested conditions, males averaged 80 lbs. at 3 months of age; 160 Lbs. at 8 months; 222 Lbs. at 12 months; 257 Lbs. at
18 months; and 313 Lbs. at 25 months. Females averaged 63 Lbs. at 3 months; 139 Lbs. at 12 months; 165 Lbs. at 18 months; 220 Lbs. at 24 months.
The Boer goat is capable of attaining an average daily gain of over 400 gr. or 0.88 Lbs. daily in feed lot situations. The Boers average daily gain potential on pasture
or rangeland is outstanding and offers great possibilities for selecting to improve growth rates.
IWMP-I VAD PROJECT MANGROL BLOCK, SURATPage -110
The Boer goats dressing weight percentage is over 50%. Comparead to South African sheep, the Boer goat had the higher dressing percentage with carcasses
having more total tissue in the fore arm, neck and ventral trunk, and less tissue in the hind limb.
Boer goats seem to yield a carcass superior to Angora, dairy and over meat goats and that fat content and muscling of Boer goat carcasses compared favourably
with those of specialized mutton producing breeds.
Thus, it is not surprising that with their excellent growth and carcass qualities many well known goat specialists listed the Boer goat as one breed that could make
a major contribution to increasing productivity of meat goats worldwide.
A good meat goat should also be fecund and prolific. More kids born per doe will result in greater profit margins for the producer. The ovulation rate for Boer
goats ranges from 1 to 4 eggs per doe with a mean of 1.7 (plus or minus .9). A normal kidding rate of 200% is common for the Boer goat. This is higher than most
other goat breeds, thus the Boer goat can be considered a prolific breed. This conclusion was also reached in New Zealand and Australia, based on the number of
super ovulated embryos (9) harvested from the Boer goat donor program.
The Boer goat reaches puberty early, usually about 6 months of age for males and 10-12 months for first-mating females. The Boer goat has an extended breeding
season and it is possible to achieve 3 kidding every 2 years.
Boer goats give good milk, which enables them to successfully raise their multiple offspring with excellent weight gains and with little pre-weaning mortality.
A South African study indicated that lactation length was 120-140 days for Boer goats and their yield was about half that of South African, which had a
lactation length of 278 days. Boer goats had a higher butterfat (5.6%), total solids (15.7%), and lactose (61) than any other goat breeds in South Africa. It has
been postulated that for the Boer goat to attain its high pre-weaning average daily gain, the doe must produce up to 5.5 Lbs./day. Actual milk production of
Boer goat does under extensive management systems is actually less, ranging from 3.3 to 5.5 Lbs./day, depending on age of doe and lactation number. These
milk yields are not impressive by dairy goat standards but for a goat that has not been selected for milk yield, it is considered excellent. This demonstrates the
superior maternal capabilities and the ability to rear multiple young of the Boer goat doe.
IWMP-I VAD PROJECT MANGROL BLOCK, SURATPage -111
Production System - 2: Vermi composting unit for Project villages
Introduction:
The wide spread problems of soil degradation and desertification are threatening agricultural sustainability. Throughout the project village large
populations of domestic animals producing large amounts of organic wastes. These organic residues, or ‘waste materials’, can be transformed more quickly
and into a more useful vermi-compost, available for urban and land application. Nutrients within vermi-composted material are readily available to plants,
and can be added to agricultural land to improve soil structure and fertility or used asgood quality and marketable additive to potting soil or plant growth
media. The process of composting crop residues using earthworms comprise spreading the agricultural wastes and cow dung in layers as 1 m wide and 0.3
m high beds of required length. Earthworms are introduced in between the layers @ 350 worms per m3 of bed volume. The beds are maintained at about
40 - 50% moisture content and a temperature of 20 - 30° C by sprinkling water over the beds. The earthworms being voracious eaters consume the
biodegradable matter and give out a part of the matter as excreta or vermi-castings. The vermi-casting containing nutrients are rich manure for the plants.
Objectives
• To train farmers / SHGs in organic farming and vermi-culture.
• To promote production of vermi-castings as a viable small business venture
IWMP-I VAD PROJECT MANGROL BLOCK, SURATPage -112
About The Worms
Eisenia fetida, Eudrilus eugeniae, and Perionyx excavatius are some of the species for rearing to convert organic wastes into manure. The worms feed on any
biodegradable matter ranging from coir waste to kitchen garbage and Vermi-composting units are ideally suited to locations / units with generation of
considerable quantities of organic wastes. One earthworm reaching reproductive age of about six weeks lays one egg capsule (containing 7 embryos) every
7 - 10 days. Three to seven worms emerge out of each capsule. Thus, the multiplication of worms under optimum growth conditions is very fast. The worms
live for about 2 years. Fully grown worms could be separated and dried in an oven to make 'worm meal' which is a rich source of protein (70%) for use in
animal feed.
Location
All villages of Vad project have lots of animal so it can become good composting center as well as good source of livelihood. Vermicompost isvery suitable
for fruit, flower and vegetable as well as cereal crops. It increases quality and quantity of product in per unit area.
Market/Use
Vermi compost is a valuable input for sustainable agriculture and wasteland development. This also can be used widely in pot culture and in home gardens.
Several farmers are successfully using vermi-comost.Vermi compost has more nutrient compare to other manures and fertilizer so by the use of compost we
can reduce the use of chemical fertilizer. Vermi compost not only supply nutrient but also improve quantity of hormones for plant growth, improves the soil
structure leading to increase in water and nutrient holding capacities of soil.
IWMP-I VAD PROJECT MANGROL BLOCK, SURATPage -113
Components of A Commercial Unit
Sheds
Shed is necessary as the temperature in summer is high. We can make it by the use of concrete pillars because this will act as a source of income for those in
the village who produce pillars. It will prevent wetting of beds due to rain on a windy day.While designing the sheds adequate room has to be left around the beds
for easy movement of the labour attending to filland harvest the beds.
Vermi-beds
Scientific bed size proposed here is 10ft by 3 ft by 2.5 ft. The whole bed area should be above the ground. The bed should have a uniform height over the entire
width to the extent possible to avoid low production owing to low bed volumes. The proper bed width should not be more than4.5 ft to allow easy access to the
centre of the bed.
Land
About 500 square ft of land is required to set up a vermi compost production unit in each village. It should have at least one super structure to cover the 10
beds. It should have an arrangement for watering and other equipments as required because moisture is very essential for compost production. Land can
be taken from Gram panchayat on lease of at least 10-15 years.
Seed Stock
This is very important thing because worms multiply at the rate of 350 worms per m3 of bed space over a period of 6 month to ayear.
IWMP-I VAD PROJECT MANGROL BLOCK, SURATPage -114
Fencing
The entire area has to be fenced to prevent the stray animals and other unwanted elements. These could be estimated based on the length
of the periphery of the farm.
Water Supply System
We have to maintain always 50% moisture content, there is need to plan for a water source, lifting mechanism and a system of conveying and applying the
water to vermi-beds. Drippers with round the clock flow arrangement would be quite handy for continuous supply and saving on water. Such a water
supply/application system requiring considerable initial investment, however, reduces the operational costs on hand watering and proves economical in
the long run. The cost of these items depends on the capacity of the unit and the type of water supply chosen.
Machinery
Farm machinery and implements are required for cutting the raw material in small pieces, conveying shredded raw material to the vermi-sheds, loading,
unloading, collection of compost, loosening of beds for aeration, shifting of the compost. Costs of providing necessary implements and the machinery have
to be included in the project cost.
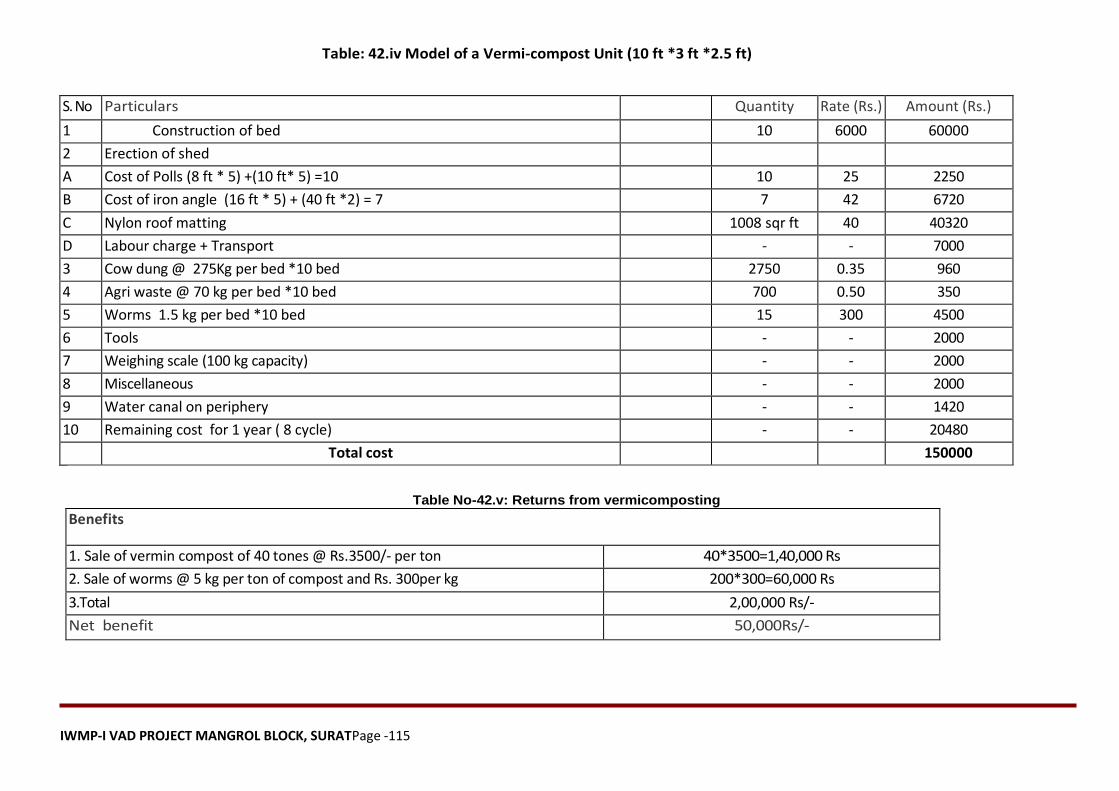
IWMP-I VAD PROJECT MANGROL BLOCK, SURATPage -115
S. No
Particulars
Quantity
Rate (Rs.)
Amount (Rs.)
1 Construction of bed 10 6000 60000
2 Erection of shed
A Cost of Polls (8 ft * 5) +(10 ft* 5) =10 10 25 2250
B Cost of iron angle (16 ft * 5) + (40 ft *2) = 7 7 42 6720
C Nylon roof matting 1008 sqr ft 40 40320
D Labour charge + Transport - - 7000
3 Cow dung @ 275Kg per bed *10 bed 2750 0.35 960
4 Agri waste @ 70 kg per bed *10 bed 700 0.50 350
5 Worms 1.5 kg per bed *10 bed 15 300 4500
6 Tools - - 2000
7 Weighing scale (100 kg capacity)
- - 2000
8 Miscellaneous
- - 2000
9 Water canal on periphery - - 1420
10 Remaining cost for 1 year ( 8 cycle) - - 20480
Total cost 150000
Table No-42.v: Returns from vermicomposting
Benefits
1. Sale of vermin compost of 40 tones @ Rs.3500/- per ton
40*3500=1,40,000 Rs
2. Sale of worms @ 5 kg per ton of compost and Rs. 300per kg
200*300=60,000 Rs
3.Total
2,00,000 Rs/-
Net benefit
50,000Rs/-
Table: 42.iv Model of a Vermi-compost Unit (10 ft *3 ft *2.5 ft)
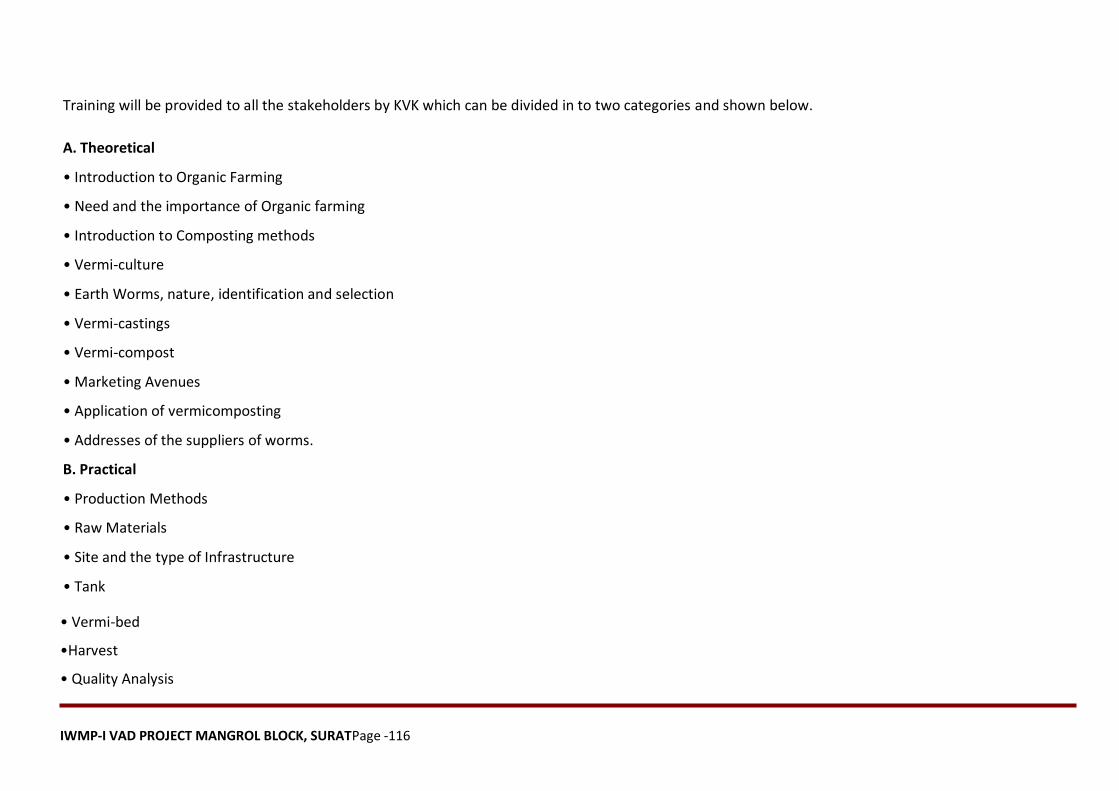
IWMP-I VAD PROJECT MANGROL BLOCK, SURATPage -116
Training will be provided to all the stakeholders by KVK which can be divided in to two categories and shown below.
A. Theoretical
• Introduction to Organic Farming
• Need and the importance of Organic farming
• Introduction to Composting methods
• Vermi-culture
• Earth Worms, nature, identification and selection
• Vermi-castings
• Vermi-compost
• Marketing Avenues
• Application of vermicomposting
• Addresses of the suppliers of worms.
B. Practical
• Production Methods
• Raw Materials
• Site and the type of Infrastructure
• Tank
• Vermi-bed
•Harvest
• Quality Analysis
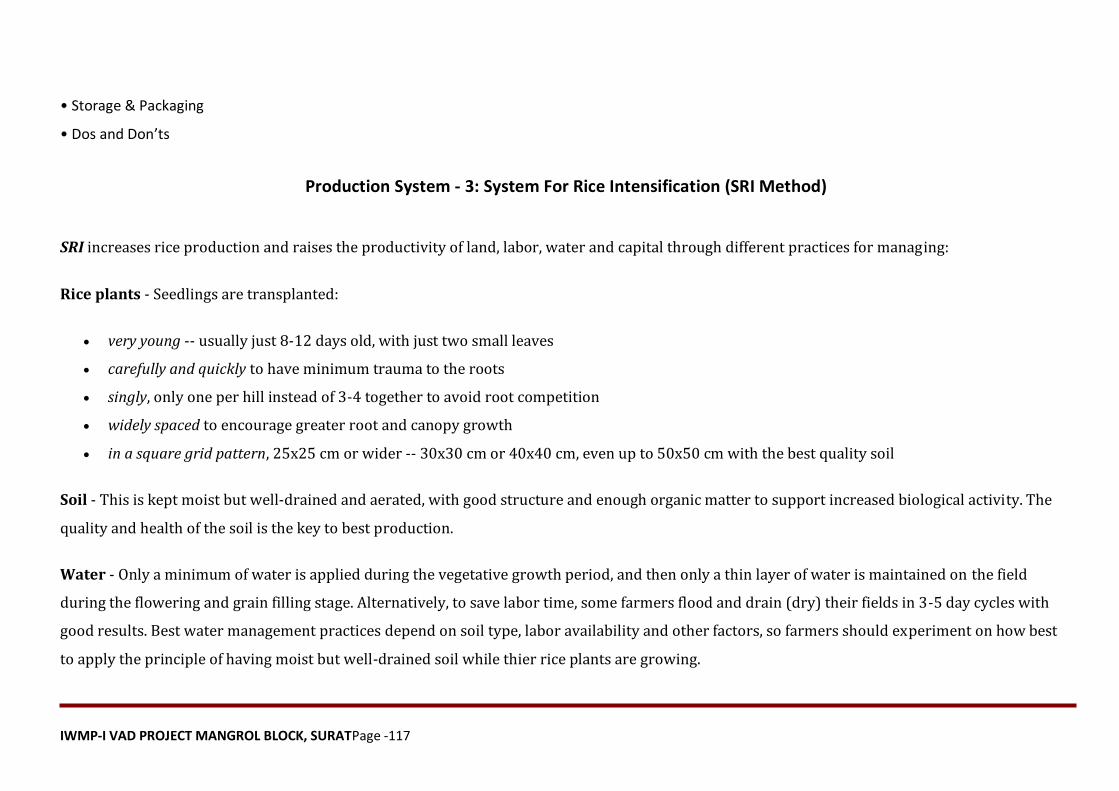
IWMP-I VAD PROJECT MANGROL BLOCK, SURATPage -117
• Storage & Packaging
• Dos and Don’ts
Production System - 3: System For Rice Intensification (SRI Method)
SRI increases rice production and raises the productivity of land, labor, water and capital through different practices for managing:
Rice plants - Seedlings are transplanted:
very young -- usually just 8-12 days old, with just two small leaves
carefully and quickly to have minimum trauma to the roots
singly, only one per hill instead of 3-4 together to avoid root competition
widely spaced to encourage greater root and canopy growth
in a square grid pattern, 25x25 cm or wider -- 30x30 cm or 40x40 cm, even up to 50x50 cm with the best quality soil
Soil - This is kept moist but well-drained and aerated, with good structure and enough organic matter to support increased biological activity. The
quality and health of the soil is the key to best production.
Water - Only a minimum of water is applied during the vegetative growth period, and then only a thin layer of water is maintained on the field
during the flowering and grain filling stage. Alternatively, to save labor time, some farmers flood and drain (dry) their fields in 3-5 day cycles with
good results. Best water management practices depend on soil type, labor availability and other factors, so farmers should experiment on how best
to apply the principle of having moist but well-drained soil while thier rice plants are growing.
IWMP-I VAD PROJECT MANGROL BLOCK, SURATPage -118
Nutrients - Soil nutrient supplies should be augmented, preferably with compost, made from any available biomass. Better quality compost such as
with manure can give additional yield advantages. Chemical fertilizer can be used and gives better results than with no nutrient amendments, but it
contributes less to good soil structure and active microbial communities in the rhizosphere than does organic matter. At least initially, nutrient
amendments may not be necessary to achieve higher yields with the other SRI practices, but it is desirable to build up soil fertility over time. Rice-
root exudation, greater with SRI, enhances soil fertility.
Weeds - Since weeds become a problem in fields that are not kept flooded, weeding is necessary at least once or twice, starting 10-12 days after
transplanting, and preferably 3 or 4 times before the canopy closes. Using a rotary hoe -- a simple, inexpensive, mechanical push-weeder has the
advantage of aerating the soil at the same time that weeds are eliminated. (They are left in the soil to decompose so their nutrients are not lost.)
Additional weedings beyond two increase yield more than enough under most conditions to justify the added labor costs.
SRI methods increase the productivity of:
water -- since yields can double or more with only half as much water, the productivity of water is greatly increased -- this is especially
important in countries or places where water is becoming scarcer;
land -- yields as indicated above can average about 8 t/ha once the methods are used correctly, and can be twice that or more when they are
used with precision and skill;
labor -- SRI does require more labor depending on the cost of labor, the value of increased production increases the returns to labor by at
least 50% and often several hundred percent. Once the methods have been mastered, the labor requirements for SRI decline. Also,
implements are being developed that save labor.
Environmental Benefits: SRI isenvironmentally-friendly. Reduced demand for water frees up water for other uses; soil that is not kept
saturated has greater biodiversity. Unflooded paddies do not produce methane, one of the major "greenhouse gases" that are contributing to
IWMP-I VAD PROJECT MANGROL BLOCK, SURATPage -119
global warming. There can be more nitrous oxide from unflooded paddies, which offsets to some extent the gains from reducing methane
emissions, but when nitrogen fertilizer is not used, this effect should be small. On balance, SRI should improve environmental conditions.
Equity Considerations: SRI also has the benefit of being particularly accessible for farmers who have small landholdings and need to get the highest
yields possible from their available land. Since poorer households have relatively more labor compared to land, SRI is one of the few agricultural
innovations that has a bias in favor of equity. It is true that very poor households may find it difficult to invest labor in SRI because they need to be
earning daily incomes, even if their returns to labor would be higher from SRI. However, since returns to land, labor and water are all higher with
SRI, any household that grows rice and is labor-constrained will do better by using SRI methods on just a part of its landholding, using its other land
for production of other crops when labor is available.
Active Role for Farmers: SRI methods are most productive when used with skill and care, so there will probably continue to be long-term advantage
for labor-intensive production with SRI. However, SRI should be seen as a set of principles that are applied through various techniques, rather than
as a fixed technology to be adopted as a "package." There is synergy among practices that makes their use together more beneficial than just using
certain of the practices; but any of the practices should give some improvement in yield. We anticipate that various kinds of mechanization will over
time make SRI suitable for larger scale production.
Farmers are encouraged to experiment with the methods and to evaluate the results for themselves, not just to "adopt" SRI. The best spacing between
plants, for example, needs to be determined in relation to particular soil, climatic, hydrological and other conditions. Exactly when and how to apply
water depends on soil characteristics and field position. So recommendations for spacing, water management, age of seedling, etc. are not offered as
universal. Instead, principles are presented -- to be understood, tested and adapted by users to suit their own conditions. It is hoped that what
farmers learn from using SRI may help them to become more innovative producers in other respects.
IWMP-I VAD PROJECT MANGROL BLOCK, SURATPage -120
Grain Quality: When SRI paddy is milled, the outturn if often proving to be higher, as there are fewer unfilled grains (less chaff) and fewer broken
grains (because they resist shattering). In Andhra Pradesh, India, the rice millers association is promoting SRI and paying a higher rice per bushel, as
outturn has gone from about 67% to about 75%. The sugar cooperative in Cuba that has pioneered the new production methods in that country
reports that its outturn has gone up from 60% before to 68-71% now with SRI. This adds about 15% more productivity on top of the higher yields of
paddy.
Faster Maturing: Farmers are finding that SRI methods often, though not always, reduce the time required for grain maturation. In Cambodia, on
average, SRI crops are ripening about 7 days sooner than regular crops of the same variety. In Andhra Pradesh, India, ripening is 7-10 days sooner.
(It has been alleged that SRI crops take longer to mature, but this is not the experience in the field.) In Nepal during monsoon season 2004, farmers
got more than a doubling of yield (3.37 to 7.85 t/ha) with a 15-day reduction in time to maturity. Being able to harvest sooner reduces farmers' risks
of damage from pests or from typhoons, cyclones or other extreme weather than can come the end of the season.
Health Benefits: By reducing the application of agrochemicals in rice production, the resulting grain has little or no chemical residues. No systematic
nutritional analyses have been done yet on SRI grains, but the larger root systems could enhance their micronutrient content, suggested by the
higher grain weight and greater resistance to shattering. Many things are still not known about SRI in technical terms. This page will be updated as
more information becomes available.
IWMP-I VAD PROJECT MANGROL BLOCK, SURATPage -121
Livelihood Intervention
Promotion of micro-enterprises and various income generation activities is an importantaspect of empowerment. Although it is extremely difficult to find
remunerative selfemployment,there are enormous untapped opportunities in the rural sector. These includeboth on-farm and off-farm opportunities.
Typically families living below poverty line, SC, ST and landless in a cluster of villages are motivated to take part in holistic development through livelihood
opportunities through multidisciplinary interventions.
Advantages of Agro-Based Activities: While promoting various income generationactivities, agro-based activities have advantages because of the following
reasons:
1. Target groups are acquainted with most of the basic skills.
2. Easy access to inputs.
3. No problems of marketing, as most of the outputs are locally consumed as food.
4. As over 50-60 % of the rural families own land and livestock, income generationactivities can be initiated immediately without heavy capital investment.
5. Risk of failure due to improper technology, poor quality, low demand and poor pricerecovery are very low. Hence, the chances of success are high.
6. Infrastructure required for promotion of on-farm activities has been very wellestablished. Hence, the entrepreneurs can progress even in backward
regions, whichare deprived of regular power supply and electronic information connectivity.It is therefore advantageous to tap all the opportunities to
promote various on-farm activities.The experience has confirmed that the best strategy to promote income generationactivities through SHGs is to analyze
the on-going agro-based activities undertaken by the members and introduce suitable interventions to enhance the production. There are alsoexcellent
opportunities to improve post production management of the produce throughgrading, storage, processing and marketing.
IWMP-I VAD PROJECT MANGROL BLOCK, SURATPage -122
Various micro-enterprises activities through UG and Self Help Groups will be promoted. The list of micro-enterprises taken up by various SHGs is presented
below. Among these activities, agriculture followed by animalhusbandry, Khadi making units and food processing. However, over a period of time,
agriculture, animalhusbandry and food processing supercede the trade as many individuals participate inenhancing their production at the family level and
try to organize themselves to market themcollectively. Other activities such as production of utility items, construction relatedactivities, handicrafts and
Moti work find it difficult to sustain due to poor marketinginfrastructure, lack market and competition from othersources.
Support Needed for Promotion of Micro-enterprises
Following support is needed to promote micro-enterprises through women SHGs.
1. Motivation of the target communities, particularly women and landless farmers
2. Formation of Self Help Groups and their Federations
3. Gender sensitization
4. Training and capacity building
5. Micro-finance. Provision of credit facilities and linkage with banks
6. Development of infrastructure, particularly through the SHG Federations to providenecessary support services and marketing
7. Trade networking and establishment of market outlets
8. Village level Information Centre: The multi-disciplinary team interacted with the SHGs and User groups to explore the potentials fordevelopment of
various enterprises and extend necessary support for dissemination oftechnologies, procurement of inputs, training of members and establishment of
linkage withthe market. There should be some agency to provide guidance to the entrepreneurs as andwhen needed.
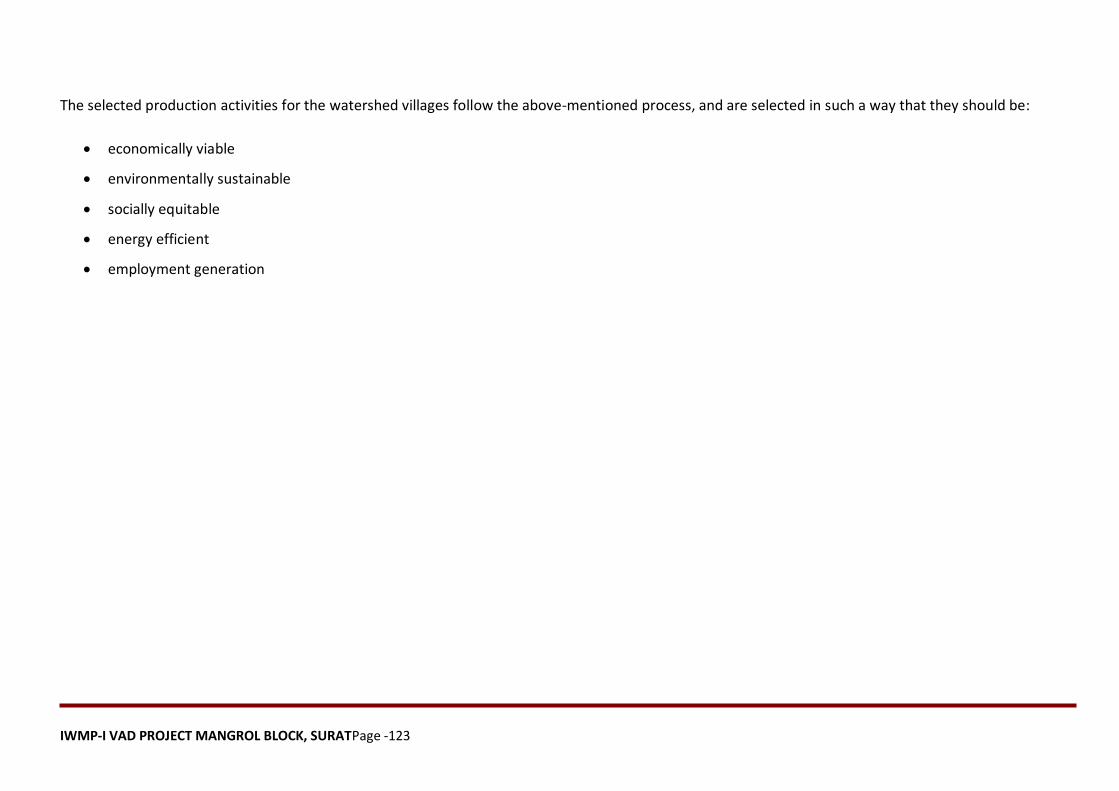
IWMP-I VAD PROJECT MANGROL BLOCK, SURATPage -123
The selected production activities for the watershed villages follow the above-mentioned process, and are selected in such a way that they should be:
economically viable
environmentally sustainable
socially equitable
energy efficient
employment generation
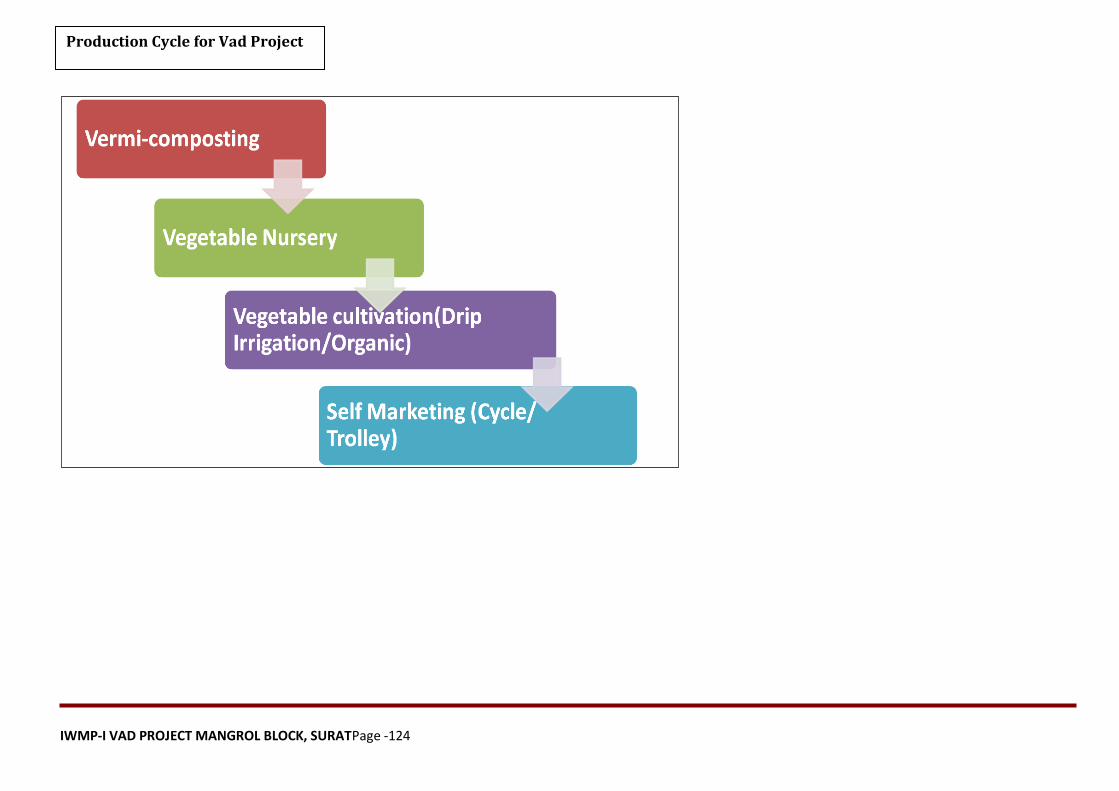
IWMP-I VAD PROJECT MANGROL BLOCK, SURATPage -124
Production Cycle for Vad Project
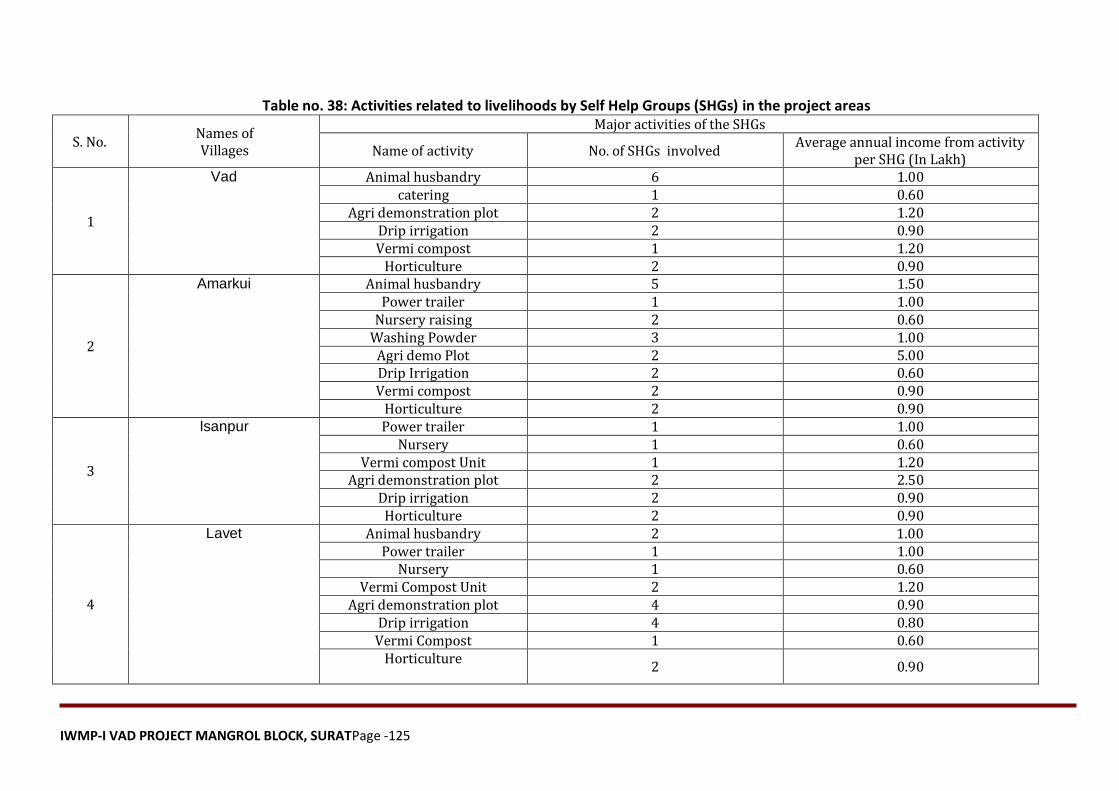
IWMP-I VAD PROJECT MANGROL BLOCK, SURATPage -125
Table no. 38: Activities related to livelihoods by Self Help Groups (SHGs) in the project areas
S. No. Names of Villages
Major activities of the SHGs
Name of activity No. of SHGs involved Average annual income from activity
per SHG (In Lakh)
1
Vad Animal husbandry 6 1.00 catering 1 0.60
Agri demonstration plot 2 1.20 Drip irrigation 2 0.90 Vermi compost 1 1.20
Horticulture 2 0.90
2
Amarkui Animal husbandry 5 1.50 Power trailer 1 1.00
Nursery raising 2 0.60 Washing Powder 3 1.00
Agri demo Plot 2 5.00 Drip Irrigation 2 0.60 Vermi compost 2 0.90
Horticulture 2 0.90
3
Isanpur Power trailer 1 1.00 Nursery 1 0.60
Vermi compost Unit 1 1.20 Agri demonstration plot 2 2.50
Drip irrigation 2 0.90 Horticulture 2 0.90
4
Lavet Animal husbandry 2 1.00 Power trailer 1 1.00
Nursery 1 0.60 Vermi Compost Unit 2 1.20
Agri demonstration plot 4 0.90 Drip irrigation 4 0.80 Vermi Compost 1 0.60
Horticulture
2 0.90

IWMP-I VAD PROJECT MANGROL BLOCK, SURATPage -126
5
Motifali Catering set 1 0.50 Agri demonstration Plot 1 0.40
Drip Irrigation 2 0.70 Horticulture 1 0.60
6
Khareda Catering set 1 0.50 Nursery 1 0.50
Washing Powder 1 0.75 Agri demonstration Plot 2 0.75
Drip irrigation 2 0.70 Vermi compost 1 0.60
Horticulture 1 0.50
7
Mangrol Animal Husbandry 4 1.00 Catering set 1 0.50
Agri demonstration plot 1 0.45 Drip irrigation 1 0.60 Vermi compost 1 0.50
Horticulture 1 0.60
8
Jhankhvav Catering set 1 0.50 Nursery 2 0.60
Vermi compost 1 0.50 Agri Demonstration plot 3 1.00
Dallia machine 1 0.50 Drip irrigation 3 0.70
Horticulture 1 1.00
9
Nani fali Animal Husbandry 4 1.00 Agri Demonstration plot 3 0.75
Drip irrigation 3 0.80 Vermi compost 2 1.00
Horticulture 1 0.50
10
Nandola Animal Husbandry 4 1.00 Agri Demonstration plot 2 1.00
Drip irrigation 2 0.50 Horticulture 2 0.75
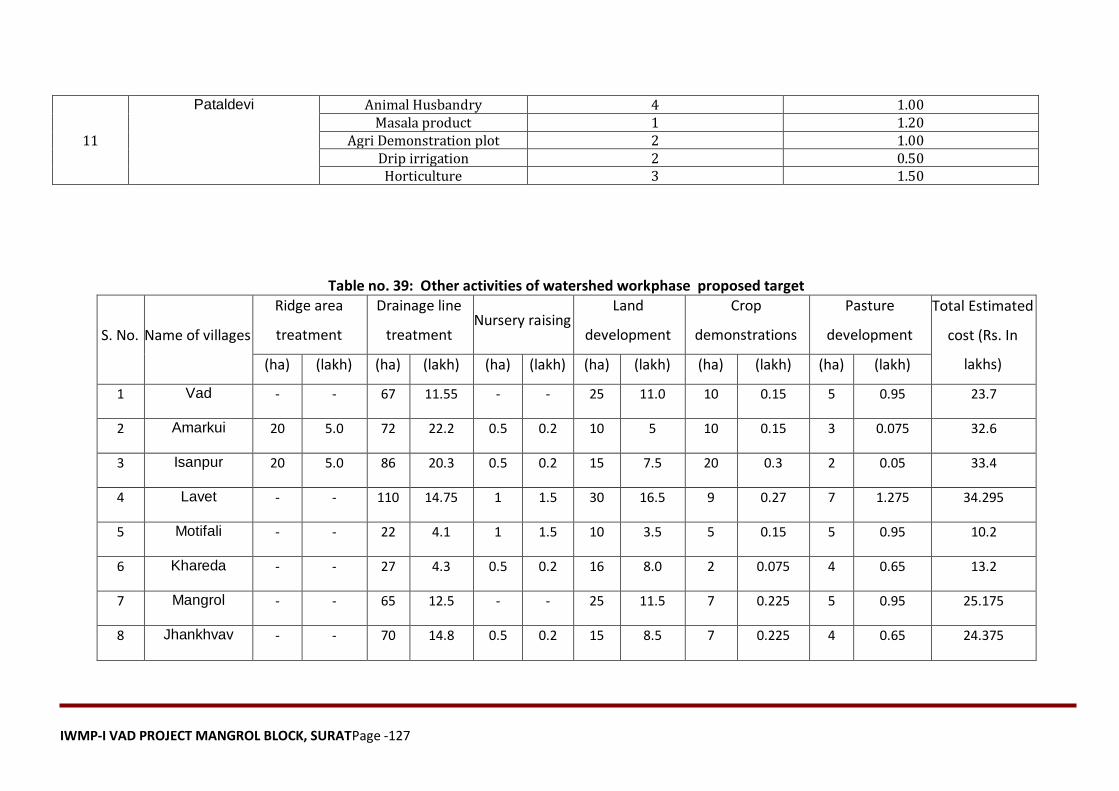
IWMP-I VAD PROJECT MANGROL BLOCK, SURATPage -127
11
Pataldevi Animal Husbandry 4 1.00 Masala product 1 1.20
Agri Demonstration plot 2 1.00 Drip irrigation 2 0.50 Horticulture 3 1.50
Table no. 39: Other activities of watershed workphase proposed target
S. No. Name of villages
Ridge area
treatment
Drainage line
treatment Nursery raising
Land
development
Crop
demonstrations
Pasture
development
Total Estimated
cost (Rs. In
lakhs) (ha) (lakh) (ha) (lakh) (ha) (lakh) (ha) (lakh) (ha) (lakh) (ha) (lakh)
1 Vad - - 67 11.55 - - 25 11.0 10 0.15 5 0.95 23.7
2 Amarkui 20 5.0 72 22.2 0.5 0.2 10 5 10 0.15 3 0.075 32.6
3 Isanpur 20 5.0 86 20.3 0.5 0.2 15 7.5 20 0.3 2 0.05 33.4
4 Lavet - - 110 14.75 1 1.5 30 16.5 9 0.27 7 1.275 34.295
5 Motifali - - 22 4.1 1 1.5 10 3.5 5 0.15 5 0.95 10.2
6 Khareda - - 27 4.3 0.5 0.2 16 8.0 2 0.075 4 0.65 13.2
7 Mangrol - - 65 12.5 - - 25 11.5 7 0.225 5 0.95 25.175
8 Jhankhvav - - 70 14.8 0.5 0.2 15 8.5 7 0.225 4 0.65 24.375
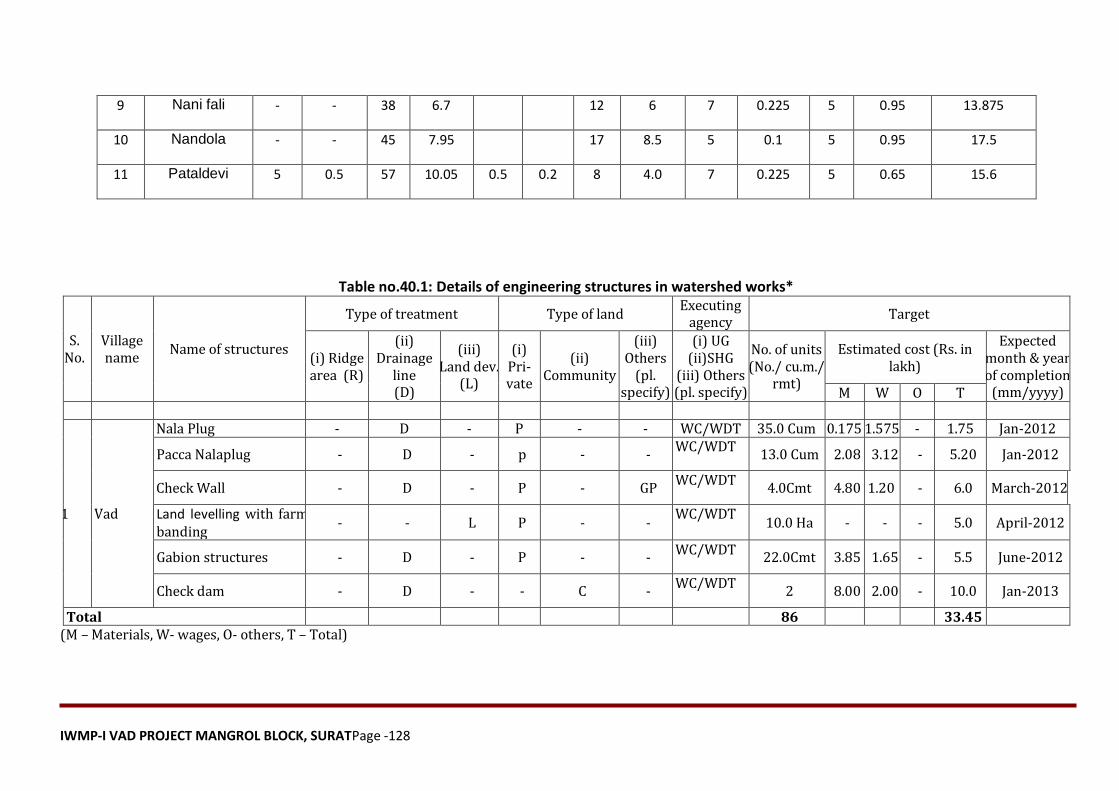
IWMP-I VAD PROJECT MANGROL BLOCK, SURATPage -128
9 Nani fali - - 38 6.7 12 6 7 0.225 5 0.95 13.875
10 Nandola - - 45 7.95 17 8.5 5 0.1 5 0.95 17.5
11 Pataldevi 5 0.5 57 10.05 0.5 0.2 8 4.0 7 0.225 5 0.65 15.6
Table no.40.1: Details of engineering structures in watershed works*
S. No.
Village name
Name of structures
Type of treatment Type of land Executing
agency Target
(i) Ridge area (R)
(ii) Drainage
line (D)
(iii) Land dev.
(L)
(i) Pri-vate
(ii) Community
(iii) Others
(pl. specify)
(i) UG (ii)SHG
(iii) Others (pl. specify)
No. of units (No./ cu.m./
rmt)
Estimated cost (Rs. in lakh)
Expected month & year of completion
(mm/yyyy) M W O T
1 Vad
Nala Plug - D - P - - WC/WDT 35.0 Cum 0.175 1.575 - 1.75 Jan-2012
Pacca Nalaplug - D - p - - WC/WDT
13.0 Cum 2.08 3.12 - 5.20 Jan-2012
Check Wall - D - P - GP WC/WDT
4.0Cmt 4.80 1.20 - 6.0 March-2012
Land levelling with farm banding
- - L P - - WC/WDT
10.0 Ha - - - 5.0 April-2012
Gabion structures - D - P - - WC/WDT
22.0Cmt 3.85 1.65 - 5.5 June-2012
Check dam - D - - C - WC/WDT
2 8.00 2.00 - 10.0 Jan-2013
Total 86 33.45 (M – Materials, W- wages, O- others, T – Total)
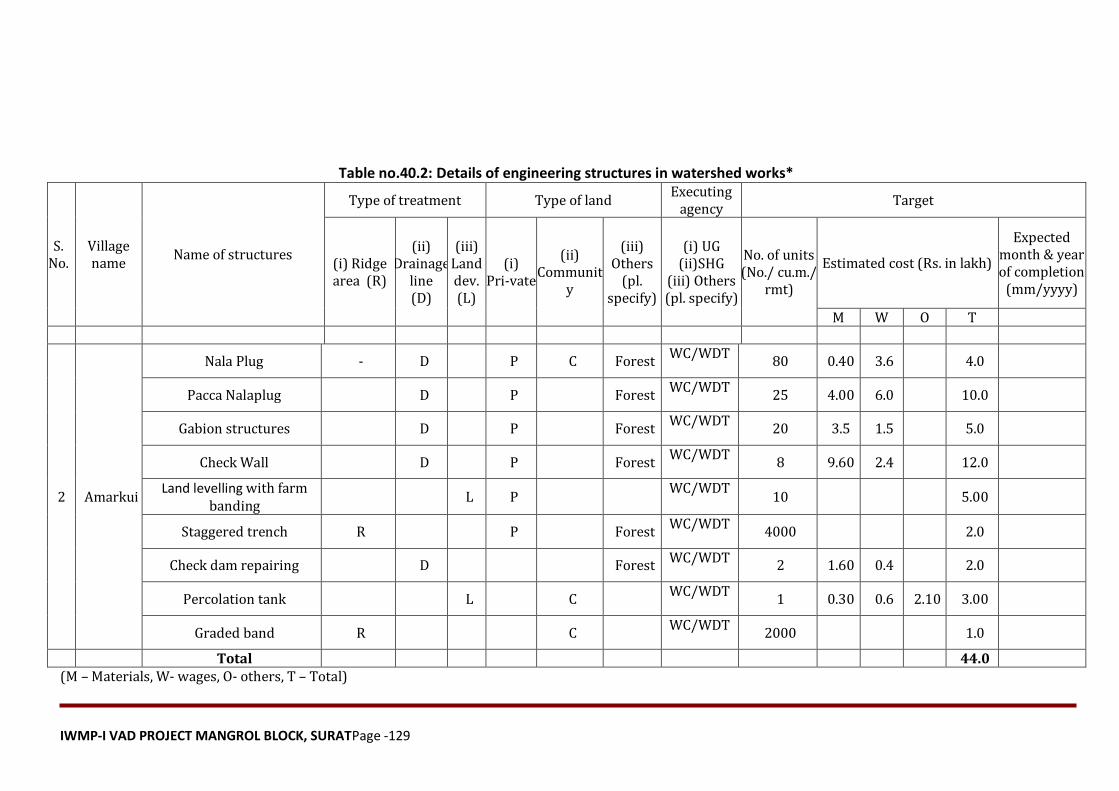
IWMP-I VAD PROJECT MANGROL BLOCK, SURATPage -129
Table no.40.2: Details of engineering structures in watershed works*
S. No.
Village name
Name of structures
Type of treatment Type of land Executing
agency Target
(i) Ridge area (R)
(ii) Drainage
line (D)
(iii) Land dev. (L)
(i) Pri-vate
(ii) Communit
y
(iii) Others
(pl. specify)
(i) UG (ii)SHG
(iii) Others (pl. specify)
No. of units (No./ cu.m./
rmt)
Estimated cost (Rs. in lakh)
Expected month & year of completion
(mm/yyyy)
M W O T
2 Amarkui
Nala Plug - D P C Forest WC/WDT
80 0.40 3.6 4.0
Pacca Nalaplug D P Forest WC/WDT
25 4.00 6.0 10.0
Gabion structures D P Forest WC/WDT
20 3.5 1.5 5.0
Check Wall D P Forest WC/WDT
8 9.60 2.4 12.0
Land levelling with farm banding
L P WC/WDT
10 5.00
Staggered trench R P Forest WC/WDT
4000 2.0
Check dam repairing D Forest WC/WDT
2 1.60 0.4 2.0
Percolation tank L C WC/WDT
1 0.30 0.6 2.10 3.00
Graded band R C WC/WDT
2000 1.0
Total 44.0 (M – Materials, W- wages, O- others, T – Total)
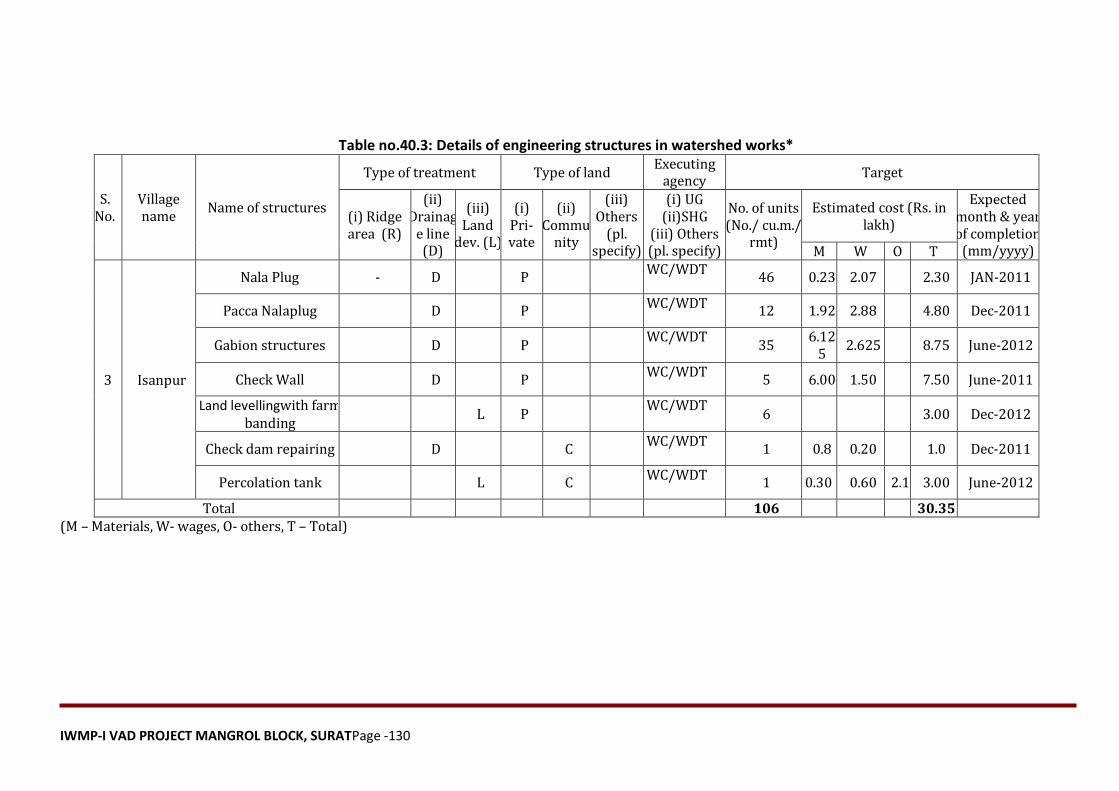
IWMP-I VAD PROJECT MANGROL BLOCK, SURATPage -130
Table no.40.3: Details of engineering structures in watershed works*
S. No.
Village name
Name of structures
Type of treatment Type of land Executing
agency Target
(i) Ridge area (R)
(ii) Drainag
e line (D)
(iii) Land
dev. (L)
(i) Pri-vate
(ii) Commu
nity
(iii) Others
(pl. specify)
(i) UG (ii)SHG
(iii) Others (pl. specify)
No. of units (No./ cu.m./
rmt)
Estimated cost (Rs. in lakh)
Expected month & year of completion
(mm/yyyy) M W O T
3 Isanpur
Nala Plug - D P WC/WDT
46 0.23 2.07 2.30 JAN-2011
Pacca Nalaplug D P WC/WDT
12 1.92 2.88 4.80 Dec-2011
Gabion structures D P WC/WDT
35 6.12
5 2.625 8.75 June-2012
Check Wall D P WC/WDT
5 6.00 1.50 7.50 June-2011
Land levellingwith farm banding
L P WC/WDT
6 3.00 Dec-2012
Check dam repairing D C WC/WDT
1 0.8 0.20 1.0 Dec-2011
Percolation tank L C WC/WDT
1 0.30 0.60 2.1 3.00 June-2012
Total 106 30.35 (M – Materials, W- wages, O- others, T – Total)
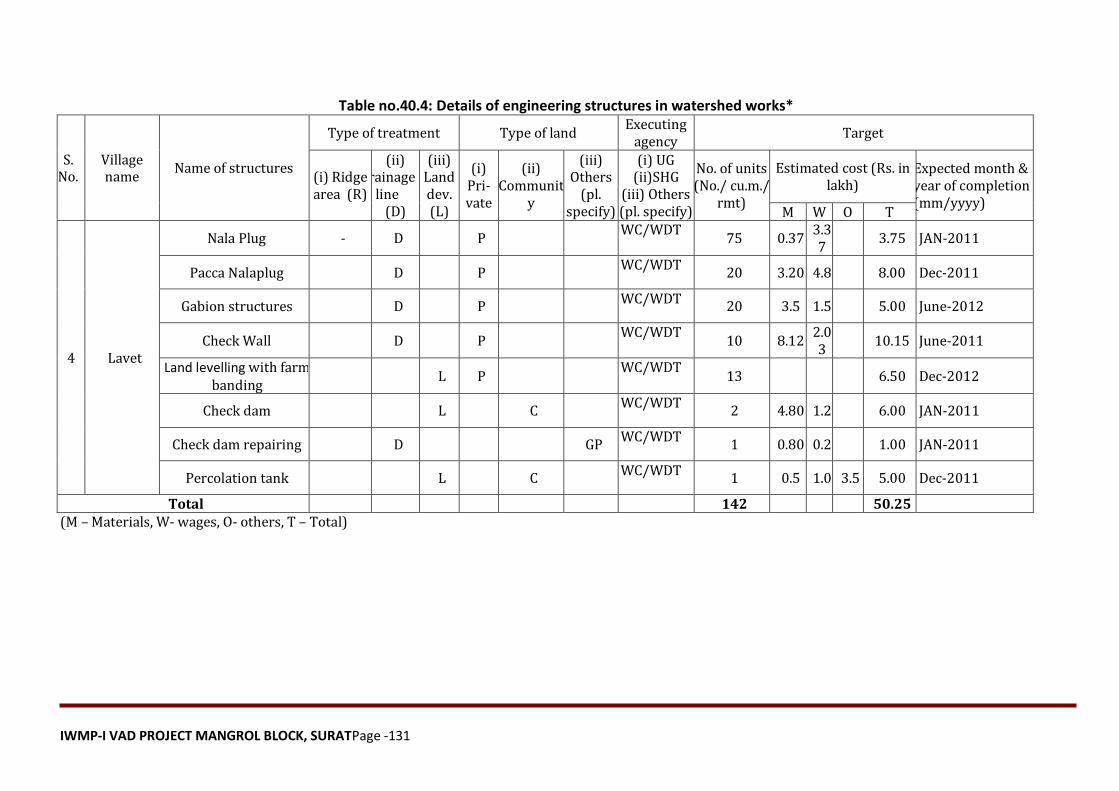
IWMP-I VAD PROJECT MANGROL BLOCK, SURATPage -131
Table no.40.4: Details of engineering structures in watershed works*
S. No.
Village name
Name of structures
Type of treatment Type of land Executing
agency Target
(i) Ridge area (R)
(ii) Drainage
line (D)
(iii) Land dev. (L)
(i) Pri-vate
(ii) Communit
y
(iii) Others
(pl. specify)
(i) UG (ii)SHG
(iii) Others (pl. specify)
No. of units (No./ cu.m./
rmt)
Estimated cost (Rs. in lakh)
Expected month & year of completion (mm/yyyy)
M W O T
4 Lavet
Nala Plug - D P WC/WDT
75 0.37 3.37
3.75 JAN-2011
Pacca Nalaplug D P WC/WDT
20 3.20 4.8 8.00 Dec-2011
Gabion structures D P WC/WDT
20 3.5 1.5 5.00 June-2012
Check Wall D P WC/WDT
10 8.12 2.03
10.15 June-2011
Land levelling with farm banding
L P WC/WDT
13 6.50 Dec-2012
Check dam L C WC/WDT
2 4.80 1.2 6.00 JAN-2011
Check dam repairing D GP WC/WDT
1 0.80 0.2 1.00 JAN-2011
Percolation tank L C WC/WDT
1 0.5 1.0 3.5 5.00 Dec-2011
Total 142 50.25 (M – Materials, W- wages, O- others, T – Total)
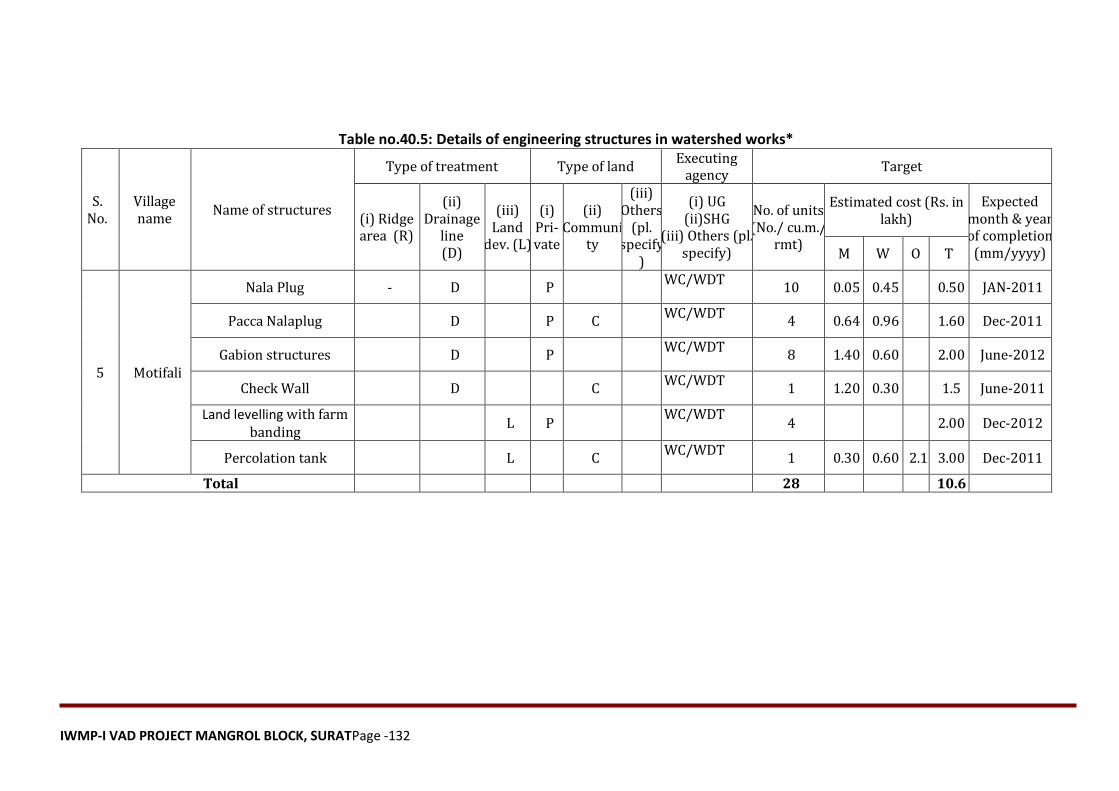
IWMP-I VAD PROJECT MANGROL BLOCK, SURATPage -132
Table no.40.5: Details of engineering structures in watershed works*
S. No.
Village name
Name of structures
Type of treatment Type of land Executing
agency Target
(i) Ridge area (R)
(ii) Drainage
line (D)
(iii) Land
dev. (L)
(i) Pri-vate
(ii) Communi
ty
(iii) Others
(pl. specify
)
(i) UG (ii)SHG
(iii) Others (pl. specify)
No. of units (No./ cu.m./
rmt)
Estimated cost (Rs. in lakh)
Expected month & year of completion
(mm/yyyy) M W O T
5 Motifali
Nala Plug - D P WC/WDT
10 0.05 0.45 0.50 JAN-2011
Pacca Nalaplug D P C WC/WDT
4 0.64 0.96 1.60 Dec-2011
Gabion structures D P WC/WDT
8 1.40 0.60 2.00 June-2012
Check Wall D C WC/WDT
1 1.20 0.30 1.5 June-2011
Land levelling with farm banding
L P WC/WDT
4 2.00 Dec-2012
Percolation tank L C WC/WDT
1 0.30 0.60 2.1 3.00 Dec-2011
Total 28 10.6
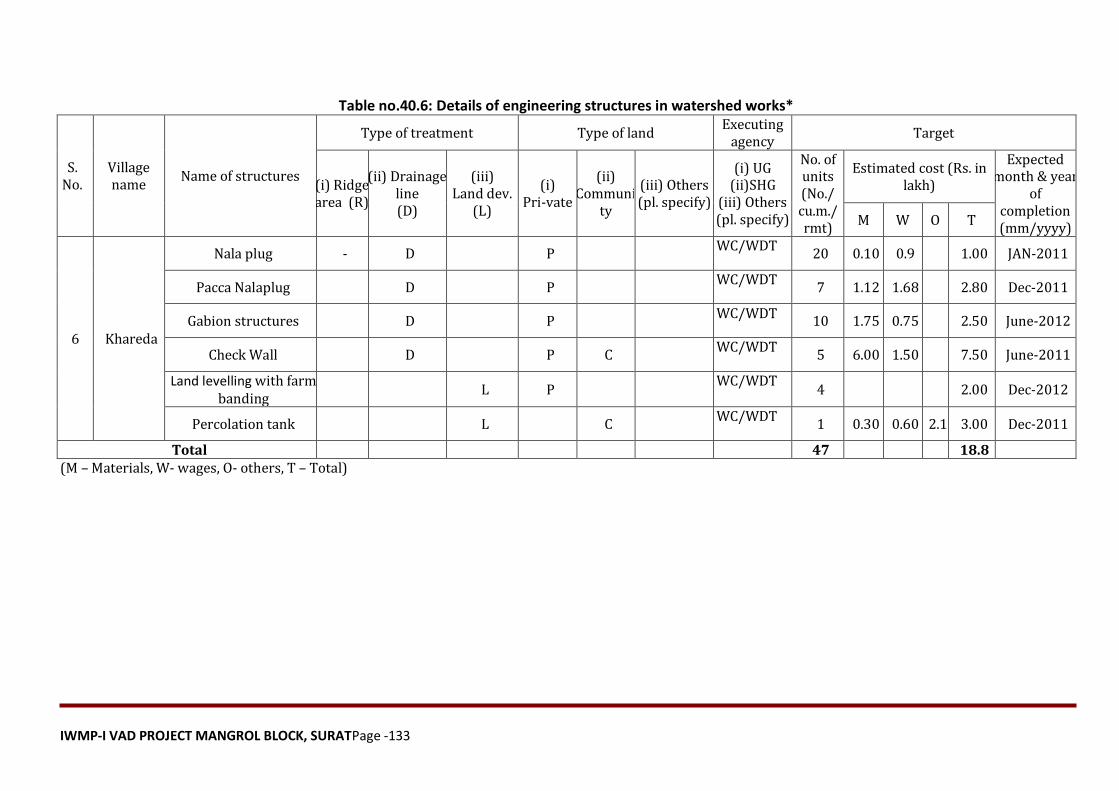
IWMP-I VAD PROJECT MANGROL BLOCK, SURATPage -133
Table no.40.6: Details of engineering structures in watershed works*
S. No.
Village name
Name of structures
Type of treatment Type of land Executing
agency Target
(i) Ridge area (R)
(ii) Drainage line (D)
(iii) Land dev.
(L)
(i) Pri-vate
(ii) Communi
ty
(iii) Others (pl. specify)
(i) UG (ii)SHG
(iii) Others (pl. specify)
No. of units (No./ cu.m./ rmt)
Estimated cost (Rs. in lakh)
Expected month & year
of completion (mm/yyyy)
M W O T
6 Khareda
Nala plug - D P WC/WDT
20 0.10 0.9 1.00 JAN-2011
Pacca Nalaplug D P WC/WDT
7 1.12 1.68 2.80 Dec-2011
Gabion structures D P WC/WDT
10 1.75 0.75 2.50 June-2012
Check Wall D P C WC/WDT
5 6.00 1.50 7.50 June-2011
Land levelling with farm banding
L P WC/WDT
4 2.00 Dec-2012
Percolation tank L C WC/WDT
1 0.30 0.60 2.1 3.00 Dec-2011
Total 47 18.8 (M – Materials, W- wages, O- others, T – Total)
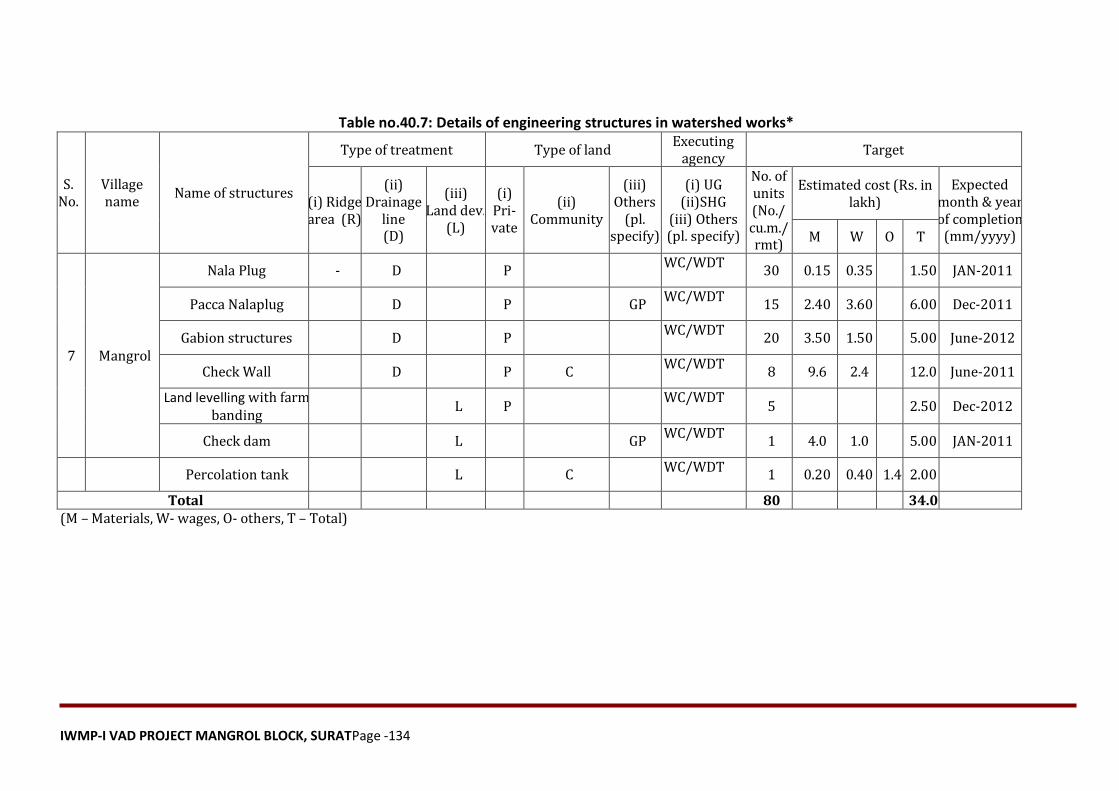
IWMP-I VAD PROJECT MANGROL BLOCK, SURATPage -134
Table no.40.7: Details of engineering structures in watershed works*
S. No.
Village name
Name of structures
Type of treatment Type of land Executing
agency Target
(i) Ridge area (R)
(ii) Drainage
line (D)
(iii) Land dev.
(L)
(i) Pri-vate
(ii) Community
(iii) Others
(pl. specify)
(i) UG (ii)SHG
(iii) Others (pl. specify)
No. of units (No./ cu.m./ rmt)
Estimated cost (Rs. in lakh)
Expected month & year of completion
(mm/yyyy) M W O T
7 Mangrol
Nala Plug - D P WC/WDT
30 0.15 0.35 1.50 JAN-2011
Pacca Nalaplug D P GP WC/WDT
15 2.40 3.60 6.00 Dec-2011
Gabion structures D P WC/WDT
20 3.50 1.50 5.00 June-2012
Check Wall D P C WC/WDT
8 9.6 2.4 12.0 June-2011
Land levelling with farm banding
L P WC/WDT
5 2.50 Dec-2012
Check dam L GP WC/WDT
1 4.0 1.0 5.00 JAN-2011
Percolation tank L C WC/WDT
1 0.20 0.40 1.4 2.00
Total 80 34.0 (M – Materials, W- wages, O- others, T – Total)
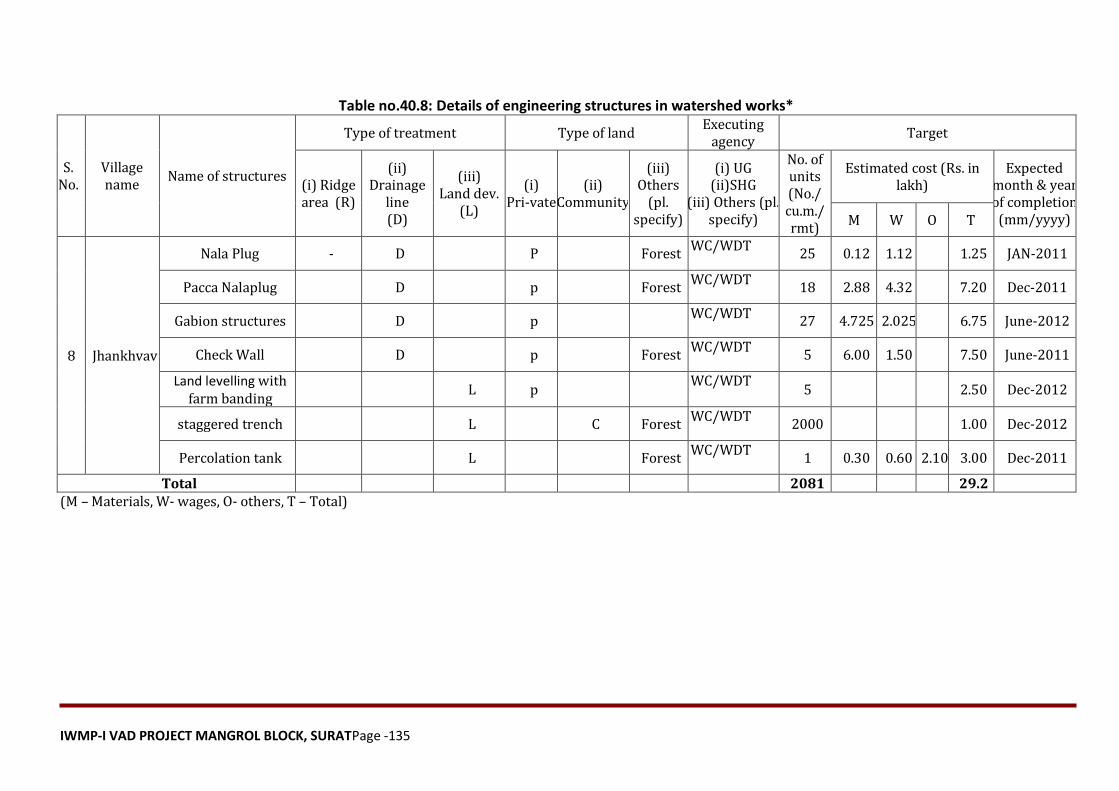
IWMP-I VAD PROJECT MANGROL BLOCK, SURATPage -135
Table no.40.8: Details of engineering structures in watershed works*
S. No.
Village name
Name of structures
Type of treatment Type of land Executing
agency Target
(i) Ridge area (R)
(ii) Drainage
line (D)
(iii) Land dev.
(L)
(i) Pri-vate
(ii) Community
(iii) Others
(pl. specify)
(i) UG (ii)SHG
(iii) Others (pl. specify)
No. of units (No./ cu.m./ rmt)
Estimated cost (Rs. in lakh)
Expected month & year of completion
(mm/yyyy) M W O T
8 Jhankhvav
Nala Plug - D P Forest WC/WDT
25 0.12 1.12 1.25 JAN-2011
Pacca Nalaplug D p Forest WC/WDT
18 2.88 4.32 7.20 Dec-2011
Gabion structures D p WC/WDT
27 4.725 2.025 6.75 June-2012
Check Wall D p Forest WC/WDT
5 6.00 1.50 7.50 June-2011
Land levelling with farm banding
L p WC/WDT
5 2.50 Dec-2012
staggered trench L C Forest WC/WDT
2000 1.00 Dec-2012
Percolation tank L Forest WC/WDT
1 0.30 0.60 2.10 3.00 Dec-2011
Total 2081 29.2 (M – Materials, W- wages, O- others, T – Total)
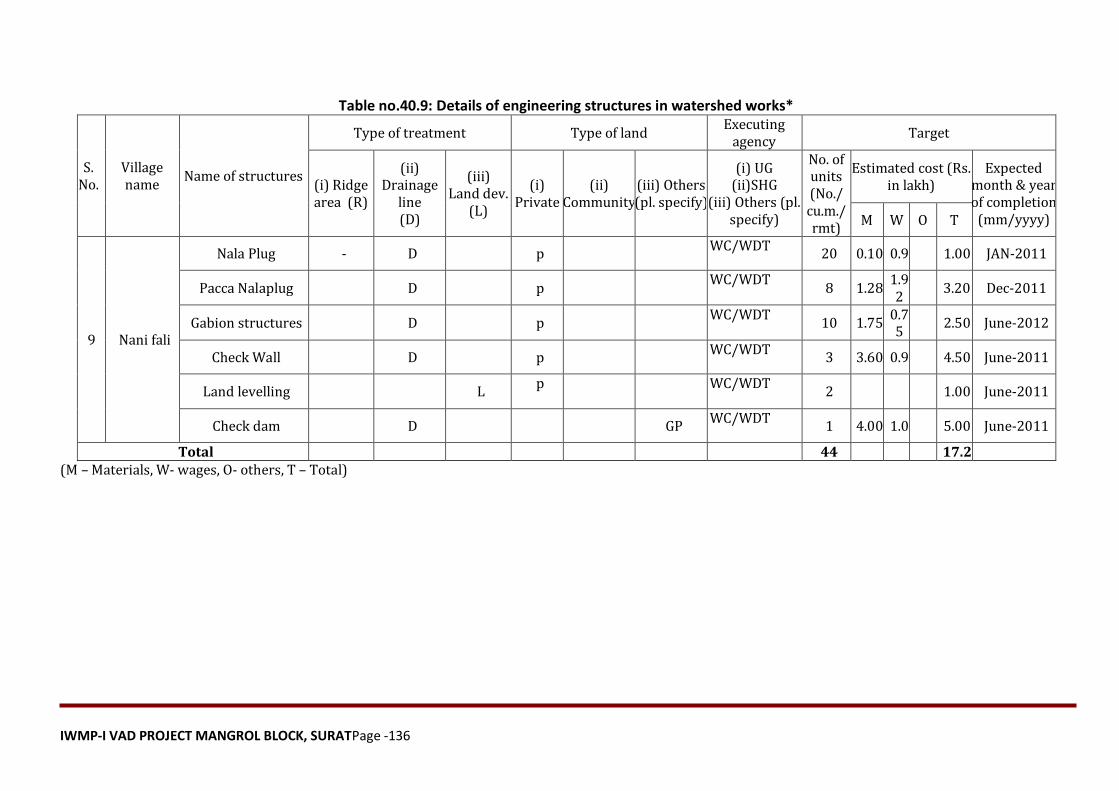
IWMP-I VAD PROJECT MANGROL BLOCK, SURATPage -136
Table no.40.9: Details of engineering structures in watershed works*
S. No.
Village name
Name of structures
Type of treatment Type of land Executing
agency Target
(i) Ridge area (R)
(ii) Drainage
line (D)
(iii) Land dev.
(L)
(i) Private
(ii) Community
(iii) Others (pl. specify)
(i) UG (ii)SHG
(iii) Others (pl. specify)
No. of units (No./ cu.m./ rmt)
Estimated cost (Rs. in lakh)
Expected month & year of completion
(mm/yyyy) M W O T
9 Nani fali
Nala Plug - D p WC/WDT
20 0.10 0.9 1.00 JAN-2011
Pacca Nalaplug D p WC/WDT
8 1.28 1.92
3.20 Dec-2011
Gabion structures D p WC/WDT
10 1.75 0.75
2.50 June-2012
Check Wall D p WC/WDT
3 3.60 0.9 4.50 June-2011
Land levelling L p
WC/WDT 2 1.00 June-2011
Check dam D GP WC/WDT
1 4.00 1.0 5.00 June-2011
Total 44 17.2 (M – Materials, W- wages, O- others, T – Total)
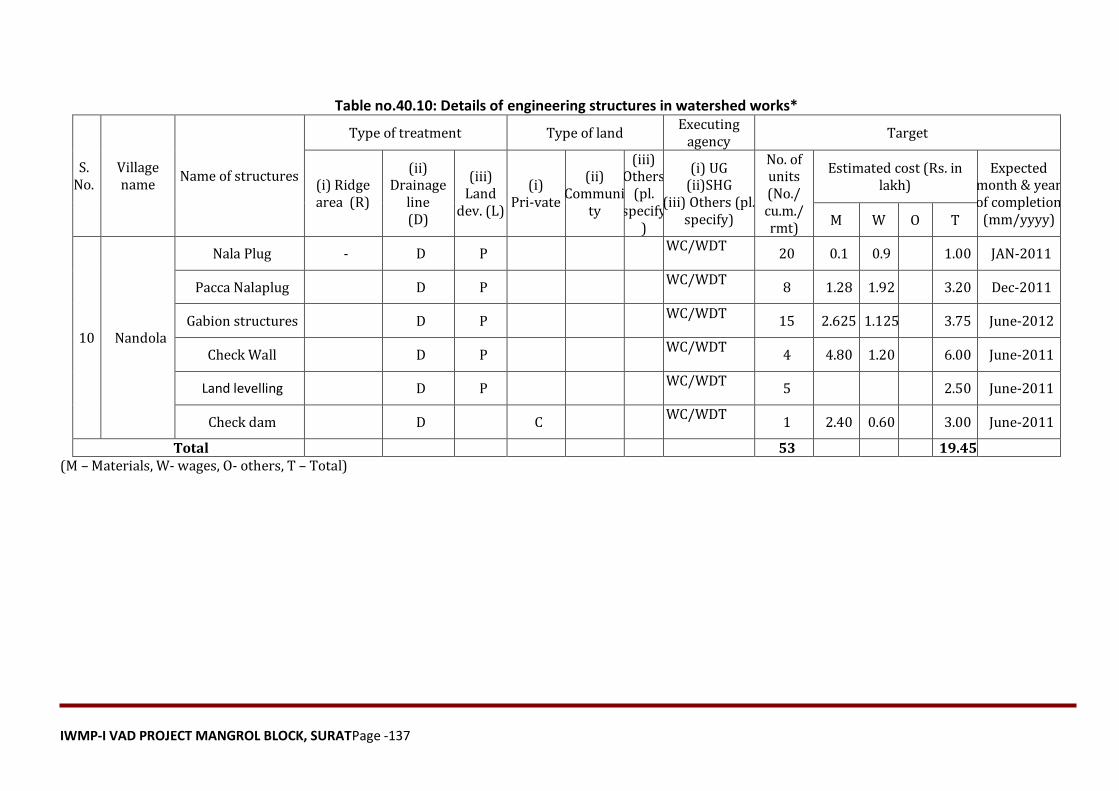
IWMP-I VAD PROJECT MANGROL BLOCK, SURATPage -137
Table no.40.10: Details of engineering structures in watershed works*
S. No.
Village name
Name of structures
Type of treatment Type of land Executing
agency Target
(i) Ridge area (R)
(ii) Drainage
line (D)
(iii) Land
dev. (L)
(i) Pri-vate
(ii) Communi
ty
(iii) Others
(pl. specify
)
(i) UG (ii)SHG
(iii) Others (pl. specify)
No. of units (No./ cu.m./ rmt)
Estimated cost (Rs. in lakh)
Expected month & year of completion
(mm/yyyy) M W O T
10 Nandola
Nala Plug - D P WC/WDT
20 0.1 0.9 1.00 JAN-2011
Pacca Nalaplug D P WC/WDT
8 1.28 1.92 3.20 Dec-2011
Gabion structures D P WC/WDT
15 2.625 1.125 3.75 June-2012
Check Wall D P WC/WDT
4 4.80 1.20 6.00 June-2011
Land levelling D P WC/WDT
5 2.50 June-2011
Check dam D C WC/WDT
1 2.40 0.60 3.00 June-2011
Total 53 19.45 (M – Materials, W- wages, O- others, T – Total)
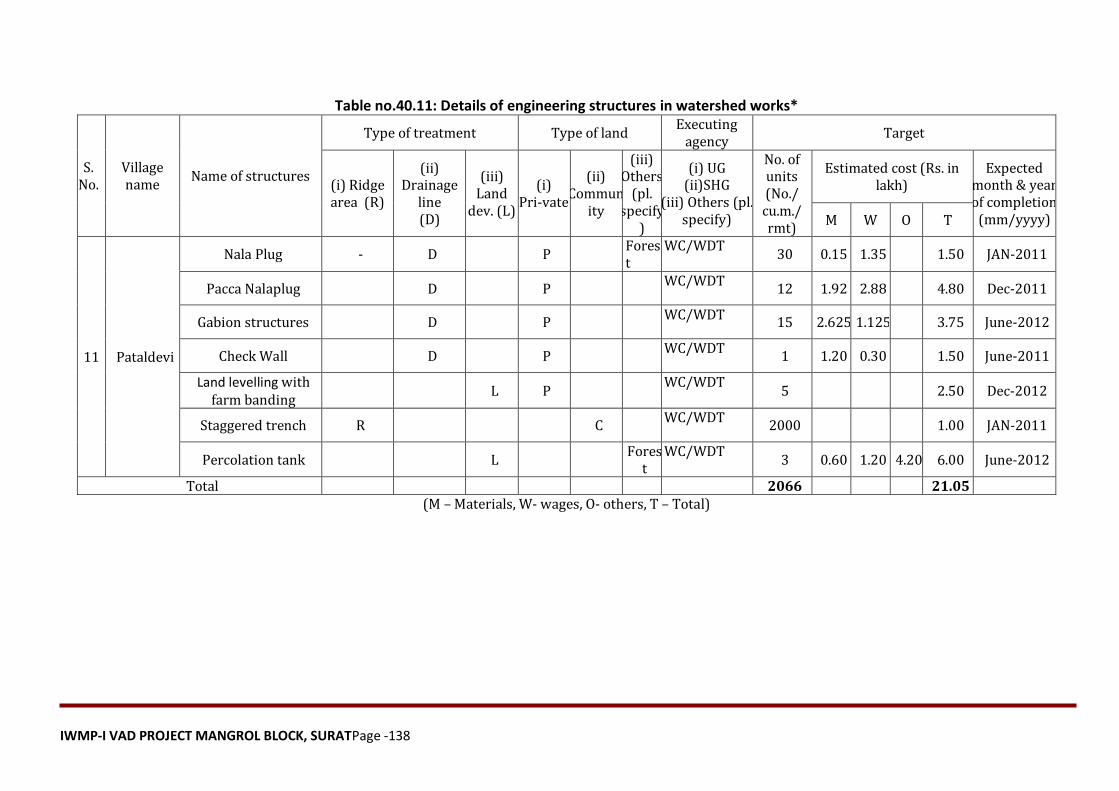
IWMP-I VAD PROJECT MANGROL BLOCK, SURATPage -138
Table no.40.11: Details of engineering structures in watershed works*
S. No.
Village name
Name of structures
Type of treatment Type of land Executing
agency Target
(i) Ridge area (R)
(ii) Drainage
line (D)
(iii) Land
dev. (L)
(i) Pri-vate
(ii) Commun
ity
(iii) Others
(pl. specify
)
(i) UG (ii)SHG
(iii) Others (pl. specify)
No. of units (No./ cu.m./ rmt)
Estimated cost (Rs. in lakh)
Expected month & year of completion
(mm/yyyy) M W O T
11 Pataldevi
Nala Plug - D P Forest
WC/WDT 30 0.15 1.35 1.50 JAN-2011
Pacca Nalaplug D P WC/WDT
12 1.92 2.88 4.80 Dec-2011
Gabion structures D P WC/WDT
15 2.625 1.125 3.75 June-2012
Check Wall D P WC/WDT
1 1.20 0.30 1.50 June-2011
Land levelling with farm banding
L P WC/WDT
5 2.50 Dec-2012
Staggered trench R C WC/WDT
2000 1.00 JAN-2011
Percolation tank L Fores
t WC/WDT
3 0.60 1.20 4.20 6.00 June-2012
Total 2066 21.05 (M – Materials, W- wages, O- others, T – Total)
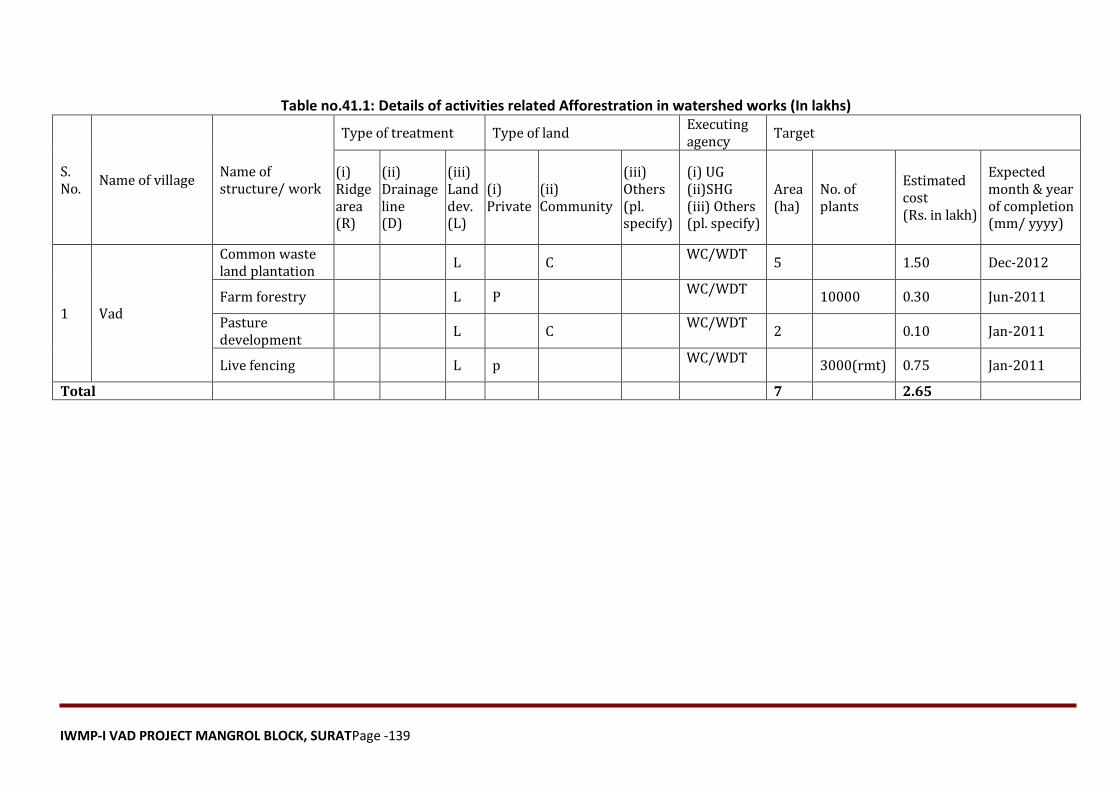
IWMP-I VAD PROJECT MANGROL BLOCK, SURATPage -139
Table no.41.1: Details of activities related Afforestration in watershed works (In lakhs)
S. No.
Name of village Name of structure/ work
Type of treatment Type of land Executing agency
Target
(i) Ridge area (R)
(ii) Drainage line (D)
(iii) Land dev. (L)
(i) Private
(ii) Community
(iii) Others (pl. specify)
(i) UG (ii)SHG (iii) Others (pl. specify)
Area (ha)
No. of plants
Estimated cost (Rs. in lakh)
Expected month & year of completion (mm/ yyyy)
1 Vad
Common waste land plantation
L C WC/WDT
5 1.50 Dec-2012
Farm forestry L P WC/WDT
10000 0.30 Jun-2011
Pasture development
L C WC/WDT
2 0.10 Jan-2011
Live fencing L p WC/WDT
3000(rmt) 0.75 Jan-2011
Total 7 2.65
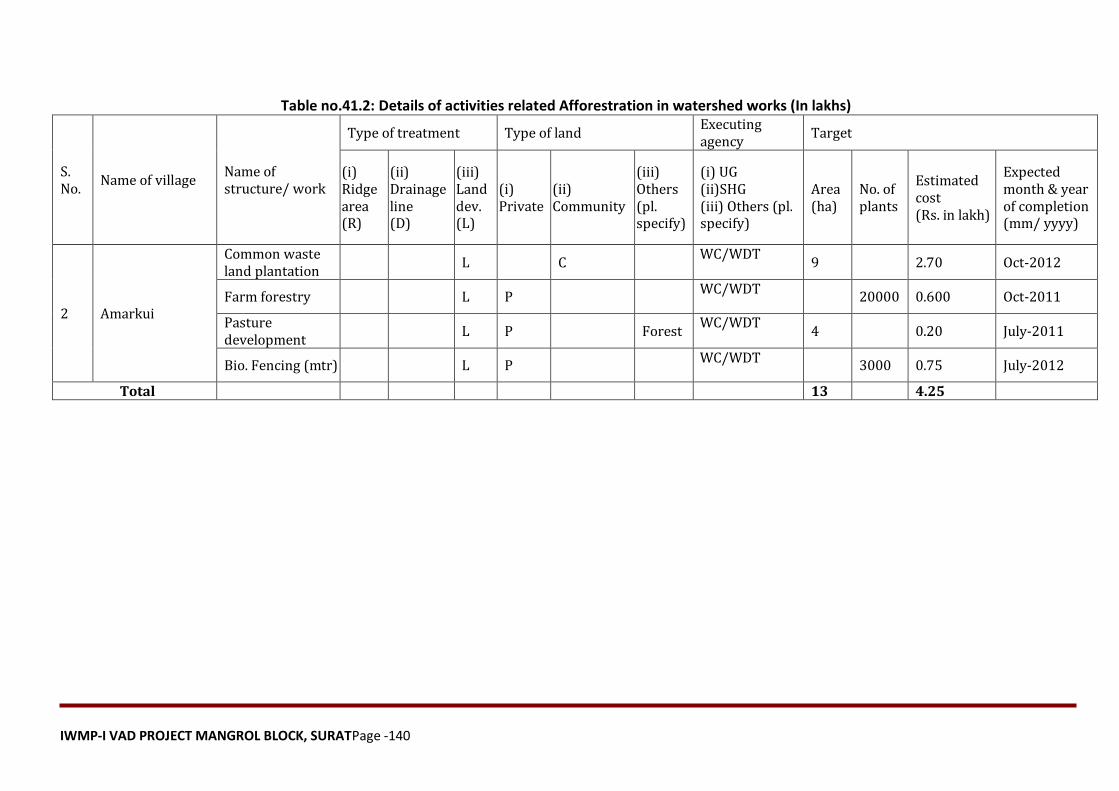
IWMP-I VAD PROJECT MANGROL BLOCK, SURATPage -140
Table no.41.2: Details of activities related Afforestration in watershed works (In lakhs)
S. No.
Name of village Name of structure/ work
Type of treatment Type of land Executing agency
Target
(i) Ridge area (R)
(ii) Drainage line (D)
(iii) Land dev. (L)
(i) Private
(ii) Community
(iii) Others (pl. specify)
(i) UG (ii)SHG (iii) Others (pl. specify)
Area (ha)
No. of plants
Estimated cost (Rs. in lakh)
Expected month & year of completion (mm/ yyyy)
2 Amarkui
Common waste land plantation
L C WC/WDT
9 2.70 Oct-2012
Farm forestry L P WC/WDT
20000 0.600 Oct-2011
Pasture development
L P Forest WC/WDT
4 0.20 July-2011
Bio. Fencing (mtr) L P WC/WDT
3000 0.75 July-2012
Total 13 4.25
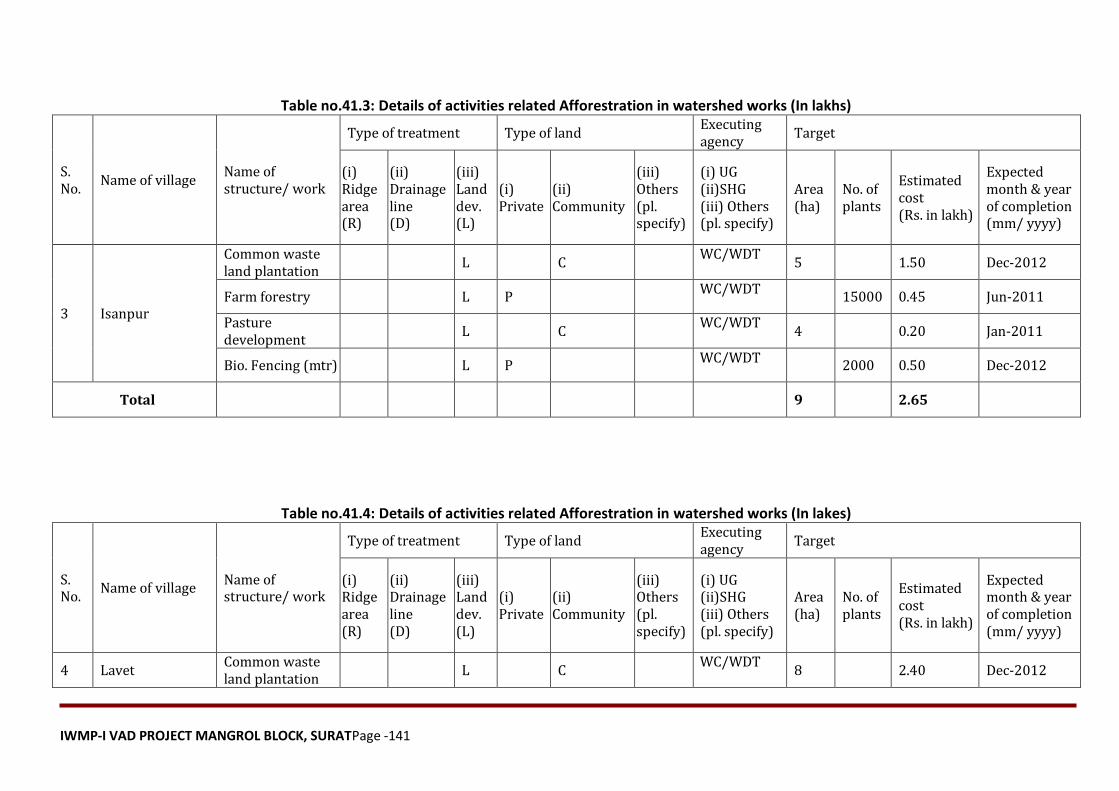
IWMP-I VAD PROJECT MANGROL BLOCK, SURATPage -141
Table no.41.3: Details of activities related Afforestration in watershed works (In lakhs)
S. No.
Name of village Name of structure/ work
Type of treatment Type of land Executing agency
Target
(i) Ridge area (R)
(ii) Drainage line (D)
(iii) Land dev. (L)
(i) Private
(ii) Community
(iii) Others (pl. specify)
(i) UG (ii)SHG (iii) Others (pl. specify)
Area (ha)
No. of plants
Estimated cost (Rs. in lakh)
Expected month & year of completion (mm/ yyyy)
3 Isanpur
Common waste land plantation
L C WC/WDT
5 1.50 Dec-2012
Farm forestry L P WC/WDT
15000 0.45 Jun-2011
Pasture development
L C WC/WDT
4 0.20 Jan-2011
Bio. Fencing (mtr) L P WC/WDT
2000 0.50 Dec-2012
Total 9 2.65
Table no.41.4: Details of activities related Afforestration in watershed works (In lakes)
S. No.
Name of village Name of structure/ work
Type of treatment Type of land Executing agency
Target
(i) Ridge area (R)
(ii) Drainage line (D)
(iii) Land dev. (L)
(i) Private
(ii) Community
(iii) Others (pl. specify)
(i) UG (ii)SHG (iii) Others (pl. specify)
Area (ha)
No. of plants
Estimated cost (Rs. in lakh)
Expected month & year of completion (mm/ yyyy)
4 Lavet Common waste land plantation
L C WC/WDT
8 2.40 Dec-2012
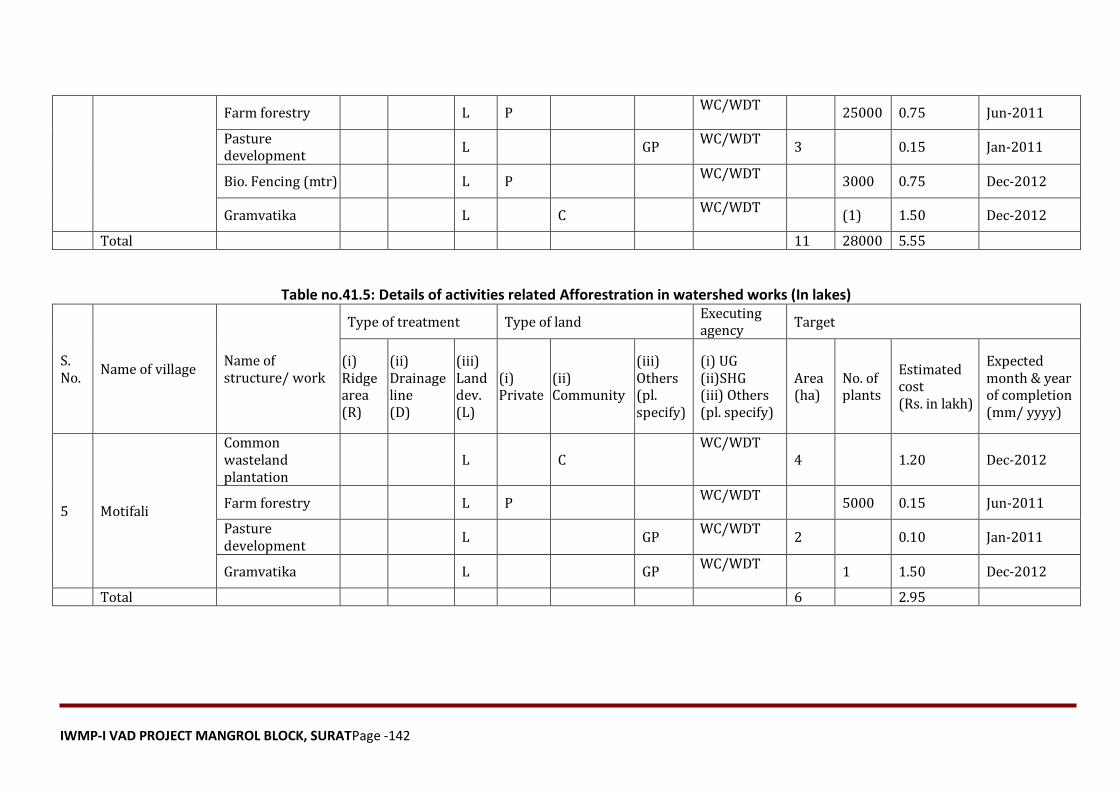
IWMP-I VAD PROJECT MANGROL BLOCK, SURATPage -142
Farm forestry L P WC/WDT
25000 0.75 Jun-2011
Pasture development
L GP WC/WDT
3 0.15 Jan-2011
Bio. Fencing (mtr) L P WC/WDT
3000 0.75 Dec-2012
Gramvatika L C WC/WDT
(1) 1.50 Dec-2012
Total 11 28000 5.55
Table no.41.5: Details of activities related Afforestration in watershed works (In lakes)
S. No.
Name of village Name of structure/ work
Type of treatment Type of land Executing agency
Target
(i) Ridge area (R)
(ii) Drainage line (D)
(iii) Land dev. (L)
(i) Private
(ii) Community
(iii) Others (pl. specify)
(i) UG (ii)SHG (iii) Others (pl. specify)
Area (ha)
No. of plants
Estimated cost (Rs. in lakh)
Expected month & year of completion (mm/ yyyy)
5 Motifali
Common wasteland plantation
L C WC/WDT
4 1.20 Dec-2012
Farm forestry L P WC/WDT
5000 0.15 Jun-2011
Pasture development
L GP WC/WDT
2 0.10 Jan-2011
Gramvatika L GP WC/WDT
1 1.50 Dec-2012
Total 6 2.95
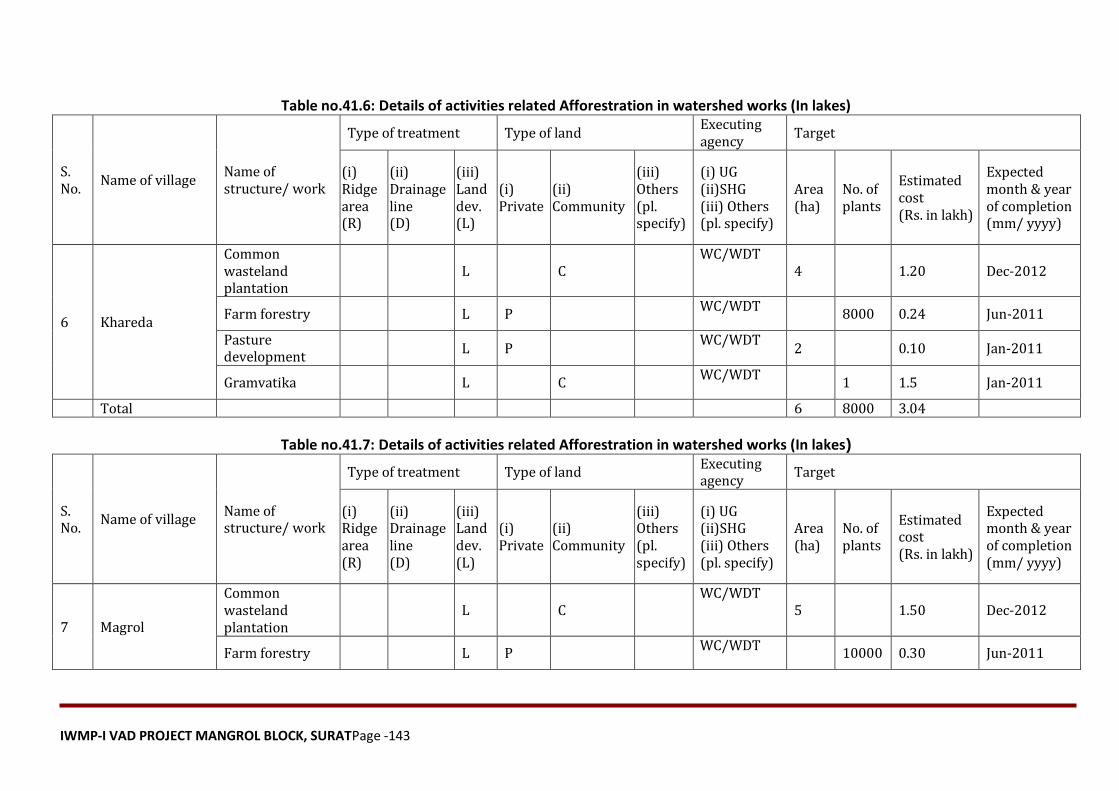
IWMP-I VAD PROJECT MANGROL BLOCK, SURATPage -143
Table no.41.6: Details of activities related Afforestration in watershed works (In lakes)
S. No.
Name of village Name of structure/ work
Type of treatment Type of land Executing agency
Target
(i) Ridge area (R)
(ii) Drainage line (D)
(iii) Land dev. (L)
(i) Private
(ii) Community
(iii) Others (pl. specify)
(i) UG (ii)SHG (iii) Others (pl. specify)
Area (ha)
No. of plants
Estimated cost (Rs. in lakh)
Expected month & year of completion (mm/ yyyy)
6 Khareda
Common wasteland plantation
L C WC/WDT
4 1.20 Dec-2012
Farm forestry L P WC/WDT
8000 0.24 Jun-2011
Pasture development
L P WC/WDT
2 0.10 Jan-2011
Gramvatika L C WC/WDT
1 1.5 Jan-2011
Total 6 8000 3.04
Table no.41.7: Details of activities related Afforestration in watershed works (In lakes)
S. No.
Name of village Name of structure/ work
Type of treatment Type of land Executing agency
Target
(i) Ridge area (R)
(ii) Drainage line (D)
(iii) Land dev. (L)
(i) Private
(ii) Community
(iii) Others (pl. specify)
(i) UG (ii)SHG (iii) Others (pl. specify)
Area (ha)
No. of plants
Estimated cost (Rs. in lakh)
Expected month & year of completion (mm/ yyyy)
7 Magrol
Common wasteland plantation
L C WC/WDT
5 1.50 Dec-2012
Farm forestry L P WC/WDT
10000 0.30 Jun-2011
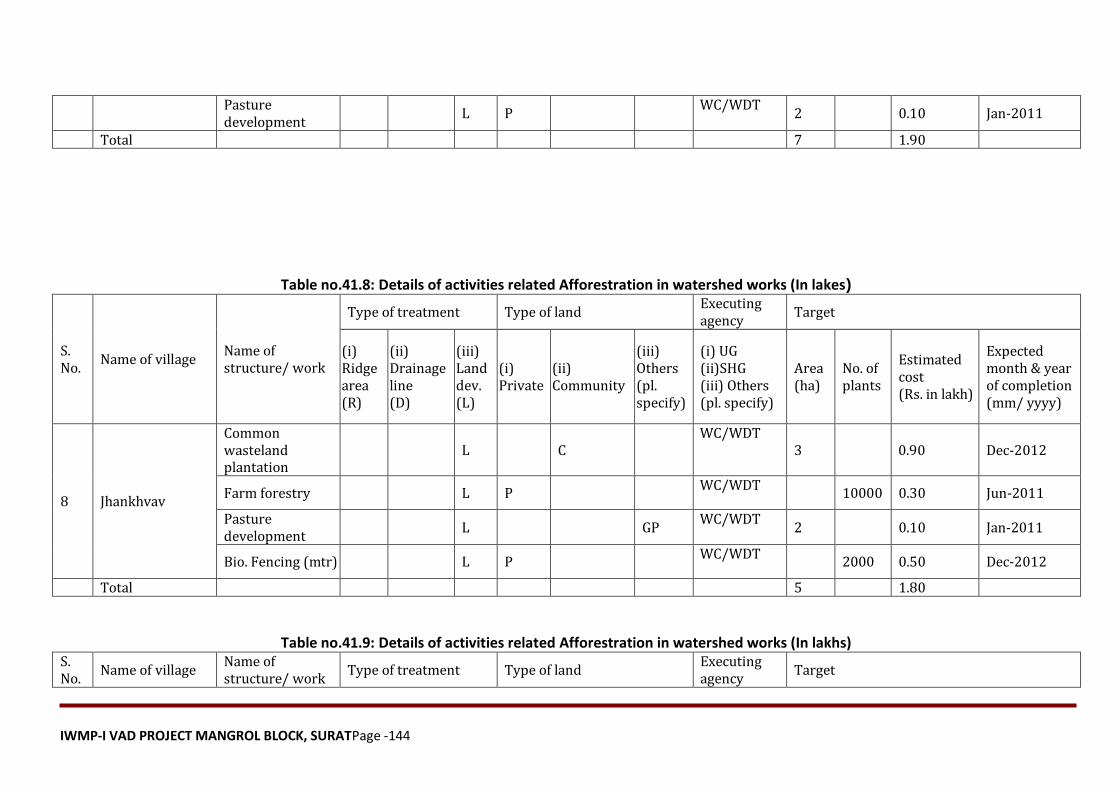
IWMP-I VAD PROJECT MANGROL BLOCK, SURATPage -144
Pasture development
L P WC/WDT
2 0.10 Jan-2011
Total 7 1.90
Table no.41.8: Details of activities related Afforestration in watershed works (In lakes)
S. No.
Name of village Name of structure/ work
Type of treatment Type of land Executing agency
Target
(i) Ridge area (R)
(ii) Drainage line (D)
(iii) Land dev. (L)
(i) Private
(ii) Community
(iii) Others (pl. specify)
(i) UG (ii)SHG (iii) Others (pl. specify)
Area (ha)
No. of plants
Estimated cost (Rs. in lakh)
Expected month & year of completion (mm/ yyyy)
8 Jhankhvav
Common wasteland plantation
L C WC/WDT
3 0.90 Dec-2012
Farm forestry L P WC/WDT
10000 0.30 Jun-2011
Pasture development
L GP WC/WDT
2 0.10 Jan-2011
Bio. Fencing (mtr) L P WC/WDT
2000 0.50 Dec-2012
Total 5 1.80
Table no.41.9: Details of activities related Afforestration in watershed works (In lakhs) S. No.
Name of village Name of structure/ work
Type of treatment Type of land Executing agency
Target
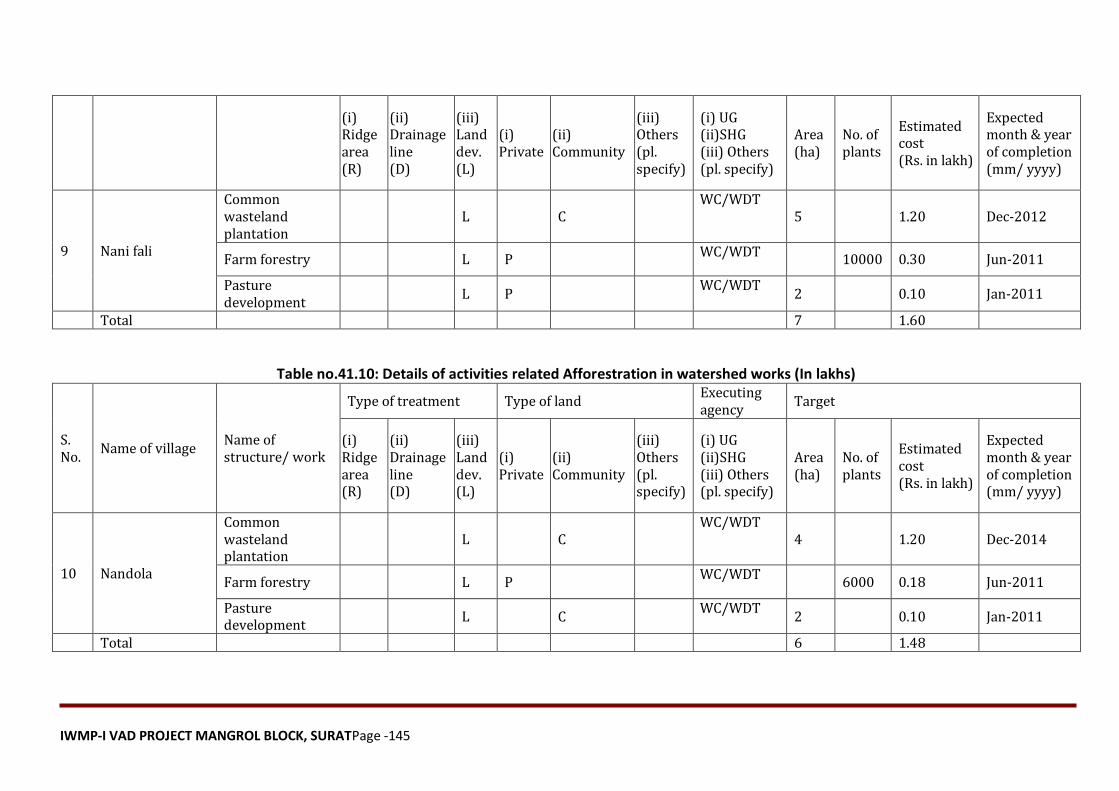
IWMP-I VAD PROJECT MANGROL BLOCK, SURATPage -145
(i) Ridge area (R)
(ii) Drainage line (D)
(iii) Land dev. (L)
(i) Private
(ii) Community
(iii) Others (pl. specify)
(i) UG (ii)SHG (iii) Others (pl. specify)
Area (ha)
No. of plants
Estimated cost (Rs. in lakh)
Expected month & year of completion (mm/ yyyy)
9 Nani fali
Common wasteland plantation
L C WC/WDT
5 1.20 Dec-2012
Farm forestry L P WC/WDT
10000 0.30 Jun-2011
Pasture development
L P WC/WDT
2 0.10 Jan-2011
Total 7 1.60
Table no.41.10: Details of activities related Afforestration in watershed works (In lakhs)
S. No.
Name of village Name of structure/ work
Type of treatment Type of land Executing agency
Target
(i) Ridge area (R)
(ii) Drainage line (D)
(iii) Land dev. (L)
(i) Private
(ii) Community
(iii) Others (pl. specify)
(i) UG (ii)SHG (iii) Others (pl. specify)
Area (ha)
No. of plants
Estimated cost (Rs. in lakh)
Expected month & year of completion (mm/ yyyy)
10 Nandola
Common wasteland plantation
L C WC/WDT
4 1.20 Dec-2014
Farm forestry L P WC/WDT
6000 0.18 Jun-2011
Pasture development
L C WC/WDT
2 0.10 Jan-2011
Total 6 1.48
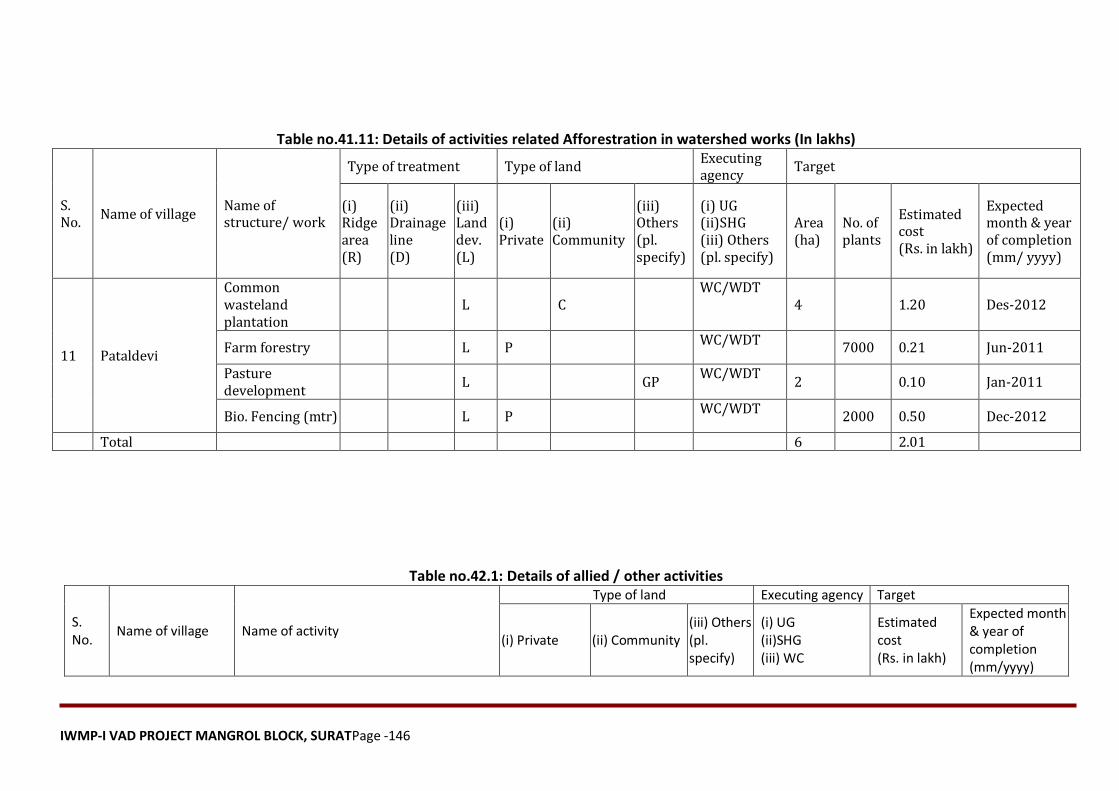
IWMP-I VAD PROJECT MANGROL BLOCK, SURATPage -146
Table no.41.11: Details of activities related Afforestration in watershed works (In lakhs)
S. No.
Name of village Name of structure/ work
Type of treatment Type of land Executing agency
Target
(i) Ridge area (R)
(ii) Drainage line (D)
(iii) Land dev. (L)
(i) Private
(ii) Community
(iii) Others (pl. specify)
(i) UG (ii)SHG (iii) Others (pl. specify)
Area (ha)
No. of plants
Estimated cost (Rs. in lakh)
Expected month & year of completion (mm/ yyyy)
11 Pataldevi
Common wasteland plantation
L C WC/WDT
4 1.20 Des-2012
Farm forestry L P WC/WDT
7000 0.21 Jun-2011
Pasture development
L GP WC/WDT
2 0.10 Jan-2011
Bio. Fencing (mtr) L P WC/WDT
2000 0.50 Dec-2012
Total 6 2.01
Table no.42.1: Details of allied / other activities
S. No.
Name of village Name of activity
Type of land Executing agency Target
(i) Private (ii) Community (iii) Others (pl. specify)
(i) UG (ii)SHG (iii) WC
Estimated cost (Rs. in lakh)
Expected month & year of completion (mm/yyyy)
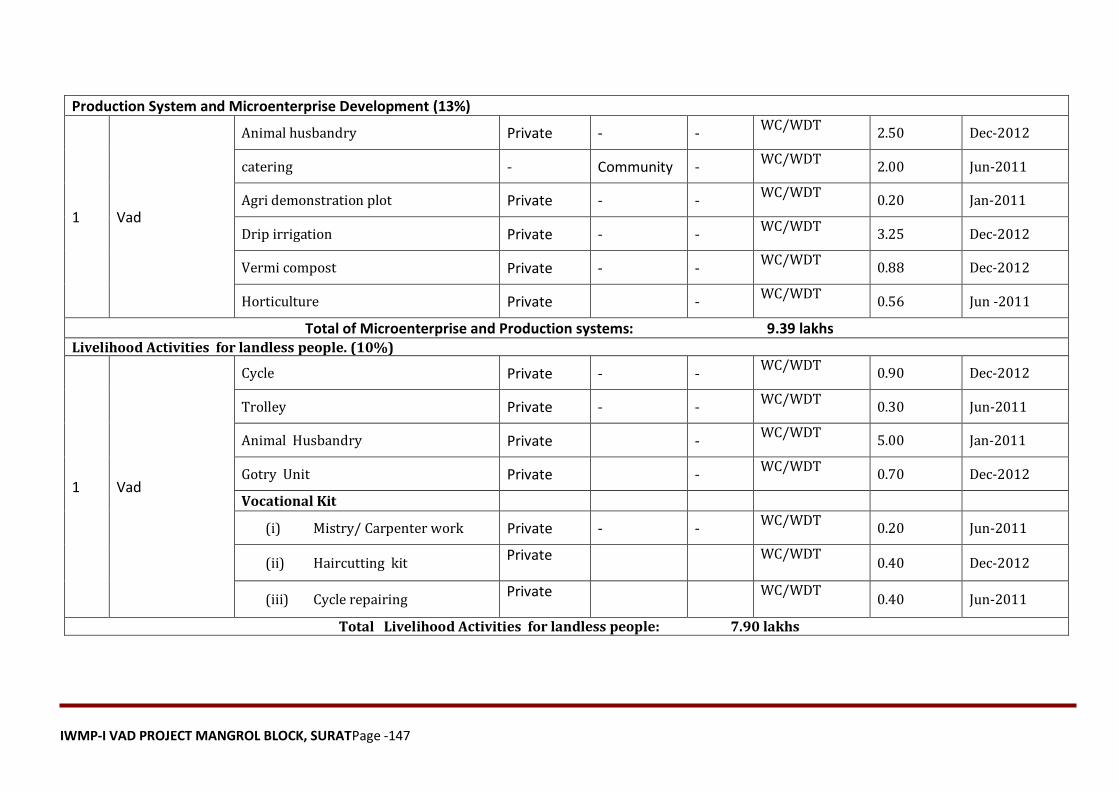
IWMP-I VAD PROJECT MANGROL BLOCK, SURATPage -147
Production System and Microenterprise Development (13%)
1 Vad
Animal husbandry Private - - WC/WDT
2.50 Dec-2012
catering - Community - WC/WDT
2.00 Jun-2011
Agri demonstration plot Private - - WC/WDT
0.20 Jan-2011
Drip irrigation Private - - WC/WDT
3.25 Dec-2012
Vermi compost Private - - WC/WDT
0.88 Dec-2012
Horticulture Private - WC/WDT
0.56 Jun -2011
Total of Microenterprise and Production systems: 9.39 lakhs
Livelihood Activities for landless people. (10%)
1 Vad
Cycle Private - - WC/WDT
0.90 Dec-2012
Trolley Private - - WC/WDT
0.30 Jun-2011
Animal Husbandry Private - WC/WDT
5.00 Jan-2011
Gotry Unit Private - WC/WDT
0.70 Dec-2012
Vocational Kit
(i) Mistry/ Carpenter work Private - - WC/WDT
0.20 Jun-2011
(ii) Haircutting kit Private
WC/WDT
0.40 Dec-2012
(iii) Cycle repairing Private
WC/WDT
0.40 Jun-2011
Total Livelihood Activities for landless people: 7.90 lakhs
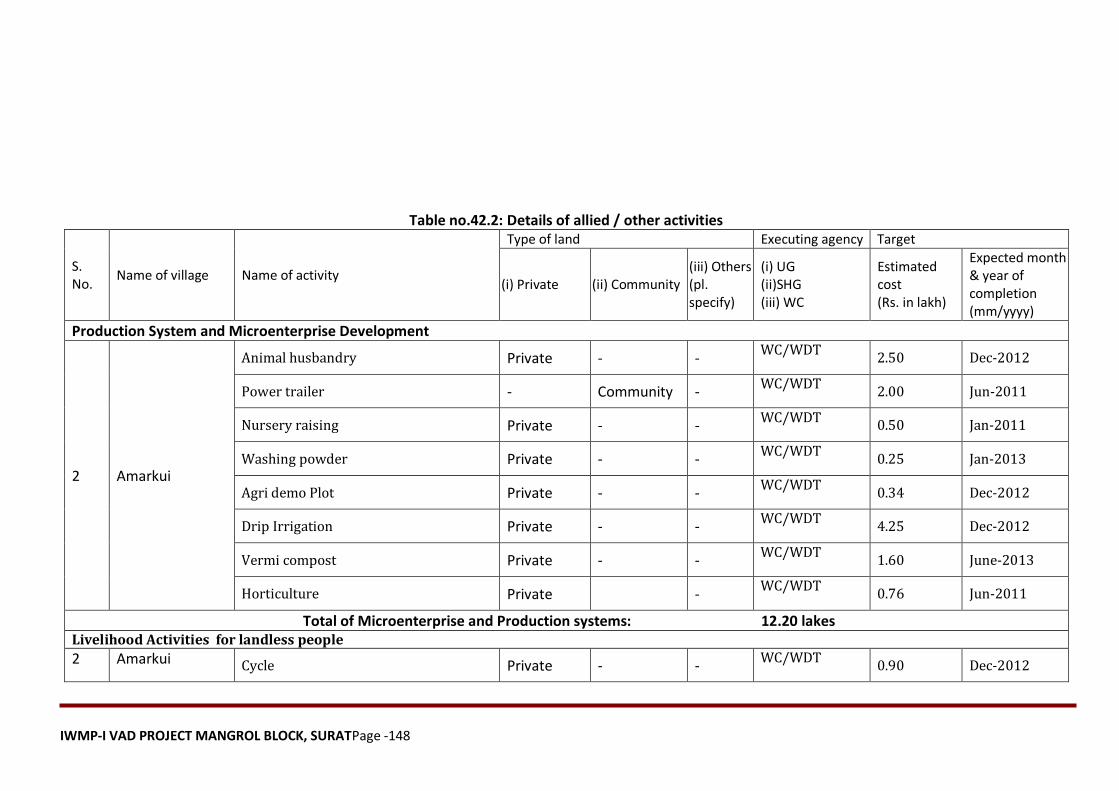
IWMP-I VAD PROJECT MANGROL BLOCK, SURATPage -148
Table no.42.2: Details of allied / other activities
S. No.
Name of village Name of activity
Type of land Executing agency Target
(i) Private (ii) Community (iii) Others (pl. specify)
(i) UG (ii)SHG (iii) WC
Estimated cost (Rs. in lakh)
Expected month & year of completion (mm/yyyy)
Production System and Microenterprise Development
2 Amarkui
Animal husbandry Private - - WC/WDT
2.50 Dec-2012
Power trailer - Community - WC/WDT
2.00 Jun-2011
Nursery raising Private - - WC/WDT
0.50 Jan-2011
Washing powder Private - - WC/WDT
0.25 Jan-2013
Agri demo Plot Private - - WC/WDT
0.34 Dec-2012
Drip Irrigation Private - - WC/WDT
4.25 Dec-2012
Vermi compost Private - - WC/WDT
1.60 June-2013
Horticulture Private - WC/WDT
0.76 Jun-2011
Total of Microenterprise and Production systems: 12.20 lakes
Livelihood Activities for landless people
2 Amarkui Cycle Private - - WC/WDT
0.90 Dec-2012
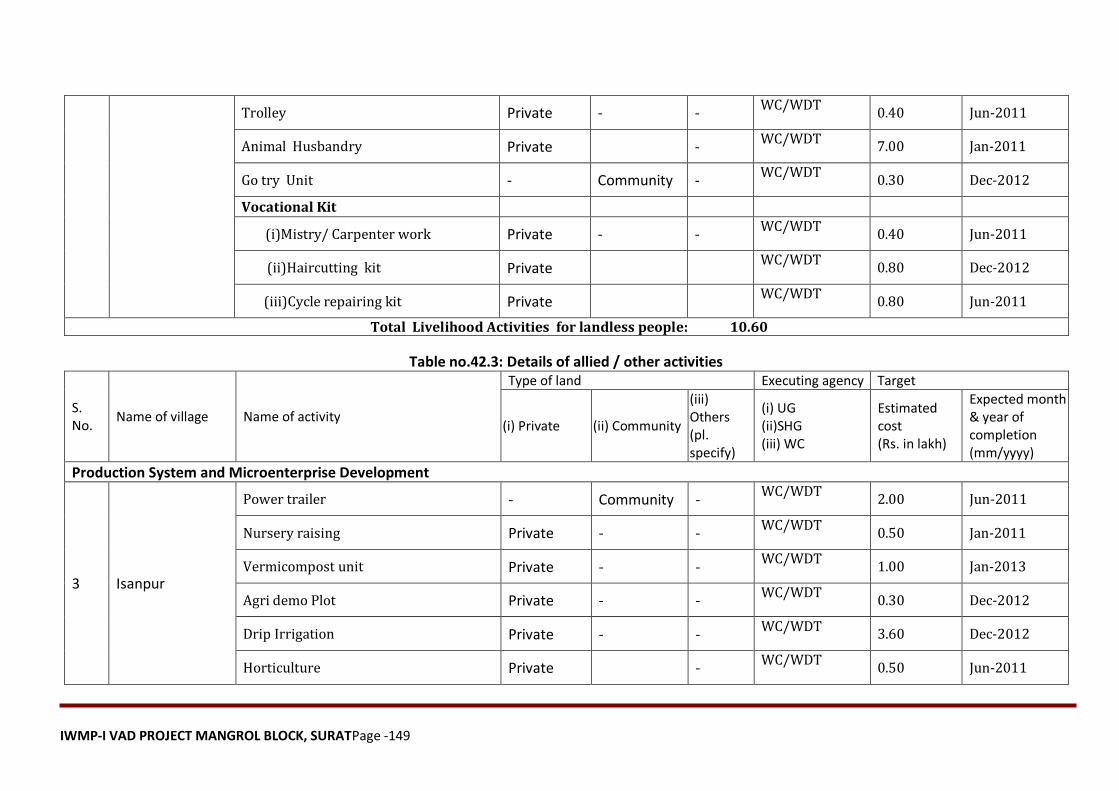
IWMP-I VAD PROJECT MANGROL BLOCK, SURATPage -149
Trolley Private - - WC/WDT
0.40 Jun-2011
Animal Husbandry Private - WC/WDT
7.00 Jan-2011
Go try Unit - Community - WC/WDT
0.30 Dec-2012
Vocational Kit
(i)Mistry/ Carpenter work Private - - WC/WDT
0.40 Jun-2011
(ii)Haircutting kit Private WC/WDT
0.80 Dec-2012
(iii)Cycle repairing kit Private WC/WDT
0.80 Jun-2011
Total Livelihood Activities for landless people: 10.60
Table no.42.3: Details of allied / other activities
S. No.
Name of village Name of activity
Type of land Executing agency Target
(i) Private (ii) Community
(iii) Others (pl. specify)
(i) UG (ii)SHG (iii) WC
Estimated cost (Rs. in lakh)
Expected month & year of completion (mm/yyyy)
Production System and Microenterprise Development
3 Isanpur
Power trailer - Community - WC/WDT
2.00 Jun-2011
Nursery raising Private - - WC/WDT
0.50 Jan-2011
Vermicompost unit Private - - WC/WDT
1.00 Jan-2013
Agri demo Plot Private - - WC/WDT
0.30 Dec-2012
Drip Irrigation Private - - WC/WDT
3.60 Dec-2012
Horticulture Private - WC/WDT
0.50 Jun-2011
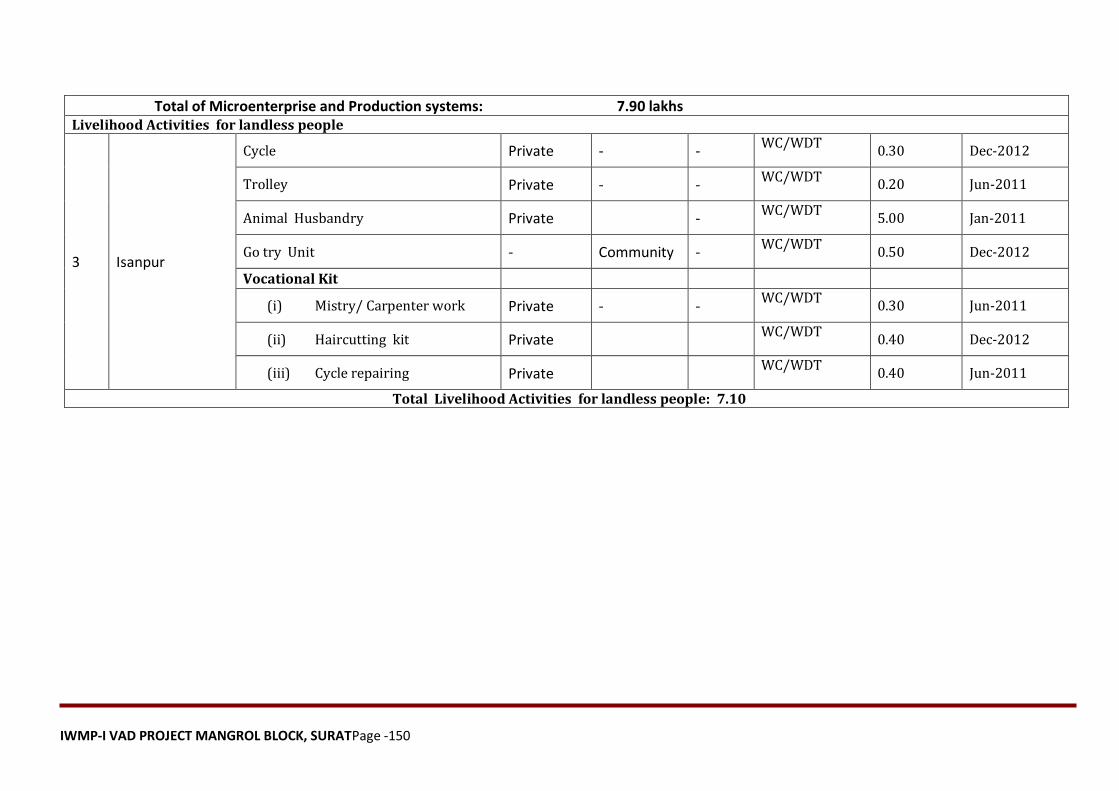
IWMP-I VAD PROJECT MANGROL BLOCK, SURATPage -150
Total of Microenterprise and Production systems: 7.90 lakhs
Livelihood Activities for landless people
3 Isanpur
Cycle Private - - WC/WDT
0.30 Dec-2012
Trolley Private - - WC/WDT
0.20 Jun-2011
Animal Husbandry Private - WC/WDT
5.00 Jan-2011
Go try Unit - Community - WC/WDT
0.50 Dec-2012
Vocational Kit
(i) Mistry/ Carpenter work Private - - WC/WDT
0.30 Jun-2011
(ii) Haircutting kit Private WC/WDT
0.40 Dec-2012
(iii) Cycle repairing Private WC/WDT
0.40 Jun-2011
Total Livelihood Activities for landless people: 7.10
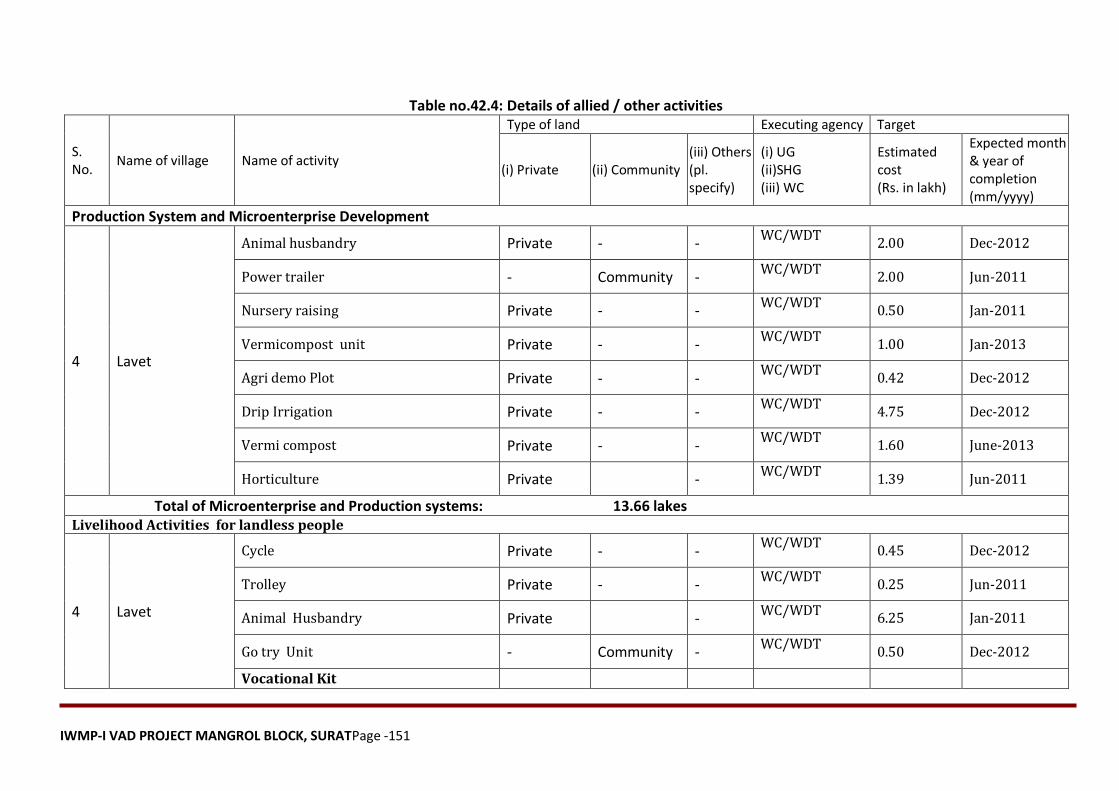
IWMP-I VAD PROJECT MANGROL BLOCK, SURATPage -151
Table no.42.4: Details of allied / other activities
S. No.
Name of village Name of activity
Type of land Executing agency Target
(i) Private (ii) Community (iii) Others (pl. specify)
(i) UG (ii)SHG (iii) WC
Estimated cost (Rs. in lakh)
Expected month & year of completion (mm/yyyy)
Production System and Microenterprise Development
4 Lavet
Animal husbandry Private - - WC/WDT
2.00 Dec-2012
Power trailer - Community - WC/WDT
2.00 Jun-2011
Nursery raising Private - - WC/WDT
0.50 Jan-2011
Vermicompost unit Private - - WC/WDT
1.00 Jan-2013
Agri demo Plot Private - - WC/WDT
0.42 Dec-2012
Drip Irrigation Private - - WC/WDT
4.75 Dec-2012
Vermi compost Private - - WC/WDT
1.60 June-2013
Horticulture Private - WC/WDT
1.39 Jun-2011
Total of Microenterprise and Production systems: 13.66 lakes Livelihood Activities for landless people
4 Lavet
Cycle Private - - WC/WDT
0.45 Dec-2012
Trolley Private - - WC/WDT
0.25 Jun-2011
Animal Husbandry Private - WC/WDT
6.25 Jan-2011
Go try Unit - Community - WC/WDT
0.50 Dec-2012
Vocational Kit
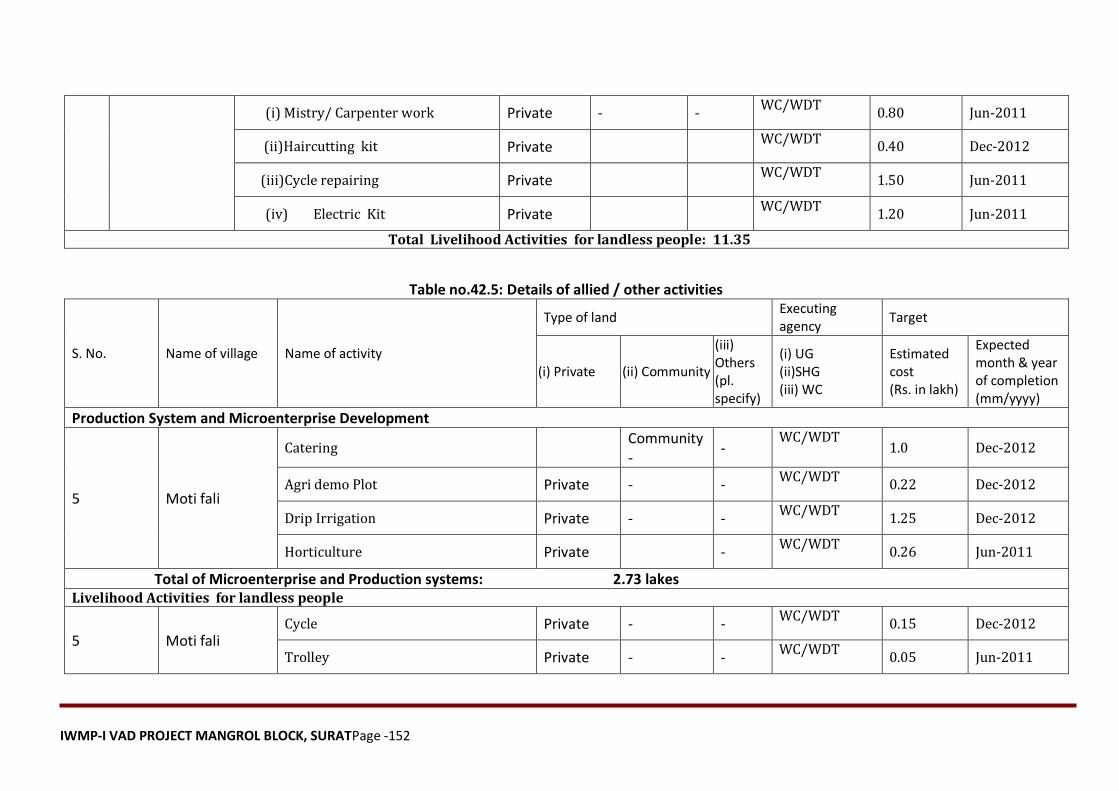
IWMP-I VAD PROJECT MANGROL BLOCK, SURATPage -152
(i) Mistry/ Carpenter work Private - - WC/WDT
0.80 Jun-2011
(ii)Haircutting kit Private WC/WDT
0.40 Dec-2012
(iii)Cycle repairing Private WC/WDT
1.50 Jun-2011
(iv) Electric Kit Private WC/WDT
1.20 Jun-2011
Total Livelihood Activities for landless people: 11.35
Table no.42.5: Details of allied / other activities
S. No. Name of village Name of activity
Type of land Executing agency
Target
(i) Private (ii) Community
(iii) Others (pl. specify)
(i) UG (ii)SHG (iii) WC
Estimated cost (Rs. in lakh)
Expected month & year of completion (mm/yyyy)
Production System and Microenterprise Development
5 Moti fali
Catering Community -
- WC/WDT
1.0 Dec-2012
Agri demo Plot Private - - WC/WDT
0.22 Dec-2012
Drip Irrigation Private - - WC/WDT
1.25 Dec-2012
Horticulture Private - WC/WDT
0.26 Jun-2011
Total of Microenterprise and Production systems: 2.73 lakes
Livelihood Activities for landless people
5 Moti fali Cycle Private - -
WC/WDT 0.15 Dec-2012
Trolley Private - - WC/WDT
0.05 Jun-2011
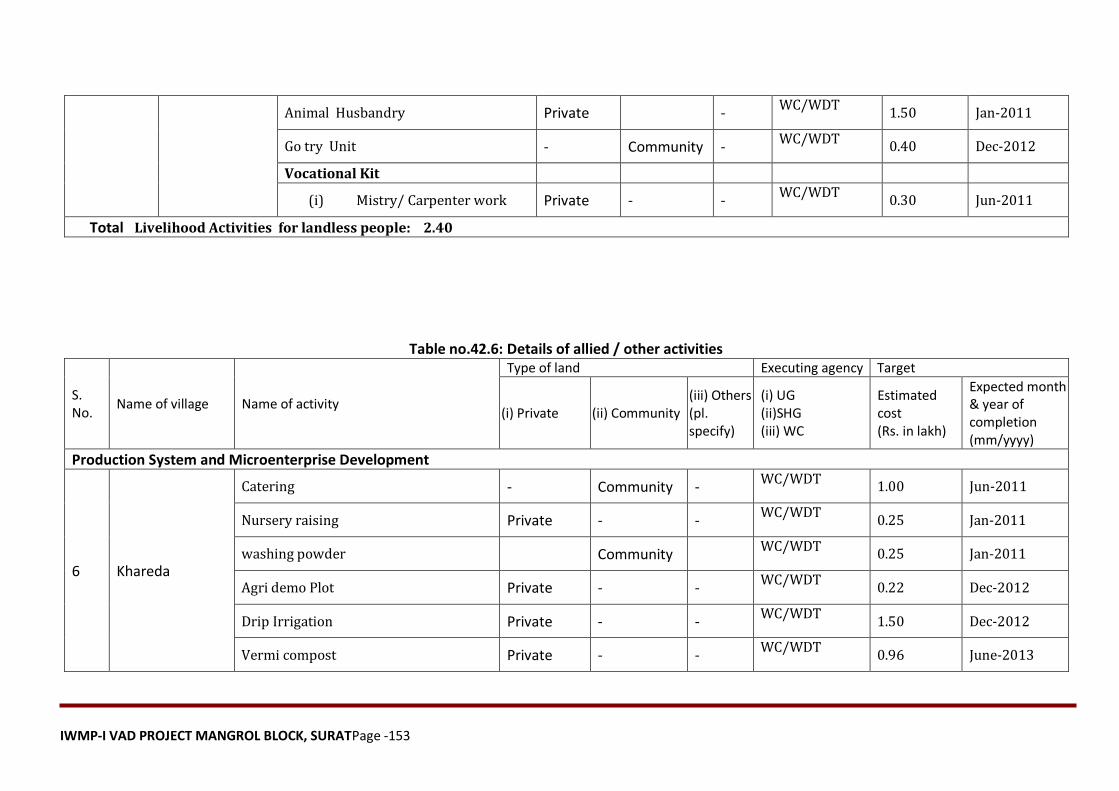
IWMP-I VAD PROJECT MANGROL BLOCK, SURATPage -153
Animal Husbandry Private - WC/WDT
1.50 Jan-2011
Go try Unit - Community - WC/WDT
0.40 Dec-2012
Vocational Kit
(i) Mistry/ Carpenter work Private - - WC/WDT
0.30 Jun-2011
Total Livelihood Activities for landless people: 2.40
Table no.42.6: Details of allied / other activities
S. No.
Name of village Name of activity
Type of land Executing agency Target
(i) Private (ii) Community (iii) Others (pl. specify)
(i) UG (ii)SHG (iii) WC
Estimated cost (Rs. in lakh)
Expected month & year of completion (mm/yyyy)
Production System and Microenterprise Development
6 Khareda
Catering - Community - WC/WDT
1.00 Jun-2011
Nursery raising Private - - WC/WDT
0.25 Jan-2011
washing powder Community WC/WDT
0.25 Jan-2011
Agri demo Plot Private - - WC/WDT
0.22 Dec-2012
Drip Irrigation Private - - WC/WDT
1.50 Dec-2012
Vermi compost Private - - WC/WDT
0.96 June-2013
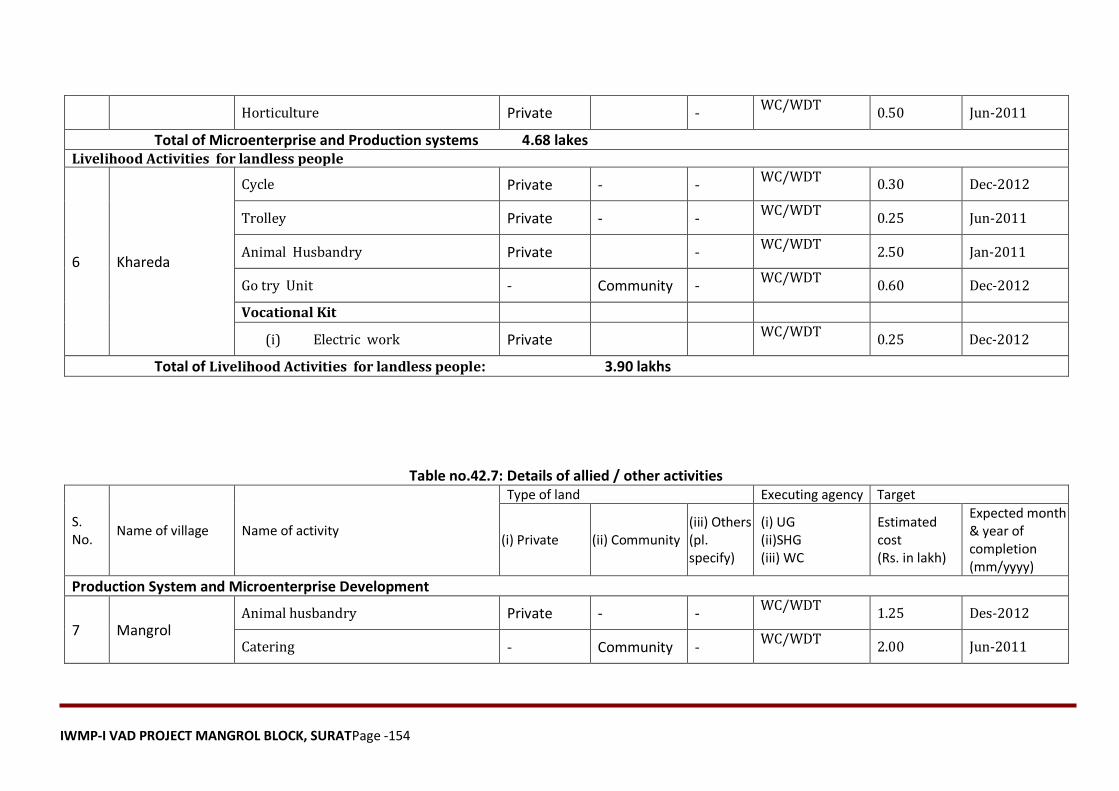
IWMP-I VAD PROJECT MANGROL BLOCK, SURATPage -154
Horticulture Private - WC/WDT
0.50 Jun-2011
Total of Microenterprise and Production systems 4.68 lakes
Livelihood Activities for landless people
6 Khareda
Cycle Private - - WC/WDT
0.30 Dec-2012
Trolley Private - - WC/WDT
0.25 Jun-2011
Animal Husbandry Private - WC/WDT
2.50 Jan-2011
Go try Unit - Community - WC/WDT
0.60 Dec-2012
Vocational Kit
(i) Electric work Private WC/WDT
0.25 Dec-2012
Total of Livelihood Activities for landless people: 3.90 lakhs
Table no.42.7: Details of allied / other activities
S. No.
Name of village Name of activity
Type of land Executing agency Target
(i) Private (ii) Community (iii) Others (pl. specify)
(i) UG (ii)SHG (iii) WC
Estimated cost (Rs. in lakh)
Expected month & year of completion (mm/yyyy)
Production System and Microenterprise Development
7 Mangrol Animal husbandry Private - -
WC/WDT 1.25 Des-2012
Catering - Community - WC/WDT
2.00 Jun-2011
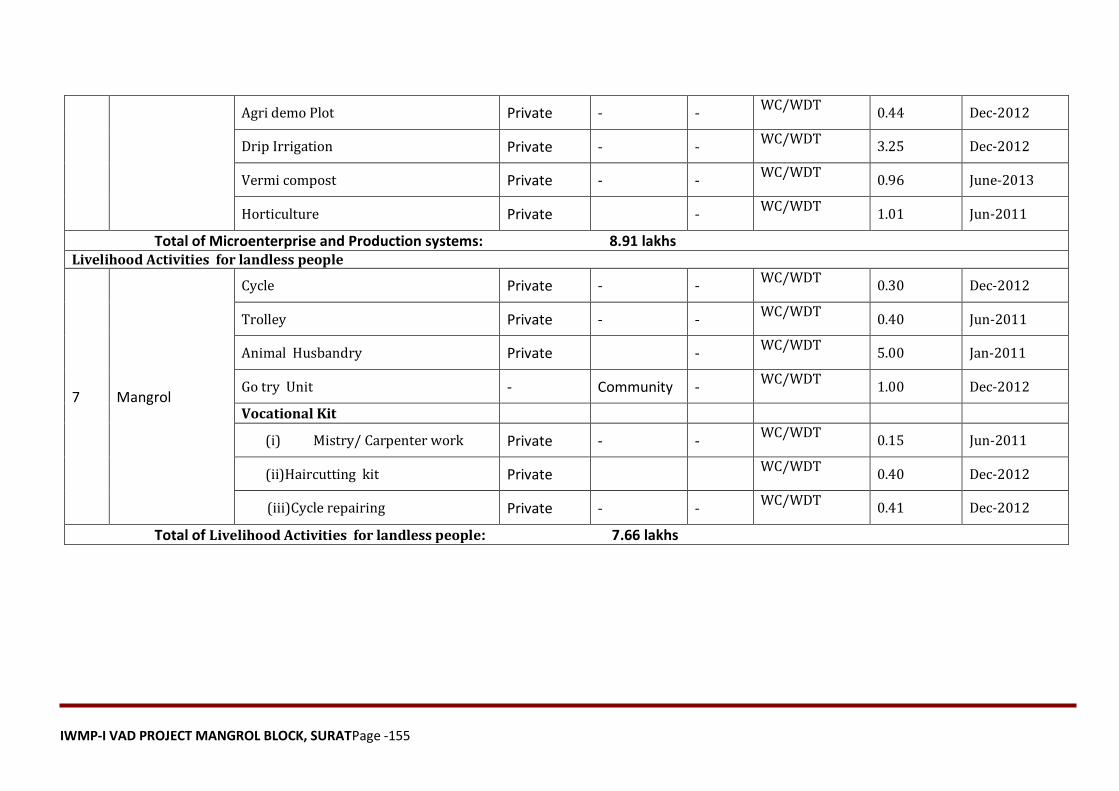
IWMP-I VAD PROJECT MANGROL BLOCK, SURATPage -155
Agri demo Plot Private - - WC/WDT
0.44 Dec-2012
Drip Irrigation Private - - WC/WDT
3.25 Dec-2012
Vermi compost Private - - WC/WDT
0.96 June-2013
Horticulture Private - WC/WDT
1.01 Jun-2011
Total of Microenterprise and Production systems: 8.91 lakhs
Livelihood Activities for landless people
7 Mangrol
Cycle Private - - WC/WDT
0.30 Dec-2012
Trolley Private - - WC/WDT
0.40 Jun-2011
Animal Husbandry Private - WC/WDT
5.00 Jan-2011
Go try Unit - Community - WC/WDT
1.00 Dec-2012
Vocational Kit
(i) Mistry/ Carpenter work Private - - WC/WDT
0.15 Jun-2011
(ii)Haircutting kit Private WC/WDT
0.40 Dec-2012
(iii)Cycle repairing Private - - WC/WDT
0.41 Dec-2012
Total of Livelihood Activities for landless people: 7.66 lakhs
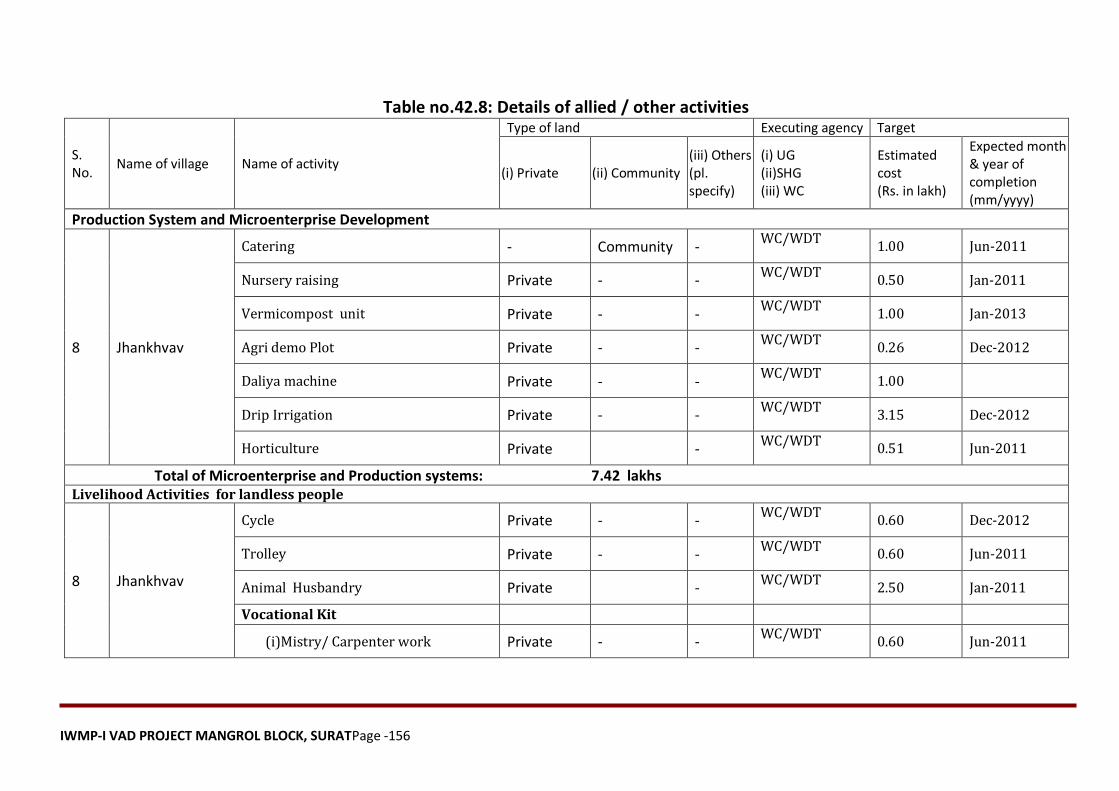
IWMP-I VAD PROJECT MANGROL BLOCK, SURATPage -156
Table no.42.8: Details of allied / other activities
S. No.
Name of village Name of activity
Type of land Executing agency Target
(i) Private (ii) Community (iii) Others (pl. specify)
(i) UG (ii)SHG (iii) WC
Estimated cost (Rs. in lakh)
Expected month & year of completion (mm/yyyy)
Production System and Microenterprise Development
8 Jhankhvav
Catering - Community - WC/WDT
1.00 Jun-2011
Nursery raising Private - - WC/WDT
0.50 Jan-2011
Vermicompost unit Private - - WC/WDT
1.00 Jan-2013
Agri demo Plot Private - - WC/WDT
0.26 Dec-2012
Daliya machine Private - - WC/WDT
1.00
Drip Irrigation Private - - WC/WDT
3.15 Dec-2012
Horticulture Private - WC/WDT
0.51 Jun-2011
Total of Microenterprise and Production systems: 7.42 lakhs
Livelihood Activities for landless people
8 Jhankhvav
Cycle Private - - WC/WDT
0.60 Dec-2012
Trolley Private - - WC/WDT
0.60 Jun-2011
Animal Husbandry Private - WC/WDT
2.50 Jan-2011
Vocational Kit
(i)Mistry/ Carpenter work Private - - WC/WDT
0.60 Jun-2011
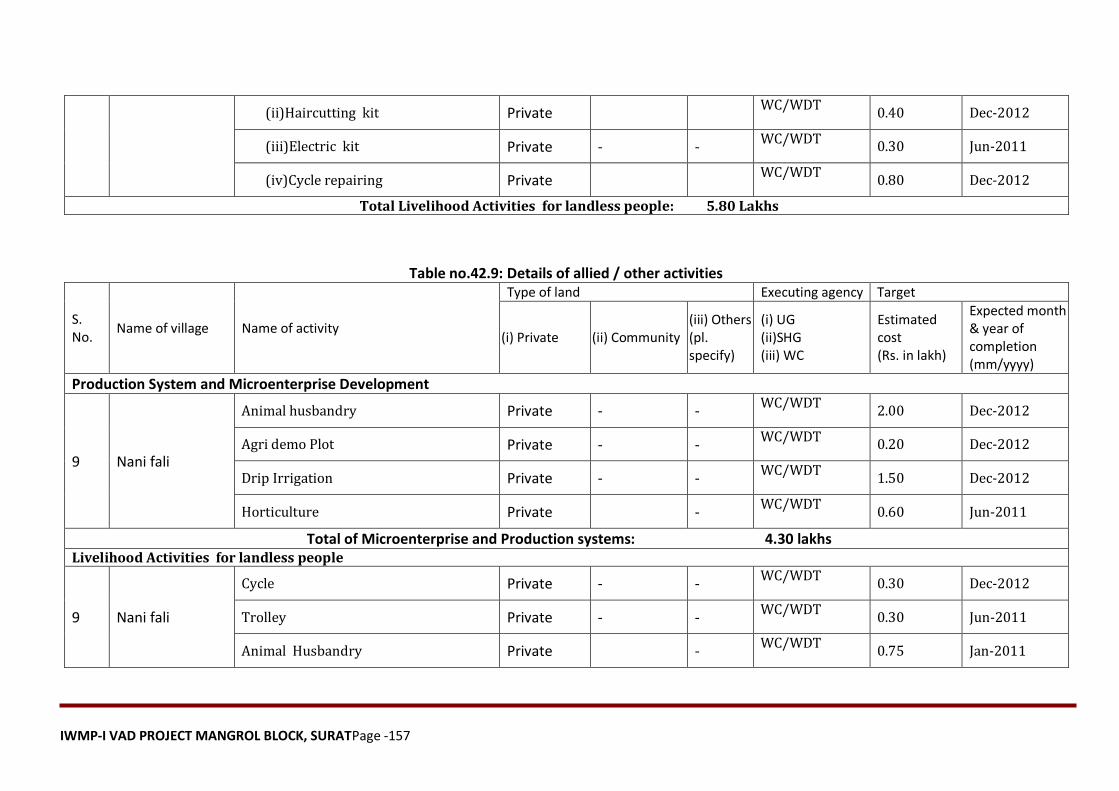
IWMP-I VAD PROJECT MANGROL BLOCK, SURATPage -157
(ii)Haircutting kit Private WC/WDT
0.40 Dec-2012
(iii)Electric kit Private - - WC/WDT
0.30 Jun-2011
(iv)Cycle repairing Private WC/WDT
0.80 Dec-2012
Total Livelihood Activities for landless people: 5.80 Lakhs
Table no.42.9: Details of allied / other activities
S. No.
Name of village Name of activity
Type of land Executing agency Target
(i) Private (ii) Community (iii) Others (pl. specify)
(i) UG (ii)SHG (iii) WC
Estimated cost (Rs. in lakh)
Expected month & year of completion (mm/yyyy)
Production System and Microenterprise Development
9 Nani fali
Animal husbandry Private - - WC/WDT
2.00 Dec-2012
Agri demo Plot Private - - WC/WDT
0.20 Dec-2012
Drip Irrigation Private - - WC/WDT
1.50 Dec-2012
Horticulture Private - WC/WDT
0.60 Jun-2011
Total of Microenterprise and Production systems: 4.30 lakhs
Livelihood Activities for landless people
9 Nani fali
Cycle Private - - WC/WDT
0.30 Dec-2012
Trolley Private - - WC/WDT
0.30 Jun-2011
Animal Husbandry Private - WC/WDT
0.75 Jan-2011
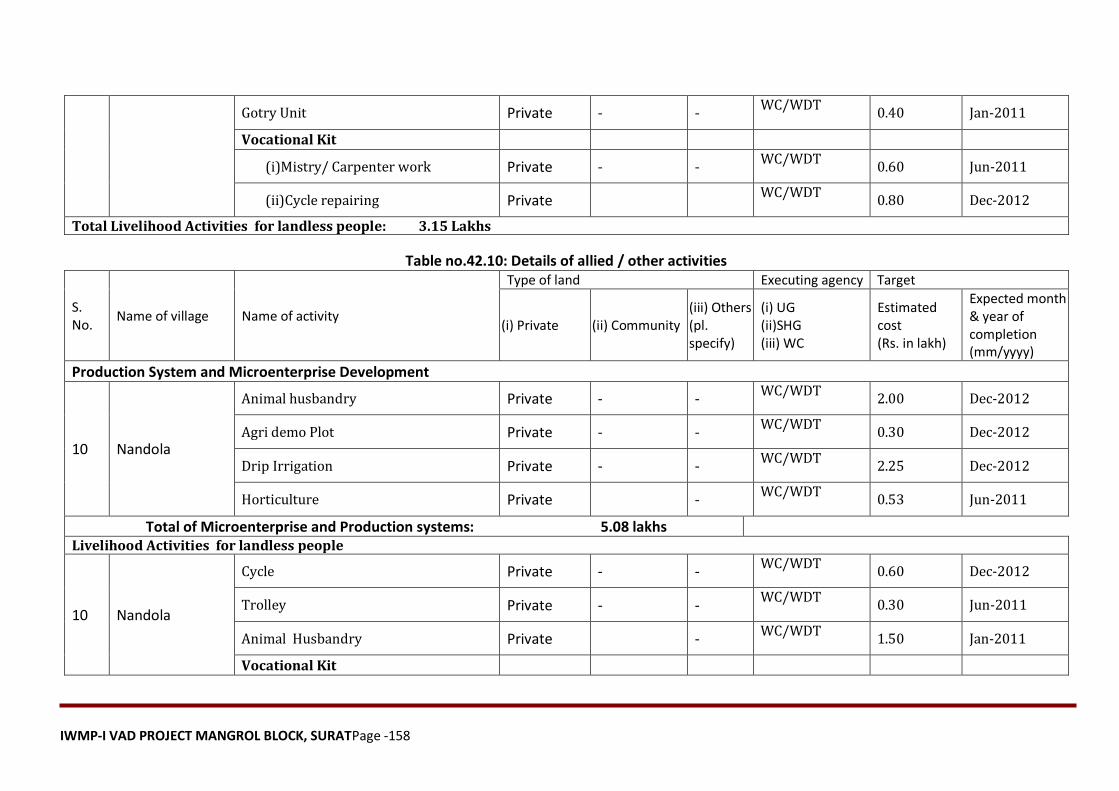
IWMP-I VAD PROJECT MANGROL BLOCK, SURATPage -158
Gotry Unit Private - - WC/WDT
0.40 Jan-2011
Vocational Kit
(i)Mistry/ Carpenter work Private - - WC/WDT
0.60 Jun-2011
(ii)Cycle repairing Private WC/WDT
0.80 Dec-2012
Total Livelihood Activities for landless people: 3.15 Lakhs
Table no.42.10: Details of allied / other activities
S. No.
Name of village Name of activity
Type of land Executing agency Target
(i) Private (ii) Community (iii) Others (pl. specify)
(i) UG (ii)SHG (iii) WC
Estimated cost (Rs. in lakh)
Expected month & year of completion (mm/yyyy)
Production System and Microenterprise Development
10 Nandola
Animal husbandry Private - - WC/WDT
2.00 Dec-2012
Agri demo Plot Private - - WC/WDT
0.30 Dec-2012
Drip Irrigation Private - - WC/WDT
2.25 Dec-2012
Horticulture Private - WC/WDT
0.53 Jun-2011
Total of Microenterprise and Production systems: 5.08 lakhs Livelihood Activities for landless people
10 Nandola
Cycle Private - - WC/WDT
0.60 Dec-2012
Trolley Private - - WC/WDT
0.30 Jun-2011
Animal Husbandry Private - WC/WDT
1.50 Jan-2011
Vocational Kit
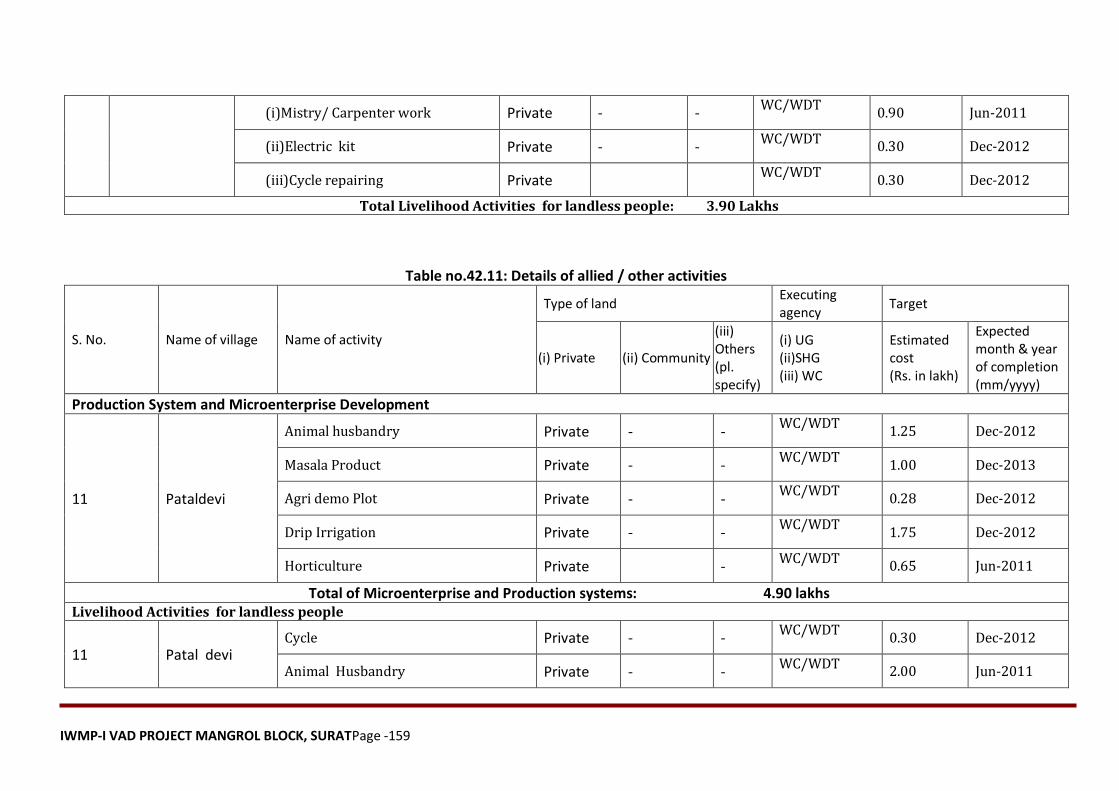
IWMP-I VAD PROJECT MANGROL BLOCK, SURATPage -159
(i)Mistry/ Carpenter work Private - - WC/WDT
0.90 Jun-2011
(ii)Electric kit Private - - WC/WDT
0.30 Dec-2012
(iii)Cycle repairing Private WC/WDT
0.30 Dec-2012
Total Livelihood Activities for landless people: 3.90 Lakhs
Table no.42.11: Details of allied / other activities
S. No. Name of village Name of activity
Type of land Executing agency
Target
(i) Private (ii) Community
(iii) Others (pl. specify)
(i) UG (ii)SHG (iii) WC
Estimated cost (Rs. in lakh)
Expected month & year of completion (mm/yyyy)
Production System and Microenterprise Development
11 Pataldevi
Animal husbandry Private - - WC/WDT
1.25 Dec-2012
Masala Product Private - - WC/WDT
1.00 Dec-2013
Agri demo Plot Private - - WC/WDT
0.28 Dec-2012
Drip Irrigation Private - - WC/WDT
1.75 Dec-2012
Horticulture Private - WC/WDT
0.65 Jun-2011
Total of Microenterprise and Production systems: 4.90 lakhs
Livelihood Activities for landless people
11 Patal devi Cycle Private - -
WC/WDT 0.30 Dec-2012
Animal Husbandry Private - - WC/WDT
2.00 Jun-2011
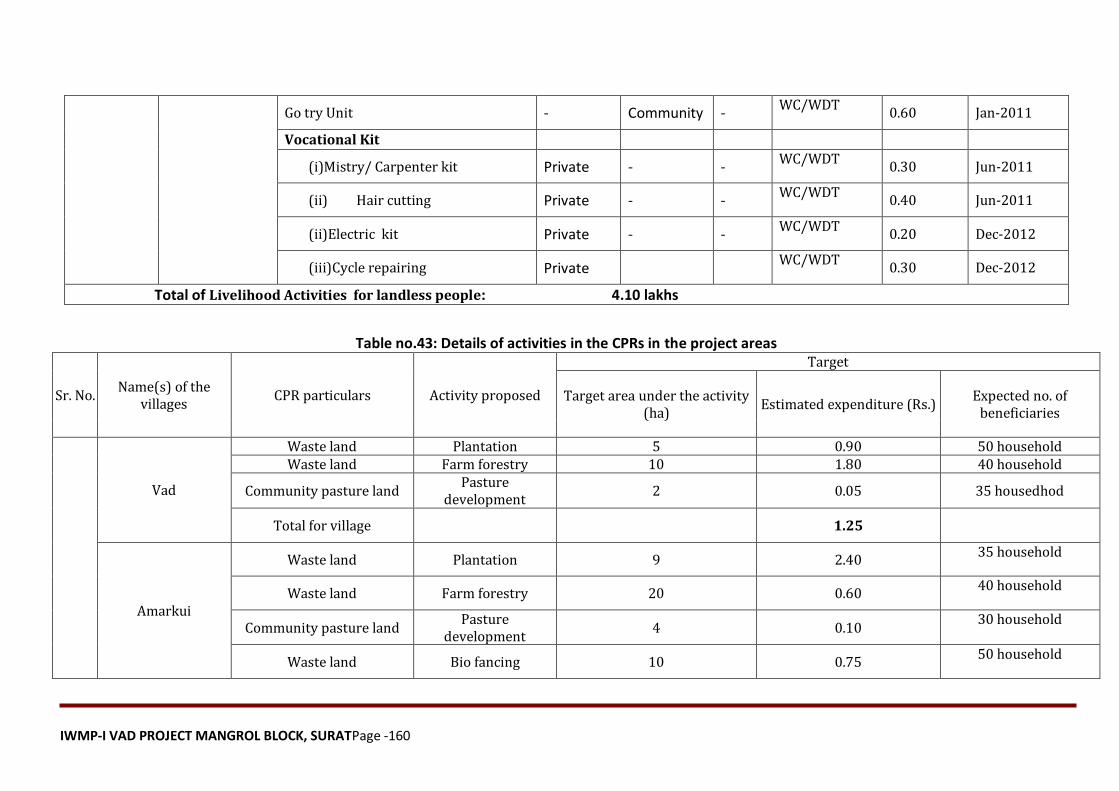
IWMP-I VAD PROJECT MANGROL BLOCK, SURATPage -160
Go try Unit - Community - WC/WDT
0.60 Jan-2011
Vocational Kit
(i)Mistry/ Carpenter kit Private - - WC/WDT
0.30 Jun-2011
(ii) Hair cutting Private - - WC/WDT
0.40 Jun-2011
(ii)Electric kit Private - - WC/WDT
0.20 Dec-2012
(iii)Cycle repairing Private WC/WDT
0.30 Dec-2012
Total of Livelihood Activities for landless people: 4.10 lakhs
Table no.43: Details of activities in the CPRs in the project areas
Sr. No. Name(s) of the
villages CPR particulars Activity proposed
Target
Target area under the activity (ha)
Estimated expenditure (Rs.) Expected no. of
beneficiaries
Vad
Waste land Plantation 5 0.90 50 household Waste land Farm forestry 10 1.80 40 household
Community pasture land Pasture
development 2 0.05 35 housedhod
Total for village 1.25
Amarkui
Waste land Plantation 9 2.40 35 household
Waste land Farm forestry 20 0.60 40 household
Community pasture land Pasture
development 4 0.10
30 household
Waste land Bio fancing 10 0.75 50 household
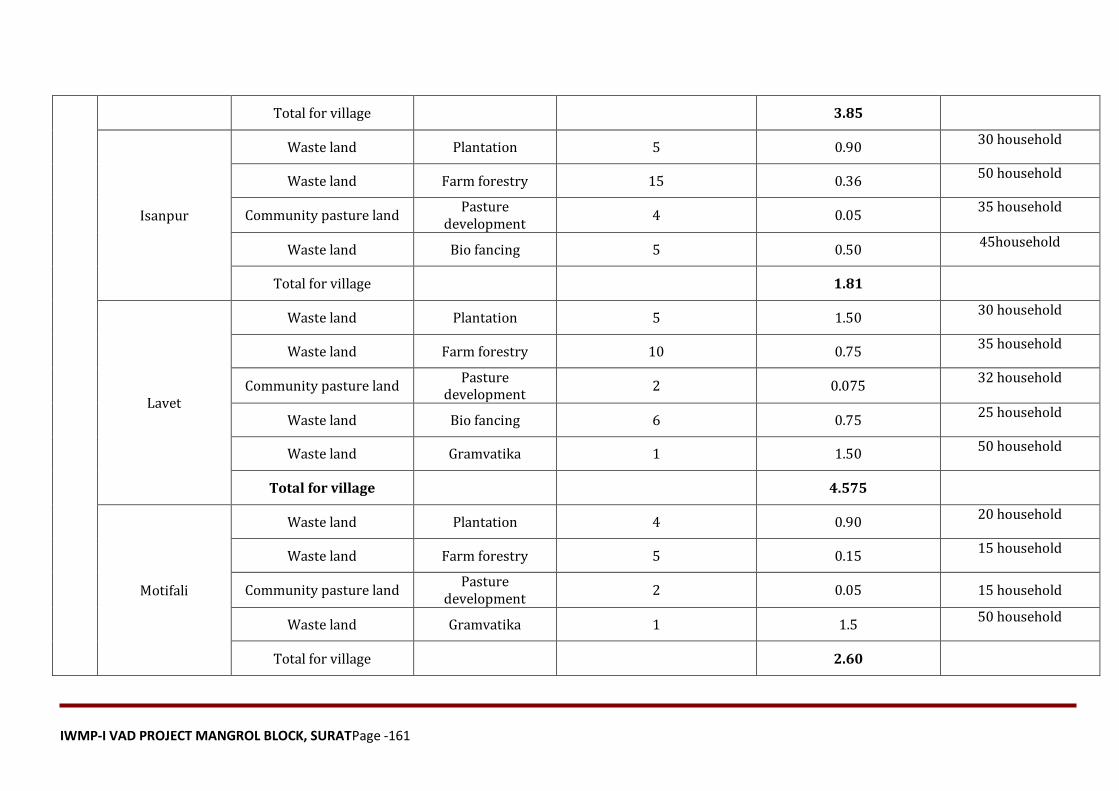
IWMP-I VAD PROJECT MANGROL BLOCK, SURATPage -161
Total for village 3.85
Isanpur
Waste land Plantation 5 0.90 30 household
Waste land Farm forestry 15 0.36 50 household
Community pasture land Pasture
development 4 0.05
35 household
Waste land Bio fancing 5 0.50 45household
Total for village 1.81
Lavet
Waste land Plantation 5 1.50 30 household
Waste land Farm forestry 10 0.75 35 household
Community pasture land Pasture
development 2 0.075
32 household
Waste land Bio fancing 6 0.75 25 household
Waste land Gramvatika 1 1.50 50 household
Total for village 4.575
Motifali
Waste land Plantation 4 0.90 20 household
Waste land Farm forestry 5 0.15 15 household
Community pasture land Pasture
development 2 0.05 15 household
Waste land Gramvatika 1 1.5 50 household
Total for village 2.60
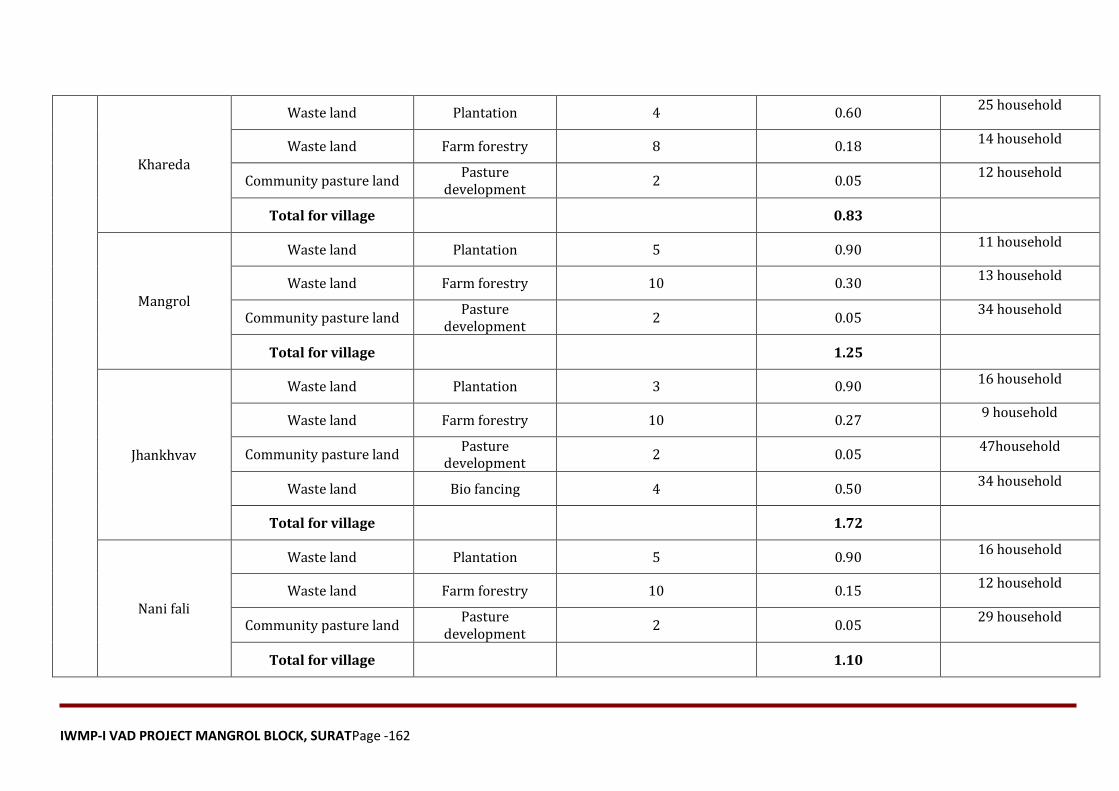
IWMP-I VAD PROJECT MANGROL BLOCK, SURATPage -162
Khareda
Waste land Plantation 4 0.60 25 household
Waste land Farm forestry 8 0.18 14 household
Community pasture land Pasture
development 2 0.05
12 household
Total for village 0.83
Mangrol
Waste land Plantation 5 0.90 11 household
Waste land Farm forestry 10 0.30 13 household
Community pasture land Pasture
development 2 0.05
34 household
Total for village 1.25
Jhankhvav
Waste land Plantation 3 0.90 16 household
Waste land Farm forestry 10 0.27 9 household
Community pasture land Pasture
development 2 0.05
47household
Waste land Bio fancing 4 0.50 34 household
Total for village 1.72
Nani fali
Waste land Plantation 5 0.90 16 household
Waste land Farm forestry 10 0.15 12 household
Community pasture land Pasture
development 2 0.05
29 household
Total for village 1.10
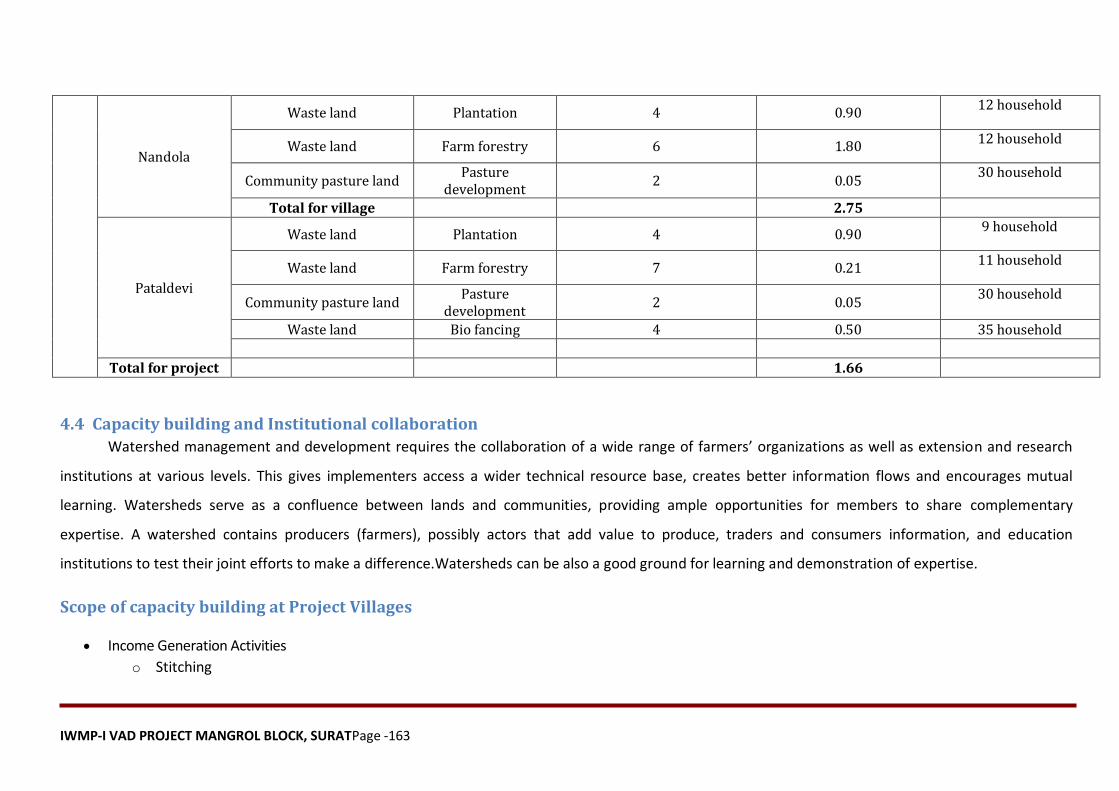
IWMP-I VAD PROJECT MANGROL BLOCK, SURATPage -163
Nandola
Waste land Plantation 4 0.90 12 household
Waste land Farm forestry 6 1.80 12 household
Community pasture land Pasture
development 2 0.05
30 household
Total for village 2.75
Pataldevi
Waste land Plantation 4 0.90 9 household
Waste land Farm forestry 7 0.21 11 household
Community pasture land Pasture
development 2 0.05
30 household
Waste land Bio fancing 4 0.50 35 household
Total for project 1.66
4.4 Capacity building and Institutional collaboration
Watershed management and development requires the collaboration of a wide range of farmers’ organizations as well as extension and research
institutions at various levels. This gives implementers access a wider technical resource base, creates better information flows and encourages mutual
learning. Watersheds serve as a confluence between lands and communities, providing ample opportunities for members to share complementary
expertise. A watershed contains producers (farmers), possibly actors that add value to produce, traders and consumers information, and education
institutions to test their joint efforts to make a difference.Watersheds can be also a good ground for learning and demonstration of expertise.
Scope of capacity building at Project Villages
Income Generation Activities
o Stitching
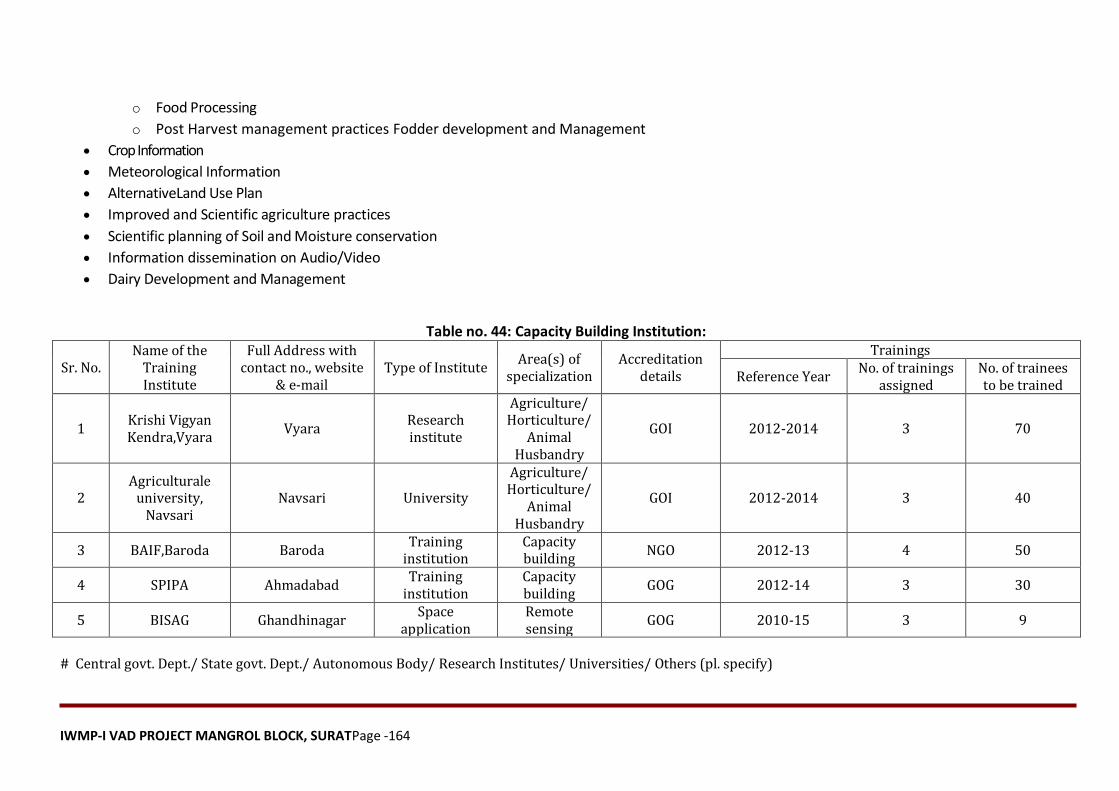
IWMP-I VAD PROJECT MANGROL BLOCK, SURATPage -164
o Food Processing
o Post Harvest management practices Fodder development and Management
Crop Information
Meteorological Information
AlternativeLand Use Plan
Improved and Scientific agriculture practices
Scientific planning of Soil and Moisture conservation
Information dissemination on Audio/Video
Dairy Development and Management
Table no. 44: Capacity Building Institution:
Sr. No. Name of the
Training Institute
Full Address with contact no., website
& e-mail Type of Institute
Area(s) of specialization
Accreditation details
Trainings
Reference Year No. of trainings
assigned No. of trainees to be trained
1 Krishi Vigyan Kendra,Vyara
Vyara Research institute
Agriculture/ Horticulture/
Animal Husbandry
GOI 2012-2014 3 70
2 Agriculturale
university, Navsari
Navsari University
Agriculture/ Horticulture/
Animal Husbandry
GOI 2012-2014 3 40
3 BAIF,Baroda Baroda Training
institution Capacity building
NGO 2012-13 4 50
4 SPIPA Ahmadabad Training
institution Capacity building
GOG 2012-14 3 30
5 BISAG Ghandhinagar Space
application Remote sensing
GOG 2010-15 3 9
# Central govt. Dept./ State govt. Dept./ Autonomous Body/ Research Institutes/ Universities/ Others (pl. specify)
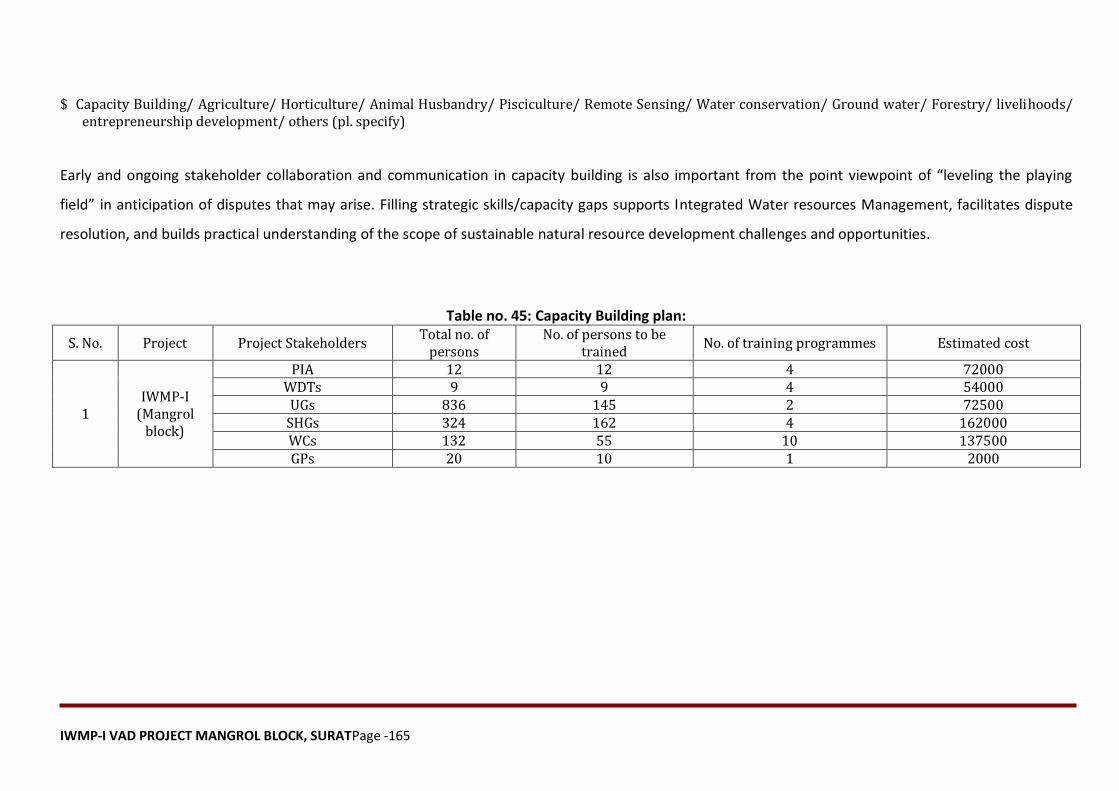
IWMP-I VAD PROJECT MANGROL BLOCK, SURATPage -165
$ Capacity Building/ Agriculture/ Horticulture/ Animal Husbandry/ Pisciculture/ Remote Sensing/ Water conservation/ Ground water/ Forestry/ livelihoods/ entrepreneurship development/ others (pl. specify)
Early and ongoing stakeholder collaboration and communication in capacity building is also important from the point viewpoint of “leveling the playing
field” in anticipation of disputes that may arise. Filling strategic skills/capacity gaps supports Integrated Water resources Management, facilitates dispute
resolution, and builds practical understanding of the scope of sustainable natural resource development challenges and opportunities.
Table no. 45: Capacity Building plan:
S. No. Project Project Stakeholders Total no. of
persons No. of persons to be
trained No. of training programmes Estimated cost
1 IWMP-I
(Mangrol block)
PIA 12 12 4 72000 WDTs 9 9 4 54000
UGs 836 145 2 72500 SHGs 324 162 4 162000 WCs 132 55 10 137500 GPs 20 10 1 2000
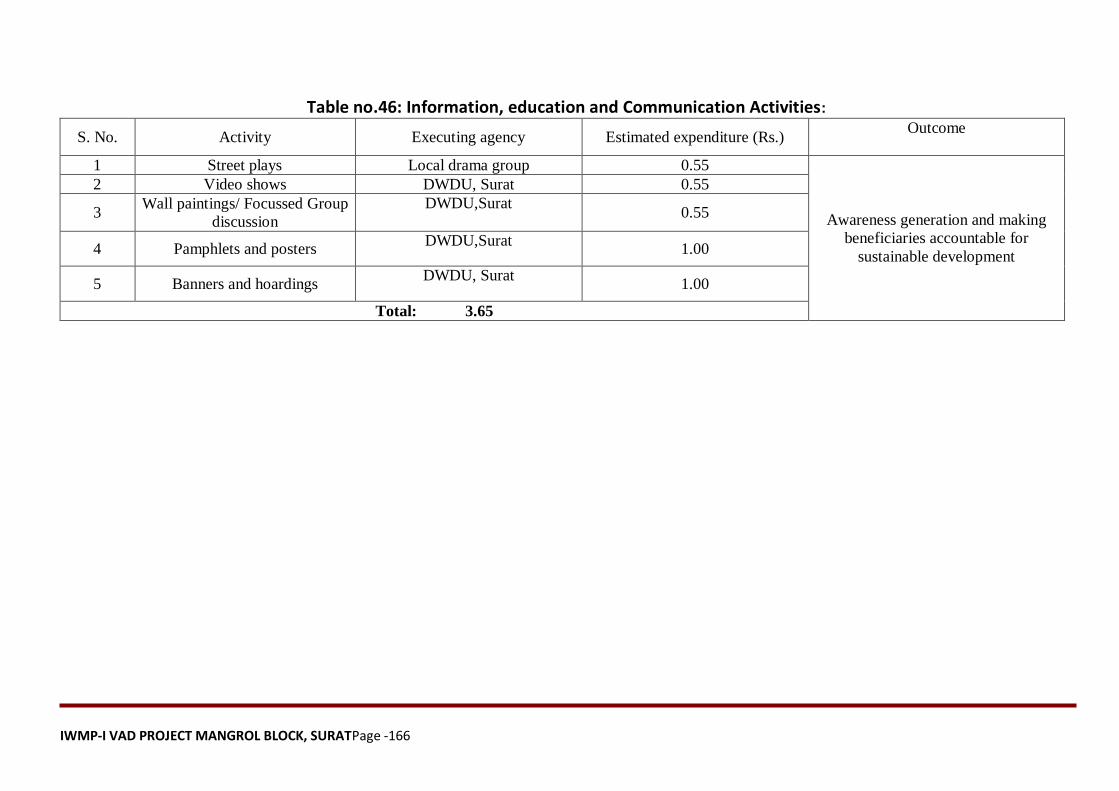
IWMP-I VAD PROJECT MANGROL BLOCK, SURATPage -166
Table no.46: Information, education and Communication Activities:
S. No. Activity Executing agency Estimated expenditure (Rs.) Outcome
1 Street plays Local drama group 0.55
Awareness generation and making
beneficiaries accountable for
sustainable development
2 Video shows DWDU, Surat 0.55
3 Wall paintings/ Focussed Group
discussion
DWDU,Surat 0.55
4 Pamphlets and posters DWDU,Surat
1.00
5 Banners and hoardings DWDU, Surat
1.00
Total: 3.65
IWMP-I VAD PROJECT MANGROL BLOCK, SURATPage -167
CHAPTER-5 BUDGETING
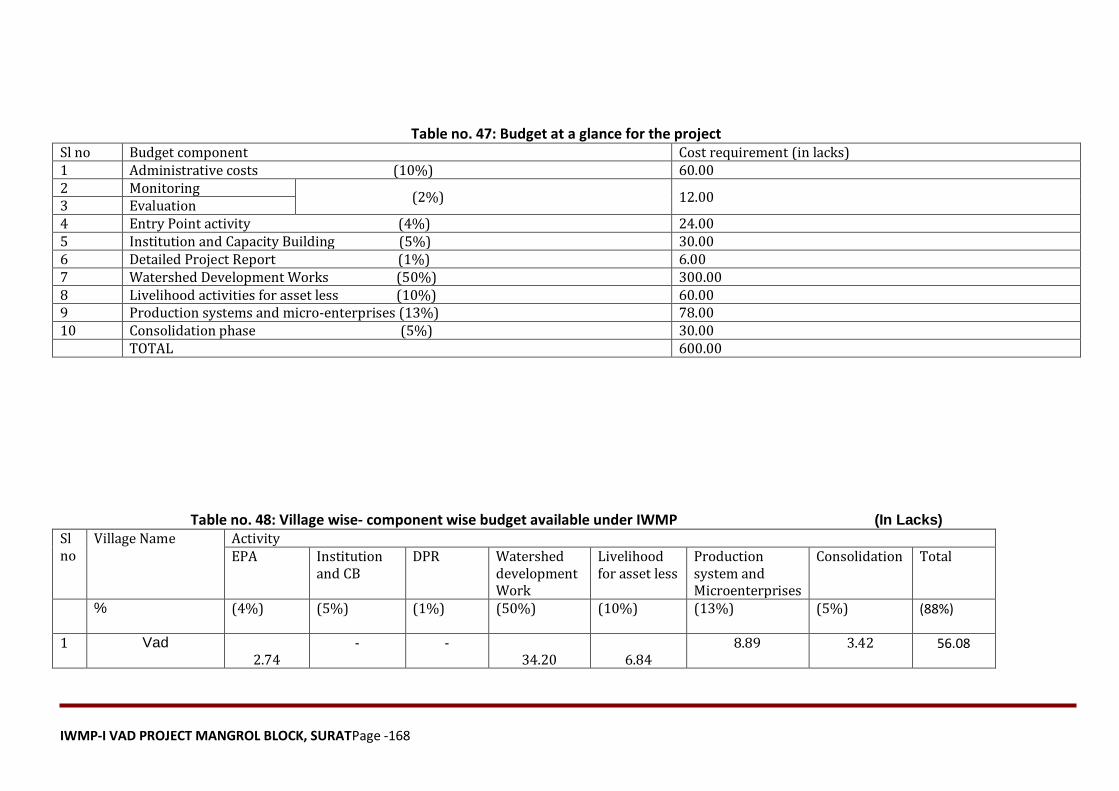
IWMP-I VAD PROJECT MANGROL BLOCK, SURATPage -168
Table no. 47: Budget at a glance for the project Sl no Budget component Cost requirement (in lacks) 1 Administrative costs (10%) 60.00 2 Monitoring
(2%) 12.00 3 Evaluation 4 Entry Point activity (4%) 24.00 5 Institution and Capacity Building (5%) 30.00 6 Detailed Project Report (1%) 6.00 7 Watershed Development Works (50%) 300.00 8 Livelihood activities for asset less (10%) 60.00 9 Production systems and micro-enterprises (13%) 78.00 10 Consolidation phase (5%) 30.00 TOTAL 600.00
Table no. 48: Village wise- component wise budget available under IWMP (In Lacks)
Sl no
Village Name Activity EPA Institution
and CB DPR Watershed
development Work
Livelihood for asset less
Production system and Microenterprises
Consolidation Total
% (4%) (5%) (1%) (50%) (10%) (13%) (5%) (88%)
1 Vad
2.74 - -
34.20 6.84 8.89 3.42 56.08
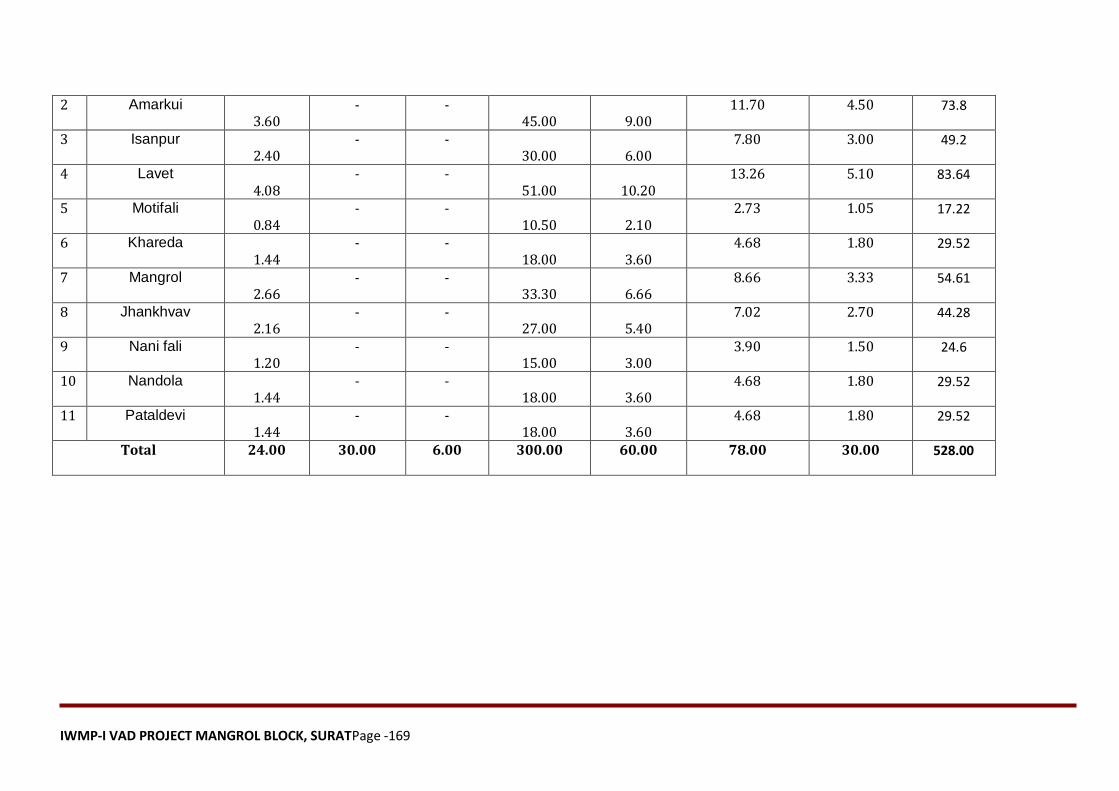
IWMP-I VAD PROJECT MANGROL BLOCK, SURATPage -169
2 Amarkui 3.60
- - 45.00 9.00
11.70 4.50 73.8
3 Isanpur 2.40
- - 30.00 6.00
7.80 3.00 49.2
4 Lavet
4.08 - -
51.00 10.20 13.26 5.10 83.64
5 Motifali
0.84 - -
10.50 2.10 2.73 1.05 17.22
6 Khareda
1.44 - -
18.00 3.60 4.68 1.80 29.52
7 Mangrol 2.66
- - 33.30 6.66
8.66 3.33 54.61
8 Jhankhvav 2.16
- - 27.00 5.40
7.02 2.70 44.28
9 Nani fali 1.20
- - 15.00 3.00
3.90 1.50 24.6
10 Nandola 1.44
- - 18.00 3.60
4.68 1.80 29.52
11 Pataldevi 1.44
- - 18.00 3.60
4.68 1.80 29.52
Total 24.00 30.00 6.00 300.00 60.00 78.00 30.00 528.00
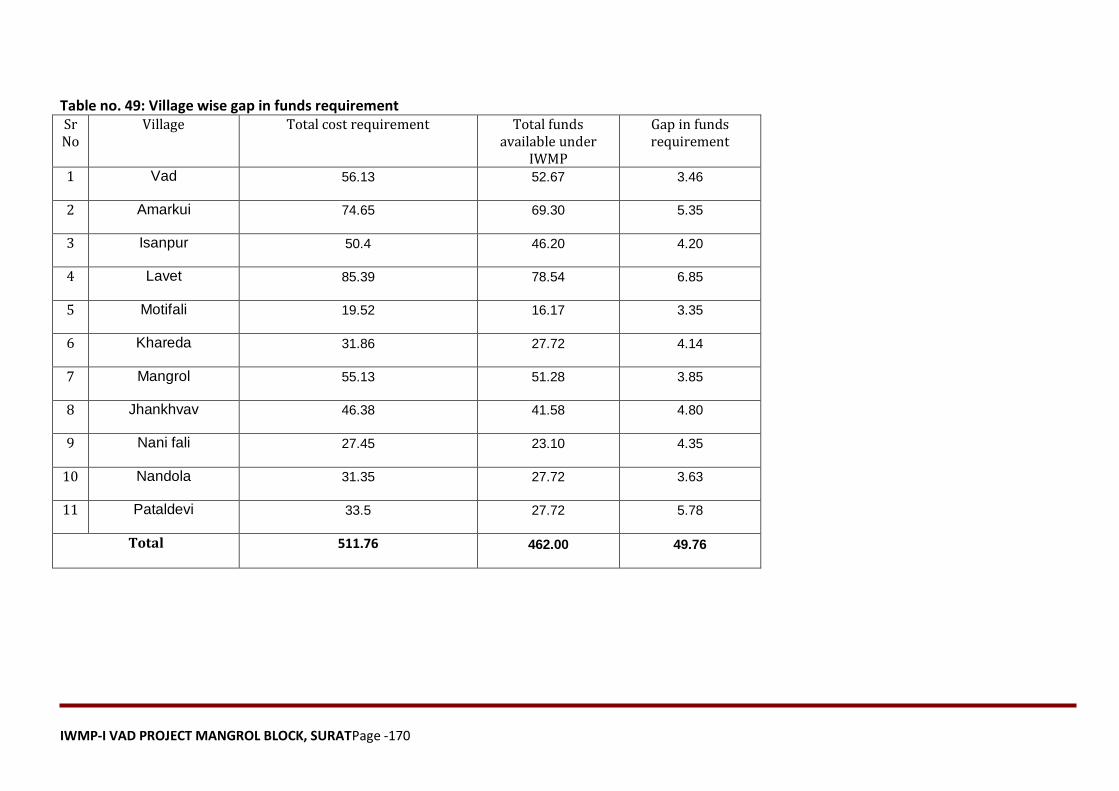
IWMP-I VAD PROJECT MANGROL BLOCK, SURATPage -170
Table no. 49: Village wise gap in funds requirement Sr No
Village Total cost requirement Total funds available under
IWMP
Gap in funds requirement
1 Vad 56.13 52.67 3.46
2 Amarkui 74.65 69.30 5.35
3 Isanpur 50.4 46.20 4.20
4 Lavet 85.39 78.54 6.85
5 Motifali 19.52 16.17 3.35
6 Khareda 31.86 27.72 4.14
7 Mangrol 55.13 51.28 3.85
8 Jhankhvav 46.38 41.58 4.80
9 Nani fali 27.45 23.10 4.35
10 Nandola 31.35 27.72 3.63
11 Pataldevi 33.5 27.72 5.78
Total 511.76 462.00 49.76
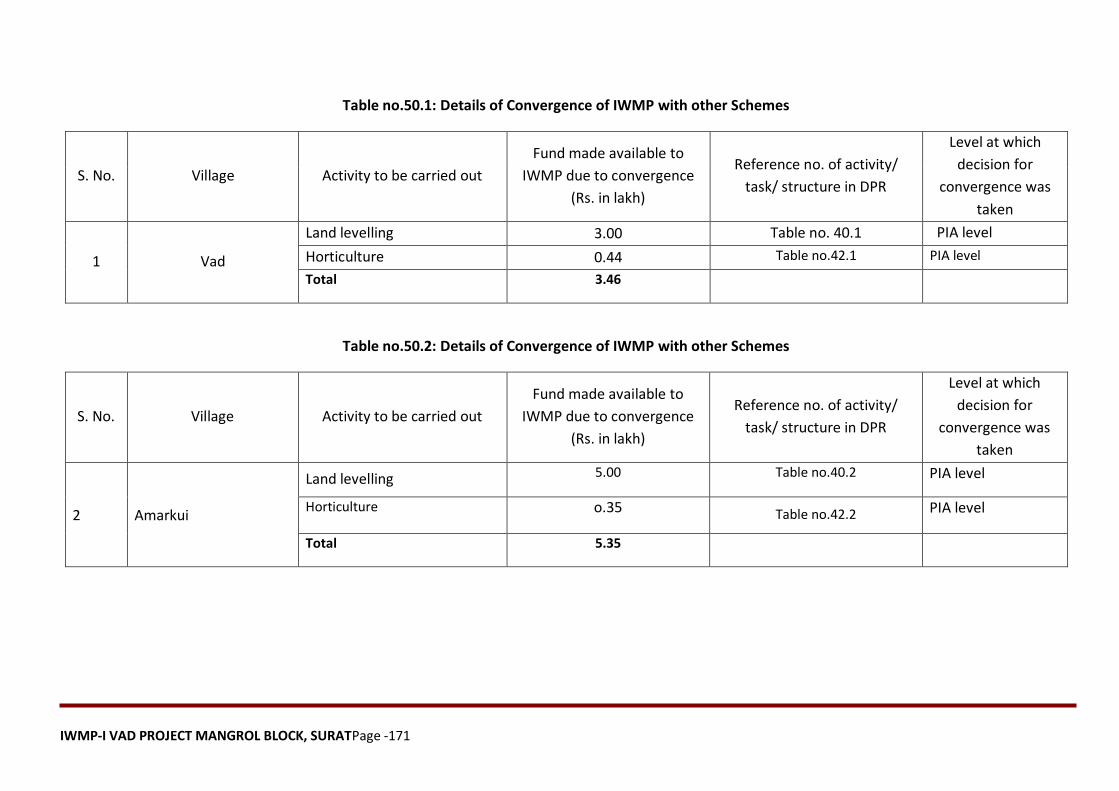
IWMP-I VAD PROJECT MANGROL BLOCK, SURATPage -171
Table no.50.1: Details of Convergence of IWMP with other Schemes
S. No. Village Activity to be carried out
Fund made available to
IWMP due to convergence
(Rs. in lakh)
Reference no. of activity/
task/ structure in DPR
Level at which
decision for
convergence was
taken
1 Vad
Land levelling 3.00 Table no. 40.1 PIA level
Horticulture 0.44 Table no.42.1 PIA level
Total 3.46
Table no.50.2: Details of Convergence of IWMP with other Schemes
S. No. Village Activity to be carried out
Fund made available to
IWMP due to convergence
(Rs. in lakh)
Reference no. of activity/
task/ structure in DPR
Level at which
decision for
convergence was
taken
2 Amarkui
Land levelling 5.00 Table no.40.2 PIA level
Horticulture o.35 Table no.42.2 PIA level
Total 5.35
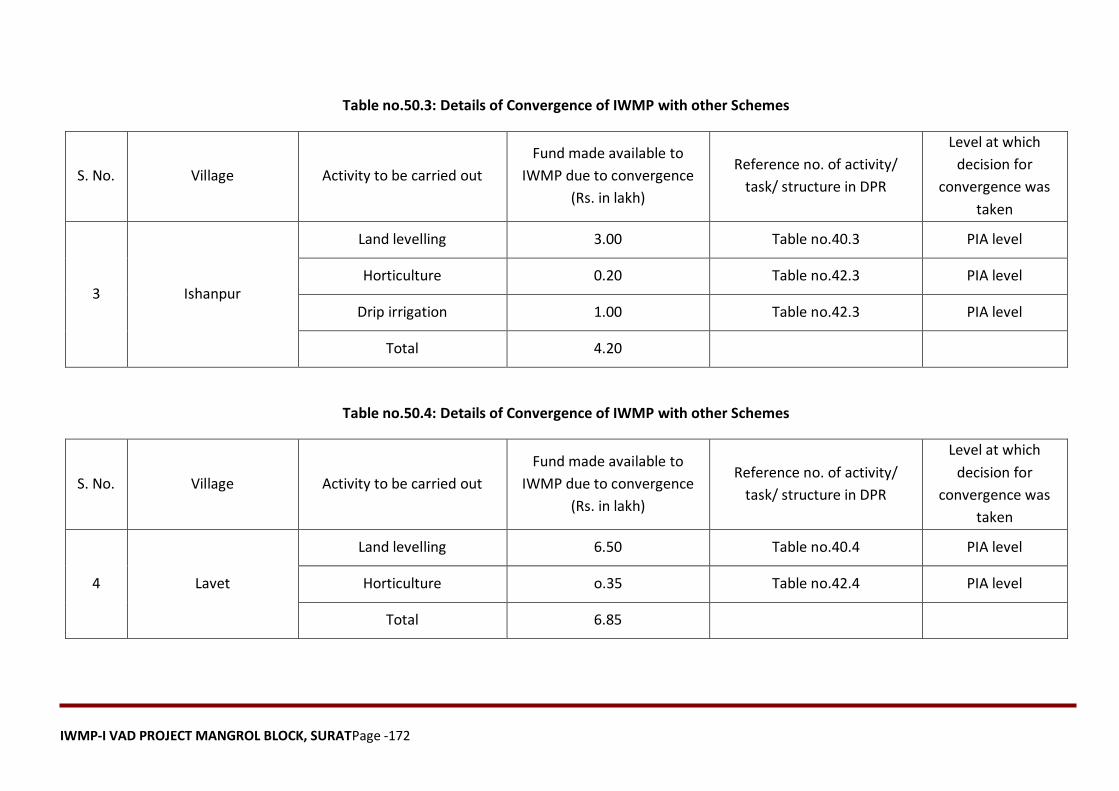
IWMP-I VAD PROJECT MANGROL BLOCK, SURATPage -172
Table no.50.3: Details of Convergence of IWMP with other Schemes
S. No. Village Activity to be carried out
Fund made available to
IWMP due to convergence
(Rs. in lakh)
Reference no. of activity/
task/ structure in DPR
Level at which
decision for
convergence was
taken
3 Ishanpur
Land levelling 3.00 Table no.40.3 PIA level
Horticulture 0.20 Table no.42.3 PIA level
Drip irrigation 1.00 Table no.42.3 PIA level
Total 4.20
Table no.50.4: Details of Convergence of IWMP with other Schemes
S. No. Village Activity to be carried out
Fund made available to
IWMP due to convergence
(Rs. in lakh)
Reference no. of activity/
task/ structure in DPR
Level at which
decision for
convergence was
taken
4 Lavet
Land levelling 6.50 Table no.40.4 PIA level
Horticulture o.35 Table no.42.4 PIA level
Total 6.85
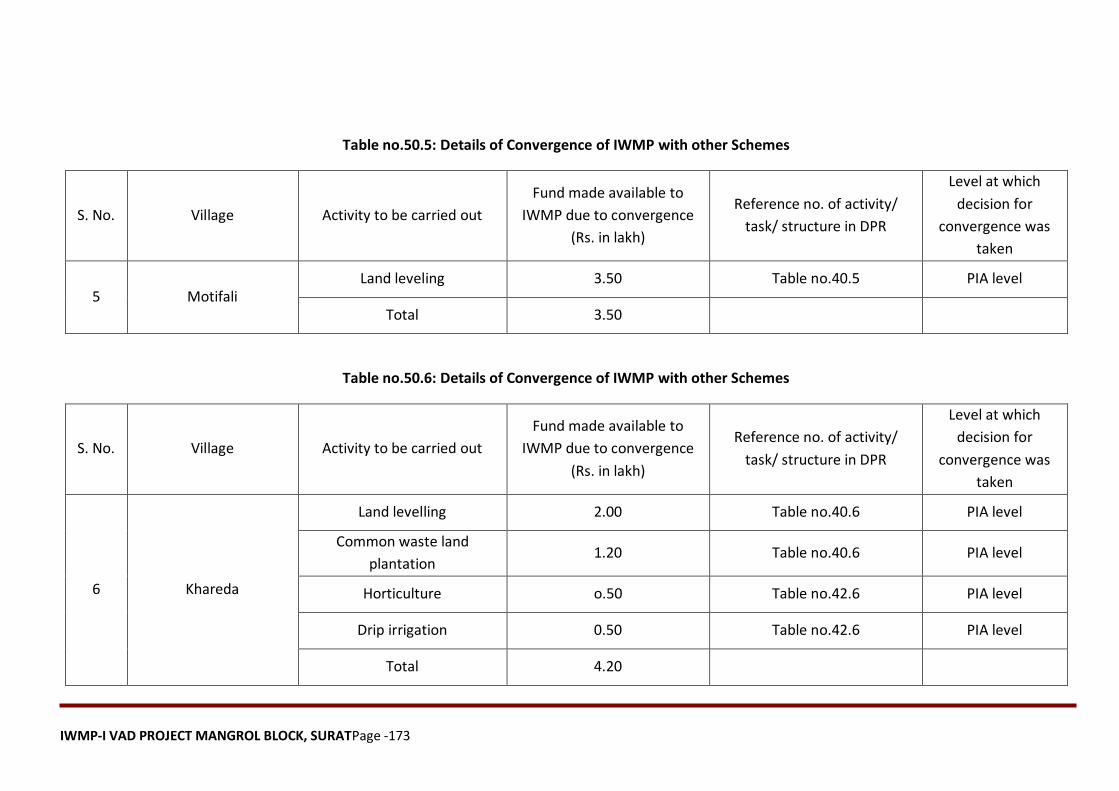
IWMP-I VAD PROJECT MANGROL BLOCK, SURATPage -173
Table no.50.5: Details of Convergence of IWMP with other Schemes
S. No. Village Activity to be carried out
Fund made available to
IWMP due to convergence
(Rs. in lakh)
Reference no. of activity/
task/ structure in DPR
Level at which
decision for
convergence was
taken
5 Motifali Land leveling 3.50 Table no.40.5 PIA level
Total 3.50
Table no.50.6: Details of Convergence of IWMP with other Schemes
S. No. Village Activity to be carried out
Fund made available to
IWMP due to convergence
(Rs. in lakh)
Reference no. of activity/
task/ structure in DPR
Level at which
decision for
convergence was
taken
6 Khareda
Land levelling 2.00 Table no.40.6 PIA level
Common waste land
plantation 1.20 Table no.40.6 PIA level
Horticulture o.50 Table no.42.6 PIA level
Drip irrigation 0.50 Table no.42.6 PIA level
Total 4.20

IWMP-I VAD PROJECT MANGROL BLOCK, SURATPage -174
Table no.50.7: Details of Convergence of IWMP with other Schemes
S. No. Village Activity to be carried out
Fund made available to
IWMP due to convergence
(Rs. in lakh)
Reference no. of activity/
task/ structure in DPR
Level at which
decision for
convergence was
taken
7 Mangrol
Land levelling 2.50 Table no.40.7 PIA level
Pasture development 0.10 Table no.40.7 PIA level
Farm forestry 0.30 Table no.40.7 PIA level
Horticulture 1.00 Table no.42.7 PIA level
Total 3.90
Table no.50.8: Details of Convergence of IWMP with other Schemes
S. No. Village Activity to be carried out
Fund made available to
IWMP due to convergence
(Rs. in lakh)
Reference no. of activity/
task/ structure in DPR
Level at which
decision for
convergence was
taken
8 Jhankhvav Land levelling 2.50 Table no.40.8 PIA level

IWMP-I VAD PROJECT MANGROL BLOCK, SURATPage -175
Common waste land 0.90 Table no.40.8 PIA level
Drip irrigation 1.00 Table no.40.8 PIA level
Horticulture 0.40 Table no.42.8 PIA level
Total 4.80
Table no.50.9: Details of Convergence of IWMP with other Schemes
S. No. Village Activity to be carried out
Fund made available to
IWMP due to convergence
(Rs. in lakh)
Reference no. of activity/
task/ structure in DPR
Level at which
decision for
convergence was
taken
9 Nani fali
Land levelling 1.00 Table no.40.9 PIA level
Common wasteland 1.20 Table no.40.9 PIA level
Drip irrigation 1.50 Table no.40.9 PIA level
Horticulture 0.35 Table no.42.9 PIA level
Farm forestry 0.30 Table no.42.9 PIA level
Total 4.35
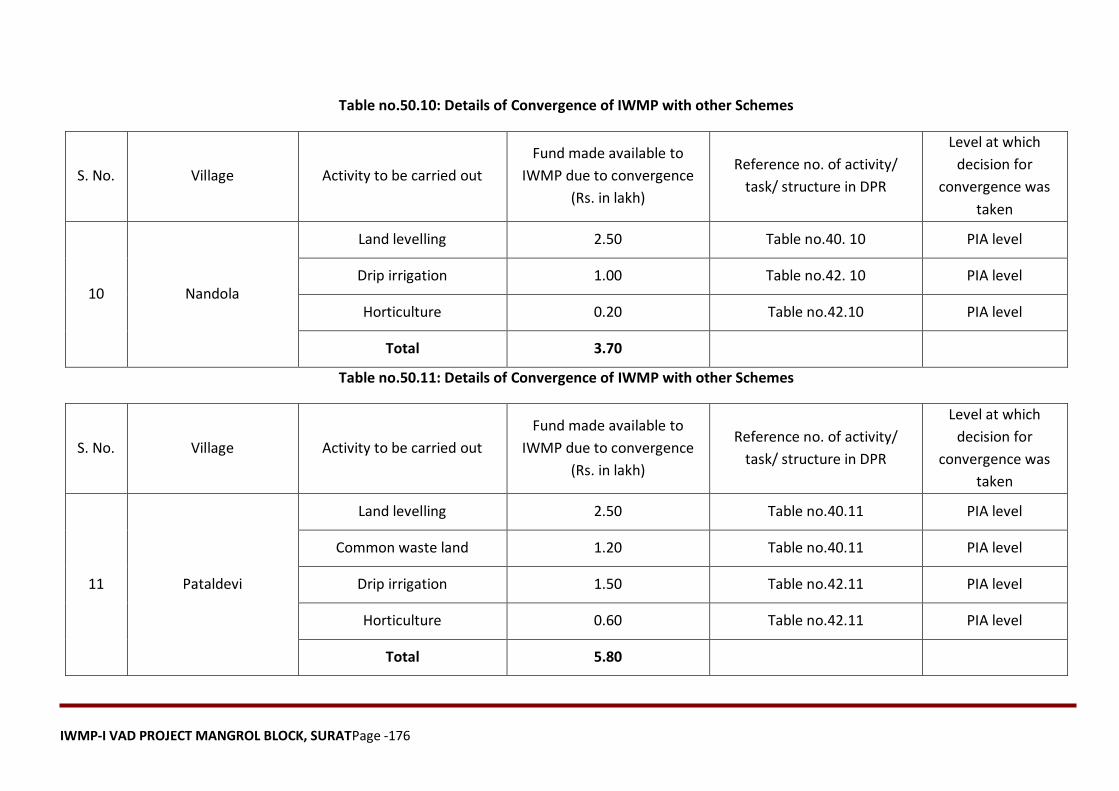
IWMP-I VAD PROJECT MANGROL BLOCK, SURATPage -176
Table no.50.10: Details of Convergence of IWMP with other Schemes
S. No. Village Activity to be carried out
Fund made available to
IWMP due to convergence
(Rs. in lakh)
Reference no. of activity/
task/ structure in DPR
Level at which
decision for
convergence was
taken
10 Nandola
Land levelling 2.50 Table no.40. 10 PIA level
Drip irrigation 1.00 Table no.42. 10 PIA level
Horticulture 0.20 Table no.42.10 PIA level
Total 3.70
Table no.50.11: Details of Convergence of IWMP with other Schemes
S. No. Village Activity to be carried out
Fund made available to
IWMP due to convergence
(Rs. in lakh)
Reference no. of activity/
task/ structure in DPR
Level at which
decision for
convergence was
taken
11 Pataldevi
Land levelling 2.50 Table no.40.11 PIA level
Common waste land 1.20 Table no.40.11 PIA level
Drip irrigation 1.50 Table no.42.11 PIA level
Horticulture 0.60 Table no.42.11 PIA level
Total 5.80
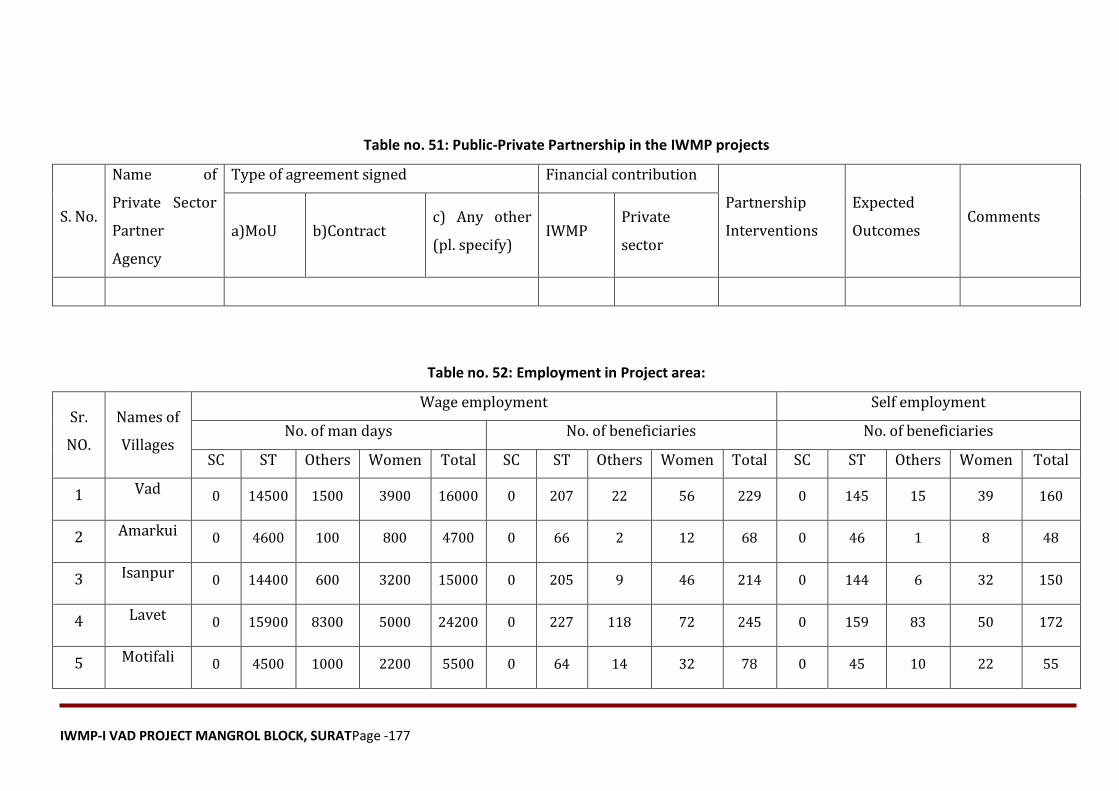
IWMP-I VAD PROJECT MANGROL BLOCK, SURATPage -177
Table no. 51: Public-Private Partnership in the IWMP projects
S. No.
Name of
Private Sector
Partner
Agency
Type of agreement signed Financial contribution
Partnership
Interventions
Expected
Outcomes Comments
a)MoU b)Contract c) Any other
(pl. specify) IWMP
Private
sector
Table no. 52: Employment in Project area:
Sr.
NO.
Names of
Villages
Wage employment Self employment
No. of man days No. of beneficiaries No. of beneficiaries
SC ST Others Women Total SC ST Others Women Total SC ST Others Women Total
1 Vad 0 14500 1500 3900 16000 0 207 22 56 229 0 145 15 39 160
2 Amarkui 0 4600 100 800 4700 0 66 2 12 68 0 46 1 8 48
3 Isanpur 0 14400 600 3200 15000 0 205 9 46 214 0 144 6 32 150
4 Lavet 0 15900 8300 5000 24200 0 227 118 72 245 0 159 83 50 172
5 Motifali 0 4500 1000 2200 5500 0 64 14 32 78 0 45 10 22 55
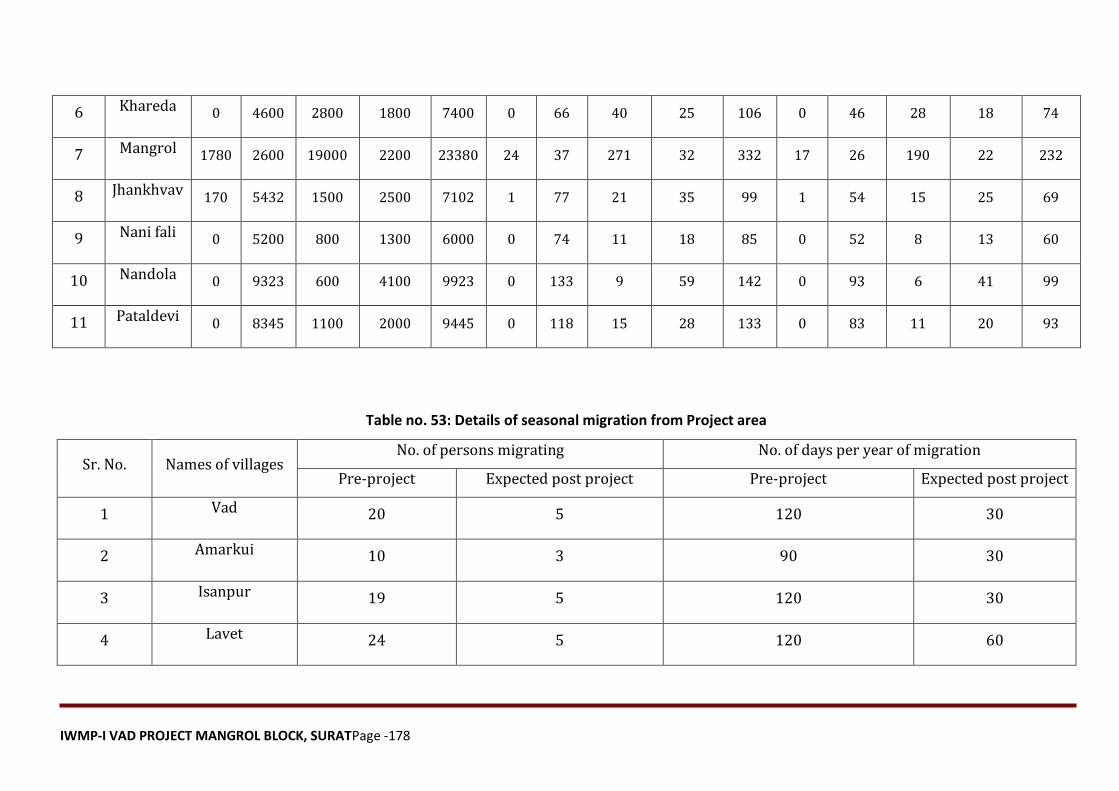
IWMP-I VAD PROJECT MANGROL BLOCK, SURATPage -178
6 Khareda 0 4600 2800 1800 7400 0 66 40 25 106 0 46 28 18 74
7 Mangrol 1780 2600 19000 2200 23380 24 37 271 32 332 17 26 190 22 232
8 Jhankhvav 170 5432 1500 2500 7102 1 77 21 35 99 1 54 15 25 69
9 Nani fali 0 5200 800 1300 6000 0 74 11 18 85 0 52 8 13 60
10 Nandola 0 9323 600 4100 9923 0 133 9 59 142 0 93 6 41 99
11 Pataldevi 0 8345 1100 2000 9445 0 118 15 28 133 0 83 11 20 93
Table no. 53: Details of seasonal migration from Project area
Sr. No. Names of villages No. of persons migrating No. of days per year of migration
Pre-project Expected post project Pre-project Expected post project
1 Vad 20 5 120 30
2 Amarkui 10 3 90 30
3 Isanpur 19 5 120 30
4 Lavet 24 5 120 60
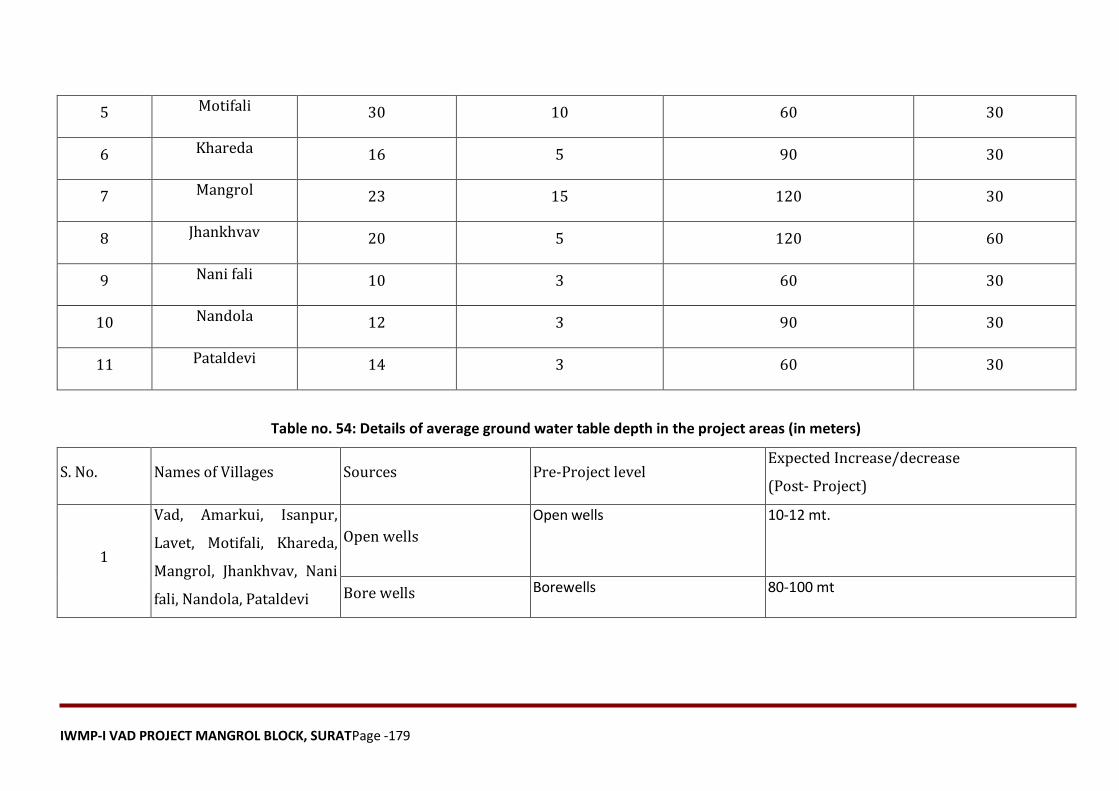
IWMP-I VAD PROJECT MANGROL BLOCK, SURATPage -179
5 Motifali 30 10 60 30
6 Khareda 16 5 90 30
7 Mangrol 23 15 120 30
8 Jhankhvav 20 5 120 60
9 Nani fali 10 3 60 30
10 Nandola 12 3 90 30
11 Pataldevi 14 3 60 30
Table no. 54: Details of average ground water table depth in the project areas (in meters)
S. No. Names of Villages Sources Pre-Project level Expected Increase/decrease
(Post- Project)
1
Vad, Amarkui, Isanpur,
Lavet, Motifali, Khareda,
Mangrol, Jhankhvav, Nani
fali, Nandola, Pataldevi
Open wells
Open wells 10-12 mt.
Bore wells Borewells 80-100 mt
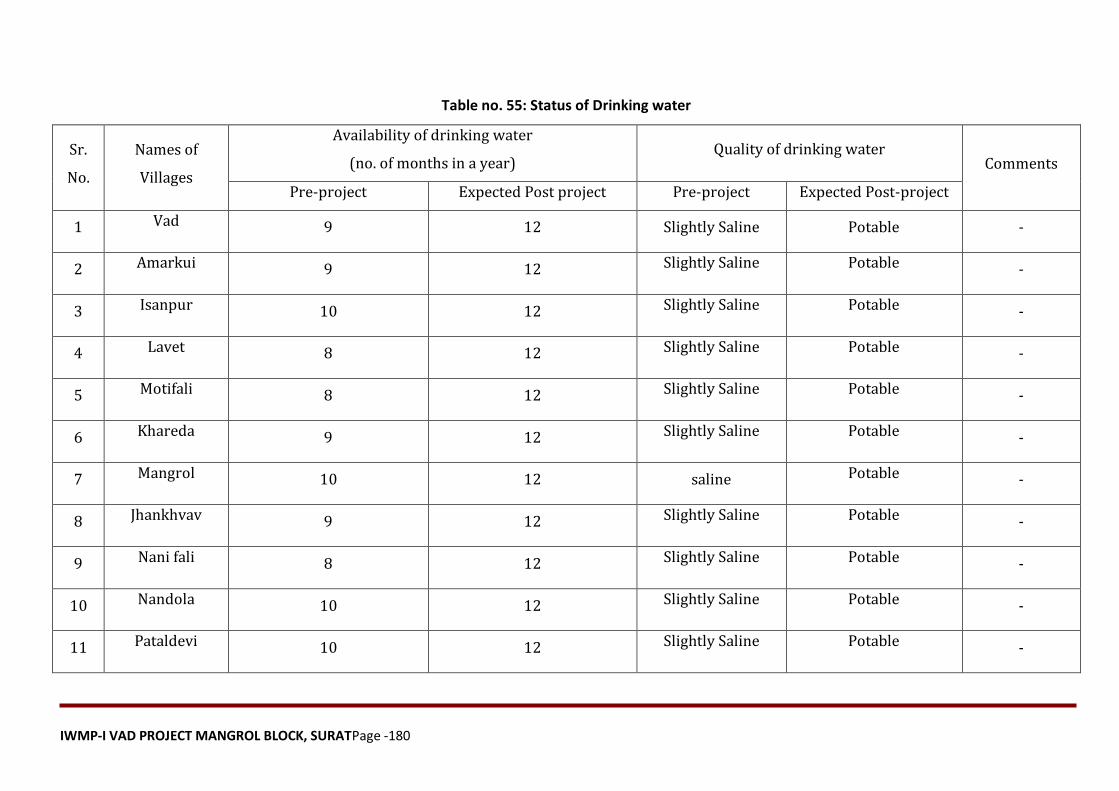
IWMP-I VAD PROJECT MANGROL BLOCK, SURATPage -180
Table no. 55: Status of Drinking water
Sr.
No.
Names of
Villages
Availability of drinking water
(no. of months in a year) Quality of drinking water
Comments
Pre-project Expected Post project Pre-project Expected Post-project
1 Vad 9 12 Slightly Saline Potable -
2 Amarkui 9 12 Slightly Saline Potable -
3 Isanpur 10 12 Slightly Saline Potable -
4 Lavet 8 12 Slightly Saline Potable -
5 Motifali 8 12 Slightly Saline Potable -
6 Khareda 9 12 Slightly Saline Potable -
7 Mangrol 10 12 saline Potable -
8 Jhankhvav 9 12 Slightly Saline Potable -
9 Nani fali 8 12 Slightly Saline Potable -
10 Nandola 10 12 Slightly Saline Potable -
11 Pataldevi 10 12 Slightly Saline Potable -
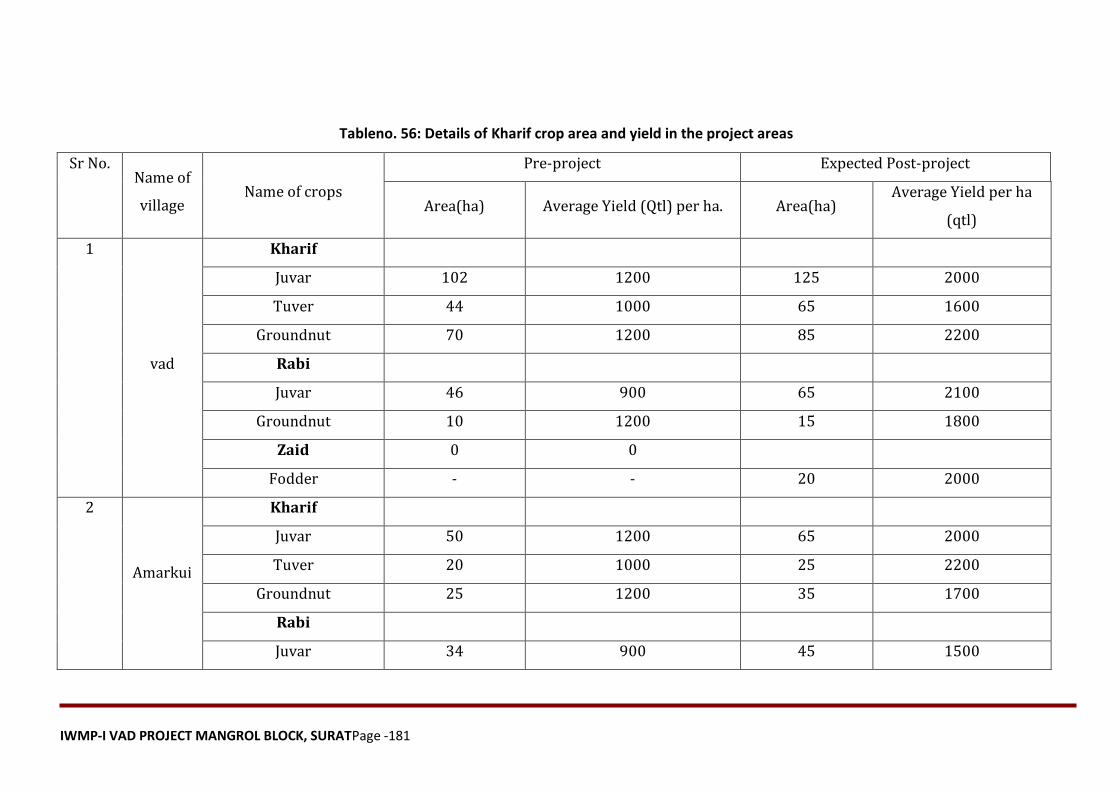
IWMP-I VAD PROJECT MANGROL BLOCK, SURATPage -181
Tableno. 56: Details of Kharif crop area and yield in the project areas
Sr No. Name of
village Name of crops
Pre-project Expected Post-project
Area(ha) Average Yield (Qtl) per ha. Area(ha) Average Yield per ha
(qtl)
1
vad
Kharif
Juvar 102 1200 125 2000
Tuver 44 1000 65 1600
Groundnut 70 1200 85 2200
Rabi
Juvar 46 900 65 2100
Groundnut 10 1200 15 1800
Zaid 0 0
Fodder - - 20 2000
2
Amarkui
Kharif
Juvar 50 1200 65 2000
Tuver 20 1000 25 2200
Groundnut 25 1200 35 1700
Rabi
Juvar 34 900 45 1500
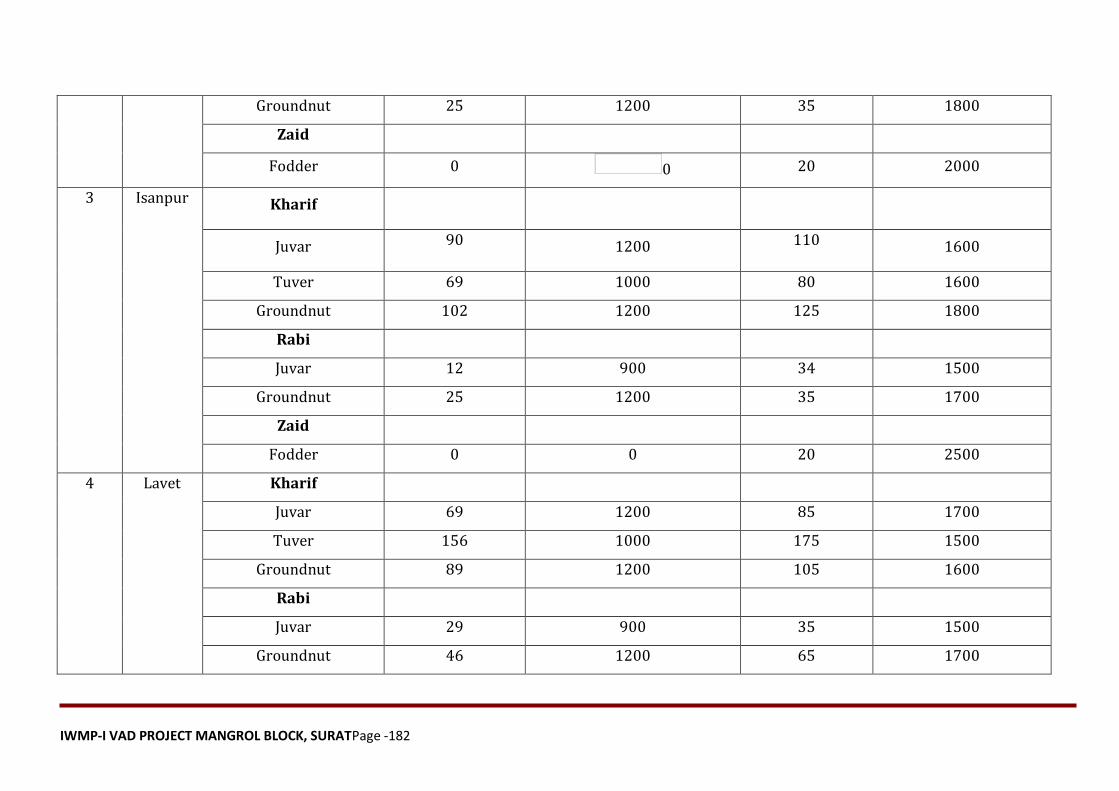
IWMP-I VAD PROJECT MANGROL BLOCK, SURATPage -182
Groundnut 25 1200 35 1800
Zaid
Fodder 0 0 20 2000
3 Isanpur Kharif
Juvar 90 1200 110 1600
Tuver 69 1000 80 1600
Groundnut 102 1200 125 1800
Rabi
Juvar 12 900 34 1500
Groundnut 25 1200 35 1700
Zaid
Fodder 0 0 20 2500
4 Lavet Kharif
Juvar 69 1200 85 1700
Tuver 156 1000 175 1500
Groundnut 89 1200 105 1600
Rabi
Juvar 29 900 35 1500
Groundnut 46 1200 65 1700

IWMP-I VAD PROJECT MANGROL BLOCK, SURATPage -183
Zaid
Fodder 0 0 20 2200
5 Motifali Kharif
Juvar 48 1200 65 2200
Tuver 30 1000 50 1600
Groundnut 12 1200 25 1800
Rabi
Juvar 5 900 15 1500
Groundnut 10 1200 25 1700
Zaid
Fodder 0 0 20 2000
6 Khareda Kharif
Juvar 39 1200 60 1700
Tuver 28 1000 55 1500
Groundnut 24 1200 50 1700
Rabi
Juvar 15 1200 25 1600
Groundnut 28 1200 50 1500
Zaid
Fodder 0 0 20 2200

IWMP-I VAD PROJECT MANGROL BLOCK, SURATPage -184
7 Mangrol Kharif
Juvar 123 1200 150 1600
Tuver 108 1000 120 1500
Groundnut 98 1200 115 1600
Rabi
Juvar 56 1200 70 1700
Groundnut 45 1200 65 1700
Zaid
Fodder 0 0 25 2200
8
Jhankhvav
Kharif
Juvar 39 1200 65 1600
Tuver 40 1000 65 1500
Groundnut 32 1200 50 1600
Rabi
Juvar 6 900 20 1400
Groundnut 4 1200 15 1700
Zaid
Fodder 0 0 20 2000
9 Nani fali
Kharif
Juvar 25 1200 45 1600
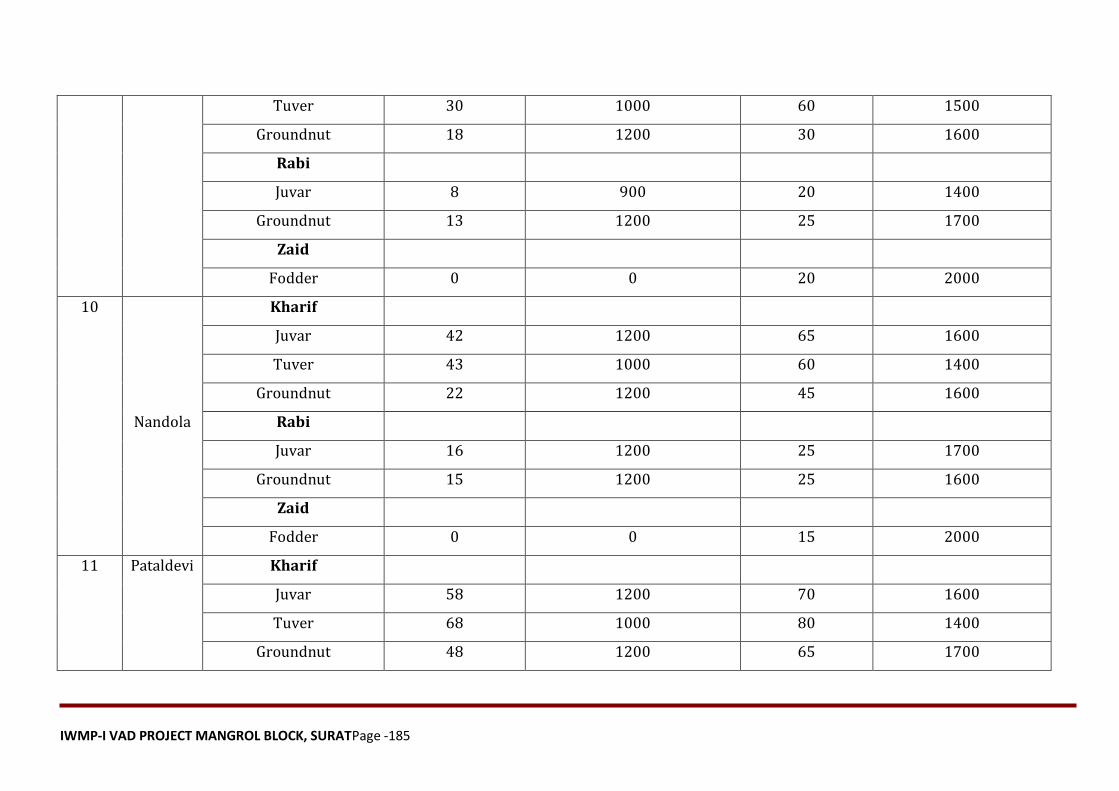
IWMP-I VAD PROJECT MANGROL BLOCK, SURATPage -185
Tuver 30 1000 60 1500
Groundnut 18 1200 30 1600
Rabi
Juvar 8 900 20 1400
Groundnut 13 1200 25 1700
Zaid
Fodder 0 0 20 2000
10
Nandola
Kharif
Juvar 42 1200 65 1600
Tuver 43 1000 60 1400
Groundnut 22 1200 45 1600
Rabi
Juvar 16 1200 25 1700
Groundnut 15 1200 25 1600
Zaid
Fodder 0 0 15 2000
11 Pataldevi Kharif
Juvar 58 1200 70 1600
Tuver 68 1000 80 1400
Groundnut 48 1200 65 1700
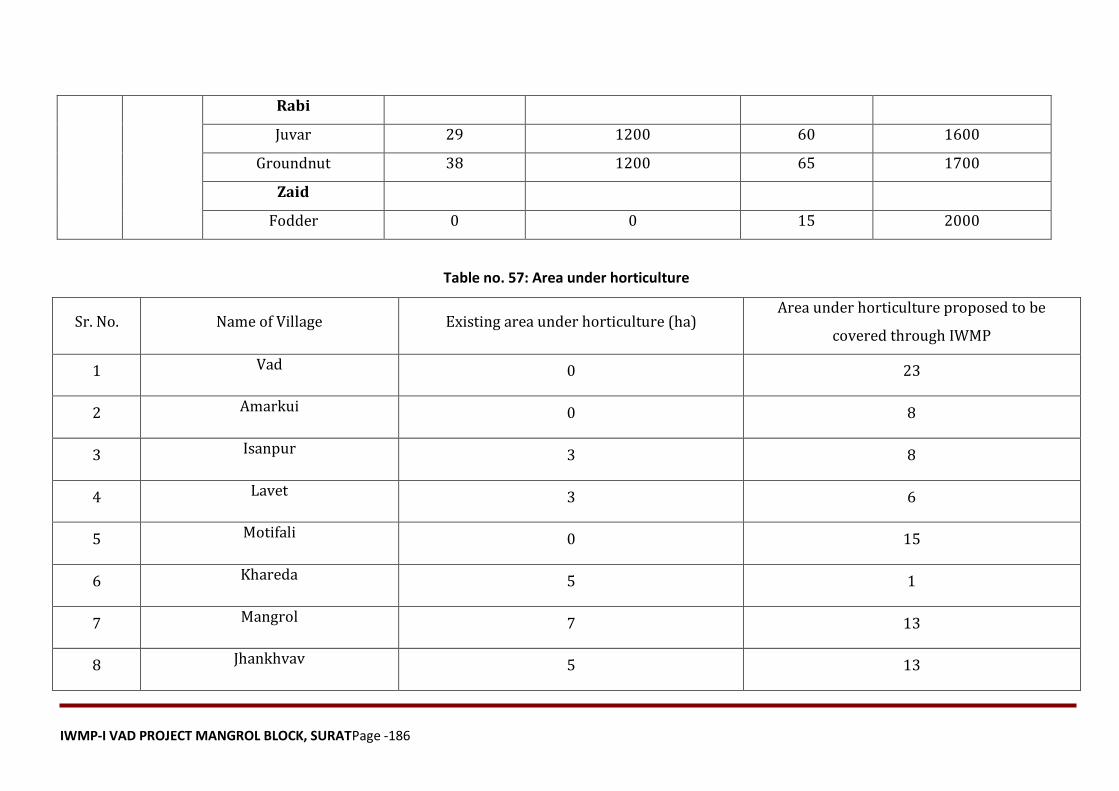
IWMP-I VAD PROJECT MANGROL BLOCK, SURATPage -186
Rabi
Juvar 29 1200 60 1600
Groundnut 38 1200 65 1700
Zaid
Fodder 0 0 15 2000
Table no. 57: Area under horticulture
Sr. No. Name of Village Existing area under horticulture (ha) Area under horticulture proposed to be
covered through IWMP
1 Vad 0 23
2 Amarkui 0 8
3 Isanpur 3 8
4 Lavet 3 6
5 Motifali 0 15
6 Khareda 5 1
7 Mangrol 7 13
8 Jhankhvav 5 13
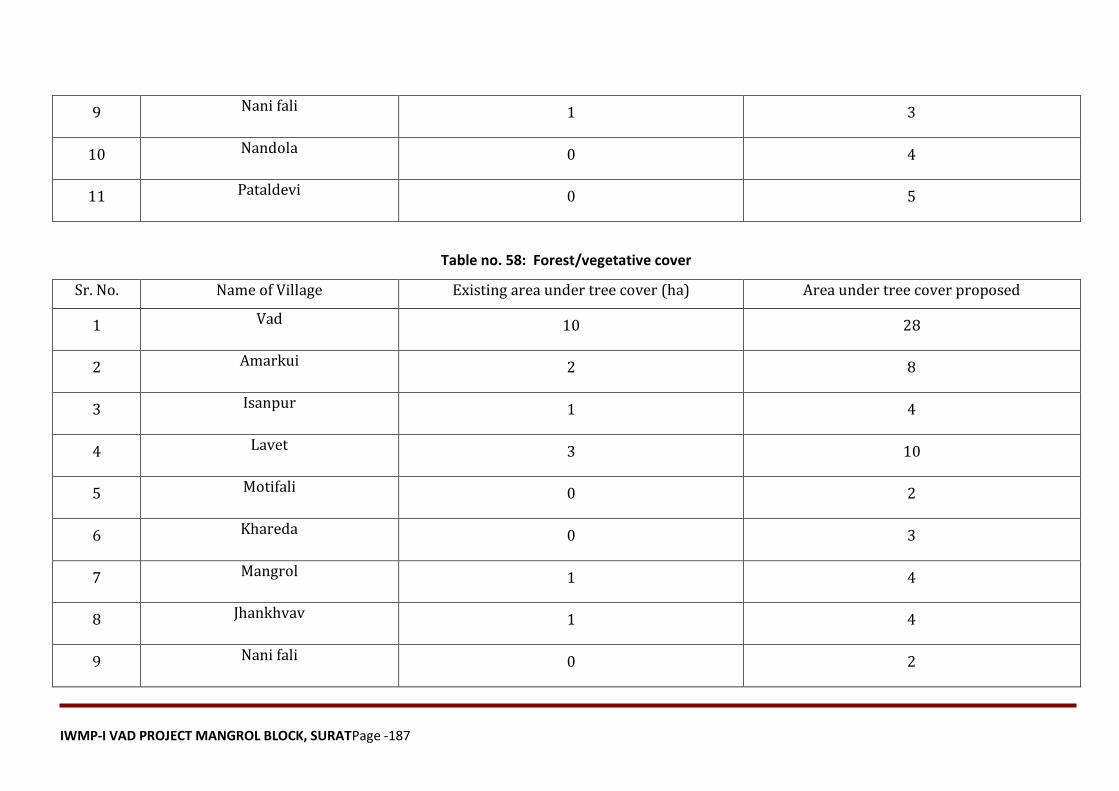
IWMP-I VAD PROJECT MANGROL BLOCK, SURATPage -187
9 Nani fali 1 3
10 Nandola 0 4
11 Pataldevi 0 5
Table no. 58: Forest/vegetative cover
Sr. No. Name of Village Existing area under tree cover (ha) Area under tree cover proposed
1 Vad 10 28
2 Amarkui 2 8
3 Isanpur 1 4
4 Lavet 3 10
5 Motifali 0 2
6 Khareda 0 3
7 Mangrol 1 4
8 Jhankhvav 1 4
9 Nani fali 0 2
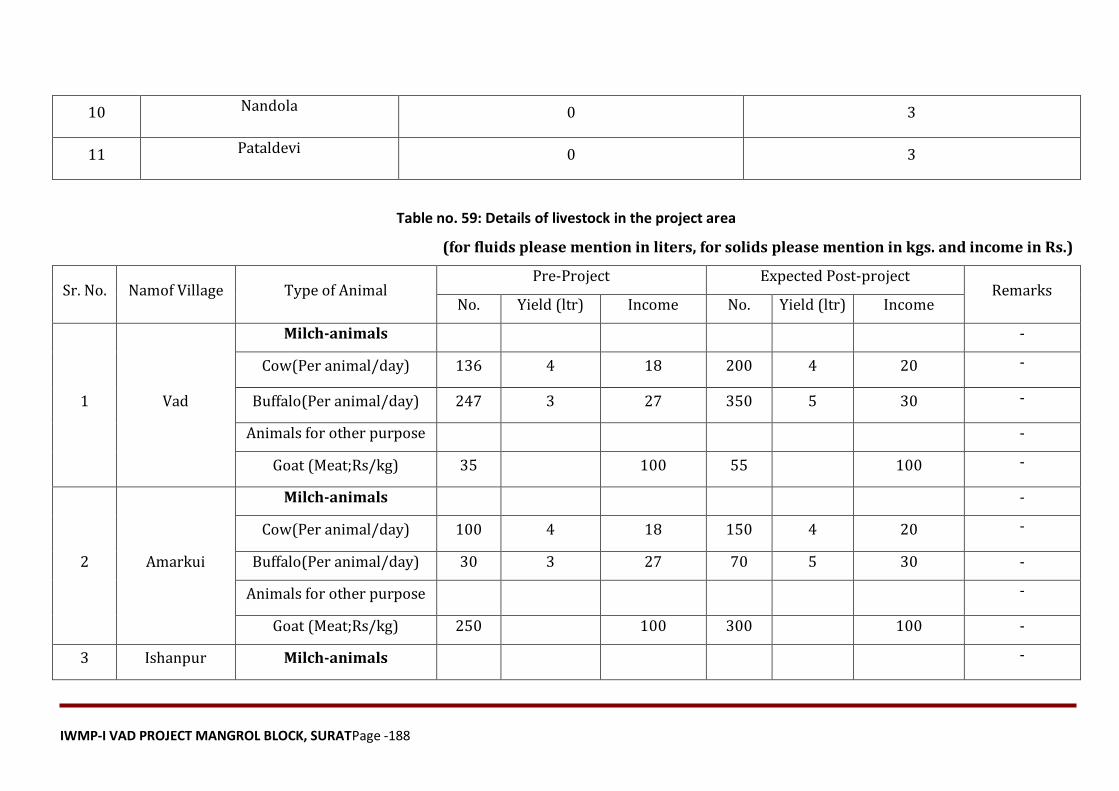
IWMP-I VAD PROJECT MANGROL BLOCK, SURATPage -188
10 Nandola 0 3
11 Pataldevi 0 3
Table no. 59: Details of livestock in the project area
(for fluids please mention in liters, for solids please mention in kgs. and income in Rs.)
Sr. No. Namof Village Type of Animal Pre-Project Expected Post-project
Remarks No. Yield (ltr) Income No. Yield (ltr) Income
1 Vad
Milch-animals -
Cow(Per animal/day) 136 4 18 200 4 20 -
Buffalo(Per animal/day) 247 3 27 350 5 30 -
Animals for other purpose -
Goat (Meat;Rs/kg) 35 100 55 100 -
2 Amarkui
Milch-animals -
Cow(Per animal/day) 100 4 18 150 4 20 -
Buffalo(Per animal/day) 30 3 27 70 5 30 -
Animals for other purpose -
Goat (Meat;Rs/kg) 250 100 300 100 -
3 Ishanpur Milch-animals -
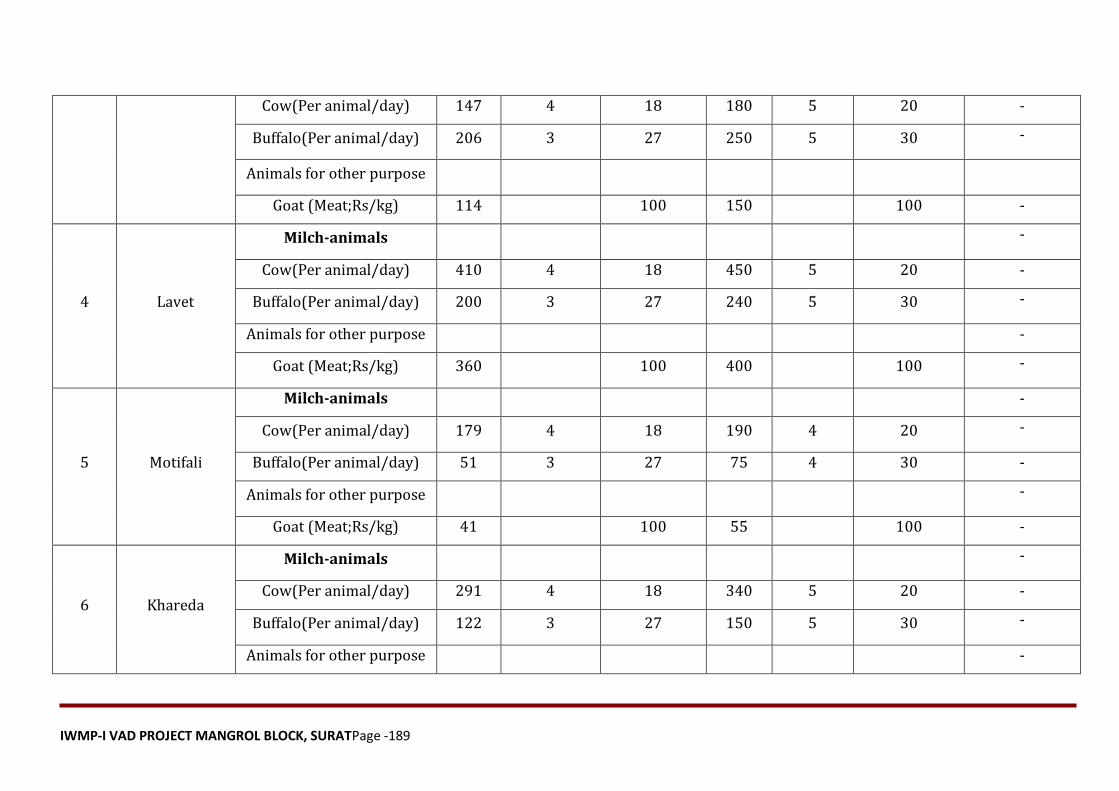
IWMP-I VAD PROJECT MANGROL BLOCK, SURATPage -189
Cow(Per animal/day) 147 4 18 180 5 20 -
Buffalo(Per animal/day) 206 3 27 250 5 30 -
Animals for other purpose
Goat (Meat;Rs/kg) 114 100 150 100 -
4 Lavet
Milch-animals -
Cow(Per animal/day) 410 4 18 450 5 20 -
Buffalo(Per animal/day) 200 3 27 240 5 30 -
Animals for other purpose -
Goat (Meat;Rs/kg) 360 100 400 100 -
5 Motifali
Milch-animals -
Cow(Per animal/day) 179 4 18 190 4 20 -
Buffalo(Per animal/day) 51 3 27 75 4 30 -
Animals for other purpose -
Goat (Meat;Rs/kg) 41 100 55 100 -
6 Khareda
Milch-animals -
Cow(Per animal/day) 291 4 18 340 5 20 -
Buffalo(Per animal/day) 122 3 27 150 5 30 -
Animals for other purpose -
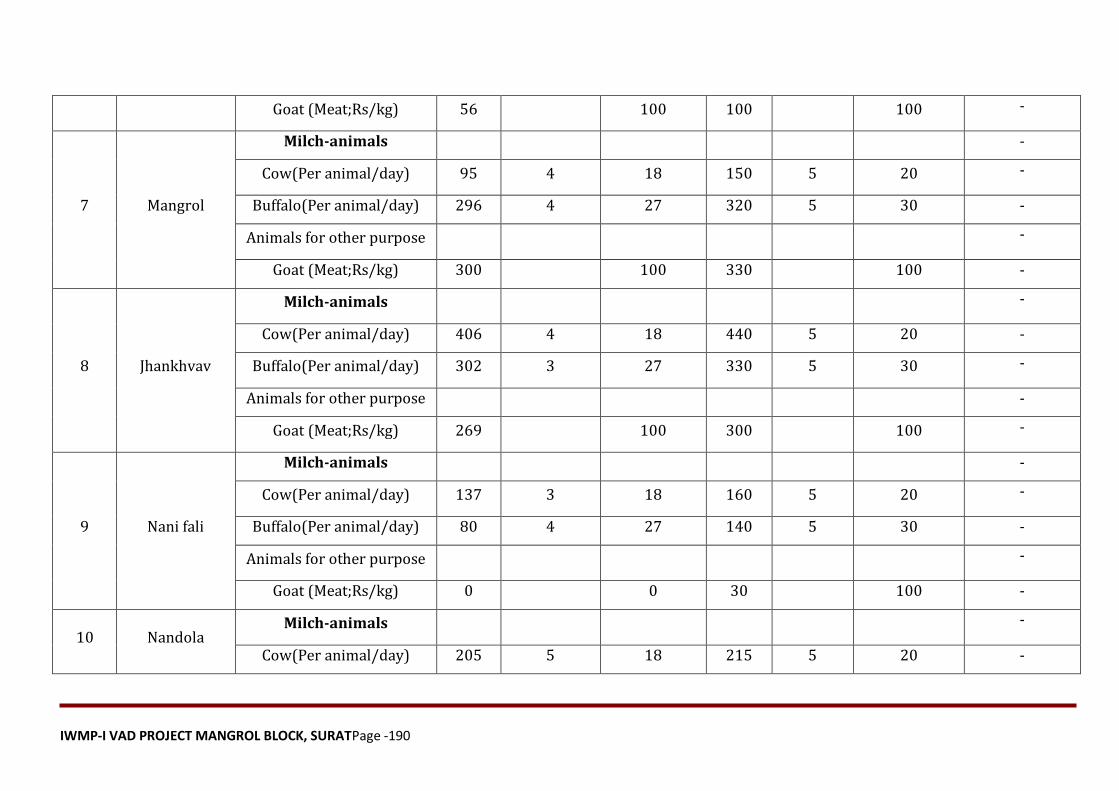
IWMP-I VAD PROJECT MANGROL BLOCK, SURATPage -190
Goat (Meat;Rs/kg) 56 100 100 100 -
7 Mangrol
Milch-animals -
Cow(Per animal/day) 95 4 18 150 5 20 -
Buffalo(Per animal/day) 296 4 27 320 5 30 -
Animals for other purpose -
Goat (Meat;Rs/kg) 300 100 330 100 -
8 Jhankhvav
Milch-animals -
Cow(Per animal/day) 406 4 18 440 5 20 -
Buffalo(Per animal/day) 302 3 27 330 5 30 -
Animals for other purpose -
Goat (Meat;Rs/kg) 269 100 300 100 -
9 Nani fali
Milch-animals -
Cow(Per animal/day) 137 3 18 160 5 20 -
Buffalo(Per animal/day) 80 4 27 140 5 30 -
Animals for other purpose -
Goat (Meat;Rs/kg) 0 0 30 100 -
10 Nandola Milch-animals -
Cow(Per animal/day) 205 5 18 215 5 20 -
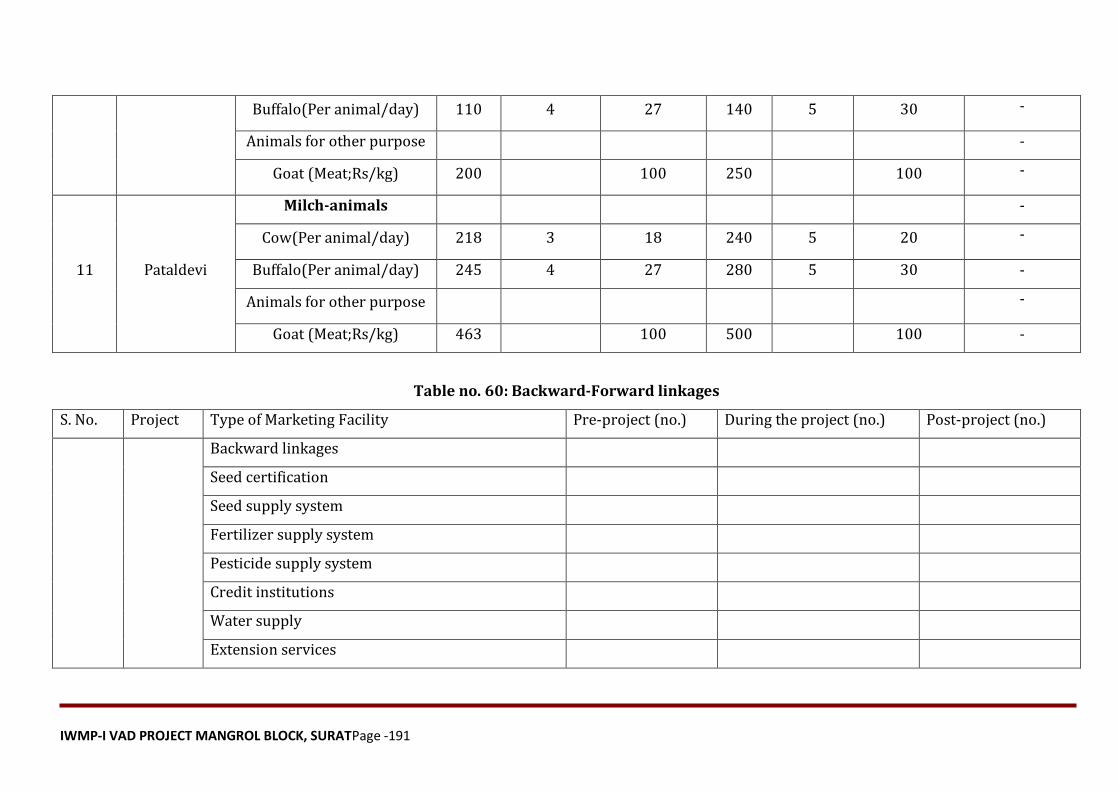
IWMP-I VAD PROJECT MANGROL BLOCK, SURATPage -191
Buffalo(Per animal/day) 110 4 27 140 5 30 -
Animals for other purpose -
Goat (Meat;Rs/kg) 200 100 250 100 -
11 Pataldevi
Milch-animals -
Cow(Per animal/day) 218 3 18 240 5 20 -
Buffalo(Per animal/day) 245 4 27 280 5 30 -
Animals for other purpose -
Goat (Meat;Rs/kg) 463 100 500 100 -
Table no. 60: Backward-Forward linkages
S. No. Project Type of Marketing Facility Pre-project (no.) During the project (no.) Post-project (no.)
Backward linkages
Seed certification
Seed supply system
Fertilizer supply system
Pesticide supply system
Credit institutions
Water supply
Extension services
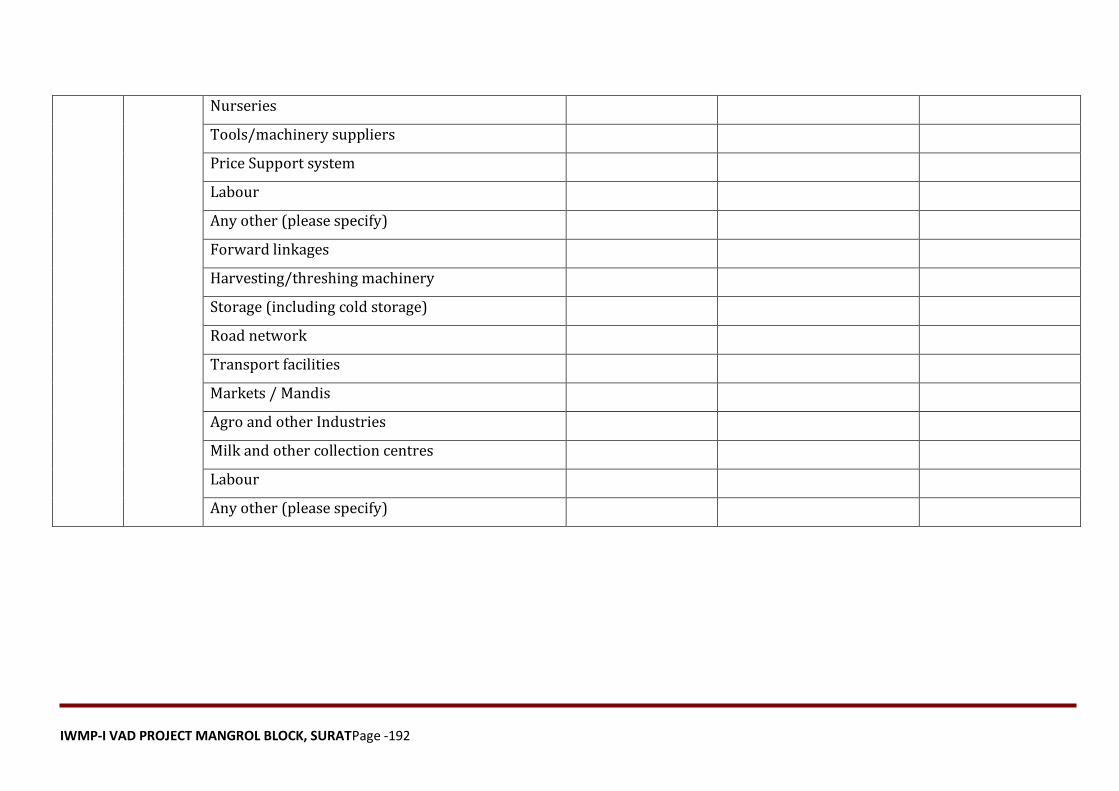
IWMP-I VAD PROJECT MANGROL BLOCK, SURATPage -192
Nurseries
Tools/machinery suppliers
Price Support system
Labour
Any other (please specify)
Forward linkages
Harvesting/threshing machinery
Storage (including cold storage)
Road network
Transport facilities
Markets / Mandis
Agro and other Industries
Milk and other collection centres
Labour
Any other (please specify)
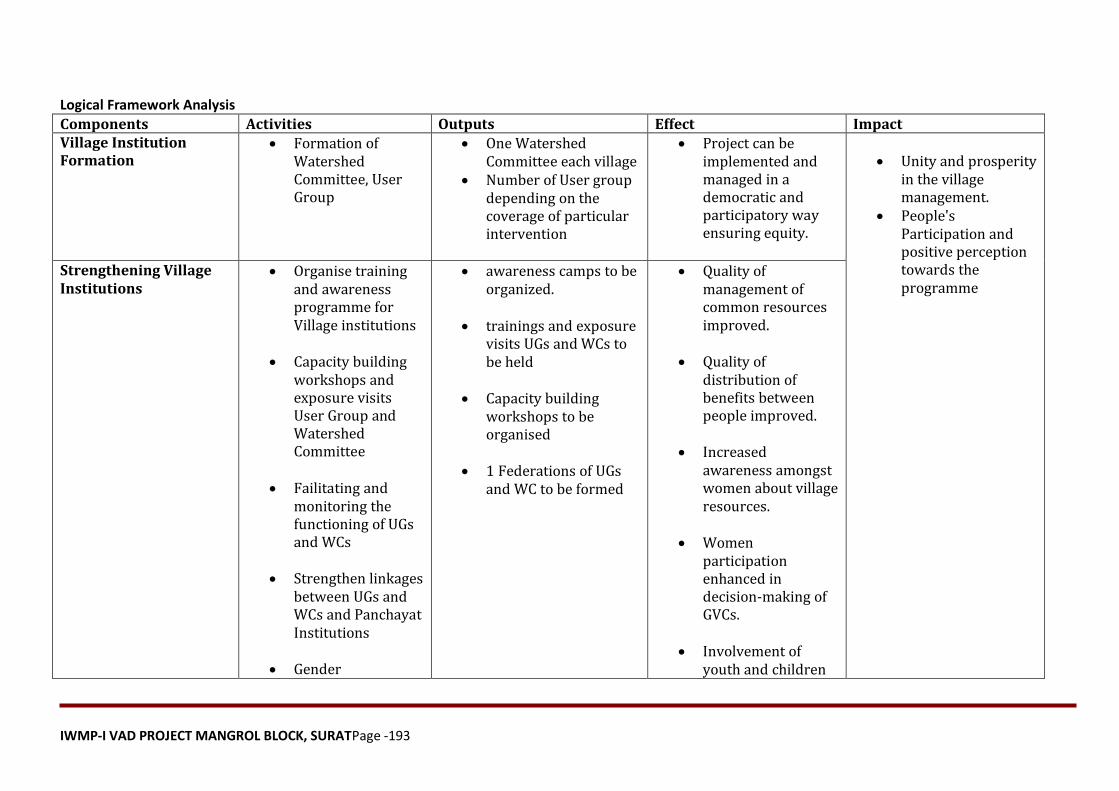
IWMP-I VAD PROJECT MANGROL BLOCK, SURATPage -193
Logical Framework Analysis
Components Activities Outputs Effect Impact Village Institution Formation
Formation of Watershed Committee, User Group
One Watershed Committee each village
Number of User group depending on the coverage of particular intervention
Project can be implemented and managed in a democratic and participatory way ensuring equity.
Unity and prosperity
in the village management.
People's Participation and positive perception towards the programme
Strengthening Village Institutions
Organise training and awareness programme for Village institutions
Capacity building
workshops and exposure visits User Group and Watershed Committee
Failitating and
monitoring the functioning of UGs and WCs
Strengthen linkages
between UGs and WCs and Panchayat Institutions
Gender
awareness camps to be organized.
trainings and exposure
visits UGs and WCs to be held
Capacity building
workshops to be organised
1 Federations of UGs
and WC to be formed
Quality of management of common resources improved.
Quality of
distribution of benefits between people improved.
Increased
awareness amongst women about village resources.
Women
participation enhanced in decision-making of GVCs.
Involvement of
youth and children
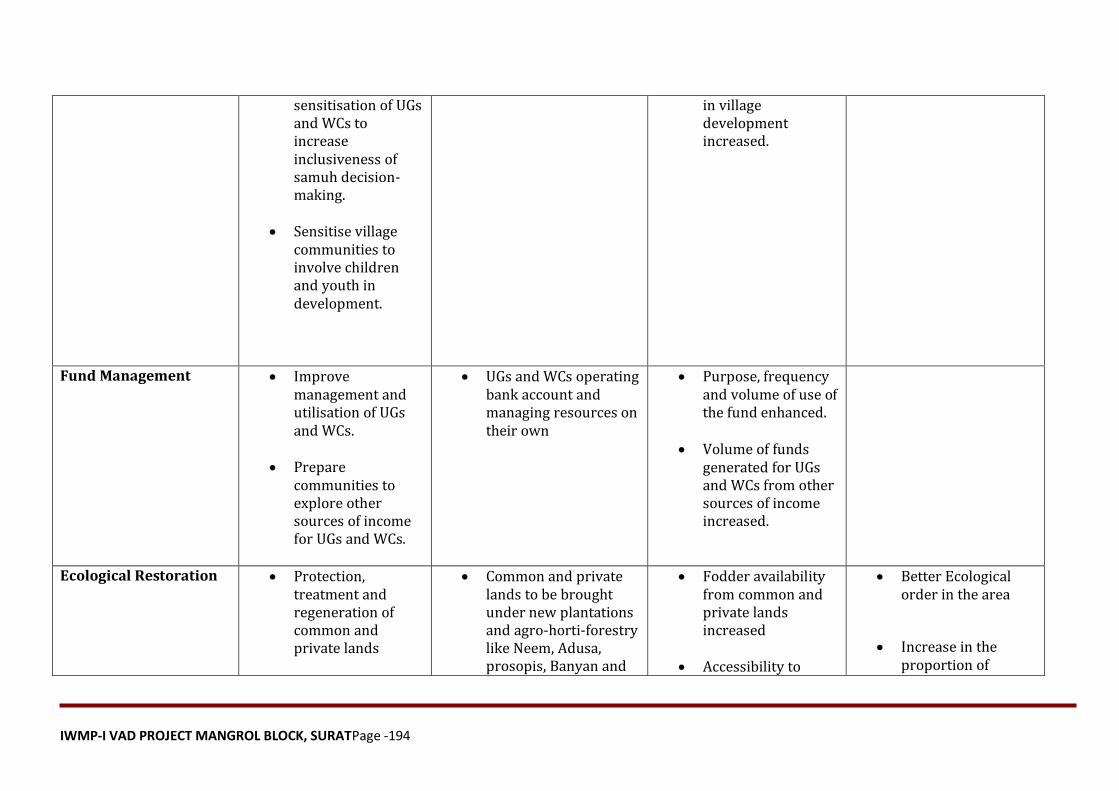
IWMP-I VAD PROJECT MANGROL BLOCK, SURATPage -194
sensitisation of UGs and WCs to increase inclusiveness of samuh decision-making.
Sensitise village
communities to involve children and youth in development.
in village development increased.
Fund Management
Improve management and utilisation of UGs and WCs.
Prepare
communities to explore other sources of income for UGs and WCs.
UGs and WCs operating bank account and managing resources on their own
Purpose, frequency and volume of use of the fund enhanced.
Volume of funds
generated for UGs and WCs from other sources of income increased.
Ecological Restoration
Protection, treatment and regeneration of common and private lands
Common and private lands to be brought under new plantations and agro-horti-forestry like Neem, Adusa, prosopis, Banyan and
Fodder availability from common and private lands increased
Accessibility to
Better Ecological order in the area
Increase in the proportion of
IWMP-I VAD PROJECT MANGROL BLOCK, SURATPage -195
Protection, treatment and regeneration of forest lands
Plantation of fruits and forest species
Impart trainings,
conduct meetings and organise exposure visits for communities, village volunteers and staff to effectively plan, execute and monitor activities
Identification and
promotion of non-timber forest produce based income generation activities
Peepul
Forest lands to be brought under new plantations and protection
Trainings, exposure
visits and meetings to be organised for communities, village volunteers and staff
Income generation
intervention promoted
common and forest lands increased with removal of encroachments and resolution of conflicts
households having more security of fodder
Reduction in drudgery of fodder and fuel collection, especially women
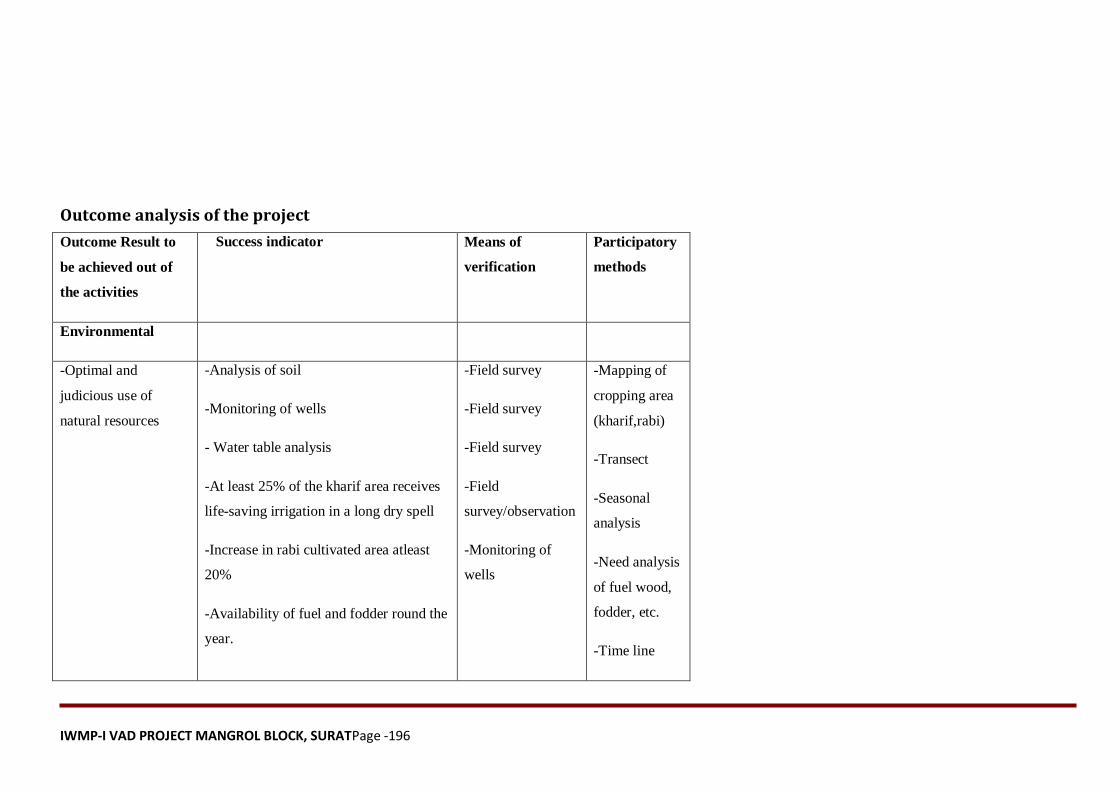
IWMP-I VAD PROJECT MANGROL BLOCK, SURATPage -196
Outcome analysis of the project
Outcome Result to
be achieved out of
the activities
Success indicator Means of
verification
Participatory
methods
Environmental
-Optimal and
judicious use of
natural resources
-Analysis of soil
-Monitoring of wells
- Water table analysis
-At least 25% of the kharif area receives
life-saving irrigation in a long dry spell
-Increase in rabi cultivated area atleast
20%
-Availability of fuel and fodder round the
year.
-Field survey
-Field survey
-Field survey
-Field
survey/observation
-Monitoring of
wells
-Mapping of
cropping area
(kharif,rabi)
-Transect
-Seasonal
analysis
-Need analysis
of fuel wood,
fodder, etc.
-Time line
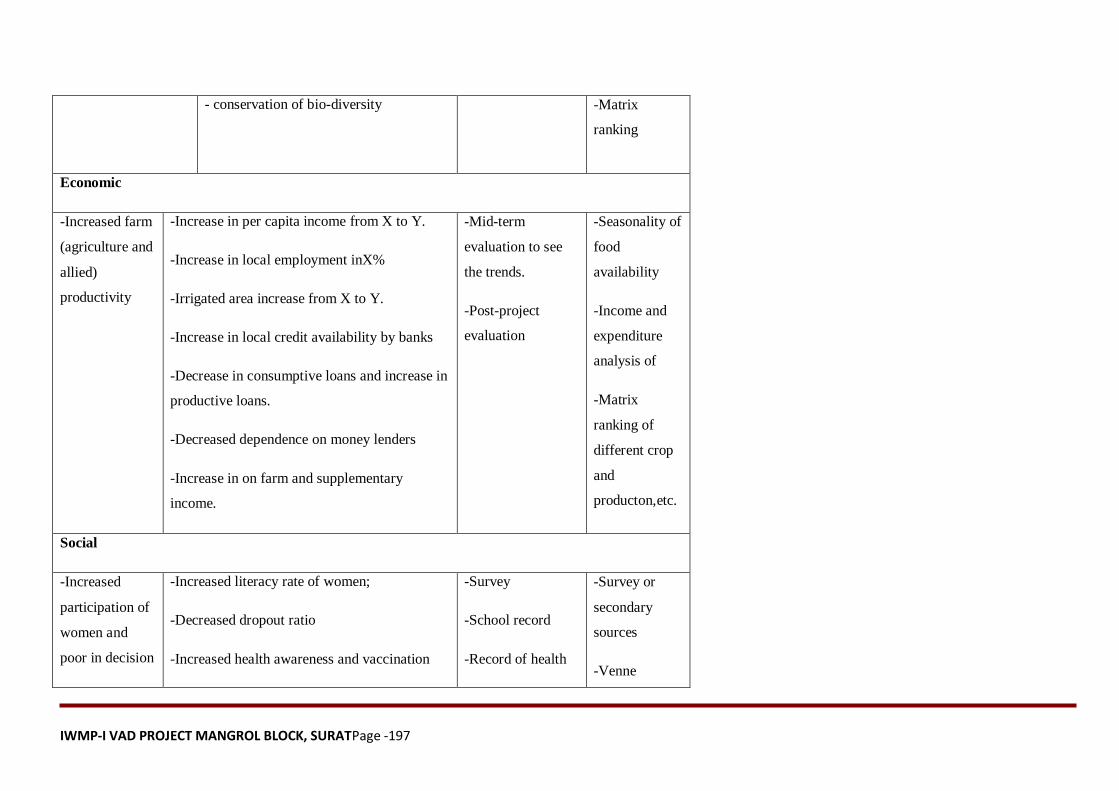
IWMP-I VAD PROJECT MANGROL BLOCK, SURATPage -197
- conservation of bio-diversity
-Matrix
ranking
Economic
-Increased farm
(agriculture and
allied)
productivity
-Increase in per capita income from X to Y.
-Increase in local employment inX%
-Irrigated area increase from X to Y.
-Increase in local credit availability by banks
-Decrease in consumptive loans and increase in
productive loans.
-Decreased dependence on money lenders
-Increase in on farm and supplementary
income.
-Mid-term
evaluation to see
the trends.
-Post-project
evaluation
-Seasonality of
food
availability
-Income and
expenditure
analysis of
-Matrix
ranking of
different crop
and
producton,etc.
Social
-Increased
participation of
women and
poor in decision
-Increased literacy rate of women;
-Decreased dropout ratio
-Increased health awareness and vaccination
-Survey
-School record
-Record of health
-Survey or
secondary
sources
-Venne
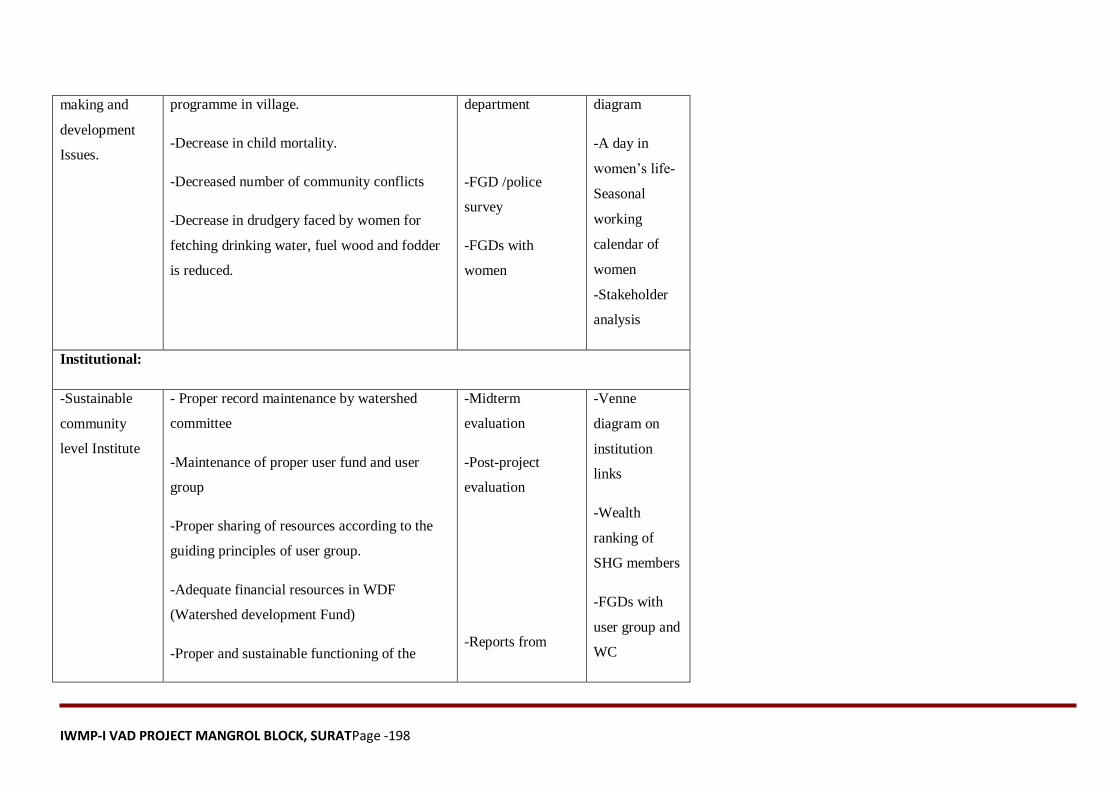
IWMP-I VAD PROJECT MANGROL BLOCK, SURATPage -198
making and
development
Issues.
programme in village.
-Decrease in child mortality.
-Decreased number of community conflicts
-Decrease in drudgery faced by women for
fetching drinking water, fuel wood and fodder
is reduced.
department
-FGD /police
survey
-FGDs with
women
diagram
-A day in
women’s life-
Seasonal
working
calendar of
women
-Stakeholder
analysis
Institutional:
-Sustainable
community
level Institute
- Proper record maintenance by watershed
committee
-Maintenance of proper user fund and user
group
-Proper sharing of resources according to the
guiding principles of user group.
-Adequate financial resources in WDF
(Watershed development Fund)
-Proper and sustainable functioning of the
-Midterm
evaluation
-Post-project
evaluation
-Reports from
-Venne
diagram on
institution
links
-Wealth
ranking of
SHG members
-FGDs with
user group and
WC

IWMP-I VAD PROJECT MANGROL BLOCK, SURATPage -199
SHGs banks
IWMP-I VAD PROJECT MANGROL BLOCK, SURATPage -200
CHAPTER-7 QUALITY AND SUSTAINABILITY ISSES
IWMP-I VAD PROJECT MANGROL BLOCK, SURATPage -201
7 Quality and Sustainability Issues
7.1 Plans for Monitoring and Evaluation
A Web-based GIS System is being developed for monitoring and evaluating the project in its planning & implementation phases. The system would
be available on a public domain and can be accessed by all the stakeholders of the project. The system shows the entire state of Gujarat and all of those
areas selected over the next 18 years. Filtering allows the user to zoom onto one particular project. Details related to soil type, Land-use classification,
inhabitation etc., can be obtained village-wise. Furthermore, survey-number wise details related to ownership, irrigation source, yield etc., can also be
accessed by the users of the system. This system is being used for pooling up the details obtained from the DPR. In other words, the DPR is made available
online in the form of a database which will help the stakeholders know areas of importance viz., already treated areas/historical works in the area,
proposed areas for treatment etc., for further treatment and planning. The system would also show the satellite imageries of various years from the project
inception stage to the project closing stages. This allows the user to evaluate the effectiveness of the treatment and thereby plan corrective measures for
the project area. The system would serve as an aiding tool to the planners and evaluators for judging the efficacy of the project.
Yet another component of the Web-based GIS system is the Mobile based Monitoring & Evaluation System, which will help the ground staff alias
WDTs (Watershed Development Team) to transmit information from the ground level to the central server. Also, any higher-up official in charge of the
project can obtain information regarding the project area on their mobile phone by means of an SMS. The system works in the following manner. The WDT
equipped with a GPS instrument marks the latitude-longitude information of various treatment areas during the DPR. The probable sites are then
transferred onto the central server. During the works phase, any progress in the treatment areas is reported to the server by means of an SMS by the WDT.
Similarly, any nodal officer or higher-up official can view the progress in a project by means of summarized reports generated over frequent periods of
time.
IWMP-I VAD PROJECT MANGROL BLOCK, SURATPage -202
7.2 Plans For Project management:
The Project management of any watershed programme is very important. It mainly depends upon the community organisation and the village level
institutes.In Eval, watershed committee and various user group have been formulated for post project operation and maintenance of assets created during
project period. Major emphasis will be on equity and sustainable benefit of the project even after implementation stage. A proper link-up will be built
during project period with various institutes and capacity building organisation. They will act as a major kingpin during post implementation for scaling up
the successful experience during project.
7.3 Watershed Development Fund: The major source of financial assistance after post implementation period is watershed Development Fund. The contribution of it will comes mainly
fund the following:
7.4 User Charges:
Various user groups will be formed in village. These user groups will collect user charges according to the designated rules formed during the
formation of user group. These funds will be transferred to the WDF funds as per these formulated rules. The secretary of watershed committee (WC) shall
maintain the records of the following.
IWMP-I VAD PROJECT MANGROL BLOCK, SURATPage -203
MAPS
CHAPTER-8 MAPS
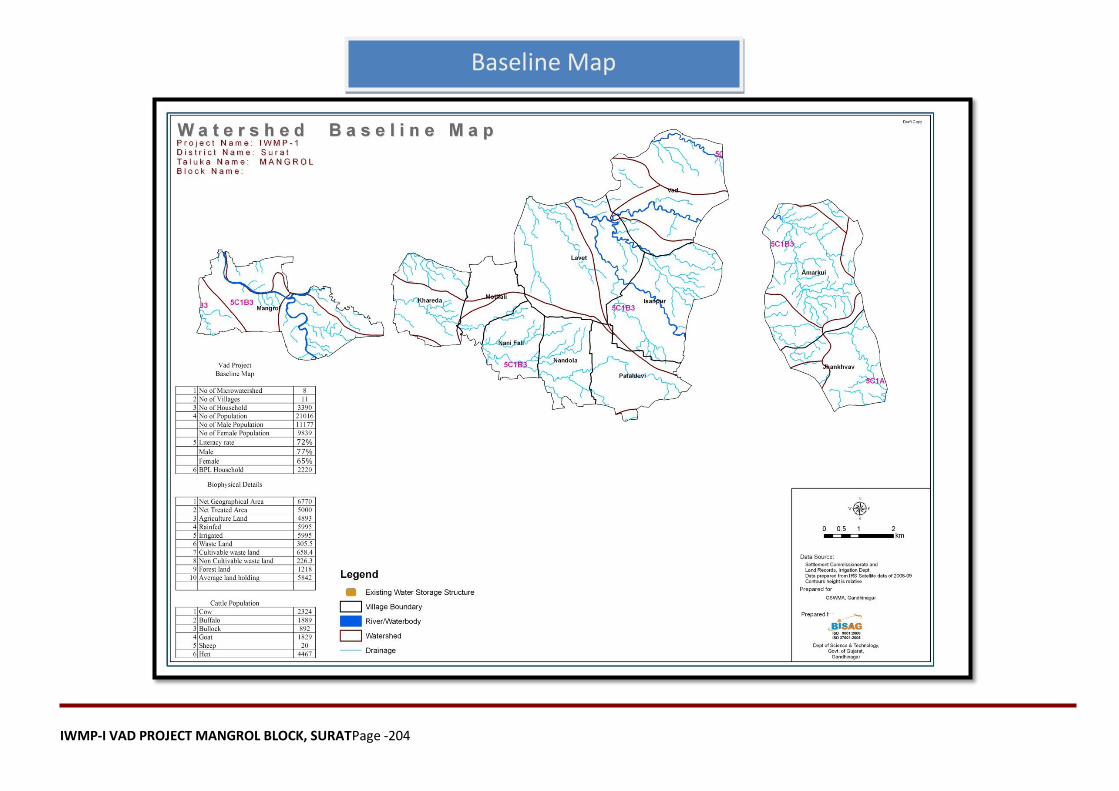
IWMP-I VAD PROJECT MANGROL BLOCK, SURATPage -204
Baseline Map
IWMP-I VAD PROJECT MANGROL BLOCK, SURATPage -205
Cluster MAPS
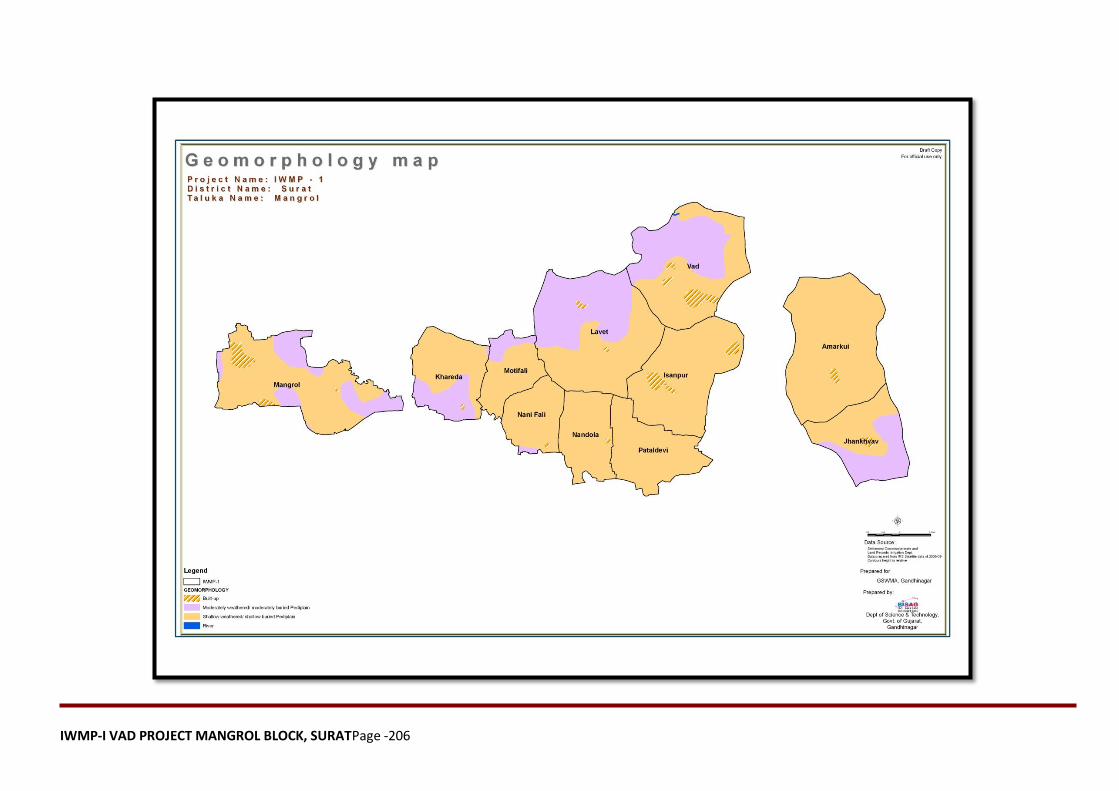
IWMP-I VAD PROJECT MANGROL BLOCK, SURATPage -206

IWMP-I VAD PROJECT MANGROL BLOCK, SURATPage -207
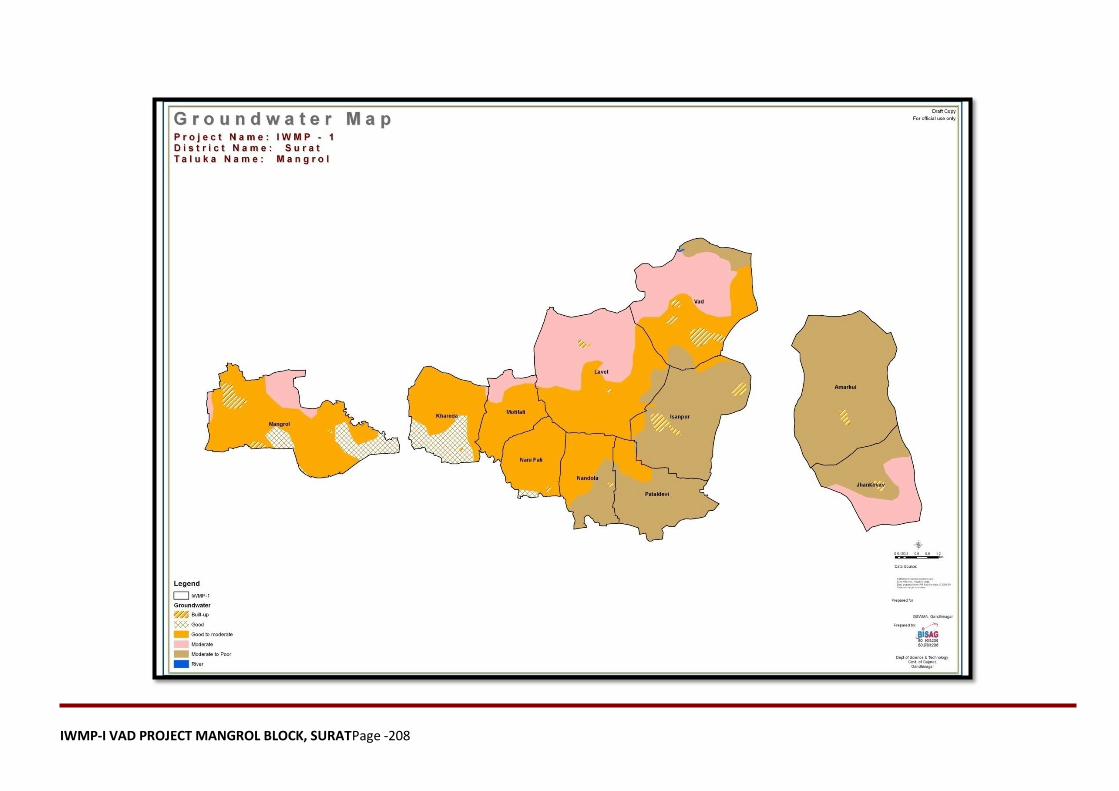
IWMP-I VAD PROJECT MANGROL BLOCK, SURATPage -208

IWMP-I VAD PROJECT MANGROL BLOCK, SURATPage -209
IWMP-I VAD PROJECT MANGROL BLOCK, SURATPage -210
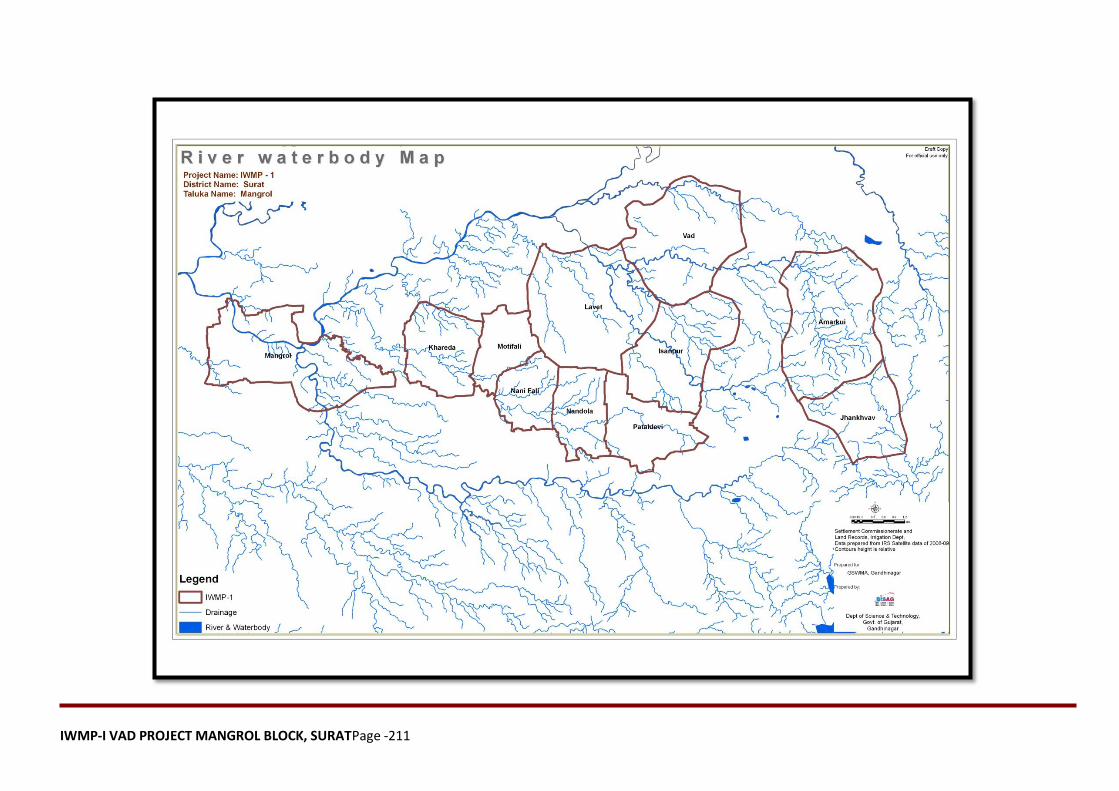
IWMP-I VAD PROJECT MANGROL BLOCK, SURATPage -211
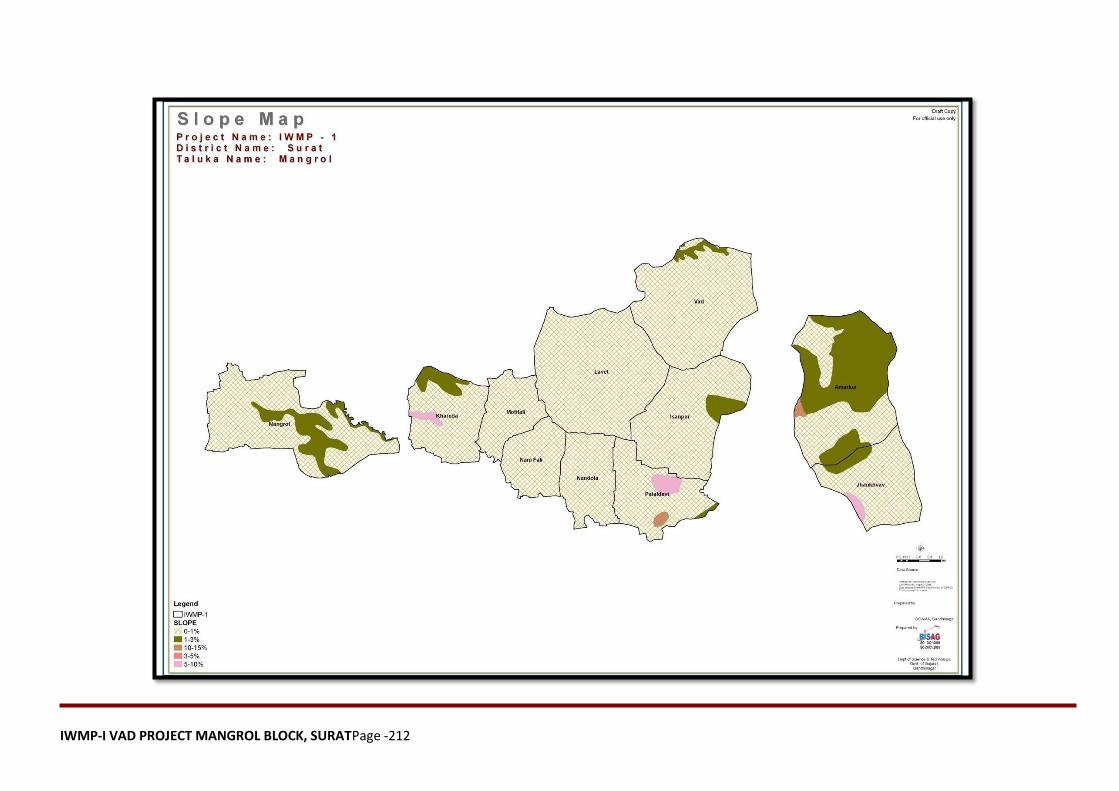
IWMP-I VAD PROJECT MANGROL BLOCK, SURATPage -212

IWMP-I VAD PROJECT MANGROL BLOCK, SURATPage -213
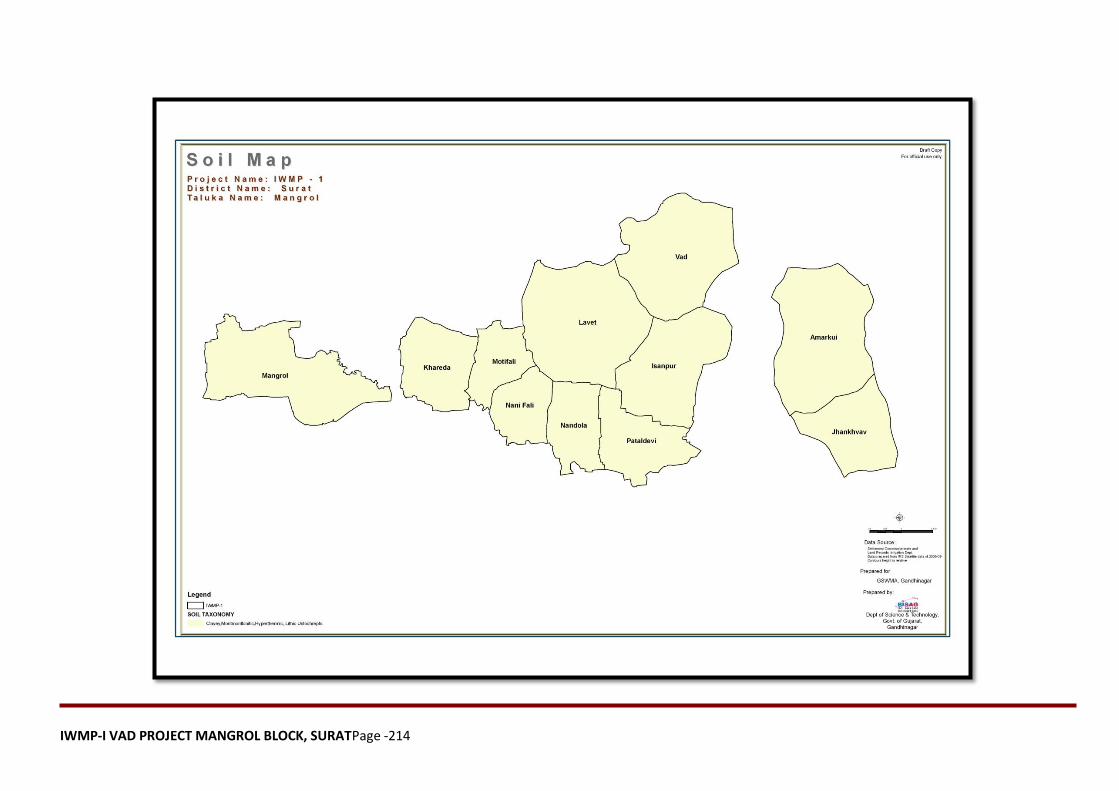
IWMP-I VAD PROJECT MANGROL BLOCK, SURATPage -214

IWMP-I VAD PROJECT MANGROL BLOCK, SURATPage -215
Action Plan Maps
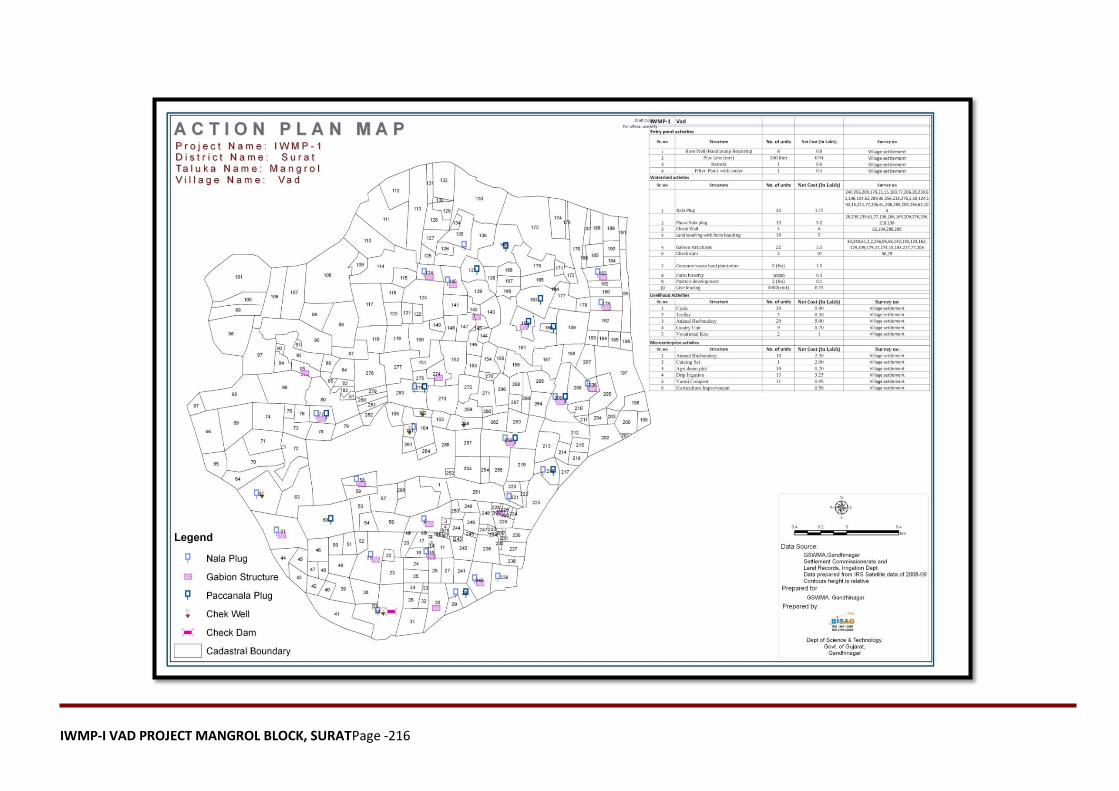
IWMP-I VAD PROJECT MANGROL BLOCK, SURATPage -216
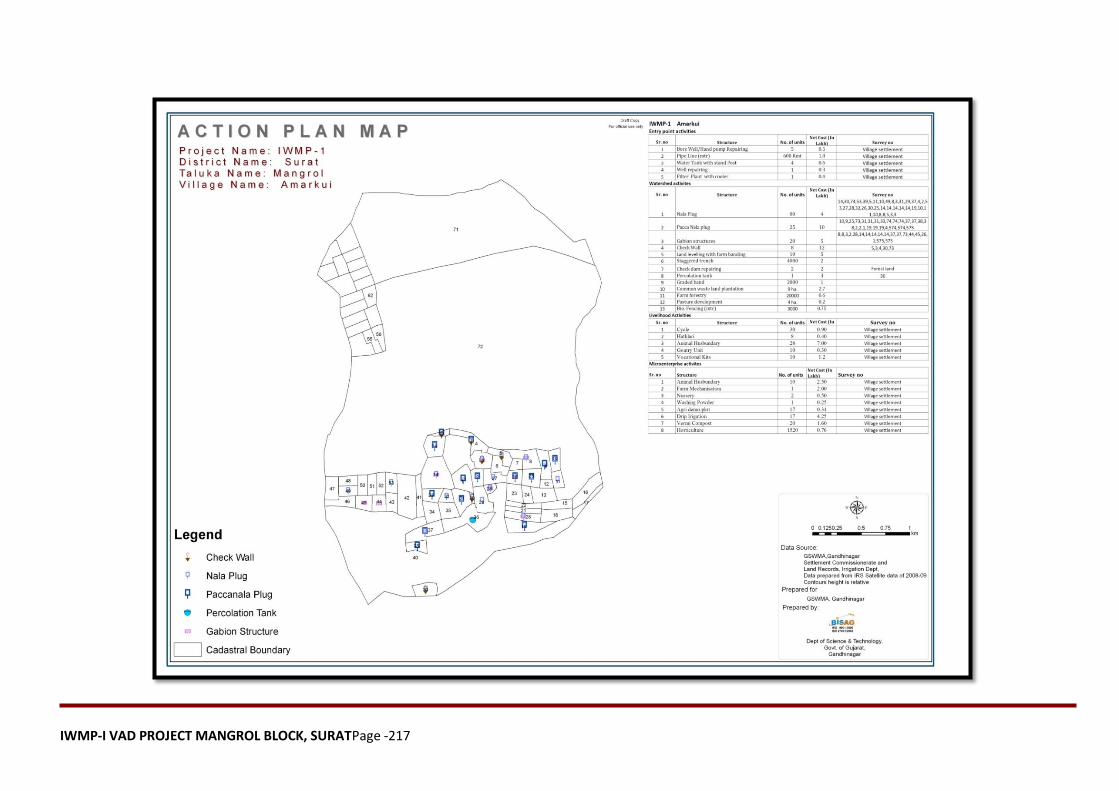
IWMP-I VAD PROJECT MANGROL BLOCK, SURATPage -217
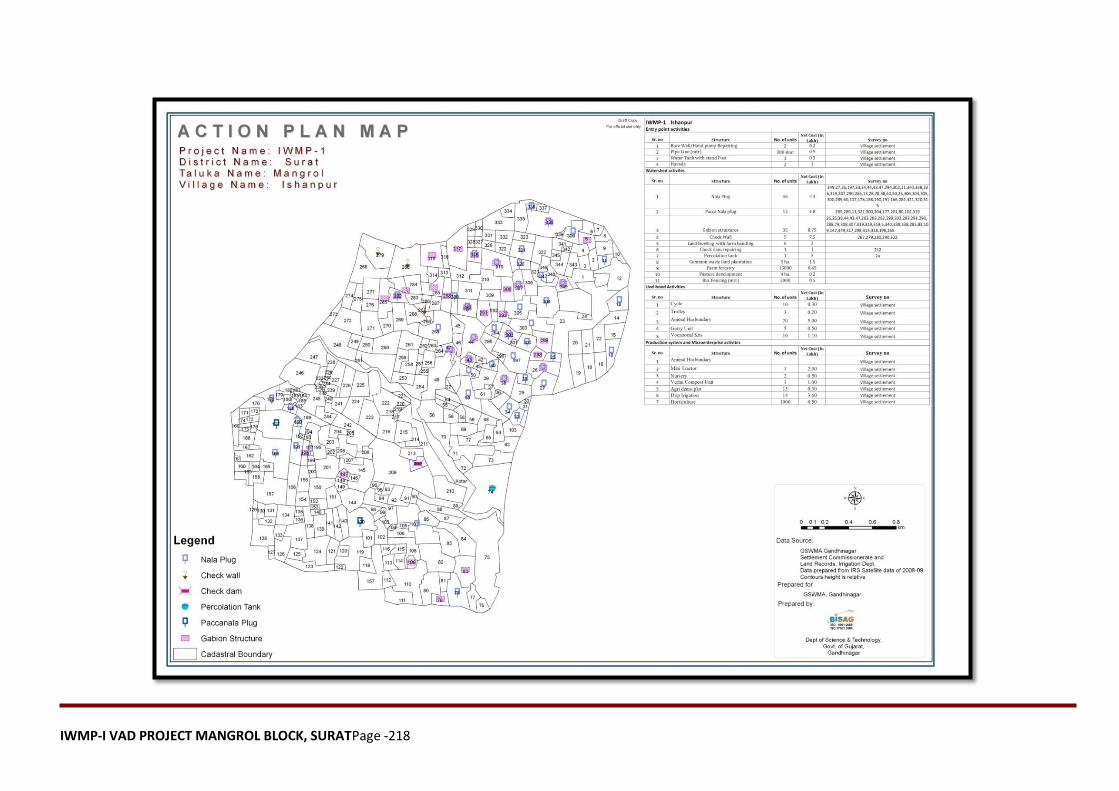
IWMP-I VAD PROJECT MANGROL BLOCK, SURATPage -218
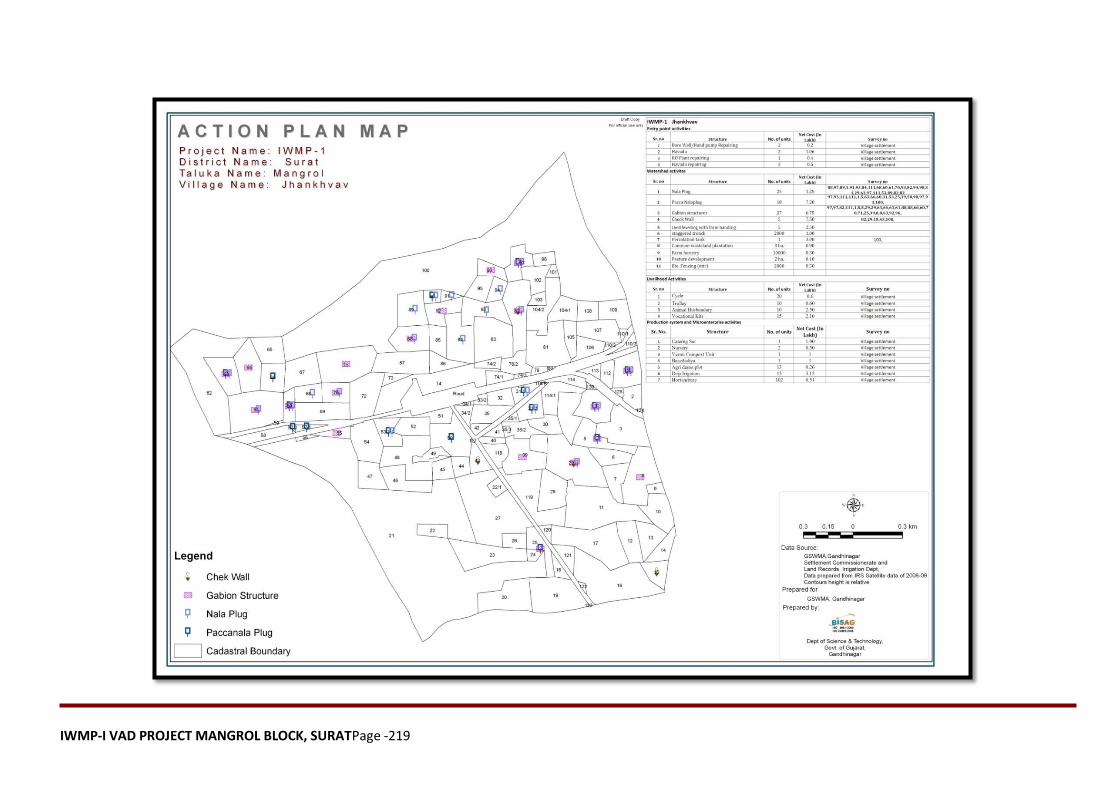
IWMP-I VAD PROJECT MANGROL BLOCK, SURATPage -219
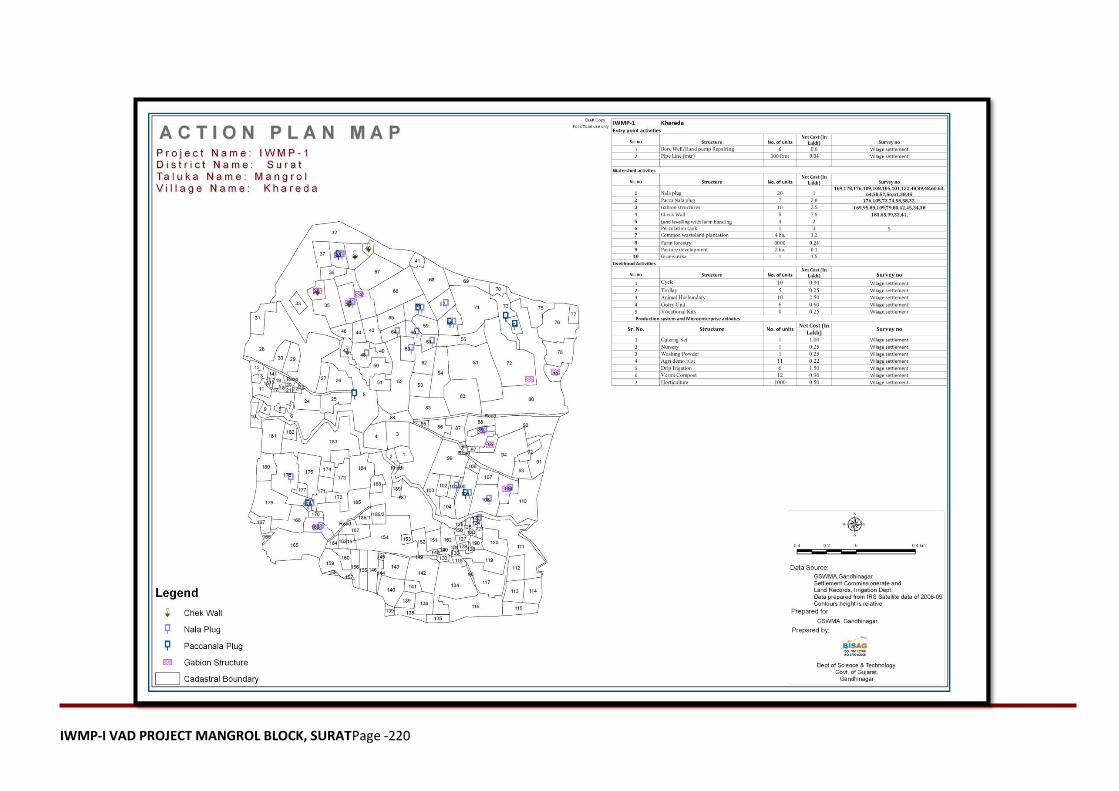
IWMP-I VAD PROJECT MANGROL BLOCK, SURATPage -220
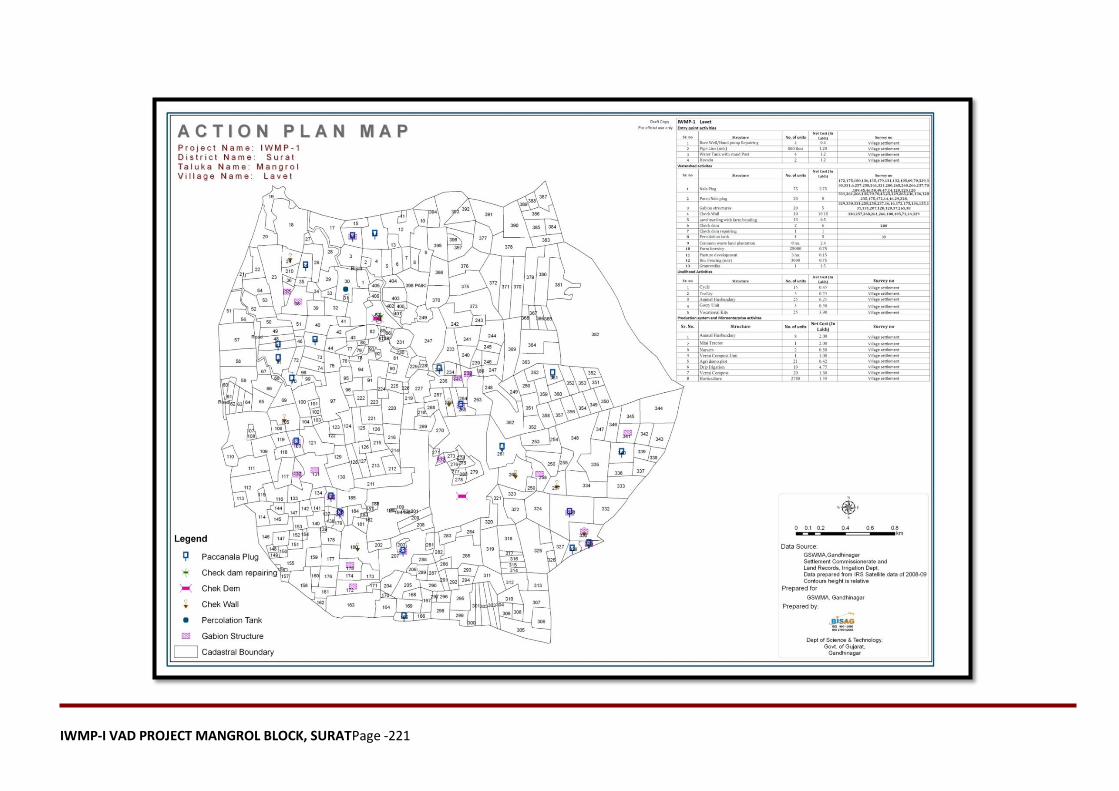
IWMP-I VAD PROJECT MANGROL BLOCK, SURATPage -221
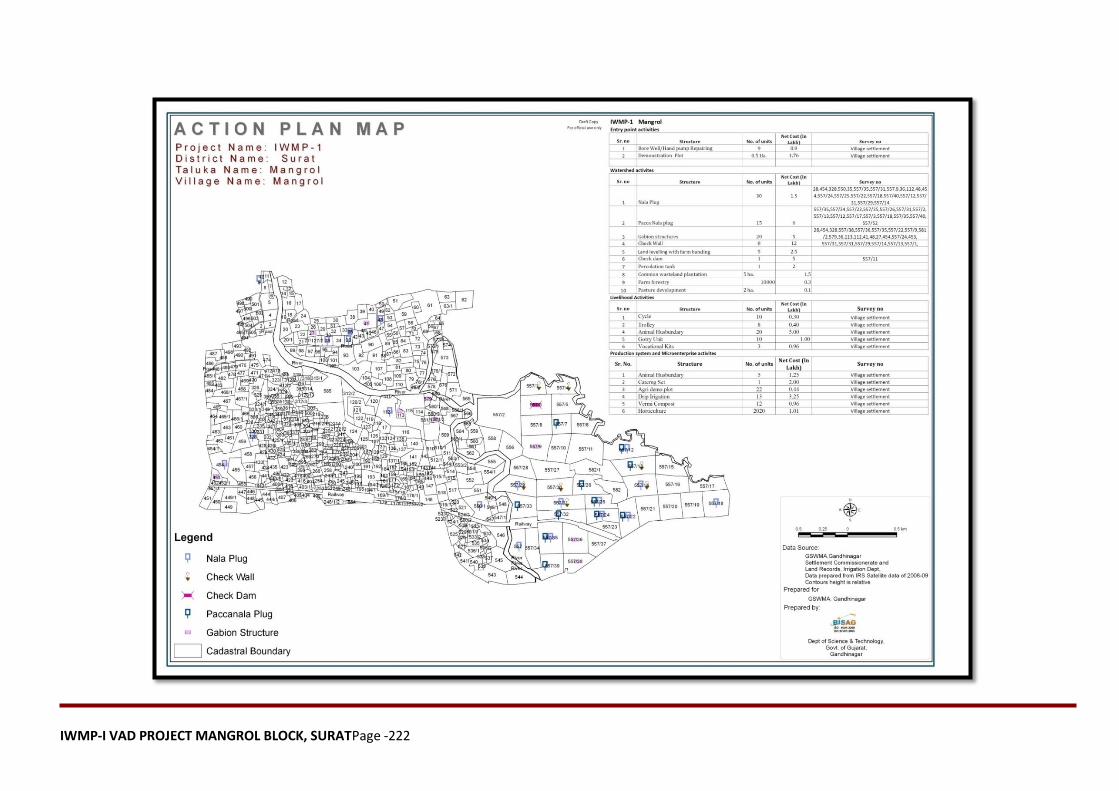
IWMP-I VAD PROJECT MANGROL BLOCK, SURATPage -222
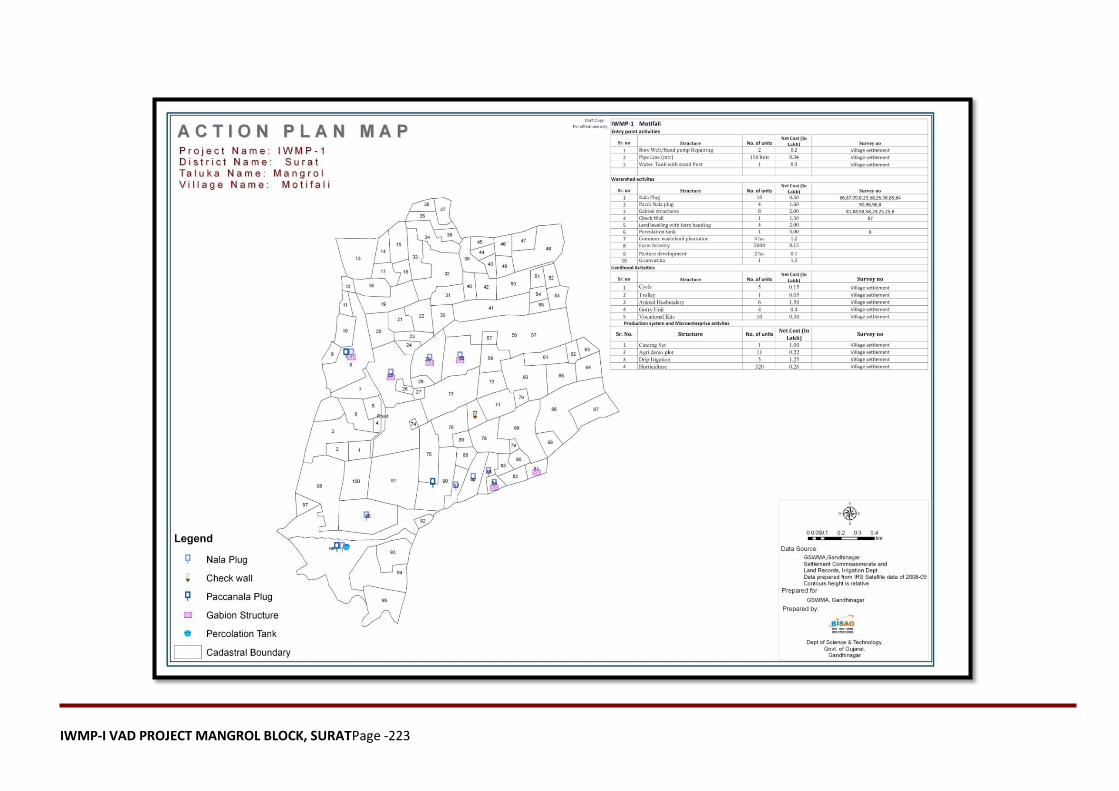
IWMP-I VAD PROJECT MANGROL BLOCK, SURATPage -223
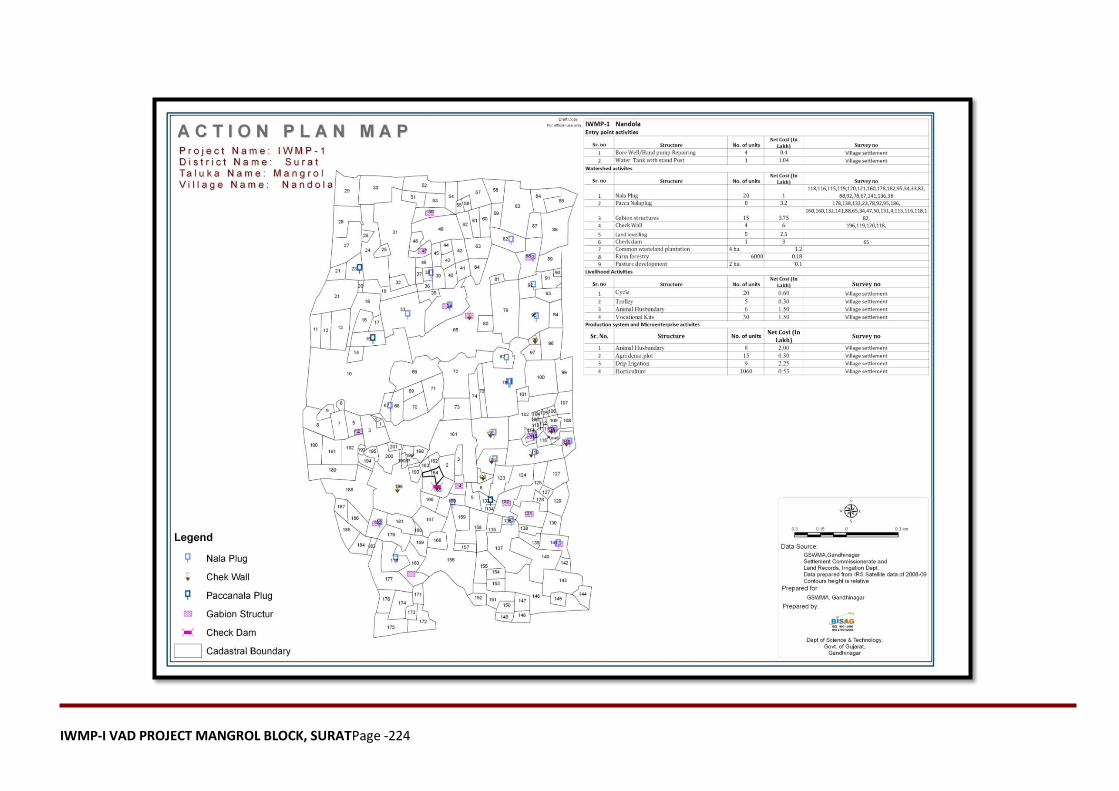
IWMP-I VAD PROJECT MANGROL BLOCK, SURATPage -224
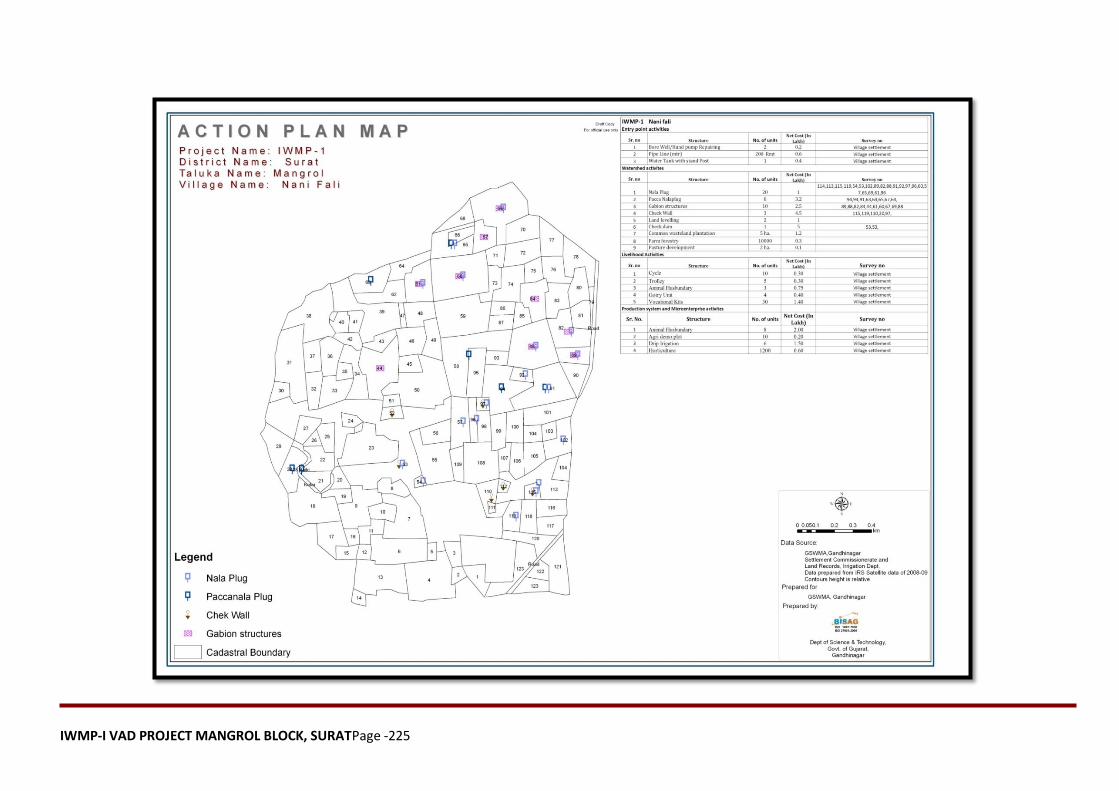
IWMP-I VAD PROJECT MANGROL BLOCK, SURATPage -225
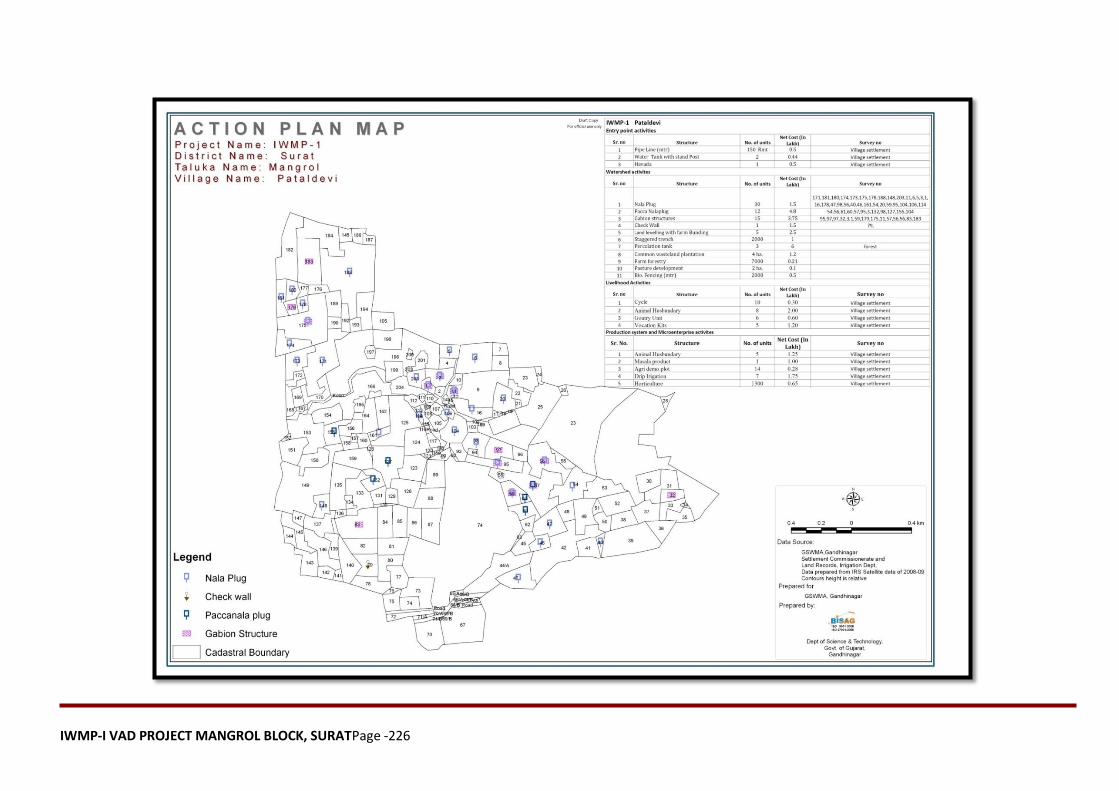
IWMP-I VAD PROJECT MANGROL BLOCK, SURATPage -226

IWMP-I VAD PROJECT MANGROL BLOCK, SURATPage -227