Embed Size (px)
DESCRIPTION
http://banda.ie/assets/files/pdf/J.5607%20Sunday%20Times%20Report%20May%202014.pdf
Citation preview

Sunday Times /Behaviour & Attitudes European Elections May 2014 Opinion Poll 3rd – 15th May, 2014
Prepared for
Prepared by Ian McShane
J.5607

2
Technical Appendix

3
Technical Appendix
● The results of this opinion poll are based upon a representative sample of 1,545 eligible Irish voters aged 18 years +.
● A separate questionnaire was produced for each of three regions to take the three separate European Election constituencies into account. The number of interviews upon which the representative samples of eligible voters in each constituency is based is as follows:
● As such, the results for each constituency can be deemed to be accurate to within plus or minus 4.5 percentage points at the 95% confidence level.
● Fieldwork was conducted over the period 3rd – 14th May, 2014 with interviewing carried out at the Behaviour & Attitudes Computer Aided Telephone Interviewing (CATI) Unit at Milltown House in Dublin.
● Interviewing was conducted across all electoral constituencies in the country with households selected for interview by way of Random Digit Dialling (RDD).
● The sample is split across RDD landline numbers and RDD mobile telephone numbers, so as to ensure that individuals living in landline only households, mobile only households, and households with both a landline and mobile telephone are represented in their correct proportions.
Dublin Constituency 521
Midlands-North-West 513
South Constituency 511

4
Technical Appendix
● The subsequent survey results are weighted to reflect the known demographic profile of Irish adults, utilising the most recently published census population estimates from the Central Statistics Office (CSO).
● All aspects of the survey, including the Party Support adjustment factor, are implemented in accordance with the technical and ethical guidelines set down by the Association of Irish Market Research Organisations (AIMRO) and the European Society of Opinion & Market Research (ESOMAR).

5
Charted Summary

6
Midlands-North-West Constituency

7
Midlands-North-West European Constituency – First Preference Support Levels
Q.1 Which of these candidates would you give your first preference vote to in the European Parliament Election?
Candidate Core Candidate Support
Candidate Support – Excluding Undecideds
% % Thomas Byrne, Fianna Fail 7 9
Matt Carthy, Sinn Fein 11 14
Mark Dearey, Green Party 1 1
T.J. Fay, Independent 0 0
Mark Fitzsimons, Independent - -
Luke ‘Ming’ Flanagan, Independent 13 17
Pat The Cope Gallagher, Fianna Fail 6 8
Ben Gilroy, Direct Democracy Ireland 0 1
Marian Harkin, Independent 9 12
Jim Higgins, Fine Gael 5 7
Lorraine Higgins, Labour Party 4 5
Mairead McGuinness, Fine Gael 16 21
Ronan Mullan, Independent 4 5
Cordelia Nic Fhearraigh, Fis Nua - -
Undecided 23 n/a

8
Midlands-North-West European Constituency – First Preference Support Levels x Gender/Age/Class
Base: All Voters 18 yrs+
Total Gender Age Class
Male Female 18-34 35-54 55+ ABC1F C2DE Base: 513 261 252 154 207 152 249 264
% % % % % % % %
Thomas Byrne, Fianna Fail 7 9 5 2 7 12 7 7
Matt Carthy, Sinn Fein 11 15 7 16 11 5 13 9
Mark Dearey, Green Party 1 1 1 1 1 1 1 1
T.J. Fay, Independent 0 0 - 1 - - - 0
Mark Fitzsimons, Independent - - - - - - - -
Luke ‘Ming’ Flanagan, Independent 13 17 8 17 17 2 14 12
Pat The Cope Gallagher, Fianna Fail 6 5 8 4 5 12 4 8
Ben Gilroy, Direct Democracy Ireland 0 0 1 - 1 - 0 1
Marian Harkin, Independent 9 8 10 4 9 14 8 10
Jim Higgins, Fine Gael 5 6 5 5 3 9 5 5
Lorraine Higgins, Labour Party 4 3 6 5 3 5 4 4
Mairead McGuinness, Fine Gael 16 14 18 11 15 22 19 13
Ronan Mullan, Independent 4 5 3 1 3 7 3 4
Cordelia Nic Fhearraigh, Fis Nua - - - - - - - -
Undecided 23 18 29 32 26 11 21 25
Q.1 Which of these candidates would you give your first preference vote to in the European Parliament Election?

9
Midlands-North-West European Constituency – First Preference Support Levels x Gender/Age/Class Support Excluding Undecideds
Base: All Voters 18 yrs+
Total Gender Age Class
Male Female 18-34 35-54 55+ ABC1F C2DE Base: 394 215 178 104 154 135 196 198
% % % % % % % %
Thomas Byrne, Fianna Fail 9 11 7 3 10 14 9 9
Matt Carthy, Sinn Fein 14 18 9 24 15 6 16 12
Mark Dearey, Green Party 1 1 1 1 1 1 1 1
T.J. Fay, Independent 0 1 - 1 - - - 1
Mark Fitzsimons, Independent - - - - - - - -
Luke ‘Ming’ Flanagan, Independent 17 21 12 26 23 3 17 16
Pat The Cope Gallagher, Fianna Fail 8 6 11 5 6 13 6 11
Ben Gilroy, Direct Democracy Ireland 1 0 1 - 2 - 0 1
Marian Harkin, Independent 12 9 15 6 12 15 10 13
Jim Higgins, Fine Gael 7 7 7 7 4 10 7 7
Lorraine Higgins, Labour Party 5 3 8 8 4 6 5 6
Mairead McGuinness, Fine Gael 21 17 25 16 20 24 24 17
Ronan Mullan, Independent 5 6 4 2 4 8 4 6
Cordelia Nic Fhearraigh, Fis Nua - - - - - - - -
Q.1 Which of these candidates would you give your first preference vote to in the European Parliament Election?

10
Midlands-North-West European Constituency – First Preference Support Levels x Region and Core Party Support Excluding Undecideds
Q.1 Which of these candidates would you give your first preference vote to in the European Parliament Election?
Base: All Voters 18 yrs+ Total
Region Core Party Support Cavan,
Donegal, Leitrim, Louth,
Monaghan
Galway, Mayo,
Roscommon, Sligo
Kildare, Laois,
Longford, Meath, Offaly,
Westmeath
Fianna Fail
Fine Gael Labour Green
Party Sinn Fein
Indep/ Others
Undecided
Base: 394 118 127 149 86 99 14 3 62 68 61 % % % % % % % % % % %
Thomas Byrne, Fianna Fail 9 4 11 12 34 - 1 - - 5 6 Matt Carthy, Sinn Fein 14 24 8 11 2 3 - - 74 5 1
Mark Dearey, Green Party 1 2 1 0 0 - 9 29 - 3 1
T.J. Fay, Independent 0 - - 1 - - - - - 2 - Mark Fitzsimons, Independent - - - - - - - - - - -
Luke ‘Ming’ Flanagan, Independent 17 10 23 17 15 9 1 - 12 35 20
Pat The Cope Gallagher, Fianna Fail 8 17 5 4 20 4 - - - 6 12
Ben Gilroy, Direct Democracy Ireland 1 1 - 1 - - - - - 4 -
Marian Harkin, Independent 12 13 18 6 11 6 25 71 3 20 16
Jim Higgins, Fine Gael 7 3 13 5 6 16 4 - - 7 3 Lorraine Higgins, Labour Party 5 - 10 6 5 6 37 - 4 1 4
Mairead McGuinness, Fine Gael 21 23 7 30 6 53 22 - 5 5 23
Ronan Mullan, Independent 5 2 4 7 1 3 - - 3 7 14
Cordelia Nic Fhearraigh, Fis Nua - - - - - - - - - - -

11
Midlands-North-West European Constituency – Second Preference Support Levels Excluding First Preference Undecideds Base: : All Voters 18 yrs+
Total
First Preference Choice Thomas Byrne,
Fianna Fail
Matt Carthy,
Sinn Fein
Mark Dearey, Green Party
T.J. Fay, Independ
ent
Luke ‘Ming’
Flanagan, Independ
ent
Pat The Cope
Gallagher, Fianna
Fail
Ben Gilroy, Direct
Democracy Ireland
Marian Harkin,
Independent
Jim Higgins, Fine Gael
Lorainne Higgins, Labour Party
Mairead McGuinness, Fine
Gael
Ronan Mullan,
Independent
Base: 394 36 55 5 1 65 33 3 46 27 21 81 19 % % % % % % % % % % % % %
Thomas Byrne, Fianna Fail 9 - 7 - - 8 30 - 3 - 3 10 29
Matt Carthy, Sinn Fein 3 - - - - 11 4 - - - 2 3 6
Mark Dearey, Green Party 2 - 4 - - 1 - - - - 3 5 -
T.J. Fay, Independent 1 - 4 - - - - - 3 - - - -
Mark Fitzsimons, Independent 1 - - - 100 - - - 2 - - - -
Luke ‘Ming’ Flanagan, Independent 10 9 12 20 - - 10 29 13 13 28 9 12
Pat The Cope Gallagher, Fianna Fail 11 60 4 - - 5 - - 10 - 12 9 2
Ben Gilroy, Direct Democracy Ireland 1 - - 7 - 1 - - - - - 3 -
Marian Harkin, Independent 10 4 24 - - 17 3 - - 14 7 9 7
Jim Higgins, Fine Gael 8 - 3 - - 4 3 - 5 - 7 30 -
Lorraine Higgins, Labour Party 3 3 1 - - 4 7 - 6 - - 3 -
Mairead McGuinness, Fine Gael 13 6 5 16 - 11 24 - 22 50 14 - 17
Ronan Mullan, Independent 3 4 2 - - 2 - - 10 7 - 1 -
Cordelia Nic Fhearraigh, Fis Nua 0 - - - - 2 - - - - - - -
Undecided / No second preference 25 14 35 58 - 35 20 71 25 16 24 18 28
Q.1a And which of these candidates would you give your second preference to in the European Parliament Election?
12
Midlands North West European Constituency – Interpretation and Analysis
A four seat constituency, Midlands North West sprawls from Donegal in the North down to Galway and Mayo in the West, and into Laois Offaly in the Midlands. Given the geographical spread of the constituency, both Fine Gael and Fianna Fáil are running two candidates, with each emanating from different ends of the constituency.
Based on today’s figures, Lorraine Higgins of the Labour Party, along with the Independent candidate Ronan Mullen, are likely to be eliminated relatively early in the proceedings.
Regardless of how these, and indeed subsequent transfers pan out, Mairead McGuinness of Fine Gael and Luke “Ming” Flanagan are both in a very strong position to take the first and second seats respectively. Indeed, McGuinness may well make it over the line on the first count. Her vote is very strong across all socio demographic groupings, as well as in the Northern and Midlands areas of the constituency.
Flanagan’s appeal over-index’s amongst male voters, but also holds up well across the broad 18 – 54 year old age band. While his support peaks at 23% in the Western part of the constituency, he also performs well in the Midlands, and indeed amongst supporters of most of the mainstream political parties.
It seems very unlikely at this stage that there are two Fine Gael seats in the constituency, and Jim Higgins is likely to be eliminated in or around the 2nd or 3rd count, with McGuinness and, to a lesser extent, Harkin and Flanagan benefitting from his transfers.

13
Midlands North West European Constituency – Interpretation and Analysis
From Fianna Fáil’s perspective, Thomas Byrne and Pat The Cope Gallagher are neck and neck on 1st preferences, with close to a quota between them. Based on today’s figures, if Byrne was eliminated before Pat the Cope, 60% of his transfers would go to Gallagher, leaving the Donegal based candidate in strong contention for the 3rd or 4th seat.
If, however, Gallagher is eliminated first, his 2nd preferences will haemorrhage across the board, with Mairead McGuinness picking up as many of them as would his running mate Byrne. In such a scenario, Byrne would likely lose out, with Fianna Fáil winning no seats at all in this constituency.
If this pattern of voting unfolded in next week’s election, the likely end result would be a seat for McGuinness of Fine Gael and the Independent Luke Ming
Flanagan, along with Matt Carthy of Sinn Féin and Marian Harkin, Independent.
If, however, Fianna Fáil can improve upon its dual candidate transfer strategy over the next week, Pat the Cope Gallagher could well take the 3rd seat, leaving Marian
Harkin and Matt Carthy in a battle royale for the last one.

14
Dublin Constituency

15
Dublin European Constituency – First Preference Support Levels
Q.1 Which of these candidates would you give your first preference vote to in the European Parliament Election?
Candidate Core Candidate Support
Candidate Support – Excluding Undecideds
% % Lynn Boylan (Lynn Ní Bhaoigheallain) Sinn Fein 14 19
Nessa Childers, Independent 8 11
Emer Costello, Labour Party 5 7
Thomas Darcy, Direct Democracy Ireland - -
Mary Fitzpatrick, Fianna Fail 9 12
Brian Hayes, Fine Gael 12 16
Paul Murphy, Stop the Water Tax/ Socialist Party 6 9
Eamon Ryan, Green Party 8 11
Brid Smith, People Before Profit Alliance 7 10
Jim Tallon, Independent 2 3
Raymond Patrick Whitehead, Direct Democracy Ireland 0 1
Damon Matthew Wise, Fis Nua 0 1
Undecided 27 N/A

16
Dublin European Constituency – First Preference Support Levels x Gender/Age/Class
Base: All Voters 18 yrs+ Total
Gender Age Class Male Female 18-34 35-54 55+ ABC1F C2DE
Base: 521 241 280 194 179 148 234 287 % % % % % % % %
Lynn Boylan (Lynn Ní Bhaoigheallain) Sinn Fein 14 18 10 10 21 12 5 21
Nessa Childers, Independent 8 7 9 4 6 17 9 8
Emer Costello, Labour Party 5 5 5 5 4 6 9 2
Thomas Darcy, Direct Democracy Ireland - - - - - - - -
Mary Fitzpatrick, Fianna Fail 9 13 6 8 7 13 11 8
Brian Hayes, Fine Gael 12 10 14 8 14 14 16 9
Paul Murphy, Stop the Water Tax/ Socialist Party 6 8 5 8 8 1 5 8
Eamon Ryan, Green Party 8 7 9 6 10 9 12 5
Brid Smith, People Before Profit Alliance 7 9 6 8 7 7 6 8
Jim Tallon, Independent 2 3 2 3 2 3 1 3
Raymond Patrick Whitehead, Direct Democracy Ireland 0 1 - - 1 - 1 -
Damon Matthew Wise, Fis Nua 0 - 1 1 - - - 1
Undecided 27 19 33 39 20 18 26 27
Q.1 Which of these candidates would you give your first preference vote to in the European Parliament Election?

17
Dublin European Constituency – First Preference Support Levels x Gender/Age/Class Excluding Undecideds Base: All Voters 18 yrs+
Total Gender Age Class
Male Female 18-34 35-54 55+ ABC1F C2DE Base: 382 195 187 119 142 121 174 208
% % % % % % % %
Lynn Boylan (Lynn Ní Bhaoigheallain) Sinn Fein 19 23 15 16 26 15 7 29
Nessa Childers, Independent 11 9 13 6 7 21 12 10
Emer Costello, Labour Party 7 6 8 8 5 8 12 2
Thomas Darcy, Direct Democracy Ireland - - - - - - - -
Mary Fitzpatrick, Fianna Fail 12 16 9 13 9 16 14 11
Brian Hayes, Fine Gael 16 12 21 14 18 17 21 12
Paul Murphy, Stop the Water Tax/ Socialist Party 9 10 7 14 11 2 7 10
Eamon Ryan, Green Party 11 9 13 10 12 11 16 7
Brid Smith, People Before Profit Alliance 10 12 8 14 9 8 8 11
Jim Tallon, Independent 3 3 3 5 2 3 2 5
Raymond Patrick Whitehead, Direct Democracy Ireland 1 1 - - 2 - 1 -
Damon Matthew Wise, Fis Nua 1 - 1 2 - - - 1
Q.1 Which of these candidates would you give your first preference vote to in the European Parliament Election?

18
Dublin European Constituency – First Preference Support Levels x Region and Core Party Support Excluding Undecideds
Q.1 Which of these candidates would you give your first preference vote to in the European Parliament Election?
Base: : All Voters 18 yrs+
Total
Region Core Party Support Dun
Laoghaire - Rathdown
Dublin City Council
Fingal South Dublin CC
Fianna Fail
Fine Gael Labour Green Party
Sinn Fein Indep/ Others
Undecided
Base: 382 76 153 75 78 54 73 35 16 74 87 43 % % % % % % % % % % % %
Lynn Boylan (Lynn Ní Bhaoigheallain) Sinn Fein 19 8 19 31 19 3 1 21 - 69 12 4
Nessa Childers, Independent 11 12 12 12 7 7 12 13 - 6 17 14
Emer Costello, Labour Party 7 7 7 10 4 1 4 46 - 3 2 8
Thomas Darcy, Direct Democracy Ireland - - - - - - - - - - - -
Mary Fitzpatrick, Fianna Fail 12 5 19 11 7 67 1 4 7 2 3 9
Brian Hayes, Fine Gael 16 28 10 11 23 - 70 2 - 2 5 11
Paul Murphy, Stop the Water Tax/ Socialist Party
9 9 10 6 8 9 - 2 - 9 11 27
Eamon Ryan, Green Party 11 19 6 11 14 10 9 5 79 1 11 13
Brid Smith, People Before Profit Alliance 10 11 10 6 13 1 3 9 - 6 30 3
Jim Tallon, Independent 3 1 5 2 2 3 0 - - 2 9 4
Raymond Patrick Whitehead, Direct Democracy Ireland
1 - 1 - - - - - 14 - - -
Damon Matthew Wise, Fis Nua 1 - - - 3 - - - - - - 6
19
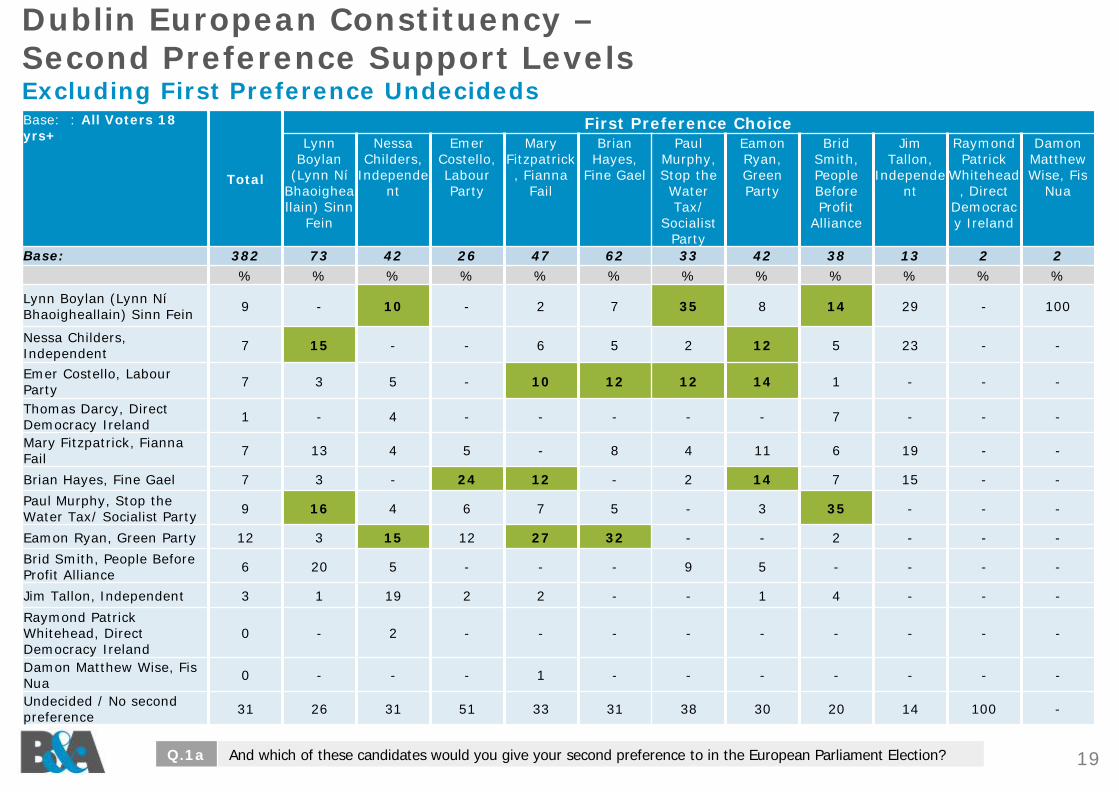
Dublin European Constituency – Second Preference Support Levels Excluding First Preference Undecideds Base: : All Voters 18 yrs+
Total
First Preference Choice Lynn
Boylan (Lynn Ní
Bhaoigheallain) Sinn
Fein
Nessa Childers,
Independent
Emer Costello, Labour Party
Mary Fitzpatrick, Fianna
Fail
Brian Hayes,
Fine Gael
Paul Murphy, Stop the Water Tax/
Socialist Party
Eamon Ryan, Green Party
Brid Smith, People Before Profit
Alliance
Jim Tallon,
Independent
Raymond Patrick
Whitehead, Direct
Democracy Ireland
Damon Matthew Wise, Fis
Nua
Base: 382 73 42 26 47 62 33 42 38 13 2 2 % % % % % % % % % % % %
Lynn Boylan (Lynn Ní Bhaoigheallain) Sinn Fein 9 - 10 - 2 7 35 8 14 29 - 100
Nessa Childers, Independent 7 15 - - 6 5 2 12 5 23 - -
Emer Costello, Labour Party 7 3 5 - 10 12 12 14 1 - - -
Thomas Darcy, Direct Democracy Ireland 1 - 4 - - - - - 7 - - -
Mary Fitzpatrick, Fianna Fail 7 13 4 5 - 8 4 11 6 19 - -
Brian Hayes, Fine Gael 7 3 - 24 12 - 2 14 7 15 - - Paul Murphy, Stop the Water Tax/ Socialist Party 9 16 4 6 7 5 - 3 35 - - -
Eamon Ryan, Green Party 12 3 15 12 27 32 - - 2 - - - Brid Smith, People Before Profit Alliance 6 20 5 - - - 9 5 - - - -
Jim Tallon, Independent 3 1 19 2 2 - - 1 4 - - - Raymond Patrick Whitehead, Direct Democracy Ireland
0 - 2 - - - - - - - - -
Damon Matthew Wise, Fis Nua 0 - - - 1 - - - - - - -
Undecided / No second preference 31 26 31 51 33 31 38 30 20 14 100 -
Q.1a And which of these candidates would you give your second preference to in the European Parliament Election?

20
Dublin European Constituency – Interpretation and Analysis
Reduced to just a three seat constituency, Dublin will arguably be the most hard fought of all Euro constituencies next week.
A quarter of all potential voters in this constituency remain undecided as to how they will cast their vote on Election Day. The fact that this undecided bloc is heavily skewed towards potential female voters may well have a bearing on the outcome of the final seat, assuming of course the undecideds vote at all.
Based upon today’s Poll, Lynn Boylan of Sinn Féin is in a strong position to top the Poll next Friday, at in or around 19% of the 1st preference vote. Boylan’s vote is heavily biased towards male voters, those from a skilled or semi-skilled manual working background and actually peaks amongst 35-54 year olds.
Boylan will also be pleased to note that as many as a fifth of those voters who describe themselves as Labour Party voters in more general terms also intend to give her their first preference.
Brian Hayes of Fine Gael is also in a very strong position, garnering 16% of 1st preferences in our Poll. Hayes performs particularly well amongst female voters and those from a middle to upper socio economic background.
The Fine Gael contender also leads the field in the South Dublin County and Dun Laoghaire - Rathdown geographical regions.

21
Dublin European Constituency – Interpretation and Analysis
Regardless of how transfer patterns pan out on the day of the count, both Boylan for Sinn Féin and Hayes for Fine Gael look set to take the first two of the Dublin European constituency seats.
A review of 1st preference voting intentions across the remaining candidates then shows a tight tussle for the third seat, with Mary Fitzpatrick of Fianna Fáil, Eamon Ryan of the Green Party, Independent Nessa Childers, Brid Smith of the People Before Profit Alliance, and even Paul Murphy of the Socialist Party all still very much in contention.
As things stand, Emer Costello is in danger of being eliminated during the early stages of the count, with Brian Hayes of Fine Gael the single greatest recipient of her transfers at that stage.
A key turning point in the count would then likely arise following the elimination of Costello and the lower placed candidates.
Based on today’s figures, either Brid Smith or Paul Murphy would be eliminated on the following count. If Brid Smith is eliminated first, Paul Murphy would benefit disproportionately from her transfers, leaving him in contention for the final seat at least until the 5th or 6th count.
If, however, Paul Murphy is eliminated before Brid Smith, a large proportion of his transfers will convert to Lynn Boylan of Sinn Féin, with Smith only benefitting marginally.

22
Dublin European Constituency – Interpretation and Analysis
Regardless of the order in which either of Smith or Murphy is eliminated, however, neither would likely pick up the last seat at the end of the day.
Indeed, if the results of the Poll were replicated precisely on Election Day, we would see Lynn Boylan and Brian Hayes elected comfortably, with Mary Fitzpatrick
of Fianna Fáil taking the final seat ahead of Nessa Childers on the last count.
In reality, there is no way of predicting at this stage the outcome of the final seat, with any one of the aforementioned five candidates still very much in the running.

23
South Constituency

24
South European Constituency – First Preference Support Levels
Q.1 Which of these candidates would you give your first preference vote to in the European Parliament Election?
Candidate Core Candidate Support
Candidate Support – Excluding Undecideds
% % Richard Cahill, Independent 2 2
Deirdre Clune, Fine Gael 7 10
Brian Crowley, Fianna Fail 24 35
Jillian Godsil, Independent 1 2
Simon Harris, Fine Gael 5 8
Kieran Hartley, Fianna Fail 0 1
Theresa Heaney, Catholic Democrats (The National Party)
1 1
Sean Kelly, Fine Gael 11 17
Liadh Ní Riada, Sinn Fein 10 14
Diarmuid Patrick O'Flynn, Independent 1 2
Peter O'Loughlin, Independent 1 1
Dónal Ó'Ríordáin, Fis Nua - -
Grace O'Sullivan, Green Party 2 3
Phil Prendergast, Labour Party 4 5
Jan Van De Ven, Direct Democracy Ireland 1 1
Undecided 31 n/a

25
South European Constituency – First Preference Support Levels x Gender/Age/Class
Base: All Voters 18 yrs+
Total Gender Age Class
Male Female 18-34 35-54 55+ ABC1F C2DE Base: 511 252 259 181 182 148 247 264
% % % % % % % % Richard Cahill, Independent 2 1 2 1 2 1 1 2
Deirdre Clune, Fine Gael 7 5 9 7 5 9 7 7
Brian Crowley, Fianna Fail 24 25 23 14 30 29 23 24
Jillian Godsil, Independent 1 1 1 1 1 1 0 2
Simon Harris, Fine Gael 5 4 7 6 6 5 7 4
Kieran Hartley, Fianna Fail 0 0 0 0 0 0 1 0
Theresa Heaney, Catholic Democrats (The National Party)
1 1 0 - 1 0 1 0
Sean Kelly, Fine Gael 11 16 7 16 9 9 13 10
Liadh Ní Riada, Sinn Fein 10 11 8 4 10 16 10 9
Diarmuid Patrick O'Flynn, Independent
1 1 1 0 2 0 2 0
Peter O'Loughlin, Independent 1 1 1 1 1 0 0 1
Dónal Ó'Ríordáin, Fis Nua - - - - - - - -
Grace O'Sullivan, Green Party 2 3 1 1 4 1 2 2
Phil Prendergast, Labour Party 4 4 3 6 2 3 3 4
Jan Van De Ven, Direct Democracy Ireland
1 1 0 0 0 1 0 1
Undecided 31 26 37 42 25 26 29 34
Q.1 Which of these candidates would you give your first preference vote to in the European Parliament Election?

26
South European Constituency – First Preference Support Levels x Gender/Age/Class Excluding Undecideds Base: All Voters 18 yrs+
Total
Gender Age Class Male Female 18-34 35-54 55+ ABC1F C2DE
Base: 350 187 163 105 136 110 176 175 % % % % % % % %
Richard Cahill, Independent 2 2 3 3 3 1 1 3
Deirdre Clune, Fine Gael 10 6 14 11 7 12 10 10
Brian Crowley, Fianna Fail 35 33 36 24 40 39 33 36
Jillian Godsil, Independent 2 1 2 2 2 1 0 3
Simon Harris, Fine Gael 8 5 10 10 8 6 10 6
Kieran Hartley, Fianna Fail 1 1 0 0 1 0 1 0
Theresa Heaney, Catholic Democrats (The National Party) 1 1 1 - 2 0 1 1
Sean Kelly, Fine Gael 17 22 11 27 12 12 19 15
Liadh Ní Riada, Sinn Fein 14 15 13 8 13 22 14 14
Diarmuid Patrick O'Flynn, Independent 2 2 1 0 3 1 2 1
Peter O'Loughlin, Independent 1 1 1 2 1 1 0 2
Dónal Ó'Ríordáin, Fis Nua - - - - - - - -
Grace O'Sullivan, Green Party 3 4 2 2 5 1 3 3
Phil Prendergast, Labour Party 5 6 4 10 3 4 4 6
Jan Van De Ven, Direct Democracy Ireland 1 1 1 1 1 1 1 1
Q.1 Which of these candidates would you give your first preference vote to in the European Parliament Election?

27
South European Constituency – First Preference Support Levels x Region and Core Party Support Excluding Undecideds
Q.1 Which of these candidates would you give your first preference vote to in the European Parliament Election?
Base: All Voters 18 yrs+ Total
Region Core Party Support Cork, Kerry Clare,
Limerick, Tipperary
Carlow, Kilkenny,
Waterford, Wexford, Wicklow
Fianna Fail
Fine Gael
Labour Green Party
Sinn Fein
Indep/ Others
Undecided
Base: 350 149 98 103 82 79 17 4 56 52 61 % % % % % % % % % % %
Richard Cahill, Independent 2 0 3 4 3 - 4 - 4 5 - Deirdre Clune, Fine Gael 10 19 4 3 1 27 17 - 2 11 5
Brian Crowley, Fianna Fail 35 35 41 28 67 24 4 16 4 29 48
Jillian Godsil, Independent 2 1 1 4 2 - - 14 1 4 1
Simon Harris, Fine Gael 8 - 5 22 5 15 2 - 3 7 11
Kieran Hartley, Fianna Fail 1 0 - 1 1 - - - - 1 1
Theresa Heaney, Catholic Democrats (The National Party)
1 1 - 1 2 - - - - - 2
Sean Kelly, Fine Gael 17 20 16 13 11 31 25 20 14 10 12
Liadh Ní Riada, Sinn Fein 14 17 13 11 0 - 7 - 65 8 12
Diarmuid Patrick O'Flynn, Independent 2 2 2 0 2 - - - 1 5 1
Peter O'Loughlin, Independent 1 - 1 3 - 1 - - 2 3 1
Dónal Ó'Ríordáin, Fis Nua - - - - - - - - - - -
Grace O'Sullivan, Green Party 3 1 4 4 - 1 3 51 2 5 6
Phil Prendergast, Labour Party 5 3 11 3 4 2 38 - - 13 1
Jan Van De Ven, Direct Democracy Ireland 1 1 - 2 2 - - - 3 - -

28
South European Constituency – Second Preference Support Levels Excluding First Preference Undecideds
Base: : All Voters 18 yrs+ -
Total
First Preference Choice Richard Cahill,
Independent
Deirdre Clune, Fine Gael
Brian Crowley,
Fianna Fail
Jillian Godsil,
Independent
Simon Harris,
Fine Gael
Kieran Hartley,
Fianna Fail
Theresa Heaney, Catholic
Democrats (The
National Party)
Sean Kelly,
Fine Gael
Liadh Ní Riada,
Sinn Fein
Diarmuid Patrick O'Flynn, Indepen
dent
Peter O'Loughlin, Independen
t
Grace O'Sullivan, Green
Party
Phil Prender
gast, Labour Party
Jan Van De Ven, Direct
Democracy
Ireland
Base: 350 8 35 122 6 27 2 3 58 49 5 4 10 18 3 % % % % % % % % % % % % % % %
Richard Cahill, Independent 3 - - 4 19 - - - 3 1 - - 3 4 -
Deirdre Clune, Fine Gael 7 8 - 7 - 16 - - 18 - - - - - -
Brian Crowley, Fianna Fail 18 6 46 - 29 20 31 63 34 15 47 - 7 33 -
Jillian Godsil, Independent 2 44 2 - - - - - 1 2 - 30 5 - -
Simon Harris, Fine Gael 4 26 4 5 - - - - 6 4 - - 13 - -
Kieran Hartley, Fianna Fail 5 - - 13 - - - - - 1 - 21 5 - -
Theresa Heaney, Catholic Democrats (The National Party)
0 - - - - - - - 1 - - - - - -
Sean Kelly, Fine Gael 12 - 28 16 - - 13 - - 16 - - 3 27 -
Liadh Ní Riada, Sinn Fein 6 - 4 6 - 3 - 37 10 - 12 23 8 - 100
Diarmuid Patrick O'Flynn, Independent 2 - - 1 - - - - - 9 - - 5 - -
Peter O'Loughlin, Independent 1 16 - 0 33 - - - - 2 - - - - -
Dónal Ó'Ríordáin, Fis Nua - - - - - - - - - - - - - - -
Grace O'Sullivan, Green Party 2 - 1 3 - 4 - - 1 1 15 - - - -
Phil Prendergast, Labour Party 6 - 11 8 - 6 - - 8 2 - - - - -
Jan Van De Ven, Direct Democracy Ireland 1 - - - - - - - 3 - - - - - -
Undecided / No Second Preference 31 - 4 36 19 51 55 - 15 47 27 26 50 36 -
Q.1a And which of these candidates would you give your second preference to in the European Parliament Election?
29
South European Constituency – Interpretation and Analysis The South constituency is also a vast one, encompassing swathes of the so-called Greater Dublin Area such as Wicklow and Wexford, across to Limerick and Clare, swooping down to Cork and Kerry.
As is the case in the Midlands North West constituency, the vast geographical constituency footprint has led both Fianna Fáil and Fine Gael to run multiple candidates. In this instance, however, Fine Gael appears to have struck the perfect balance between type of candidate and his/her electoral heartland within the broader constituency.
Fianna Fáil’s dual candidate strategy has, meanwhile, singularly failed, if only by virtue of the vote catching phenomenon that is Brian Crowley.
Of all three European constituencies, Euro South appears the most clear cut with regard to predicting the allocation of seats by party.
As such, Brian Crowley of Fianna Fáil is set to top the Poll at in or around a third of all 1st preference cast, and will be comfortably returned to the European Parliament. At a surface level, Fianna Fáil might be criticised for failing to formulate an effective vote splitting strategy between Crowley and Kieran Hartley , whereby the combined Fianna Fáil vote of 36% would be more evenly split between the two candidates on the 1st count.
Closer examination of the Poll findings reveals, however, that the Crowley vote, as always, is in large part a personal one, with just 13% of his surplus likely to transfer to Hartley on the 2nd count.

30
South European Constituency – Interpretation and Analysis Indeed, an analysis of Brian Crowley’s vote by stated support of the various parties in a General Election scenario indicates that a quarter of all core Fine Gael voters identified indicate they will vote for Crowley in the European Election – proof positive of the personal nature of his support base.
Sean Kelly of Fine Gael leads his party ticket in the constituency, garnering 17% of all 1st preferences in today’s Poll. Kelly is performing particularly well amongst the male electorate, and indeed within the younger (18–34 years) cohort. Kelly’s support is also well spread across the entire geographical reach of the constituency, and the fact that he is currently attracting around a quarter of the Labour candidate’s transfers would suggest that he is set to be elected in or around the 3rd count next Friday.
There is then clearly a second seat for Fine Gael in the constituency with Deirdre Clune currently out-polling Simon Harris by just 2 percentage points. The only question at this stage appears to be which of the two candidates makes it over the line on Friday.
The party has certainly split the constituency well between the two candidates at a regional level, with Clune currently sitting on 19% support in Cork and Kerry, while Harris is on 22% in the South Eastern region.
As it currently stands, Deirdre Clune would be elected over Simon Harris, and Harris might best be advised to expand his general canvassing activities westward if he is to over-take Clune.

31
South European Constituency – Interpretation and Analysis
Meanwhile, Liadh ni Riada of Sinn Féin is in a relatively strong position on 14% of the 1st preference vote. Her support holds up well across all socio demographic groupings, and is actually strongest in the older (35 years+) age categories. The Sinn Féin hopeful is strongest in Cork and Kerry at 17%, but is also polling well in all other regions.
She is also performing respectably with regard to 2nd preference transfers from other candidates, and appears likely to be elected on the day.
In summary, therefore, the most likely outcome for the South European Constituency next Friday the 23rd of May is a seat for Brian Crowley of Fianna Fáil, Sean Kelly of Fine Gael, and Liadh ni Riada of Sinn Féin. The final seat will then go to Fine Gael. Currently, Deirdre Clune is the favourite, although Simon Harris could
still prevail depending on the effectiveness of his final week’s campaigning.

32
Local Elections

33
County and city councils
Q.2 The 2014 Irish local elections will be held in all local government areas of Ireland on Friday, 23 May 2014, on the same day as the European Parliament election. To which party or independent candidate would you give your first preference vote in the local elections?
May 2014 Poll 2009
Party
All Irish Voters 18+ %
All Irish Voters 18+ (excl. undecideds)
%
Results First
Preference %
Seats Won
% Seats Won
Fiánna Fail 17 22 25.4 218 25%
Fine Gael 19 25 32.2 340 39%
Labour 5 7 14.7 132 15%
Green Party 1 2 2.3 3 0%
Workers Party 0 0 0.3 2 0%
Sinn Féin 13 17 7.4 54 6%
Independent 18 24 15.6 122 14%
Other 2 3 0.9 12 1%
Don't Know / Will not vote 24 n/a n/a n/a n/a

34
County and city councils x Gender/Age/Class Excluding Undecideds
Q.2 The 2014 Irish local elections will be held in all local government areas of Ireland on Friday, 23 May 2014, on the same day as the European Parliament election. To which party or independent candidate would you give your first preference vote in the local elections?
Base : All Irish Voters 18+ excluding undecided (Local elections)
Total Gender Age Class Area
Male Female 18-34 35-54 55+ ABC1F C2DE Urban Rural
% % % % % % % % % %
Fianna Fáil 22 24 20 20 22 24 20 24 19 26
Fine Gael 25 22 28 24 26 25 32 19 20 32
Labour 7 6 9 7 6 9 7 7 10 4
Green Party 2 2 2 1 2 2 2 1 3 0
Workers Party 0 - 0 - 0 - - 0 0 -
Sinn Féin 17 21 13 18 18 14 14 19 18 16
Independent 24 23 25 25 22 25 22 26 26 20
Other 3 3 3 3 4 2 2 4 4 1

35
County and city councils x Constituency Region Excluding Undecideds
Q.2 The 2014 Irish local elections will be held in all local government areas of Ireland on Friday, 23 May 2014, on the same day as the European Parliament election. To which party or independent candidate would you give your first preference vote in the local elections?
Base : All Irish Voters 18+ excluding undecided (Local elections)
Total Dublin Region Midlands-North-West Region
South Region
Dun Laoghaire Rathdown
Dublin City
Council
Fingal South Dublin
CC
Cavan, Donegal, Leitrim, Louth,
Monaghan
Galway, Mayo,
Roscommon, Sligo
Kildare, Laois,
Longford, Meath, Offaly,
Westmeath
Cork, Kerry
Clare, Limerick, Tipperary
Carlow, Kilkenny, Waterford Wexford, Wicklow
% % % % % % % % % % % Fianna Fáil 22 8 25 18 16 25 26 25 19 23 23 Fine Gael 25 27 20 16 26 19 23 26 29 41 22 Labour 7 15 6 8 9 7 6 4 7 7 8 Green Party 2 13 4 4 - 0 0 0 2 - 1 Workers Party 0 - - - - - - - 1 - - Sinn Féin 17 11 14 23 24 25 7 22 19 11 15 Independent 24 14 22 24 20 22 37 23 22 16 29 Other 3 12 9 8 4 2 0 0 2 2 2

36
Local Government Elections – Interpretation & Analysis
While most commentary over the last number of months has understandably focused on the likely outcome of the European Elections, we are also of course voting in the Local Government Elections on the same day.
Traditionally, the Electorate has construed Local Elections as an opportunity to pass comment/judgement on the Government of the day.
As such, the individual party support levels captured in Local Elections are by no means a predictor of the subsequent General Election results. Having said that, most of the parties will be using the Locals to ‘seed’ prospective candidates for the next General Election.
In the 2009 Local Elections, Fine Gael won 32% of the first preference vote nationwide. Not only were they the biggest party on the day, they also realised a significant seat bonus, winning 39% (340) of all seats on their 32% vote.
Based on today’s poll figures, the Fine Gael Local Government vote is likely to decline to around 25%. Depending on how transfers pan out thereafter, the party looks set to lose scores of seats this time around.
24% of the Electorate state in today’s poll indicated that they are inclined to vote for Independent candidates in the Local Elections, although the extent to which they do so on the day will of course be heavily influenced by the number and calibre of independent candidates actually running in their own area. Nevertheless, we are likely to see an increase in the 16% share of vote the Independents attracted in 2009, with a corresponding uplift in seats won.

37
Local Government Elections – Interpretation & Analysis
Fianna Fáil’s vote in the Locals, currently at 22% in today’s poll, is reasonably close to the 25% it actually achieved in 2009. The Party should therefore perform creditably in comparison with the 2009 Election, and build from there towards the General Election.
The big winners, however, are likely to be Sinn Féin. In 2009, that party captured 7% of first preferences in the Local Government Elections, and just 6% of all seats.
Today, 17% of the Electorate indicate they will vote for Sinn Féin candidates in the Locals. Coupled with the fact that the Party is now a lot more transfer friendly than it was five years ago, we can expect the Party to double its representation at a local level, come Friday 23rd.
Finally, the Labour Party is facing into a torrid election, at both a Local and European Constituency level. 7% of respondents in today’s poll tell us they are likely to grant Labour their first preference vote in the Locals. This is just under half the share of vote garnered in 2009.
The key question will be whether Eamon Gilmore will face a leadership challenge in the immediate aftermath of these elections as so many commentators are already predicting.

38
General Election Voting Intentions

39
General Election
May 2014 Poll
Party All Irish Adults 18+
% All Irish Adults 18+ (excl. undecideds)
%
All Irish Adults 18+ excluding undecideds –
adjusted) %
Fianna Fáil 16% 22% 19%
Fine Gael 20% 27% 26%
Labour 5% 7% 7%
Sinn Féin 15% 20% 21%
Green Party 1% 2% 2%
Independents/ Others 16% 22% 24%
Undecided 25% - -
Q.3 If there was a General Election tomorrow, to which party or independent candidate would you give your first preference vote?

40
Sunday Times/Behaviour & Attitudes Core Party Support Levels
12th Feb. 2011 (f/w: 31st
Jan – 12th Feb,
2011)
24th Aug, 2011 (f/w: 16th – 24th Aug,
2011)
2nd Oct, 2011 (f/w: 20th Sept – 2nd Oct,
2011)
18th Oct, 2011 (f/w: 16th – 18th Oct,
2011)
12th Dec. 2011 (f/w :
7th-12th Dec,
2011)
20th Feb. 2012 (f/w: 15th – 20th Feb.
2012)
17th Apr, 2012 (f/w: 11th – 17th Apr.
2012)
23rd May 2012 (f/w: 18th – 23rd May,
2012)
9th Sept. 2012 (f/w: 4th -9th Sept
2012)
13th Nov 2012 (f/w: 1st- 13th Nov
2012)
21st Jan
2013 (f/w: 15th – 21st
Jan. 2013)
26th Mar
2013 (f/w: 11th -26th Mar.
2013)
24th Jun
2013 (f/w: 11th – 24th June
2013)
17th Sept 2013 (f/w 10th Sept
– 17th Sept
2013)
15th Dec
2013 (f/w 3rd – 15th Dec
2013)
19th Feb
2014 (f/w: 11th – 19th Feb
2014)
16th Apr
2014 (f/w: 6th – 16th Apr
2014)
15th May 2014 (f/w: 3rd - 15th May
2014)
Fianna Fáil 11% 12% 11% 11% 15% 11% 12% 12% 12% 16% 19% 19% 19% 15% 19% 16% 17% 16%
Fine Gael 26% 35% 26% 27% 22% 23% 22% 24% 23% 23% 17% 19% 19% 19% 21% 22% 18% 20%
Labour 17% 9% 10% 11% 8% 7% 7% 8% 8% 7% 7% 4% 5% 6% 5% 5% 6% 5%
Sinn Féin 10% 10% 12% 14% 15% 18% 14% 17% 13% 12% 13% 13% 13% 14% 11% 16% 16% 15%
Green Party 1% 2% 3% 1% 1% 1% 3% 1% 2% 1% 2% 2% 2% 3% 2% 3% 2% 1%
Independents/ Others
10% 10% 10% 9% 12% 11% 12% 10% 12% 11% 9% 15% 12% 14% 13% 14% 18% 16%
Undecided 25% 22% 28% 27% 27% 30% 30% 28% 30% 29% 33% 27% 29% 30% 28% 24% 24% 25%
Q.3 If there was a General Election tomorrow, to which party or independent candidate would you give your first preference vote?

41
Sunday Times/Behaviour & Attitudes Party Support Levels (Excluding Undecideds - Unadjusted)
12th Feb, 2011 (f/w: 31st
Jan – 12th Feb,
2011)
General
Election
Result 25th Feb
24th Aug, 2011 (f/w: 16th – 24th Aug,
2011)
2nd Oct, 2011 (f/w: 20th
Sept – 2nd Oct,
2011)
18th Oct, 2011 (f/w: 16th – 18th Oct,
2011)
12th Dec. 2011 (f/w: 7th-12th Dec,
2011)
20th Feb, 2012 (f/w: 15th – 20th Feb.
2012)
17th Apr, 2012 (f/w: 11th – 17th Apr.
2012)
23rd May 2012 (f/w: 18th – 23rd May,
2012)
9th Sept. 2012 (f/w: 4th -9th
Sept 2012)
13th Nov 2012 (f/w: 1st- 13th
Nov2012)
21st Jan
2013 (f/w: 15th – 21stJa
n. 2013)
26th Mar
2013 (f/w: 11th -26th Mar.
2013)
24th Jun
2013 (f/w: 11th – 24th June
2013)
17th Sept 2013 (f/w 10th
Sept – 17th Sept
2013)
15th Dec
2013 (f/w 3rd – 15th Dec
2013)
19th Feb
2014 (f/w: 11th – 19th Feb
2014)
16th Apr
2014 (f/w: 6th – 16th Apr
2014)
15th May 2014 (f/w: 3rd – 15th May
2014)
Fianna Fáil 15% 17% 15% 15% 15% 20% 16% 17% 17% 18% 23% 28% 27% 27% 21% 27% 21% 22% 22%
Fine Gael 34% 36% 44% 36% 37% 30% 32% 32% 33% 33% 32% 26% 26% 26% 27% 29% 28% 23% 27%
Labour 23% 19% 12% 14% 15% 11% 10% 10% 11% 11% 10% 10% 6% 7% 8% 7% 7% 7% 7%
Sinn Féin 14% 10% 13% 17% 19% 21% 25% 20% 23% 19% 17% 20% 17% 19% 20% 15% 21% 21% 20%
Green Party 2% 2% 2% 4% 1% 3% 2% 5% 1% 2% 2% 2% 3% 3% 4% 3% 4% 3% 2%
Independent/ Others
14% 16% 12% 13% 13% 15% 15% 17% 14% 17% 16% 14% 21% 17% 20% 19% 18% 23% 22%
Q.7 If there was a General Election tomorrow, to which party or independent candidate would you give your first preference vote?

42
Party Support Adjustment Factor: Technical Note
● Predicting election results on the basis of poll data is not an exact science. All the evidence shows that support for individual parties can swing dramatically in the period between elections- very often outside the bounds of historic election results.
● What to do in these circumstances? Most polling companies in Britain and Ireland publish their raw survey results as an index of fluctuations in the emotional mood of voters. They also build in an adjustment based on a number of factors. Where we have reports of how people voted in the last general election as well as how they intend to vote in the next one we can use these data to model the likely level of swing from the last election results.
● We then add back in the forecasts of voters who have not voted last time or do not answer that particular question.
● Finally we take into account each individuals stated likelihood of voting in a forthcoming General Election.
● This is the basis of the adjusted voting forecast in Behaviour & Attitudes polls.

43
Party Support Levels (Excluding Undecided - Adjusted)
● Adjusted figures based on:
All who state they would definitely vote
Weighting of those respondents who give a definite answer as to who they would vote for in a general election and who they voted for in the last election, in line with the result of the last election.
Making no adjustment to stated voting intention of those who do not indicate how they voted in last election.
2nd Oct, 2011 (f/w: 20th Sept – 2nd Oct,
2011)
18th Oct, 2011 (f/w: 16th
– 18th Oct,
2011)
12th Dec. 2011 (f/w: 7th-12th Dec,
2011)
20th Feb, 2012 (f/w: 15th
– 20th Feb.
2012)
17th Apr, 2012 (f/w: 11th
– 17th Apr.
2012)
23rd May 2012 (f/w: 18th
– 23rd May,
2012)
9th Sept. 2012 (f/w: 4th -9th Sept
2012)
13th Nov 2012 (f/w: 1st- 13th Nov
2012)
21st Jan
2013 (f/w: 15th
– 21stJan.
2013)
26th Mar
2013 (f/w: 11th -26th Mar.
2013)
24th Jun
2013 (f/w: 11th – 24th June
2013)
17th Sept 2013 (f/w 10th Sept
– 17th Sept
2013)
15th Dec
2013 (f/w 3rd – 15th Dec
2013)
19th Feb
2014 (f/w: 11th – 19th Feb
2014)
16th Apr
2014 (f/w: 6th – 16th Apr
2014)
15th May 2014 (f/w: 3rd – 15th May
2014)
Fianna Fáil 16% 14% 18% 16% 15% 16% 16% 22% 24% 23% 24% 21% 21% 19% 20% 19%
Fine Gael 34% 35% 29% 33% 33% 33% 31% 30% 26% 27% 27% 25% 30% 30% 21% 26%
Labour 16% 16% 12% 13% 14% 14% 14% 12% 11% 7% 7% 11% 11% 9% 9% 7%
Sinn Féin 14% 17% 19% 20% 16% 17% 18% 14% 19% 15% 16% 18% 15% 18% 20% 21%
Green Party 3% 1% 3% 2% 5% 2% 2% 3% 3% 2% 3% 3% 3% 3% 4% 2%
Indepen-dents/ Others
17% 16% 18% 16% 18% 18% 19% 19% 18% 25% 23% 23% 21% 21% 26% 24%
Q.3 If there was a General Election tomorrow, to which party or independent candidate would you give your first preference vote?

Tabular Data

1
Midlands-North-West Constituency Tabular Report

European & Local Area Elections - Midlands / North West 16/05/2014
Page 1Table 1
Q1 Which of these candidates would you give your first preference vote to in the European Parliament Election? - First Preference Vote
Base : All Irish Adults 18+
Total Gender Age Class Area Region Core Party Support (Unadjusted)
Male Female 18-34 35-54 55+ ABC1F C2DE Urban Rural CAVAN, DONEGA
L, LEITRIM, LOUTH
, MONAGHAN
GALWAY, MAYO, ROSCOMMON, SLIGO
KILDARE, LAOIS,LONGFORD,
MEATH, OFFALY,WESTMEATH
Fianna Fail
Fine Gael
Labour Green Party
Sinn Fein
Indep/Others
Would not/DK
Total 513 261 252 154 207 152 249 264 224 289 149 154 210 95 115 16 3 80 82 121
100% 100% 100% 100% 100% 100% 100% 100% 100% 100% 100% 100% 100% 100% 100% 100% 100% 100% 100% 100%
WTD Base: 513 261 252 154 207 152 249 264 224 289 149 154 210 95 115 16 3 80 82 121
UNWTD 513 236 277 119 211 183 265 248 278 235 118 182 213 93 126 21 3 67 92 111
Thomas Byrne, Fianna Fail
36 23 13 3 15 18 18 18 13 23 5 14 18 29 - 0 - - 3 3
7% 9% 5% 2% 7% 12% 7% 7% 6% 8% 3% 9% 8% 31% - 1% - - 4% 3%
Matt Carthy, Sinn Fein
55 39 17 25 23 7 32 24 28 27 28 10 17 2 3 - - 46 4 1
11% 15% 7% 16% 11% 5% 13% 9% 13% 9% 19% 7% 8% 2% 2% - - 57% 4% 1%
Mark Dearey, Green Party
5 3 2 1 2 2 2 3 5 - 3 2 1 0 - 1 1 - 2 1
1% 1% 1% 1% 1% 1% 1% 1% 2% - 2% 1% 0% 0% - 8% 29% - 2% 1%
T.J. Fay, Independent 1 1 - 1 - - - 1 1 - - - 1 - - - - - 1 -
0% 0% - 1% - - - 0% 1% - - - 1% - - - - - 1% -
Luke ‘Ming’ Flanagan,Independent
65 45 21 27 35 3 34 32 24 41 12 29 25 13 9 0 - 7 24 12
13% 17% 8% 17% 17% 2% 14% 12% 11% 14% 8% 19% 12% 14% 8% 1% - 9% 29% 10%
Pat The Cope Gallagher, Fianna Fail
33 13 20 6 9 18 11 22 11 22 20 7 6 17 4 - - - 4 8
6% 5% 8% 4% 5% 12% 4% 8% 5% 8% 14% 4% 3% 18% 4% - - - 5% 6%
Ben Gilroy, Direct Democracy Ireland
3 1 2 - 3 - 1 2 2 1 2 - 1 - - - - - 3 -
0% 0% 1% - 1% - 0% 1% 1% 0% 1% - 0% - - - - - 3% -
Marian Harkin, Independent
46 20 26 7 19 21 20 26 21 26 15 22 9 10 6 4 2 2 14 10
9% 8% 10% 4% 9% 14% 8% 10% 9% 9% 10% 15% 4% 10% 5% 23% 71% 2% 17% 8%
Jim Higgins, Fine Gael 27 15 12 7 6 14 13 14 14 13 3 16 8 5 15 1 - - 4 2
5% 6% 5% 5% 3% 9% 5% 5% 6% 4% 2% 10% 4% 5% 13% 4% - - 5% 1%

European & Local Area Elections - Midlands / North West 16/05/2014
Page 2Table 1
Q1 Which of these candidates would you give your first preference vote to in the European Parliament Election? - First Preference Vote
Base : All Irish Adults 18+
Total Gender Age Class Area Region Core Party Support (Unadjusted)
Male Female 18-34 35-54 55+ ABC1F C2DE Urban Rural CAVAN, DONEGA
L, LEITRIM, LOUTH
, MONAGHAN
GALWAY, MAYO, ROSCOMMON, SLIGO
KILDARE, LAOIS,LONGFORD,
MEATH, OFFALY,WESTMEATH
Fianna Fail
Fine Gael
Labour Green Party
Sinn Fein
Indep/Others
Would not/DK
Total 513 261 252 154 207 152 249 264 224 289 149 154 210 95 115 16 3 80 82 121
100% 100% 100% 100% 100% 100% 100% 100% 100% 100% 100% 100% 100% 100% 100% 100% 100% 100% 100% 100%
WTD Base: 513 261 252 154 207 152 249 264 224 289 149 154 210 95 115 16 3 80 82 121
UNWTD 513 236 277 119 211 183 265 248 278 235 118 182 213 93 126 21 3 67 92 111
Lorraine Higgins, Labour Party
21 7 14 8 5 8 10 12 8 13 - 13 9 4 6 5 - 2 1 3
4% 3% 6% 5% 3% 5% 4% 4% 4% 4% - 8% 4% 5% 5% 34% - 3% 1% 2%
Mairead McGuinness, Fine Gael
81 36 45 17 31 33 47 33 31 50 27 9 45 5 52 3 - 3 4 14
16% 14% 18% 11% 15% 22% 19% 13% 14% 17% 18% 6% 21% 5% 45% 19% - 4% 4% 12%
Ronan Mullan, Independent
19 12 7 2 6 11 7 12 7 12 2 5 11 1 3 - - 2 5 9
4% 5% 3% 1% 3% 7% 3% 4% 3% 4% 2% 4% 5% 1% 3% - - 2% 6% 7%
Undecided 119 46 73 49 53 17 53 66 57 62 31 27 61 9 17 2 - 18 15 59
23% 18% 29% 32% 26% 11% 21% 25% 25% 22% 21% 18% 29% 10% 14% 10% - 22% 18% 49%

European & Local Area Elections - Midlands / North West 16/05/2014
Page 3Table 1
Q1 Which of these candidates would you give your first preference vote to in the European Parliament Election? - First Preference Vote
Base : All Irish Adults 18+
Total Local election Support (Unadjusted)
Fianna Fail
Fine Gael
Labour Green Party
Sinn Fein
Independent/Others
Will Not / DK
Total 513 109 92 23 2 76 112 99
100% 100% 100% 100% 100% 100% 100% 100%
WTD Base: 513 109 92 23 2 76 112 99
UNWTD 513 104 104 24 4 58 122 97
Thomas Byrne, Fianna Fail
36 24 2 - - 1 9 1
7% 22% 2% - - 1% 8% 1%
Matt Carthy, Sinn Fein
55 2 1 3 - 38 8 4
11% 2% 1% 11% - 50% 7% 4%
Mark Dearey, Green Party
5 - - - 1 - 2 2
1% - - - 80% - 2% 2%
T.J. Fay, Independent 1 - - - - - 1 -
0% - - - - - 1% -
Luke ‘Ming’ Flanagan,Independent
65 12 6 0 - 5 32 11
13% 11% 6% 1% - 7% 29% 11%
Pat The Cope Gallagher, Fianna Fail
33 19 3 - - 5 6 -
6% 17% 4% - - 7% 5% -
Ben Gilroy, Direct Democracy Ireland
3 - - - - 1 1 1
0% - - - - 1% 1% 1%
Marian Harkin, Independent
46 10 7 5 - 2 15 6
9% 9% 8% 23% - 3% 13% 6%
Jim Higgins, Fine Gael 27 4 13 - - - 6 3
5% 4% 15% - - - 6% 3%

European & Local Area Elections - Midlands / North West 16/05/2014
Page 4Table 1
Q1 Which of these candidates would you give your first preference vote to in the European Parliament Election? - First Preference Vote
Base : All Irish Adults 18+
Total Local election Support (Unadjusted)
Fianna Fail
Fine Gael
Labour Green Party
Sinn Fein
Independent/Others
Will Not / DK
Total 513 109 92 23 2 76 112 99
100% 100% 100% 100% 100% 100% 100% 100%
WTD Base: 513 109 92 23 2 76 112 99
UNWTD 513 104 104 24 4 58 122 97
Lorraine Higgins, Labour Party
21 3 5 6 - 2 4 2
4% 3% 6% 24% - 2% 4% 2%
Mairead McGuinness, Fine Gael
81 20 37 7 0 2 8 7
16% 18% 40% 28% 20% 3% 7% 7%
Ronan Mullan, Independent
19 6 3 - - 2 5 3
4% 5% 4% - - 3% 4% 3%
Undecided 119 10 14 3 - 18 16 59
23% 9% 15% 13% - 24% 14% 60%

European & Local Area Elections - Midlands / North West 16/05/2014
Page 5Table 2
Q1 Which of these candidates would you give your first preference vote to in the European Parliament Election? - First Preference Vote
Base : All Irish Adults 18+All Voters Excluding Undecided [Midlands-North-West]
Total Gender Age Class Area Region Core Party Support (Unadjusted)
Male Female 18-34 35-54 55+ ABC1F C2DE Urban Rural CAVAN, DONEGA
L, LEITRIM, LOUTH
, MONAGHAN
GALWAY, MAYO, ROSCOMMON, SLIGO
KILDARE, LAOIS,LONGFORD,
MEATH, OFFALY,WESTMEATH
Fianna Fail
Fine Gael
Labour Green Party
Sinn Fein
Indep/Others
Would not/DK
Total 394 215 178 104 154 135 196 198 167 227 118 127 149 86 99 14 3 62 68 61
100% 100% 100% 100% 100% 100% 100% 100% 100% 100% 100% 100% 100% 100% 100% 100% 100% 100% 100% 100%
WTD Base: 394 215 178 104 154 135 196 198 167 227 118 127 149 86 99 14 3 62 68 61
UNWTD 399 200 199 76 162 161 211 188 209 190 96 147 156 83 110 19 3 54 78 52
Thomas Byrne, Fianna Fail
36 23 13 3 15 18 18 18 13 23 5 14 18 29 - 0 - - 3 3
9% 11% 7% 3% 10% 14% 9% 9% 8% 10% 4% 11% 12% 34% - 1% - - 5% 6%
Matt Carthy, Sinn Fein
55 39 17 25 23 7 32 24 28 27 28 10 17 2 3 - - 46 4 1
14% 18% 9% 24% 15% 6% 16% 12% 17% 12% 24% 8% 11% 2% 3% - - 74% 5% 1%
Mark Dearey, Green Party
5 3 2 1 2 2 2 3 5 - 3 2 1 0 - 1 1 - 2 1
1% 1% 1% 1% 1% 1% 1% 1% 3% - 2% 1% 0% 0% - 9% 29% - 3% 1%
T.J. Fay, Independent 1 1 - 1 - - - 1 1 - - - 1 - - - - - 1 -
0% 1% - 1% - - - 1% 1% - - - 1% - - - - - 2% -
Luke ‘Ming’ Flanagan,Independent
65 45 21 27 35 3 34 32 24 41 12 29 25 13 9 0 - 7 24 12
17% 21% 12% 26% 23% 3% 17% 16% 15% 18% 10% 23% 17% 15% 9% 1% - 12% 35% 20%
Pat The Cope Gallagher, Fianna Fail
33 13 20 6 9 18 11 22 11 22 20 7 6 17 4 - - - 4 8
8% 6% 11% 5% 6% 13% 6% 11% 7% 10% 17% 5% 4% 20% 4% - - - 6% 12%
Ben Gilroy, Direct Democracy Ireland
3 1 2 - 3 - 1 2 2 1 2 - 1 - - - - - 3 -
1% 0% 1% - 2% - 0% 1% 1% 0% 1% - 1% - - - - - 4% -
Marian Harkin, Independent
46 20 26 7 19 21 20 26 21 26 15 22 9 10 6 4 2 2 14 10
12% 9% 15% 6% 12% 15% 10% 13% 12% 11% 13% 18% 6% 11% 6% 25% 71% 3% 20% 16%
Jim Higgins, Fine Gael 27 15 12 7 6 14 13 14 14 13 3 16 8 5 15 1 - - 4 2
7% 7% 7% 7% 4% 10% 7% 7% 9% 6% 3% 13% 5% 6% 16% 4% - - 7% 3%

European & Local Area Elections - Midlands / North West 16/05/2014
Page 6Table 2
Q1 Which of these candidates would you give your first preference vote to in the European Parliament Election? - First Preference Vote
Base : All Irish Adults 18+All Voters Excluding Undecided [Midlands-North-West]
Total Gender Age Class Area Region Core Party Support (Unadjusted)
Male Female 18-34 35-54 55+ ABC1F C2DE Urban Rural CAVAN, DONEGA
L, LEITRIM, LOUTH
, MONAGHAN
GALWAY, MAYO, ROSCOMMON, SLIGO
KILDARE, LAOIS,LONGFORD,
MEATH, OFFALY,WESTMEATH
Fianna Fail
Fine Gael
Labour Green Party
Sinn Fein
Indep/Others
Would not/DK
Total 394 215 178 104 154 135 196 198 167 227 118 127 149 86 99 14 3 62 68 61
100% 100% 100% 100% 100% 100% 100% 100% 100% 100% 100% 100% 100% 100% 100% 100% 100% 100% 100% 100%
WTD Base: 394 215 178 104 154 135 196 198 167 227 118 127 149 86 99 14 3 62 68 61
UNWTD 399 200 199 76 162 161 211 188 209 190 96 147 156 83 110 19 3 54 78 52
Lorraine Higgins, Labour Party
21 7 14 8 5 8 10 12 8 13 - 13 9 4 6 5 - 2 1 3
5% 3% 8% 8% 4% 6% 5% 6% 5% 6% - 10% 6% 5% 6% 37% - 4% 1% 4%
Mairead McGuinness, Fine Gael
81 36 45 17 31 33 47 33 31 50 27 9 45 5 52 3 - 3 4 14
21% 17% 25% 16% 20% 24% 24% 17% 19% 22% 23% 7% 30% 6% 53% 22% - 5% 5% 23%
Ronan Mullan, Independent
19 12 7 2 6 11 7 12 7 12 2 5 11 1 3 - - 2 5 9
5% 6% 4% 2% 4% 8% 4% 6% 4% 5% 2% 4% 7% 1% 3% - - 3% 7% 14%

European & Local Area Elections - Midlands / North West 16/05/2014
Page 7Table 2
Q1 Which of these candidates would you give your first preference vote to in the European Parliament Election? - First Preference Vote
Base : All Irish Adults 18+All Voters Excluding Undecided [Midlands-North-West]
Total Local election Support (Unadjusted)
Fianna Fail
Fine Gael
Labour Green Party
Sinn Fein
Independent/Others
Will Not / DK
Total 394 100 78 20 2 58 96 40
100% 100% 100% 100% 100% 100% 100% 100%
WTD Base: 394 100 78 20 2 58 96 40
UNWTD 399 93 88 21 4 46 104 43
Thomas Byrne, Fianna Fail
36 24 2 - - 1 9 1
9% 24% 2% - - 1% 10% 2%
Matt Carthy, Sinn Fein
55 2 1 3 - 38 8 4
14% 2% 1% 12% - 66% 8% 10%
Mark Dearey, Green Party
5 - - - 1 - 2 2
1% - - - 80% - 2% 5%
T.J. Fay, Independent 1 - - - - - 1 -
0% - - - - - 1% -
Luke ‘Ming’ Flanagan,Independent
65 12 6 0 - 5 32 11
17% 12% 7% 1% - 9% 33% 27%
Pat The Cope Gallagher, Fianna Fail
33 19 3 - - 5 6 -
8% 19% 4% - - 9% 6% -
Ben Gilroy, Direct Democracy Ireland
3 - - - - 1 1 1
1% - - - - 1% 1% 2%
Marian Harkin, Independent
46 10 7 5 - 2 15 6
12% 10% 10% 27% - 4% 15% 16%
Jim Higgins, Fine Gael 27 4 13 - - - 6 3
7% 4% 17% - - - 7% 7%

European & Local Area Elections - Midlands / North West 16/05/2014
Page 8Table 2
Q1 Which of these candidates would you give your first preference vote to in the European Parliament Election? - First Preference Vote
Base : All Irish Adults 18+All Voters Excluding Undecided [Midlands-North-West]
Total Local election Support (Unadjusted)
Fianna Fail
Fine Gael
Labour Green Party
Sinn Fein
Independent/Others
Will Not / DK
Total 394 100 78 20 2 58 96 40
100% 100% 100% 100% 100% 100% 100% 100%
WTD Base: 394 100 78 20 2 58 96 40
UNWTD 399 93 88 21 4 46 104 43
Lorraine Higgins, Labour Party
21 3 5 6 - 2 4 2
5% 3% 7% 28% - 3% 4% 5%
Mairead McGuinness, Fine Gael
81 20 37 7 0 2 8 7
21% 20% 48% 32% 20% 4% 8% 18%
Ronan Mullan, Independent
19 6 3 - - 2 5 3
5% 6% 4% - - 3% 5% 8%

European & Local Area Elections - Midlands / North West 16/05/2014
Page 9Table 3
Q1 Which of these candidates would you give your second preference vote to in the European Parliament Election? - Second Preference Vote
Base : All Irish Adults 18+All Voters Excluding Undecided [Midlands-North-West]
Total Gender Age Class Area Region Core Party Support (Unadjusted)
Male Female 18-34 35-54 55+ ABC1F C2DE Urban Rural CAVAN, DONEGA
L, LEITRIM, LOUTH
, MONAGHAN
GALWAY, MAYO, ROSCOMMON, SLIGO
KILDARE, LAOIS,LONGFORD,
MEATH, OFFALY,WESTMEATH
Fianna Fail
Fine Gael
Labour Green Party
Sinn Fein
Indep/Others
Would not/DK
Total 394 215 178 104 154 135 196 198 167 227 118 127 149 86 99 14 3 62 68 61
100% 100% 100% 100% 100% 100% 100% 100% 100% 100% 100% 100% 100% 100% 100% 100% 100% 100% 100% 100%
WTD Base: 394 215 178 104 154 135 196 198 167 227 118 127 149 86 99 14 3 62 68 61
UNWTD 399 200 199 76 162 161 211 188 209 190 96 147 156 83 110 19 3 54 78 52
Thomas Byrne, Fianna Fail
34 23 11 12 11 11 18 16 9 26 12 8 14 17 3 - - 5 1 9
9% 11% 6% 12% 7% 8% 9% 8% 5% 11% 10% 6% 9% 20% 3% - - 8% 1% 14%
Matt Carthy, Sinn Fein
12 8 4 2 8 2 7 5 7 5 5 0 7 1 1 - - 6 4 -
3% 4% 2% 2% 5% 2% 4% 3% 4% 2% 5% 0% 4% 1% 1% - - 10% 5% -
Mark Dearey, Green Party
8 3 5 - 4 3 1 6 1 7 4 2 2 - 3 1 - 2 - 2
2% 1% 3% - 3% 3% 1% 3% 0% 3% 4% 1% 1% - 3% 5% - 4% - 3%
T.J. Fay, Independent 4 3 1 1 2 1 3 1 4 - 1 - 3 - - 1 - 1 1 1
1% 1% 1% 1% 1% 0% 1% 1% 2% - 1% - 2% - - 4% - 2% 2% 2%
Mark Fitzsimons, Independent
2 1 1 2 - - 1 1 2 - 1 - 1 - - - - - 2 -
1% 1% 1% 2% - - 1% 1% 1% - 1% - 1% - - - - - 3% -
Luke ‘Ming’ Flanagan,Independent
40 26 14 12 14 13 23 17 14 26 7 18 15 10 9 0 1 7 6 7
10% 12% 8% 12% 9% 10% 12% 9% 8% 11% 6% 14% 10% 11% 10% 1% 29% 11% 9% 11%
Pat The Cope Gallagher, Fianna Fail
42 26 16 11 12 19 24 18 15 27 6 20 16 27 4 1 - 1 3 5
11% 12% 9% 10% 8% 14% 12% 9% 9% 12% 5% 15% 11% 32% 4% 10% - 2% 5% 9%
Ben Gilroy, Direct Democracy Ireland
3 1 2 2 1 - 3 1 1 2 3 1 - - 1 - - 2 0 -
1% 0% 1% 2% 1% - 1% 0% 1% 1% 2% 0% - - 1% - - 4% 1% -
Marian Harkin, Independent
40 22 17 12 17 11 28 12 10 30 19 14 7 3 6 3 - 14 10 4
10% 10% 10% 11% 11% 8% 14% 6% 6% 13% 16% 11% 4% 4% 6% 19% - 22% 15% 7%

European & Local Area Elections - Midlands / North West 16/05/2014
Page 10Table 3
Q1 Which of these candidates would you give your second preference vote to in the European Parliament Election? - Second Preference Vote
Base : All Irish Adults 18+All Voters Excluding Undecided [Midlands-North-West]
Total Gender Age Class Area Region Core Party Support (Unadjusted)
Male Female 18-34 35-54 55+ ABC1F C2DE Urban Rural CAVAN, DONEGA
L, LEITRIM, LOUTH
, MONAGHAN
GALWAY, MAYO, ROSCOMMON, SLIGO
KILDARE, LAOIS,LONGFORD,
MEATH, OFFALY,WESTMEATH
Fianna Fail
Fine Gael
Labour Green Party
Sinn Fein
Indep/Others
Would not/DK
Total 394 215 178 104 154 135 196 198 167 227 118 127 149 86 99 14 3 62 68 61
100% 100% 100% 100% 100% 100% 100% 100% 100% 100% 100% 100% 100% 100% 100% 100% 100% 100% 100% 100%
WTD Base: 394 215 178 104 154 135 196 198 167 227 118 127 149 86 99 14 3 62 68 61
UNWTD 399 200 199 76 162 161 211 188 209 190 96 147 156 83 110 19 3 54 78 52
Jim Higgins, Fine Gael 33 17 15 6 15 12 17 15 13 19 9 9 15 2 28 0 - 1 0 -
8% 8% 9% 6% 10% 9% 9% 8% 8% 8% 7% 7% 10% 2% 29% 2% - 2% 0% -
Lorraine Higgins, Labour Party
12 4 8 3 4 6 4 8 7 5 1 9 1 1 4 1 - 1 4 1
3% 2% 4% 2% 2% 4% 2% 4% 4% 2% 1% 7% 1% 1% 4% 10% - 1% 6% 1%
Mairead McGuinness, Fine Gael
51 21 29 11 14 26 19 32 22 29 16 13 22 9 16 2 2 - 11 11
13% 10% 17% 11% 9% 19% 10% 16% 13% 13% 13% 10% 15% 10% 16% 13% 71% - 16% 19%
Ronan Mullan, Independent
11 3 8 1 4 6 4 7 6 5 1 7 4 3 3 - - 1 4 0
3% 2% 4% 1% 3% 4% 2% 4% 4% 2% 1% 5% 2% 3% 3% - - 1% 7% 1%
Cordelia Nic Fhearraigh, Fis Nua
1 1 - 1 - - 1 - - 1 - 1 - - - - - 1 - -
0% 1% - 1% - - 1% - - 1% - 1% - - - - - 2% - -
Undecided 100 55 45 26 48 26 43 57 55 45 31 26 42 13 20 5 - 20 21 21
25% 25% 25% 25% 31% 19% 22% 29% 33% 20% 27% 21% 28% 15% 21% 36% - 32% 30% 34%

European & Local Area Elections - Midlands / North West 16/05/2014
Page 11Table 3
Q1 Which of these candidates would you give your second preference vote to in the European Parliament Election? - Second Preference Vote
Base : All Irish Adults 18+All Voters Excluding Undecided [Midlands-North-West]
Total Local election Support (Unadjusted)
Fianna Fail
Fine Gael
Labour Green Party
Sinn Fein
Independent/Others
Will Not / DK
Total 394 100 78 20 2 58 96 40
100% 100% 100% 100% 100% 100% 100% 100%
WTD Base: 394 100 78 20 2 58 96 40
UNWTD 399 93 88 21 4 46 104 43
Thomas Byrne, Fianna Fail
34 19 3 1 - 5 5 2
9% 19% 4% 3% - 8% 5% 6%
Matt Carthy, Sinn Fein
12 2 - 0 - 6 4 -
3% 2% - 2% - 10% 4% -
Mark Dearey, Green Party
8 2 3 1 0 1 2 -
2% 2% 3% 3% 20% 1% 2% -
T.J. Fay, Independent 4 - - - - 1 3 -
1% - - - - 2% 3% -
Mark Fitzsimons, Independent
2 - - - - - 2 -
1% - - - - - 2% -
Luke ‘Ming’ Flanagan,Independent
40 15 2 5 1 8 5 3
10% 15% 3% 26% 63% 14% 5% 8%
Pat The Cope Gallagher, Fianna Fail
42 22 4 1 - 1 13 1
11% 22% 5% 7% - 2% 13% 2%
Ben Gilroy, Direct Democracy Ireland
3 2 - - - - 1 -
1% 2% - - - - 1% -
Marian Harkin, Independent
40 7 6 1 - 11 12 2
10% 7% 8% 6% - 19% 13% 6%

European & Local Area Elections - Midlands / North West 16/05/2014
Page 12Table 3
Q1 Which of these candidates would you give your second preference vote to in the European Parliament Election? - Second Preference Vote
Base : All Irish Adults 18+All Voters Excluding Undecided [Midlands-North-West]
Total Local election Support (Unadjusted)
Fianna Fail
Fine Gael
Labour Green Party
Sinn Fein
Independent/Others
Will Not / DK
Total 394 100 78 20 2 58 96 40
100% 100% 100% 100% 100% 100% 100% 100%
WTD Base: 394 100 78 20 2 58 96 40
UNWTD 399 93 88 21 4 46 104 43
Jim Higgins, Fine Gael 33 6 22 - - 1 2 1
8% 6% 28% - - 1% 2% 4%
Lorraine Higgins, Labour Party
12 2 2 1 - 1 5 1
3% 2% 3% 7% - 1% 5% 2%
Mairead McGuinness, Fine Gael
51 8 13 5 - 7 10 7
13% 8% 16% 26% - 12% 11% 18%
Ronan Mullan, Independent
11 2 0 - - 1 6 1
3% 2% 1% - - 2% 7% 2%
Cordelia Nic Fhearraigh, Fis Nua
1 - - - - - 1 -
0% - - - - - 1% -
Undecided 100 12 23 4 0 16 24 21
25% 12% 30% 19% 17% 27% 25% 53%

European & Local Area Elections - Midlands / North West 16/05/2014
Page 13Table 4
Q1 Which of these candidates would you give your second preference vote to in the European Parliament Election? - Second Preference Vote
Base : All Irish Adults 18+All Voters Excluding Undecided [Midlands-North-West]
Total Q1 Which of these candidates would you give your first preference vote to in the European Parliament Election? - FIRST Preference Vote
Thomas Byrne, Fianna Fail
Matt Carthy, Sinn Fein
Mark Dearey, Green Party
T.J. Fay,Independent
Luke ‘Ming’ Flanaga
n, Independent
Pat The Cope
Gallagher, Fianna
Fail
Ben Gilroy, Direct Democra
cy Ireland
Marian Harkin, Independent
Jim Higgins, Fine Gael
Lorraine Higgins, Labour Party
Mairead McGuinness, FineGael
Ronan Mullan, Independent
Total 394 36 55 5 1 65 33 3 46 27 21 81 19
100% 100% 100% 100% 100% 100% 100% 100% 100% 100% 100% 100% 100%
WTD Base: 394 36 55 5 1 65 33 3 46 27 21 81 19
UNWTD 399 32 49 7 1 60 30 3 60 28 24 83 22
Thomas Byrne, Fianna Fail
34 - 4 - - 5 10 - 1 - 1 8 6
9% - 7% - - 8% 30% - 3% - 3% 10% 29%
Matt Carthy, Sinn Fein
12 - - - - 7 1 - - - 0 2 1
3% - - - - 11% 4% - - - 2% 3% 6%
Mark Dearey, Green Party
8 - 2 - - 0 - - - - 1 4 -
2% - 4% - - 1% - - - - 3% 5% -
T.J. Fay, Independent 4 - 2 - - - - - 2 - - - -
1% - 4% - - - - - 3% - - - -
Mark Fitzsimons, Independent
2 - - - 1 - - - 1 - - - -
1% - - - 100% - - - 2% - - - -
Luke ‘Ming’ Flanagan,Independent
40 3 7 1 - - 3 1 6 4 6 7 2
10% 9% 12% 20% - - 10% 29% 13% 13% 28% 9% 12%
Pat The Cope Gallagher, Fianna Fail
42 22 2 - - 3 - - 5 - 3 7 0
11% 60% 4% - - 5% - - 10% - 12% 9% 2%
Ben Gilroy, Direct Democracy Ireland
3 - - 0 - 1 - - - - - 2 -
1% - - 7% - 1% - - - - - 3% -
Marian Harkin, Independent
40 1 13 - - 11 1 - - 4 1 7 1
10% 4% 24% - - 17% 3% - - 14% 7% 9% 7%
Jim Higgins, Fine Gael 33 - 1 - - 2 1 - 2 - 1 24 -
8% - 3% - - 4% 3% - 5% - 7% 30% -

European & Local Area Elections - Midlands / North West 16/05/2014
Page 14Table 4
Q1 Which of these candidates would you give your second preference vote to in the European Parliament Election? - Second Preference Vote
Base : All Irish Adults 18+All Voters Excluding Undecided [Midlands-North-West]
Total Q1 Which of these candidates would you give your first preference vote to in the European Parliament Election? - FIRST Preference Vote
Thomas Byrne, Fianna Fail
Matt Carthy, Sinn Fein
Mark Dearey, Green Party
T.J. Fay,Independent
Luke ‘Ming’ Flanaga
n, Independent
Pat The Cope
Gallagher, Fianna
Fail
Ben Gilroy, Direct Democra
cy Ireland
Marian Harkin, Independent
Jim Higgins, Fine Gael
Lorraine Higgins, Labour Party
Mairead McGuinness, FineGael
Ronan Mullan, Independent
Total 394 36 55 5 1 65 33 3 46 27 21 81 19
100% 100% 100% 100% 100% 100% 100% 100% 100% 100% 100% 100% 100%
WTD Base: 394 36 55 5 1 65 33 3 46 27 21 81 19
UNWTD 399 32 49 7 1 60 30 3 60 28 24 83 22
Lorraine Higgins, Labour Party
12 1 1 - - 3 2 - 3 - - 3 -
3% 3% 1% - - 4% 7% - 6% - - 3% -
Mairead McGuinness, Fine Gael
51 2 3 1 - 7 8 - 10 13 3 - 3
13% 6% 5% 16% - 11% 24% - 22% 50% 14% - 17%
Ronan Mullan, Independent
11 1 1 - - 1 - - 5 2 - 1 -
3% 4% 2% - - 2% - - 10% 7% - 1% -
Cordelia Nic Fhearraigh, Fis Nua
1 - - - - 1 - - - - - - -
0% - - - - 2% - - - - - - -
Undecided 100 5 19 3 - 23 7 2 11 4 5 15 5
25% 14% 35% 58% - 35% 20% 71% 25% 16% 24% 18% 28%

European & Local Area Elections - Midlands / North West 16/05/2014
Page 15Table 5
Q2 To which party or independent candidate would you give your first preference vote in the local elections?
Base : All Irish Adults 18+
Total Gender Age Class Area Region Core Party Support (Unadjusted)
Male Female 18-34 35-54 55+ ABC1F C2DE Urban Rural CAVAN, DONEGA
L, LEITRIM, LOUTH
, MONAGHAN
GALWAY, MAYO, ROSCOMMON, SLIGO
KILDARE, LAOIS,LONGFORD,
MEATH, OFFALY,WESTMEATH
Fianna Fail
Fine Gael
Labour Green Party
Sinn Fein
Indep/Others
Would not/DK
Total 513 261 252 154 207 152 249 264 224 289 149 154 210 95 115 16 3 80 82 121
100% 100% 100% 100% 100% 100% 100% 100% 100% 100% 100% 100% 100% 100% 100% 100% 100% 100% 100% 100%
WTD Base: 513 261 252 154 207 152 249 264 224 289 149 154 210 95 115 16 3 80 82 121
UNWTD 513 236 277 119 211 183 265 248 278 235 118 182 213 93 126 21 3 67 92 111
Fianna Fail 109 66 44 26 44 40 45 64 40 69 30 34 46 68 11 1 - 5 5 19
21% 25% 17% 17% 21% 26% 18% 24% 18% 24% 20% 22% 22% 72% 9% 5% - 7% 6% 16%
Fine Gael 92 37 55 19 43 30 48 44 31 61 24 29 39 1 64 3 - - 9 15
18% 14% 22% 12% 21% 19% 19% 17% 14% 21% 16% 19% 19% 1% 55% 16% - - 11% 13%
Labour 23 8 15 6 9 8 10 13 16 7 9 6 8 1 6 6 2 2 - 6
5% 3% 6% 4% 4% 5% 4% 5% 7% 2% 6% 4% 4% 1% 6% 39% 71% 3% - 5%
Green Party 2 1 0 - 1 1 1 1 1 0 0 1 1 0 0 - 1 - - -
0% 1% 0% - 0% 1% 0% 0% 1% 0% 0% 0% 0% 0% 0% - 29% - - -
Sinn Fein 76 47 30 32 30 14 42 34 33 43 35 10 32 1 3 - - 60 6 7
15% 18% 12% 21% 15% 9% 17% 13% 15% 15% 23% 6% 15% 1% 3% - - 75% 7% 5%
Independent 109 57 52 31 39 39 51 58 58 51 26 44 39 15 17 3 - 8 53 13
21% 22% 21% 20% 19% 26% 20% 22% 26% 18% 18% 29% 18% 16% 14% 19% - 10% 64% 11%
Other 3 2 1 - 2 1 1 2 2 1 2 1 0 0 - - - - 3 -
1% 1% 0% - 1% 1% 0% 1% 1% 0% 1% 1% 0% 0% - - - - 3% -
Don't Know / Will not vote
99 44 55 39 39 20 52 47 42 57 23 30 45 9 14 3 - 4 7 61
19% 17% 22% 26% 19% 13% 21% 18% 19% 20% 16% 20% 21% 9% 12% 20% - 6% 8% 51%

European & Local Area Elections - Midlands / North West 16/05/2014
Page 16Table 5
Q2 To which party or independent candidate would you give your first preference vote in the local elections?
Base : All Irish Adults 18+
Total Local election Support (Unadjusted)
Fianna Fail
Fine Gael
Labour Green Party
Sinn Fein
Independent/Others
Will Not / DK
Total 513 109 92 23 2 76 112 99
100% 100% 100% 100% 100% 100% 100% 100%
WTD Base: 513 109 92 23 2 76 112 99
UNWTD 513 104 104 24 4 58 122 97
Fianna Fail 109 109 - - - - - -
21% 100% - - - - - -
Fine Gael 92 - 92 - - - - -
18% - 100% - - - - -
Labour 23 - - 23 - - - -
5% - - 100% - - - -
Green Party 2 - - - 2 - - -
0% - - - 100% - - -
Sinn Fein 76 - - - - 76 - -
15% - - - - 100% - -
Independent 109 - - - - - 109 -
21% - - - - - 97% -
Other 3 - - - - - 3 -
1% - - - - - 3% -
Don't Know / Will not vote
99 - - - - - - 99
19% - - - - - - 100%

European & Local Area Elections - Midlands / North West 16/05/2014
Page 17Table 6
Q2 To which party or independent candidate would you give your first preference vote in the local elections?
Base : All Irish Adults 18+All voters excluding undecided (Local elections)
Total Gender Age Class Area Region Core Party Support (Unadjusted)
Male Female 18-34 35-54 55+ ABC1F C2DE Urban Rural CAVAN, DONEGA
L, LEITRIM, LOUTH
, MONAGHAN
GALWAY, MAYO, ROSCOMMON, SLIGO
KILDARE, LAOIS,LONGFORD,
MEATH, OFFALY,WESTMEATH
Fianna Fail
Fine Gael
Labour Green Party
Sinn Fein
Indep/Others
Would not/DK
Total 414 217 197 114 168 132 197 217 182 232 126 124 165 86 101 12 3 76 76 60
100% 100% 100% 100% 100% 100% 100% 100% 100% 100% 100% 100% 100% 100% 100% 100% 100% 100% 100% 100%
WTD Base: 414 217 197 114 168 132 197 217 182 232 126 124 165 86 101 12 3 76 76 60
UNWTD 416 201 215 84 177 155 217 199 224 192 98 145 173 86 112 17 3 62 82 54
Fianna Fail 109 66 44 26 44 40 45 64 40 69 30 34 46 68 11 1 - 5 5 19
26% 30% 22% 22% 26% 30% 23% 30% 22% 30% 24% 27% 28% 79% 10% 6% - 7% 7% 32%
Fine Gael 92 37 55 19 43 30 48 44 31 61 24 29 39 1 64 3 - - 9 15
22% 17% 28% 17% 26% 22% 24% 20% 17% 26% 19% 23% 24% 1% 63% 21% - - 12% 26%
Labour 23 8 15 6 9 8 10 13 16 7 9 6 8 1 6 6 2 2 - 6
6% 4% 8% 6% 5% 6% 5% 6% 9% 3% 7% 5% 5% 1% 6% 49% 71% 3% - 9%
Green Party 2 1 0 - 1 1 1 1 1 0 0 1 1 0 0 - 1 - - -
0% 1% 0% - 0% 1% 1% 0% 1% 0% 0% 0% 0% 0% 0% - 29% - - -
Sinn Fein 76 47 30 32 30 14 42 34 33 43 35 10 32 1 3 - - 60 6 7
18% 21% 15% 28% 18% 11% 21% 16% 18% 19% 28% 8% 19% 1% 3% - - 80% 7% 11%
Independent 109 57 52 31 39 39 51 58 58 51 26 44 39 15 17 3 - 8 53 13
26% 26% 26% 27% 23% 29% 26% 27% 32% 22% 21% 36% 23% 18% 16% 24% - 11% 70% 22%
Other 3 2 1 - 2 1 1 2 2 1 2 1 0 0 - - - - 3 -
1% 1% 1% - 1% 1% 0% 1% 1% 0% 1% 1% 0% 1% - - - - 3% -

European & Local Area Elections - Midlands / North West 16/05/2014
Page 18Table 6
Q2 To which party or independent candidate would you give your first preference vote in the local elections?
Base : All Irish Adults 18+All voters excluding undecided (Local elections)
Total Local election Support (Unadjusted)
Fianna Fail
Fine Gael
Labour Green Party
Sinn Fein
Independent/Others
Total 414 109 92 23 2 76 112
100% 100% 100% 100% 100% 100% 100%
WTD Base: 414 109 92 23 2 76 112
UNWTD 416 104 104 24 4 58 122
Fianna Fail 109 109 - - - - -
26% 100% - - - - -
Fine Gael 92 - 92 - - - -
22% - 100% - - - -
Labour 23 - - 23 - - -
6% - - 100% - - -
Green Party 2 - - - 2 - -
0% - - - 100% - -
Sinn Fein 76 - - - - 76 -
18% - - - - 100% -
Independent 109 - - - - - 109
26% - - - - - 97%
Other 3 - - - - - 3
1% - - - - - 3%

European & Local Area Elections - Midlands / North West 16/05/2014
Page 19Table 7
Q3 If there was a General Election tomorrow, to which party or independent candidate would you give your first preference vote?
Base : All Irish Adults 18+
Total Gender Age Class Area Region Core Party Support (Unadjusted)
Male Female 18-34 35-54 55+ ABC1F C2DE Urban Rural CAVAN, DONEGA
L, LEITRIM, LOUTH
, MONAGHAN
GALWAY, MAYO, ROSCOMMON, SLIGO
KILDARE, LAOIS,LONGFORD,
MEATH, OFFALY,WESTMEATH
Fianna Fail
Fine Gael
Labour Green Party
Sinn Fein
Indep/Others
Would not/DK
Total 513 261 252 154 207 152 249 264 224 289 149 154 210 95 115 16 3 80 82 121
100% 100% 100% 100% 100% 100% 100% 100% 100% 100% 100% 100% 100% 100% 100% 100% 100% 100% 100% 100%
WTD Base: 513 261 252 154 207 152 249 264 224 289 149 154 210 95 115 16 3 80 82 121
UNWTD 513 236 277 119 211 183 265 248 278 235 118 182 213 93 126 21 3 67 92 111
Fianna Fail 95 55 41 23 43 30 44 52 33 62 24 37 34 95 - - - - - -
19% 21% 16% 15% 21% 20% 18% 20% 15% 21% 16% 24% 16% 100% - - - - - -
Fine Gael 115 58 57 24 45 47 64 52 51 64 27 35 53 - 115 - - - - -
22% 22% 23% 16% 21% 31% 26% 20% 23% 22% 18% 23% 25% - 100% - - - - -
Labour 16 5 11 5 6 5 11 5 10 6 3 7 6 - - 16 - - - -
3% 2% 4% 3% 3% 3% 4% 2% 4% 2% 2% 4% 3% - - 100% - - - -
Green Party 3 1 2 - 0 3 0 3 3 - - 1 3 - - - 3 - - -
1% 0% 1% - 0% 2% 0% 1% 2% - - 0% 1% - - - 100% - - -
Sinn Fein 80 49 32 33 37 10 44 36 42 38 37 14 29 - - - - 80 - -
16% 19% 13% 22% 18% 7% 18% 14% 19% 13% 25% 9% 14% - - - - 100% - -
Independent 79 43 36 32 28 19 36 43 34 46 23 30 26 - - - - - 79 -
15% 16% 14% 21% 13% 13% 15% 16% 15% 16% 15% 20% 13% - - - - - 96% -
Other 3 1 2 - 3 - 2 1 2 1 2 - 1 - - - - - 3 -
1% 1% 1% - 2% - 1% 0% 1% 0% 1% - 1% - - - - - 4% -
Don't Know / Would not vote
121 50 71 36 46 39 47 74 48 73 33 30 58 - - - - - - 121
23% 19% 28% 24% 22% 25% 19% 28% 21% 25% 22% 19% 27% - - - - - - 100%

European & Local Area Elections - Midlands / North West 16/05/2014
Page 20Table 7
Q3 If there was a General Election tomorrow, to which party or independent candidate would you give your first preference vote?
Base : All Irish Adults 18+
Total Local election Support (Unadjusted)
Fianna Fail
Fine Gael
Labour Green Party
Sinn Fein
Independent/Others
Will Not / DK
Total 513 109 92 23 2 76 112 99
100% 100% 100% 100% 100% 100% 100% 100%
WTD Base: 513 109 92 23 2 76 112 99
UNWTD 513 104 104 24 4 58 122 97
Fianna Fail 95 68 1 1 0 1 16 9
19% 63% 1% 3% 17% 1% 14% 9%
Fine Gael 115 11 64 6 0 3 17 14
22% 10% 69% 28% 20% 4% 15% 15%
Labour 16 1 3 6 - - 3 3
3% 1% 3% 26% - - 3% 3%
Green Party 3 - - 2 1 - - -
1% - - 11% 63% - - -
Sinn Fein 80 5 - 2 - 60 8 4
16% 5% - 9% - 79% 7% 5%
Independent 79 5 9 - - 6 52 7
15% 5% 10% - - 7% 47% 7%
Other 3 - - - - - 3 -
1% - - - - - 3% -
Don't Know / Would not vote
121 19 15 6 - 7 13 61
23% 17% 17% 24% - 9% 12% 62%

European & Local Area Elections - Midlands / North West 16/05/2014
Page 21Table 8
Q3 If there was a General Election tomorrow, to which party or independent candidate would you give your first preference vote?
Base : All Irish Adults 18+All voters excluding undecided (General election)
Total Gender Age Class Area Region Core Party Support (Unadjusted)
Male Female 18-34 35-54 55+ ABC1F C2DE Urban Rural CAVAN, DONEGA
L, LEITRIM, LOUTH
, MONAGHAN
GALWAY, MAYO, ROSCOMMON, SLIGO
KILDARE, LAOIS,LONGFORD,
MEATH, OFFALY,WESTMEATH
Fianna Fail
Fine Gael
Labour Green Party
Sinn Fein
Indep/Others
Total 392 211 181 117 162 114 202 191 176 216 116 124 153 95 115 16 3 80 82
100% 100% 100% 100% 100% 100% 100% 100% 100% 100% 100% 100% 100% 100% 100% 100% 100% 100% 100%
WTD Base: 392 211 181 117 162 114 202 191 176 216 116 124 153 95 115 16 3 80 82
UNWTD 402 200 202 86 171 145 219 183 216 186 94 147 161 93 126 21 3 67 92
Fianna Fail 95 55 41 23 43 30 44 52 33 62 24 37 34 95 - - - - -
24% 26% 23% 20% 26% 26% 22% 27% 19% 29% 21% 30% 22% 100% - - - - -
Fine Gael 115 58 57 24 45 47 64 52 51 64 27 35 53 - 115 - - - -
29% 28% 31% 21% 28% 41% 32% 27% 29% 30% 23% 29% 35% - 100% - - - -
Labour 16 5 11 5 6 5 11 5 10 6 3 7 6 - - 16 - - -
4% 2% 6% 4% 4% 4% 5% 3% 5% 3% 2% 5% 4% - - 100% - - -
Green Party 3 1 2 - 0 3 0 3 3 - - 1 3 - - - 3 - -
1% 0% 1% - 0% 3% 0% 2% 2% - - 0% 2% - - - 100% - -
Sinn Fein 80 49 32 33 37 10 44 36 42 38 37 14 29 - - - - 80 -
20% 23% 18% 28% 23% 9% 22% 19% 24% 18% 32% 11% 19% - - - - 100% -
Independent 79 43 36 32 28 19 36 43 34 46 23 30 26 - - - - - 79
20% 20% 20% 27% 17% 17% 18% 22% 19% 21% 20% 24% 17% - - - - - 96%
Other 3 1 2 - 3 - 2 1 2 1 2 - 1 - - - - - 3
1% 1% 1% - 2% - 1% 1% 1% 0% 2% - 1% - - - - - 4%

European & Local Area Elections - Midlands / North West 16/05/2014
Page 22Table 8
Q3 If there was a General Election tomorrow, to which party or independent candidate would you give your first preference vote?
Base : All Irish Adults 18+All voters excluding undecided (General election)
Total Local election Support (Unadjusted)
Fianna Fail
Fine Gael
Labour Green Party
Sinn Fein
Independent/Others
Will Not / DK
Total 392 90 77 18 2 70 99 38
100% 100% 100% 100% 100% 100% 100% 100%
WTD Base: 392 90 77 18 2 70 99 38
UNWTD 402 89 90 18 4 54 107 40
Fianna Fail 95 68 1 1 0 1 16 9
24% 76% 1% 4% 17% 1% 16% 24%
Fine Gael 115 11 64 6 0 3 17 14
29% 12% 83% 36% 20% 5% 17% 38%
Labour 16 1 3 6 - - 3 3
4% 1% 3% 35% - - 3% 8%
Green Party 3 - - 2 1 - - -
1% - - 14% 63% - - -
Sinn Fein 80 5 - 2 - 60 8 4
20% 6% - 12% - 87% 8% 12%
Independent 79 5 9 - - 6 52 7
20% 6% 12% - - 8% 53% 18%
Other 3 - - - - - 3 -
1% - - - - - 3% -

European & Local Area Elections - Midlands / North West 16/05/2014
Page 23Table 9
Adjusted Party Support : Q3 If there was a General Election tomorrow, to which party or independent candidate would you give your first preference vote?
Base : All voters excluding undecided (General election)Will definitely vote
Total Gender Age Class Area Region Core Party Support (Unadjusted)
Male Female 18-34 35-54 55+ ABC1F C2DE Urban Rural CAVAN, DONEGA
L, LEITRIM, LOUTH
, MONAGHAN
GALWAY, MAYO, ROSCOMMON, SLIGO
KILDARE, LAOIS,LONGFORD,
MEATH, OFFALY,WESTMEATH
Fianna Fail
Fine Gael
Labour Green Party
Sinn Fein
Indep/Others
Total 301 147 154 78 118 105 152 149 127 174 84 113 103 59 89 11 7 59 75
100% 100% 100% 100% 100% 100% 100% 100% 100% 100% 100% 100% 100% 100% 100% 100% 100% 100% 100%
WTD Base: 301 147 154 78 118 105 152 149 127 174 84 113 103 59 89 11 7 59 75
UNWTD 322 165 157 55 139 128 180 142 175 147 77 118 127 75 102 13 3 57 72
Fianna Fail 59 31 28 6 29 24 24 35 20 39 14 31 15 59 - - - - -
20% 21% 18% 8% 25% 23% 16% 24% 16% 22% 16% 27% 15% 100% - - - - -
Fine Gael 89 40 49 18 31 40 50 39 39 51 19 30 40 - 89 - - - -
30% 27% 32% 23% 26% 38% 33% 26% 30% 29% 23% 27% 39% - 100% - - - -
Labour 11 6 6 - 6 5 6 5 4 7 1 6 4 - - 11 - - -
4% 4% 4% - 5% 5% 4% 3% 4% 4% 1% 5% 4% - - 100% - - -
Green Party 7 2 5 - 0 6 0 6 7 - - 1 5 - - - 7 - -
2% 1% 3% - 0% 6% 0% 4% 5% - - 1% 5% - - - 100% - -
Sinn Fein 59 35 24 25 24 10 33 26 26 33 27 13 19 - - - - 59 -
20% 24% 16% 32% 20% 10% 22% 17% 20% 19% 32% 11% 18% - - - - 100% -
Independent 71 32 39 29 23 19 35 36 28 42 20 32 18 - - - - - 71
24% 22% 25% 37% 19% 18% 23% 24% 22% 24% 24% 29% 18% - - - - - 94%
Other 5 2 3 - 5 - 4 1 3 2 4 - 1 - - - - - 5
2% 1% 2% - 4% - 2% 1% 2% 1% 4% - 1% - - - - - 6%

European & Local Area Elections - Midlands / North West 16/05/2014
Page 24Table 9
Adjusted Party Support : Q3 If there was a General Election tomorrow, to which party or independent candidate would you give your first preference vote?
Base : All voters excluding undecided (General election)Will definitely vote
Total Local election Support (Unadjusted)
Fianna Fail
Fine Gael
Labour Green Party
Sinn Fein
Independent/Others
Will Not / DK
Total 301 60 64 16 2 48 92 18
100% 100% 100% 100% 100% 100% 100% 100%
WTD Base: 301 60 64 16 2 48 92 18
UNWTD 322 74 73 14 4 46 86 25
Fianna Fail 59 41 1 0 0 0 13 3
20% 69% 2% 2% 9% 1% 14% 17%
Fine Gael 89 9 53 3 1 3 14 6
30% 15% 84% 19% 29% 6% 16% 35%
Labour 11 1 1 6 - - 3 0
4% 2% 1% 35% - - 3% 2%
Green Party 7 - - 5 2 - - -
2% - - 31% 62% - - -
Sinn Fein 59 5 - 2 - 41 7 4
20% 8% - 13% - 85% 8% 20%
Independent 71 3 9 - - 4 50 5
24% 6% 14% - - 9% 54% 27%
Other 5 - - - - - 5 -
2% - - - - - 5% -

1
Dublin Constituency Tabular Report

European & Local Area Elections - DUBLIN 16/05/2014
Page 1Table 1
Q1 Which of these candidates would you give your first preference vote to in the European Parliament Election? - First Preference Vote
Base : All Irish Adults 18+
Total Gender Age Class Dublin Region Core Party Support (Unadjusted)
Male Female 18-34 35-54 55+ ABC1F C2DE Dun Laoghair
e - Rathdow
n
Dublin City
Council
Fingal South Dublin CC
Fianna Fail
Fine Gael
Labour Green Party
Sinn Fein
Indep/Others
Would not/DK
Total 521 241 280 194 179 148 234 287 99 201 109 112 62 96 41 17 81 108 117
100% 100% 100% 100% 100% 100% 100% 100% 100% 100% 100% 100% 100% 100% 100% 100% 100% 100% 100%
WTD Base: 521 241 280 194 179 148 234 287 99 201 109 112 62 96 41 17 81 108 117
UNWTD 521 241 280 140 209 172 282 239 100 119 176 123 59 107 39 21 81 110 104
Lynn Boylan (Lynn Ní Bhaoigheallain) Sinn Fein
73 44 29 19 37 18 12 61 6 29 24 14 2 1 7 - 51 11 2
14% 18% 10% 10% 21% 12% 5% 21% 6% 15% 22% 13% 3% 1% 18% - 62% 10% 1%
Nessa Childers, Independent
42 17 25 7 10 25 20 22 9 18 9 5 4 8 5 - 5 15 6
8% 7% 9% 4% 6% 17% 9% 8% 10% 9% 8% 5% 6% 9% 11% - 6% 14% 5%
Emer Costello, LabourParty
26 12 15 10 7 9 21 5 5 11 7 3 0 3 16 - 2 1 4
5% 5% 5% 5% 4% 6% 9% 2% 5% 5% 7% 3% 0% 3% 40% - 2% 1% 3%
Mary Fitzpatrick, Fianna Fail
47 30 17 15 13 19 25 22 4 29 8 6 36 1 1 1 1 2 4
9% 13% 6% 8% 7% 13% 11% 8% 4% 14% 7% 5% 59% 1% 3% 6% 2% 2% 3%
Brian Hayes, Fine Gael
62 23 39 16 25 21 37 25 21 15 8 18 - 51 1 - 2 4 5
12% 10% 14% 8% 14% 14% 16% 9% 21% 7% 8% 16% - 53% 2% - 2% 4% 4%
Paul Murphy, Stop the Water Tax/ Socialist Party
33 19 14 16 15 2 12 22 7 16 5 6 5 - 1 - 7 9 12
6% 8% 5% 8% 8% 1% 5% 8% 7% 8% 4% 6% 8% - 1% - 9% 9% 10%
Eamon Ryan, Green Party
42 17 25 12 18 13 27 15 14 9 8 11 5 6 2 13 1 9 6
8% 7% 9% 6% 10% 9% 12% 5% 14% 5% 7% 10% 9% 7% 4% 76% 1% 9% 5%
Brid Smith, People Before Profit Alliance
38 23 16 16 12 10 14 24 8 15 4 10 0 3 3 - 5 26 1
7% 9% 6% 8% 7% 7% 6% 8% 9% 8% 4% 9% 1% 3% 8% - 6% 24% 1%
Jim Tallon, Independent
13 6 6 6 3 4 3 10 1 8 2 1 2 0 - - 1 8 2
2% 3% 2% 3% 2% 3% 1% 3% 1% 4% 2% 1% 3% 0% - - 1% 7% 2%

European & Local Area Elections - DUBLIN 16/05/2014
Page 2Table 1
Q1 Which of these candidates would you give your first preference vote to in the European Parliament Election? - First Preference Vote
Base : All Irish Adults 18+
Total Gender Age Class Dublin Region Core Party Support (Unadjusted)
Male Female 18-34 35-54 55+ ABC1F C2DE Dun Laoghair
e - Rathdow
n
Dublin City
Council
Fingal South Dublin CC
Fianna Fail
Fine Gael
Labour Green Party
Sinn Fein
Indep/Others
Would not/DK
Total 521 241 280 194 179 148 234 287 99 201 109 112 62 96 41 17 81 108 117
100% 100% 100% 100% 100% 100% 100% 100% 100% 100% 100% 100% 100% 100% 100% 100% 100% 100% 100%
WTD Base: 521 241 280 194 179 148 234 287 99 201 109 112 62 96 41 17 81 108 117
UNWTD 521 241 280 140 209 172 282 239 100 119 176 123 59 107 39 21 81 110 104
Raymond Patrick Whitehead, Direct Democracy Ireland
2 2 - - 2 - 2 - - 2 - - - - - 2 - - -
0% 1% - - 1% - 1% - - 1% - - - - - 14% - - -
Damon Matthew Wise, Fis Nua
2 - 2 2 - - - 2 - - - 2 - - - - - - 2
0% - 1% 1% - - - 1% - - - 2% - - - - - - 2%
Undecided 139 46 93 75 36 27 61 78 23 48 34 34 7 22 5 1 8 21 75
27% 19% 33% 39% 20% 18% 26% 27% 23% 24% 31% 31% 12% 23% 13% 4% 9% 20% 64%

European & Local Area Elections - DUBLIN 16/05/2014
Page 3Table 1
Q1 Which of these candidates would you give your first preference vote to in the European Parliament Election? - First Preference Vote
Base : All Irish Adults 18+
Total Local election Support (Unadjusted)
Fianna Fail
Fine Gael
Labour Green Party
Sinn Fein
Independent/Others
Will Not / DK
Total 521 65 73 35 20 62 106 162
100% 100% 100% 100% 100% 100% 100% 100%
WTD Base: 521 65 73 35 20 62 106 162
UNWTD 521 61 88 42 23 60 112 135
Lynn Boylan (Lynn Ní Bhaoigheallain) Sinn Fein
73 0 1 - 1 47 12 12
14% 0% 1% - 4% 75% 11% 8%
Nessa Childers, Independent
42 1 3 6 - 4 14 13
8% 2% 4% 17% - 7% 14% 8%
Emer Costello, LabourParty
26 0 4 16 - 1 3 4
5% 0% 5% 45% - 2% 2% 2%
Mary Fitzpatrick, Fianna Fail
47 39 0 1 0 1 4 1
9% 60% 0% 4% 2% 2% 4% 1%
Brian Hayes, Fine Gael
62 2 42 2 2 - 2 12
12% 3% 58% 6% 10% - 2% 7%
Paul Murphy, Stop the Water Tax/ Socialist Party
33 1 1 1 - 3 13 14
6% 2% 1% 3% - 6% 13% 9%
Eamon Ryan, Green Party
42 8 3 1 13 1 11 4
8% 13% 4% 4% 67% 2% 10% 3%
Brid Smith, People Before Profit Alliance
38 0 3 3 0 2 24 6
7% 1% 5% 9% 1% 3% 22% 4%
Jim Tallon, Independent
13 5 0 - - 3 5 -
2% 7% 0% - - 4% 5% -

European & Local Area Elections - DUBLIN 16/05/2014
Page 4Table 1
Q1 Which of these candidates would you give your first preference vote to in the European Parliament Election? - First Preference Vote
Base : All Irish Adults 18+
Total Local election Support (Unadjusted)
Fianna Fail
Fine Gael
Labour Green Party
Sinn Fein
Independent/Others
Will Not / DK
Total 521 65 73 35 20 62 106 162
100% 100% 100% 100% 100% 100% 100% 100%
WTD Base: 521 65 73 35 20 62 106 162
UNWTD 521 61 88 42 23 60 112 135
Raymond Patrick Whitehead, Direct Democracy Ireland
2 - - - 2 - - -
0% - - - 12% - - -
Damon Matthew Wise, Fis Nua
2 - - - - - - 2
0% - - - - - - 1%
Undecided 139 8 16 5 1 0 17 93
27% 12% 22% 13% 3% 1% 16% 57%

European & Local Area Elections - DUBLIN 16/05/2014
Page 5Table 2
Q1 Which of these candidates would you give your first preference vote to in the European Parliament Election? - First Preference Vote
Base : All Irish Adults 18+All Voters Excluding Undecided [Dublin]
Total Gender Age Class Dublin Region Core Party Support (Unadjusted)
Male Female 18-34 35-54 55+ ABC1F C2DE Dun Laoghair
e - Rathdow
n
Dublin City
Council
Fingal South Dublin CC
Fianna Fail
Fine Gael
Labour Green Party
Sinn Fein
Indep/Others
Would not/DK
Total 382 195 187 119 142 121 174 208 76 153 75 78 54 73 35 16 74 87 43
100% 100% 100% 100% 100% 100% 100% 100% 100% 100% 100% 100% 100% 100% 100% 100% 100% 100% 100%
WTD Base: 382 195 187 119 142 121 174 208 76 153 75 78 54 73 35 16 74 87 43
UNWTD 392 196 196 86 161 145 217 175 79 91 126 95 53 86 34 20 72 89 38
Lynn Boylan (Lynn Ní Bhaoigheallain) Sinn Fein
73 44 29 19 37 18 12 61 6 29 24 14 2 1 7 - 51 11 2
19% 23% 15% 16% 26% 15% 7% 29% 8% 19% 31% 19% 3% 1% 21% - 69% 12% 4%
Nessa Childers, Independent
42 17 25 7 10 25 20 22 9 18 9 5 4 8 5 - 5 15 6
11% 9% 13% 6% 7% 21% 12% 10% 12% 12% 12% 7% 7% 12% 13% - 6% 17% 14%
Emer Costello, LabourParty
26 12 15 10 7 9 21 5 5 11 7 3 0 3 16 - 2 1 4
7% 6% 8% 8% 5% 8% 12% 2% 7% 7% 10% 4% 1% 4% 46% - 3% 2% 8%
Mary Fitzpatrick, Fianna Fail
47 30 17 15 13 19 25 22 4 29 8 6 36 1 1 1 1 2 4
12% 16% 9% 13% 9% 16% 14% 11% 5% 19% 11% 7% 67% 1% 4% 7% 2% 3% 9%
Brian Hayes, Fine Gael
62 23 39 16 25 21 37 25 21 15 8 18 - 51 1 - 2 4 5
16% 12% 21% 14% 18% 17% 21% 12% 28% 10% 11% 23% - 70% 2% - 2% 5% 11%
Paul Murphy, Stop the Water Tax/ Socialist Party
33 19 14 16 15 2 12 22 7 16 5 6 5 - 1 - 7 9 12
9% 10% 7% 14% 11% 2% 7% 10% 9% 10% 6% 8% 9% - 2% - 9% 11% 27%
Eamon Ryan, Green Party
42 17 25 12 18 13 27 15 14 9 8 11 5 6 2 13 1 9 6
11% 9% 13% 10% 12% 11% 16% 7% 19% 6% 11% 14% 10% 9% 5% 79% 1% 11% 13%
Brid Smith, People Before Profit Alliance
38 23 16 16 12 10 14 24 8 15 4 10 0 3 3 - 5 26 1
10% 12% 8% 14% 9% 8% 8% 11% 11% 10% 6% 13% 1% 3% 9% - 6% 30% 3%
Jim Tallon, Independent
13 6 6 6 3 4 3 10 1 8 2 1 2 0 - - 1 8 2
3% 3% 3% 5% 2% 3% 2% 5% 1% 5% 2% 2% 3% 0% - - 2% 9% 4%

European & Local Area Elections - DUBLIN 16/05/2014
Page 6Table 2
Q1 Which of these candidates would you give your first preference vote to in the European Parliament Election? - First Preference Vote
Base : All Irish Adults 18+All Voters Excluding Undecided [Dublin]
Total Gender Age Class Dublin Region Core Party Support (Unadjusted)
Male Female 18-34 35-54 55+ ABC1F C2DE Dun Laoghair
e - Rathdow
n
Dublin City
Council
Fingal South Dublin CC
Fianna Fail
Fine Gael
Labour Green Party
Sinn Fein
Indep/Others
Would not/DK
Total 382 195 187 119 142 121 174 208 76 153 75 78 54 73 35 16 74 87 43
100% 100% 100% 100% 100% 100% 100% 100% 100% 100% 100% 100% 100% 100% 100% 100% 100% 100% 100%
WTD Base: 382 195 187 119 142 121 174 208 76 153 75 78 54 73 35 16 74 87 43
UNWTD 392 196 196 86 161 145 217 175 79 91 126 95 53 86 34 20 72 89 38
Raymond Patrick Whitehead, Direct Democracy Ireland
2 2 - - 2 - 2 - - 2 - - - - - 2 - - -
1% 1% - - 2% - 1% - - 1% - - - - - 14% - - -
Damon Matthew Wise, Fis Nua
2 - 2 2 - - - 2 - - - 2 - - - - - - 2
1% - 1% 2% - - - 1% - - - 3% - - - - - - 6%

European & Local Area Elections - DUBLIN 16/05/2014
Page 7Table 2
Q1 Which of these candidates would you give your first preference vote to in the European Parliament Election? - First Preference Vote
Base : All Irish Adults 18+All Voters Excluding Undecided [Dublin]
Total Local election Support (Unadjusted)
Fianna Fail
Fine Gael
Labour Green Party
Sinn Fein
Independent/Others
Will Not / DK
Total 382 57 57 30 19 62 88 69
100% 100% 100% 100% 100% 100% 100% 100%
WTD Base: 382 57 57 30 19 62 88 69
UNWTD 392 54 73 36 22 58 93 56
Lynn Boylan (Lynn Ní Bhaoigheallain) Sinn Fein
73 0 1 - 1 47 12 12
19% 0% 1% - 4% 76% 14% 18%
Nessa Childers, Independent
42 1 3 6 - 4 14 13
11% 2% 6% 20% - 7% 16% 19%
Emer Costello, LabourParty
26 0 4 16 - 1 3 4
7% 1% 6% 52% - 2% 3% 5%
Mary Fitzpatrick, Fianna Fail
47 39 0 1 0 1 4 1
12% 68% 0% 4% 2% 2% 5% 2%
Brian Hayes, Fine Gael
62 2 42 2 2 - 2 12
16% 3% 74% 7% 11% - 3% 18%
Paul Murphy, Stop the Water Tax/ Socialist Party
33 1 1 1 - 3 13 14
9% 2% 1% 3% - 6% 15% 20%
Eamon Ryan, Green Party
42 8 3 1 13 1 11 4
11% 15% 5% 5% 69% 2% 12% 7%
Brid Smith, People Before Profit Alliance
38 0 3 3 0 2 24 6
10% 1% 6% 10% 1% 3% 27% 9%
Jim Tallon, Independent
13 5 0 - - 3 5 -
3% 8% 1% - - 4% 6% -

European & Local Area Elections - DUBLIN 16/05/2014
Page 8Table 2
Q1 Which of these candidates would you give your first preference vote to in the European Parliament Election? - First Preference Vote
Base : All Irish Adults 18+All Voters Excluding Undecided [Dublin]
Total Local election Support (Unadjusted)
Fianna Fail
Fine Gael
Labour Green Party
Sinn Fein
Independent/Others
Will Not / DK
Total 382 57 57 30 19 62 88 69
100% 100% 100% 100% 100% 100% 100% 100%
WTD Base: 382 57 57 30 19 62 88 69
UNWTD 392 54 73 36 22 58 93 56
Raymond Patrick Whitehead, Direct Democracy Ireland
2 - - - 2 - - -
1% - - - 12% - - -
Damon Matthew Wise, Fis Nua
2 - - - - - - 2
1% - - - - - - 3%

European & Local Area Elections - DUBLIN 16/05/2014
Page 9Table 3
Q1 Which of these candidates would you give your second preference vote to in the European Parliament Election? - Second Preference Vote
Base : All Irish Adults 18+All Voters Excluding Undecided [Dublin]
Total Gender Age Class Dublin Region Core Party Support (Unadjusted)
Male Female 18-34 35-54 55+ ABC1F C2DE Dun Laoghair
e - Rathdow
n
Dublin City
Council
Fingal South Dublin CC
Fianna Fail
Fine Gael
Labour Green Party
Sinn Fein
Indep/Others
Would not/DK
Total 382 195 187 119 142 121 174 208 76 153 75 78 54 73 35 16 74 87 43
100% 100% 100% 100% 100% 100% 100% 100% 100% 100% 100% 100% 100% 100% 100% 100% 100% 100% 100%
WTD Base: 382 195 187 119 142 121 174 208 76 153 75 78 54 73 35 16 74 87 43
UNWTD 392 196 196 86 161 145 217 175 79 91 126 95 53 86 34 20 72 89 38
Lynn Boylan (Lynn Ní Bhaoigheallain) Sinn Fein
36 17 20 15 14 7 7 30 8 11 5 13 4 3 - - 15 9 5
9% 9% 10% 13% 10% 6% 4% 14% 10% 7% 6% 16% 7% 4% - - 20% 11% 12%
Nessa Childers, Independent
27 14 14 4 11 12 13 15 5 8 6 8 5 4 0 0 6 12 -
7% 7% 7% 4% 7% 10% 7% 7% 6% 5% 8% 11% 10% 5% 1% 2% 8% 14% -
Emer Costello, LabourParty
27 12 15 7 13 7 16 10 4 12 9 2 2 8 5 4 - 5 3
7% 6% 8% 6% 9% 6% 9% 5% 5% 8% 12% 2% 4% 11% 15% 23% - 6% 6%
Thomas Darcy, DirectDemocracy Ireland
4 - 4 2 - 2 1 3 1 1 2 - - - - - - 2 2
1% - 2% 1% - 2% 1% 1% 1% 1% 2% - - - - - - 3% 4%
Mary Fitzpatrick, Fianna Fail
28 18 10 9 12 7 12 16 8 13 6 1 4 5 1 0 7 5 5
7% 9% 5% 8% 8% 6% 7% 8% 11% 9% 7% 1% 8% 7% 2% 2% 10% 6% 12%
Brian Hayes, Fine Gael
26 11 15 7 10 9 19 7 4 8 7 7 4 8 4 0 5 3 1
7% 5% 8% 6% 7% 7% 11% 3% 5% 5% 9% 9% 7% 11% 11% 2% 6% 4% 3%
Paul Murphy, Stop the Water Tax/ Socialist Party
36 27 9 11 15 10 9 27 6 15 7 8 1 4 1 1 8 17 3
9% 14% 5% 9% 11% 8% 5% 13% 7% 10% 10% 11% 2% 6% 4% 9% 11% 20% 7%
Eamon Ryan, Green Party
46 24 22 14 14 17 25 21 8 25 6 7 13 22 3 1 3 2 3
12% 12% 12% 12% 10% 14% 15% 10% 10% 16% 8% 9% 23% 30% 9% 4% 4% 2% 6%
Brid Smith, People Before Profit Alliance
21 10 11 5 10 6 3 18 4 7 5 5 - - 6 1 6 8 -
6% 5% 6% 4% 7% 5% 2% 9% 6% 5% 6% 7% - - 16% 8% 9% 9% -

European & Local Area Elections - DUBLIN 16/05/2014
Page 10Table 3
Q1 Which of these candidates would you give your second preference vote to in the European Parliament Election? - Second Preference Vote
Base : All Irish Adults 18+All Voters Excluding Undecided [Dublin]
Total Gender Age Class Dublin Region Core Party Support (Unadjusted)
Male Female 18-34 35-54 55+ ABC1F C2DE Dun Laoghair
e - Rathdow
n
Dublin City
Council
Fingal South Dublin CC
Fianna Fail
Fine Gael
Labour Green Party
Sinn Fein
Indep/Others
Would not/DK
Total 382 195 187 119 142 121 174 208 76 153 75 78 54 73 35 16 74 87 43
100% 100% 100% 100% 100% 100% 100% 100% 100% 100% 100% 100% 100% 100% 100% 100% 100% 100% 100%
WTD Base: 382 195 187 119 142 121 174 208 76 153 75 78 54 73 35 16 74 87 43
UNWTD 392 196 196 86 161 145 217 175 79 91 126 95 53 86 34 20 72 89 38
Jim Tallon, Independent
12 6 6 3 4 5 5 7 5 - 4 3 1 - 3 - 1 4 2
3% 3% 3% 3% 3% 4% 3% 3% 6% - 6% 4% 2% - 9% - 2% 5% 6%
Raymond Patrick Whitehead, Direct Democracy Ireland
1 1 - - - 1 1 - - 1 - - - - - - - 1 -
0% 0% - - - 1% 0% - - 0% - - - - - - - 1% -
Damon Matthew Wise, Fis Nua
0 0 - 0 - - 0 - - - 0 - - - - 0 - - -
0% 0% - 0% - - 0% - - - 1% - - - - 3% - - -
Undecided / No second preference
118 56 62 40 40 37 62 56 24 52 19 23 20 19 12 8 22 18 19
31% 29% 33% 34% 28% 31% 36% 27% 32% 34% 25% 30% 37% 26% 34% 47% 30% 21% 45%
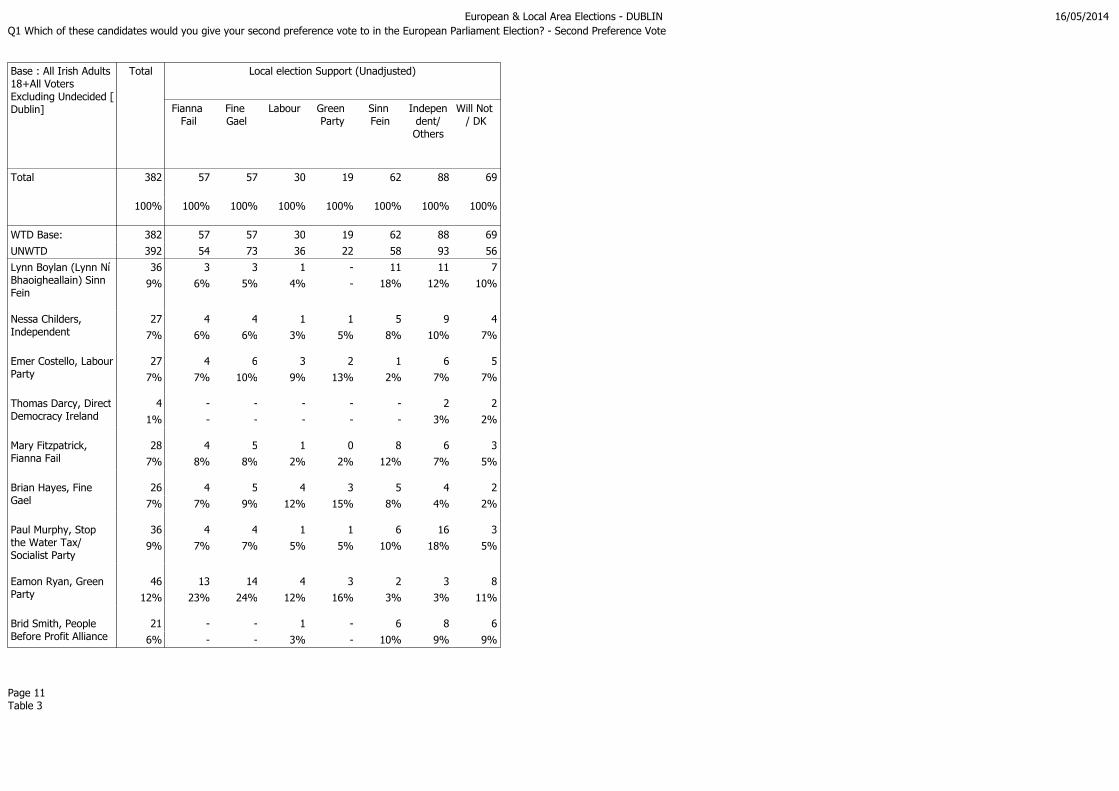
European & Local Area Elections - DUBLIN 16/05/2014
Page 11Table 3
Q1 Which of these candidates would you give your second preference vote to in the European Parliament Election? - Second Preference Vote
Base : All Irish Adults 18+All Voters Excluding Undecided [Dublin]
Total Local election Support (Unadjusted)
Fianna Fail
Fine Gael
Labour Green Party
Sinn Fein
Independent/Others
Will Not / DK
Total 382 57 57 30 19 62 88 69
100% 100% 100% 100% 100% 100% 100% 100%
WTD Base: 382 57 57 30 19 62 88 69
UNWTD 392 54 73 36 22 58 93 56
Lynn Boylan (Lynn Ní Bhaoigheallain) Sinn Fein
36 3 3 1 - 11 11 7
9% 6% 5% 4% - 18% 12% 10%
Nessa Childers, Independent
27 4 4 1 1 5 9 4
7% 6% 6% 3% 5% 8% 10% 7%
Emer Costello, LabourParty
27 4 6 3 2 1 6 5
7% 7% 10% 9% 13% 2% 7% 7%
Thomas Darcy, DirectDemocracy Ireland
4 - - - - - 2 2
1% - - - - - 3% 2%
Mary Fitzpatrick, Fianna Fail
28 4 5 1 0 8 6 3
7% 8% 8% 2% 2% 12% 7% 5%
Brian Hayes, Fine Gael
26 4 5 4 3 5 4 2
7% 7% 9% 12% 15% 8% 4% 2%
Paul Murphy, Stop the Water Tax/ Socialist Party
36 4 4 1 1 6 16 3
9% 7% 7% 5% 5% 10% 18% 5%
Eamon Ryan, Green Party
46 13 14 4 3 2 3 8
12% 23% 24% 12% 16% 3% 3% 11%
Brid Smith, People Before Profit Alliance
21 - - 1 - 6 8 6
6% - - 3% - 10% 9% 9%

European & Local Area Elections - DUBLIN 16/05/2014
Page 12Table 3
Q1 Which of these candidates would you give your second preference vote to in the European Parliament Election? - Second Preference Vote
Base : All Irish Adults 18+All Voters Excluding Undecided [Dublin]
Total Local election Support (Unadjusted)
Fianna Fail
Fine Gael
Labour Green Party
Sinn Fein
Independent/Others
Will Not / DK
Total 382 57 57 30 19 62 88 69
100% 100% 100% 100% 100% 100% 100% 100%
WTD Base: 382 57 57 30 19 62 88 69
UNWTD 392 54 73 36 22 58 93 56
Jim Tallon, Independent
12 2 1 4 - 1 4 1
3% 3% 1% 12% - 2% 4% 2%
Raymond Patrick Whitehead, Direct Democracy Ireland
1 - - - - - 1 -
0% - - - - - 1% -
Damon Matthew Wise, Fis Nua
0 - - - 0 - - -
0% - - - 2% - - -
Undecided / No second preference
118 20 16 11 8 16 19 27
31% 34% 28% 38% 41% 26% 22% 39%

European & Local Area Elections - DUBLIN 16/05/2014
Page 13Table 4
Q1 Which of these candidates would you give your second preference vote to in the European Parliament Election? - Second Preference Vote
Base : All Irish Adults 18+All Voters Excluding Undecided [Dublin]
Total Q1 Which of these candidates would you give your first preference vote to in the European Parliament Election? - First Preference Vote
Lynn Boylan (Lynn NíBhaoigheallain) Sinn Fein
Nessa Childers,Independent
Emer Costello,Labour Party
Mary Fitzpatric
k, Fianna Fail
Brian Hayes, Fine Gael
Paul Murphy, Stop theWater Tax/
Socialist Party
Eamon Ryan, Green Party
Brid Smith, People Before Profit Alliance
Jim Tallon, Independent
Raymond PatrickWhitehead,
Direct Democra
cy Ireland
Damon MatthewWise, FisNua
Total 382 73 42 26 47 62 33 42 38 13 2 2
100% 100% 100% 100% 100% 100% 100% 100% 100% 100% 100% 100%
WTD Base: 382 73 42 26 47 62 33 42 38 13 2 2
UNWTD 392 65 41 37 44 76 27 53 38 9 1 1
Lynn Boylan (Lynn Ní Bhaoigheallain) Sinn Fein
36 - 4 - 1 4 12 3 5 4 - 2
9% - 10% - 2% 7% 35% 8% 14% 29% - 100%
Nessa Childers, Independent
27 11 - - 3 3 1 5 2 3 - -
7% 15% - - 6% 5% 2% 12% 5% 23% - -
Emer Costello, LabourParty
27 2 2 - 5 7 4 6 0 - - -
7% 3% 5% - 10% 12% 12% 14% 1% - - -
Thomas Darcy, DirectDemocracy Ireland
4 - 2 - - - - - 2 - - -
1% - 4% - - - - - 7% - - -
Mary Fitzpatrick, Fianna Fail
28 9 2 1 - 5 1 5 2 2 - -
7% 13% 4% 5% - 8% 4% 11% 6% 19% - -
Brian Hayes, Fine Gael
26 2 - 6 6 - 1 6 3 2 - -
7% 3% - 24% 12% - 2% 14% 7% 15% - -
Paul Murphy, Stop the Water Tax/ Socialist Party
36 11 2 1 3 3 - 1 13 - - -
9% 16% 4% 6% 7% 5% - 3% 35% - - -
Eamon Ryan, Green Party
46 3 6 3 13 20 - - 1 - - -
12% 3% 15% 12% 27% 32% - - 2% - - -

European & Local Area Elections - DUBLIN 16/05/2014
Page 14Table 4
Q1 Which of these candidates would you give your second preference vote to in the European Parliament Election? - Second Preference Vote
Base : All Irish Adults 18+All Voters Excluding Undecided [Dublin]
Total Q1 Which of these candidates would you give your first preference vote to in the European Parliament Election? - First Preference Vote
Lynn Boylan (Lynn NíBhaoigheallain) Sinn Fein
Nessa Childers,Independent
Emer Costello,Labour Party
Mary Fitzpatric
k, Fianna Fail
Brian Hayes, Fine Gael
Paul Murphy, Stop theWater Tax/
Socialist Party
Eamon Ryan, Green Party
Brid Smith, People Before Profit Alliance
Jim Tallon, Independent
Raymond PatrickWhitehead,
Direct Democra
cy Ireland
Damon MatthewWise, FisNua
Total 382 73 42 26 47 62 33 42 38 13 2 2
100% 100% 100% 100% 100% 100% 100% 100% 100% 100% 100% 100%
WTD Base: 382 73 42 26 47 62 33 42 38 13 2 2
UNWTD 392 65 41 37 44 76 27 53 38 9 1 1
Brid Smith, People Before Profit Alliance
21 14 2 - - - 3 2 - - - -
6% 20% 5% - - - 9% 5% - - - -
Jim Tallon, Independent
12 1 8 1 1 - - 0 1 - - -
3% 1% 19% 2% 2% - - 1% 4% - - -
Raymond Patrick Whitehead, Direct Democracy Ireland
1 - 1 - - - - - - - - -
0% - 2% - - - - - - - - -
Damon Matthew Wise, Fis Nua
0 - - - 0 - - - - - - -
0% - - - 1% - - - - - - -
Undecided / No second preference
118 19 13 13 15 19 13 13 8 2 2 -
31% 26% 31% 51% 33% 31% 38% 30% 20% 14% 100% -

European & Local Area Elections - DUBLIN 16/05/2014
Page 15Table 5
Q2 To which party or independent candidate would you give your first preference vote in the local elections?
Base : All Irish Adults 18+
Total Gender Age Class Dublin Region Core Party Support (Unadjusted)
Male Female 18-34 35-54 55+ ABC1F C2DE Dun Laoghair
e - Rathdow
n
Dublin City
Council
Fingal South Dublin CC
Fianna Fail
Fine Gael
Labour Green Party
Sinn Fein
Indep/Others
Would not/DK
Total 521 241 280 194 179 148 234 287 99 201 109 112 62 96 41 17 81 108 117
100% 100% 100% 100% 100% 100% 100% 100% 100% 100% 100% 100% 100% 100% 100% 100% 100% 100% 100%
WTD Base: 521 241 280 194 179 148 234 287 99 201 109 112 62 96 41 17 81 108 117
UNWTD 521 241 280 140 209 172 282 239 100 119 176 123 59 107 39 21 81 110 104
Fianna Fail 65 33 32 18 22 25 30 35 5 33 14 12 49 2 - 2 3 2 7
12% 14% 11% 9% 12% 17% 13% 12% 5% 16% 13% 11% 79% 2% - 13% 4% 2% 6%
Fine Gael 73 27 45 30 21 22 46 26 19 24 11 18 - 61 1 - 2 3 5
14% 11% 16% 15% 12% 15% 20% 9% 19% 12% 10% 16% - 64% 3% - 2% 3% 4%
Labour 35 14 21 8 11 17 23 11 12 10 6 6 - 2 25 - 1 3 4
7% 6% 7% 4% 6% 11% 10% 4% 12% 5% 6% 6% - 2% 62% - 1% 3% 3%
Green Party 20 12 8 5 9 5 15 5 11 5 3 - 1 4 1 9 - 2 4
4% 5% 3% 3% 5% 3% 6% 2% 11% 3% 3% - 1% 4% 1% 56% - 1% 3%
Sinn Fein 62 47 15 16 35 11 11 52 8 23 18 14 2 1 1 - 56 3 -
12% 20% 5% 8% 20% 7% 5% 18% 8% 11% 16% 12% 3% 1% 2% - 69% 2% -
Independent 74 37 37 30 21 24 29 45 11 26 21 15 4 1 1 4 8 48 7
14% 15% 13% 15% 12% 16% 12% 16% 11% 13% 19% 14% 7% 1% 2% 26% 10% 45% 6%
Other 32 15 17 12 15 4 14 18 9 14 5 4 1 4 - 0 4 20 3
6% 6% 6% 6% 8% 3% 6% 6% 9% 7% 4% 4% 2% 4% - 2% 5% 19% 2%
Don't Know / Will not vote
162 56 105 75 45 42 67 95 24 66 30 42 6 21 12 0 7 27 88
31% 23% 38% 39% 25% 28% 29% 33% 24% 33% 28% 37% 9% 22% 29% 2% 9% 25% 75%

European & Local Area Elections - DUBLIN 16/05/2014
Page 16Table 5
Q2 To which party or independent candidate would you give your first preference vote in the local elections?
Base : All Irish Adults 18+
Total Local election Support (Unadjusted)
Fianna Fail
Fine Gael
Labour Green Party
Sinn Fein
Independent/Others
Will Not / DK
Total 521 65 73 35 20 62 106 162
100% 100% 100% 100% 100% 100% 100% 100%
WTD Base: 521 65 73 35 20 62 106 162
UNWTD 521 61 88 42 23 60 112 135
Fianna Fail 65 65 - - - - - -
12% 100% - - - - - -
Fine Gael 73 - 73 - - - - -
14% - 100% - - - - -
Labour 35 - - 35 - - - -
7% - - 100% - - - -
Green Party 20 - - - 20 - - -
4% - - - 100% - - -
Sinn Fein 62 - - - - 62 - -
12% - - - - 100% - -
Independent 74 - - - - - 74 -
14% - - - - - 70% -
Other 32 - - - - - 32 -
6% - - - - - 30% -
Don't Know / Will not vote
162 - - - - - - 162
31% - - - - - - 100%

European & Local Area Elections - DUBLIN 16/05/2014
Page 17Table 6
Q2 To which party or independent candidate would you give your first preference vote in the local elections?
Base : All Irish Adults 18+All voters excluding undecided (Local elections)
Total Gender Age Class Dublin Region Core Party Support (Unadjusted)
Male Female 18-34 35-54 55+ ABC1F C2DE Dun Laoghair
e - Rathdow
n
Dublin City
Council
Fingal South Dublin CC
Fianna Fail
Fine Gael
Labour Green Party
Sinn Fein
Indep/Others
Would not/DK
Total 359 185 175 119 134 107 168 192 75 135 79 70 56 74 29 16 74 81 29
100% 100% 100% 100% 100% 100% 100% 100% 100% 100% 100% 100% 100% 100% 100% 100% 100% 100% 100%
WTD Base: 359 185 175 119 134 107 168 192 75 135 79 70 56 74 29 16 74 81 29
UNWTD 386 186 200 88 161 137 216 170 79 87 135 84 54 89 31 19 72 89 32
Fianna Fail 65 33 32 18 22 25 30 35 5 33 14 12 49 2 - 2 3 2 7
18% 18% 18% 15% 17% 23% 18% 18% 7% 24% 18% 17% 87% 2% - 14% 4% 2% 24%
Fine Gael 73 27 45 30 21 22 46 26 19 24 11 18 - 61 1 - 2 3 5
20% 15% 26% 25% 15% 21% 28% 14% 25% 18% 14% 26% - 83% 4% - 2% 4% 18%
Labour 35 14 21 8 11 17 23 11 12 10 6 6 - 2 25 - 1 3 4
10% 8% 12% 6% 8% 16% 14% 6% 16% 7% 8% 9% - 2% 87% - 1% 4% 13%
Green Party 20 12 8 5 9 5 15 5 11 5 3 - 1 4 1 9 - 2 4
5% 6% 5% 4% 7% 5% 9% 3% 15% 4% 4% - 1% 5% 2% 58% - 2% 12%
Sinn Fein 62 47 15 16 35 11 11 52 8 23 18 14 2 1 1 - 56 3 -
17% 26% 9% 14% 26% 10% 6% 27% 10% 17% 23% 20% 3% 1% 3% - 76% 3% -
Independent 74 37 37 30 21 24 29 45 11 26 21 15 4 1 1 4 8 48 7
21% 20% 21% 25% 15% 22% 17% 24% 15% 19% 27% 22% 7% 1% 3% 26% 11% 60% 24%
Other 32 15 17 12 15 4 14 18 9 14 5 4 1 4 - 0 4 20 3
9% 8% 10% 10% 11% 4% 8% 9% 12% 10% 6% 6% 2% 5% - 2% 5% 25% 9%

European & Local Area Elections - DUBLIN 16/05/2014
Page 18Table 6
Q2 To which party or independent candidate would you give your first preference vote in the local elections?
Base : All Irish Adults 18+All voters excluding undecided (Local elections)
Total Local election Support (Unadjusted)
Fianna Fail
Fine Gael
Labour Green Party
Sinn Fein
Independent/Others
Total 359 65 73 35 20 62 106
100% 100% 100% 100% 100% 100% 100%
WTD Base: 359 65 73 35 20 62 106
UNWTD 386 61 88 42 23 60 112
Fianna Fail 65 65 - - - - -
18% 100% - - - - -
Fine Gael 73 - 73 - - - -
20% - 100% - - - -
Labour 35 - - 35 - - -
10% - - 100% - - -
Green Party 20 - - - 20 - -
5% - - - 100% - -
Sinn Fein 62 - - - - 62 -
17% - - - - 100% -
Independent 74 - - - - - 74
21% - - - - - 70%
Other 32 - - - - - 32
9% - - - - - 30%

European & Local Area Elections - DUBLIN 16/05/2014
Page 19Table 7
Q3 If there was a General Election tomorrow, to which party or independent candidate would you give your first preference vote?
Base : All Irish Adults 18+
Total Gender Age Class Dublin Region Core Party Support (Unadjusted)
Male Female 18-34 35-54 55+ ABC1F C2DE Dun Laoghair
e - Rathdow
n
Dublin City
Council
Fingal South Dublin CC
Fianna Fail
Fine Gael
Labour Green Party
Sinn Fein
Indep/Others
Would not/DK
Total 521 241 280 194 179 148 234 287 99 201 109 112 62 96 41 17 81 108 117
100% 100% 100% 100% 100% 100% 100% 100% 100% 100% 100% 100% 100% 100% 100% 100% 100% 100% 100%
WTD Base: 521 241 280 194 179 148 234 287 99 201 109 112 62 96 41 17 81 108 117
UNWTD 521 241 280 140 209 172 282 239 100 119 176 123 59 107 39 21 81 110 104
Fianna Fail 62 31 30 18 20 25 32 30 10 29 11 12 62 - - - - - -
12% 13% 11% 9% 11% 17% 14% 10% 10% 14% 10% 10% 100% - - - - - -
Fine Gael 96 38 57 30 30 35 55 40 26 32 15 22 - 96 - - - - -
18% 16% 20% 16% 17% 24% 24% 14% 27% 16% 13% 20% - 100% - - - - -
Labour 41 12 29 12 9 19 19 22 8 13 10 10 - - 41 - - - -
8% 5% 10% 6% 5% 13% 8% 8% 8% 7% 9% 9% - - 100% - - - -
Green Party 17 9 8 3 10 3 12 5 5 7 5 - - - - 17 - - -
3% 4% 3% 2% 6% 2% 5% 2% 5% 3% 4% - - - - 100% - - -
Sinn Fein 81 52 29 25 39 17 16 65 8 32 23 19 - - - - 81 - -
16% 22% 10% 13% 22% 12% 7% 23% 8% 16% 21% 17% - - - - 100% - -
Independent 81 42 40 33 23 26 44 37 15 32 18 15 - - - - - 81 -
16% 17% 14% 17% 13% 17% 19% 13% 16% 16% 17% 14% - - - - - 75% -
Other 27 14 13 14 11 2 7 20 10 9 4 4 - - - - - 27 -
5% 6% 4% 7% 6% 1% 3% 7% 10% 5% 3% 3% - - - - - 25% -
Don't Know / Would not vote
117 43 75 58 37 22 50 68 17 46 25 30 - - - - - - 117
23% 18% 27% 30% 21% 15% 21% 24% 17% 23% 22% 27% - - - - - - 100%

European & Local Area Elections - DUBLIN 16/05/2014
Page 20Table 7
Q3 If there was a General Election tomorrow, to which party or independent candidate would you give your first preference vote?
Base : All Irish Adults 18+
Total Local election Support (Unadjusted)
Fianna Fail
Fine Gael
Labour Green Party
Sinn Fein
Independent/Others
Will Not / DK
Total 521 65 73 35 20 62 106 162
100% 100% 100% 100% 100% 100% 100% 100%
WTD Base: 521 65 73 35 20 62 106 162
UNWTD 521 61 88 42 23 60 112 135
Fianna Fail 62 49 - - 1 2 5 6
12% 75% - - 3% 3% 5% 3%
Fine Gael 96 2 61 2 4 1 5 21
18% 3% 85% 5% 20% 1% 4% 13%
Labour 41 - 1 25 1 1 1 12
8% - 2% 73% 3% 2% 1% 7%
Green Party 17 2 - - 9 - 5 0
3% 3% - - 48% - 4% 0%
Sinn Fein 81 3 2 1 - 56 12 7
16% 5% 2% 2% - 90% 11% 5%
Independent 81 2 3 3 1 3 50 19
16% 3% 4% 9% 7% 4% 47% 12%
Other 27 - - - 0 - 18 8
5% - - - 1% - 17% 5%
Don't Know / Would not vote
117 7 5 4 4 - 10 88
23% 11% 7% 11% 18% - 9% 54%

European & Local Area Elections - DUBLIN 16/05/2014
Page 21Table 8
Q3 If there was a General Election tomorrow, to which party or independent candidate would you give your first preference vote?
Base : All Irish Adults 18+All voters excluding undecided (General election)
Total Gender Age Class Dublin Region Core Party Support (Unadjusted)
Male Female 18-34 35-54 55+ ABC1F C2DE Dun Laoghair
e - Rathdow
n
Dublin City
Council
Fingal South Dublin CC
Fianna Fail
Fine Gael
Labour Green Party
Sinn Fein
Indep/Others
Total 404 198 205 136 141 127 185 219 82 155 85 82 62 96 41 17 81 108
100% 100% 100% 100% 100% 100% 100% 100% 100% 100% 100% 100% 100% 100% 100% 100% 100% 100%
WTD Base: 404 198 205 136 141 127 185 219 82 155 85 82 62 96 41 17 81 108
UNWTD 417 203 214 103 167 147 229 188 82 91 142 99 59 107 39 21 81 110
Fianna Fail 62 31 30 18 20 25 32 30 10 29 11 12 62 - - - - -
15% 16% 15% 13% 14% 19% 17% 14% 12% 19% 13% 14% 100% - - - - -
Fine Gael 96 38 57 30 30 35 55 40 26 32 15 22 - 96 - - - -
24% 19% 28% 22% 21% 28% 30% 18% 32% 21% 17% 27% - 100% - - - -
Labour 41 12 29 12 9 19 19 22 8 13 10 10 - - 41 - - -
10% 6% 14% 9% 7% 15% 10% 10% 9% 9% 11% 12% - - 100% - - -
Green Party 17 9 8 3 10 3 12 5 5 7 5 - - - - 17 - -
4% 5% 4% 2% 7% 3% 6% 2% 6% 4% 5% - - - - 100% - -
Sinn Fein 81 52 29 25 39 17 16 65 8 32 23 19 - - - - 81 -
20% 26% 14% 19% 27% 14% 9% 30% 9% 21% 27% 23% - - - - 100% -
Independent 81 42 40 33 23 26 44 37 15 32 18 15 - - - - - 81
20% 21% 19% 24% 16% 20% 24% 17% 19% 21% 22% 19% - - - - - 75%
Other 27 14 13 14 11 2 7 20 10 9 4 4 - - - - - 27
7% 7% 6% 10% 8% 1% 4% 9% 12% 6% 4% 5% - - - - - 25%

European & Local Area Elections - DUBLIN 16/05/2014
Page 22Table 8
Q3 If there was a General Election tomorrow, to which party or independent candidate would you give your first preference vote?
Base : All Irish Adults 18+All voters excluding undecided (General election)
Total Local election Support (Unadjusted)
Fianna Fail
Fine Gael
Labour Green Party
Sinn Fein
Independent/Others
Will Not / DK
Total 404 58 67 31 16 62 96 74
100% 100% 100% 100% 100% 100% 100% 100%
WTD Base: 404 58 67 31 16 62 96 74
UNWTD 417 56 80 36 21 60 101 63
Fianna Fail 62 49 - - 1 2 5 6
15% 85% - - 4% 3% 5% 8%
Fine Gael 96 2 61 2 4 1 5 21
24% 3% 91% 6% 24% 1% 5% 29%
Labour 41 - 1 25 1 1 1 12
10% - 2% 81% 4% 2% 1% 16%
Green Party 17 2 - - 9 - 5 0
4% 4% - - 59% - 5% 0%
Sinn Fein 81 3 2 1 - 56 12 7
20% 5% 2% 3% - 90% 13% 10%
Independent 81 2 3 3 1 3 50 19
20% 3% 5% 10% 8% 4% 52% 26%
Other 27 - - - 0 - 18 8
7% - - - 1% - 19% 11%

European & Local Area Elections - DUBLIN 16/05/2014
Page 23Table 9
Adjusted Party Support : Q3 If there was a General Election tomorrow, to which party or independent candidate would you give your first preference vote?
Base : All voters excluding undecided (General election)Will definitely vote
Total Gender Age Class Dublin Region Core Party Support (Unadjusted)
Male Female 18-34 35-54 55+ ABC1F C2DE Dun Laoghair
e - Rathdow
n
Dublin City
Council
Fingal South Dublin CC
Fianna Fail
Fine Gael
Labour Green Party
Sinn Fein
Indep/Others
Total 275 130 145 59 103 113 122 153 41 84 82 66 38 61 30 13 59 75
100% 100% 100% 100% 100% 100% 100% 100% 100% 100% 100% 100% 100% 100% 100% 100% 100% 100%
WTD Base: 275 130 145 59 103 113 122 153 41 84 82 66 38 61 30 13 59 75
UNWTD 346 167 179 60 147 139 196 150 67 78 116 83 50 90 30 16 70 90
Fianna Fail 38 17 21 8 12 18 20 17 5 15 8 9 38 - - - - -
14% 13% 15% 13% 11% 16% 17% 11% 12% 18% 10% 14% 100% - - - - -
Fine Gael 61 27 34 11 19 31 34 27 10 16 16 19 - 61 - - - -
22% 21% 23% 18% 19% 27% 28% 18% 23% 19% 20% 29% - 100% - - - -
Labour 30 8 21 5 5 19 14 15 4 13 6 6 - - 30 - - -
11% 6% 15% 9% 5% 17% 12% 10% 11% 16% 7% 9% - - 100% - - -
Green Party 13 6 7 3 8 2 9 3 6 3 3 - - - - 13 - -
5% 4% 5% 5% 7% 2% 8% 2% 14% 3% 4% - - - - 100% - -
Sinn Fein 59 38 21 14 30 15 10 50 6 13 24 18 - - - - 59 -
22% 30% 14% 24% 29% 13% 8% 32% 13% 15% 29% 27% - - - - 100% -
Independent 63 30 33 17 22 24 28 35 7 23 19 13 - - - - - 63
23% 23% 23% 29% 21% 21% 23% 23% 18% 28% 24% 19% - - - - - 84%
Other 12 4 7 1 7 3 6 5 3 1 7 1 - - - - - 12
4% 3% 5% 2% 7% 3% 5% 3% 8% 1% 8% 2% - - - - - 16%

European & Local Area Elections - DUBLIN 16/05/2014
Page 24Table 9
Adjusted Party Support : Q3 If there was a General Election tomorrow, to which party or independent candidate would you give your first preference vote?
Base : All voters excluding undecided (General election)Will definitely vote
Total Local election Support (Unadjusted)
Fianna Fail
Fine Gael
Labour Green Party
Sinn Fein
Independent/Others
Will Not / DK
Total 275 37 37 23 13 44 73 49
100% 100% 100% 100% 100% 100% 100% 100%
WTD Base: 275 37 37 23 13 44 73 49
UNWTD 346 47 68 31 16 51 87 46
Fianna Fail 38 31 - - 0 1 2 4
14% 84% - - 1% 2% 3% 7%
Fine Gael 61 1 35 1 2 1 3 18
22% 3% 94% 3% 16% 2% 4% 38%
Labour 30 - - 19 2 1 1 7
11% - - 81% 14% 1% 2% 14%
Green Party 13 1 - - 7 - 3 1
5% 3% - - 56% - 4% 3%
Sinn Fein 59 1 - 1 - 41 11 6
22% 3% - 5% - 93% 14% 12%
Independent 63 2 2 2 1 1 45 10
23% 6% 6% 11% 8% 1% 61% 20%
Other 12 - - - 1 - 8 3
4% - - - 5% - 12% 6%

1
South Constituency Tabular Data

European & Local Area Elections - South 16/05/2014
Page 1Table 1
Q1 Which of these candidates would you give your first preference vote to in the European Parliament Election? - First Preference Vote
Base : All Irish Adults 18+
Total Gender Age Class Area Region Core Party Support (Unadjusted)
Male Female 18-34 35-54 55+ ABC1F C2DE Urban Rural CORK, KERRY
CLARE, LIMERICK,
TIPPERARY
CARLOW,
KILKENNY,
WATERFORD, WEXFORD,
WICKLOW
Fianna Fail
Fine Gael
Labour Green Party
Sinn Fein
Indep/Others
Would not/DK
Total 511 252 259 181 182 148 247 264 245 266 206 145 160 95 89 27 4 68 74 153
100% 100% 100% 100% 100% 100% 100% 100% 100% 100% 100% 100% 100% 100% 100% 100% 100% 100% 100% 100%
WTD Base: 511 252 259 181 182 148 247 264 245 266 206 145 160 95 89 27 4 68 74 153
UNWTD 511 264 247 133 208 170 280 231 313 198 198 134 179 94 106 26 5 68 83 128
Richard Cahill, Independent
8 3 4 3 4 1 2 6 3 4 0 3 4 3 - 1 - 2 2 -
2% 1% 2% 1% 2% 1% 1% 2% 1% 2% 0% 2% 3% 3% - 2% - 3% 3% -
Deirdre Clune, Fine Gael
35 12 23 12 10 13 18 17 12 23 28 4 3 1 21 3 - 1 6 3
7% 5% 9% 7% 5% 9% 7% 7% 5% 9% 14% 3% 2% 1% 24% 10% - 2% 8% 2%
Brian Crowley, FiannaFail
122 62 59 25 54 42 58 64 42 79 52 40 29 55 19 1 1 2 15 29
24% 25% 23% 14% 30% 29% 23% 24% 17% 30% 25% 28% 18% 58% 21% 3% 16% 3% 21% 19%
Jillian Godsil, Independent
6 2 4 2 3 1 1 5 4 2 1 1 4 2 - - 1 1 2 1
1% 1% 1% 1% 1% 1% 0% 2% 2% 1% 0% 1% 3% 2% - - 14% 1% 3% 0%
Simon Harris, Fine Gael
27 10 17 10 10 7 17 10 8 19 - 5 23 4 12 0 - 1 3 7
5% 4% 7% 6% 6% 5% 7% 4% 3% 7% - 3% 14% 4% 13% 1% - 2% 5% 4%
Kieran Hartley, Fianna Fail
2 1 1 0 1 1 1 1 2 - 1 - 1 1 - - - - 1 0
0% 0% 0% 0% 0% 0% 1% 0% 1% - 0% - 1% 1% - - - - 1% 0%
Theresa Heaney, Catholic Democrats (The National Party)
3 2 1 - 2 0 2 1 2 1 1 - 1 2 - - - - - 1
1% 1% 0% - 1% 0% 1% 0% 1% 0% 1% - 1% 2% - - - - - 1%
Sean Kelly, Fine Gael 58 41 18 28 17 13 33 25 24 35 29 15 14 9 24 4 1 8 5 7
11% 16% 7% 16% 9% 9% 13% 10% 10% 13% 14% 11% 9% 10% 27% 15% 20% 11% 7% 5%

European & Local Area Elections - South 16/05/2014
Page 2Table 1
Q1 Which of these candidates would you give your first preference vote to in the European Parliament Election? - First Preference Vote
Base : All Irish Adults 18+
Total Gender Age Class Area Region Core Party Support (Unadjusted)
Male Female 18-34 35-54 55+ ABC1F C2DE Urban Rural CORK, KERRY
CLARE, LIMERICK,
TIPPERARY
CARLOW,
KILKENNY,
WATERFORD, WEXFORD,
WICKLOW
Fianna Fail
Fine Gael
Labour Green Party
Sinn Fein
Indep/Others
Would not/DK
Total 511 252 259 181 182 148 247 264 245 266 206 145 160 95 89 27 4 68 74 153
100% 100% 100% 100% 100% 100% 100% 100% 100% 100% 100% 100% 100% 100% 100% 100% 100% 100% 100% 100%
WTD Base: 511 252 259 181 182 148 247 264 245 266 206 145 160 95 89 27 4 68 74 153
UNWTD 511 264 247 133 208 170 280 231 313 198 198 134 179 94 106 26 5 68 83 128
Liadh Ní Riada, Sinn Fein
49 28 21 8 18 24 25 24 26 23 26 12 11 0 - 1 - 36 4 7
10% 11% 8% 4% 10% 16% 10% 9% 11% 9% 12% 8% 7% 0% - 4% - 54% 6% 5%
Diarmuid Patrick O'Flynn, Independent
5 4 2 0 4 1 4 1 0 5 3 2 0 1 - - - 1 3 1
1% 1% 1% 0% 2% 0% 2% 0% 0% 2% 1% 1% 0% 2% - - - 1% 4% 0%
Peter O'Loughlin, Independent
4 2 2 2 1 1 0 4 3 1 - 1 3 - 0 - - 1 2 1
1% 1% 1% 1% 1% 0% 0% 1% 1% 0% - 1% 2% - 1% - - 1% 2% 1%
Grace O'Sullivan, Green Party
10 7 3 2 7 1 6 4 6 5 2 4 4 - 1 0 2 1 2 3
2% 3% 1% 1% 4% 1% 2% 2% 2% 2% 1% 3% 3% - 1% 2% 51% 1% 3% 2%
Phil Prendergast, Labour Party
18 11 7 10 4 4 7 11 12 7 4 11 3 3 2 6 - - 7 1
4% 4% 3% 6% 2% 3% 3% 4% 5% 2% 2% 8% 2% 3% 2% 23% - - 9% 0%
Jan Van De Ven, Direct Democracy Ireland
3 2 1 1 1 1 1 2 1 2 1 - 2 1 - - - 2 - -
1% 1% 0% 0% 0% 1% 0% 1% 0% 1% 1% - 1% 1% - - - 2% - -
Undecided 161 65 95 76 46 38 71 89 100 60 57 46 57 13 10 11 - 12 22 93
31% 26% 37% 42% 25% 26% 29% 34% 41% 23% 28% 32% 36% 14% 11% 39% - 17% 30% 61%

European & Local Area Elections - South 16/05/2014
Page 3Table 1
Q1 Which of these candidates would you give your first preference vote to in the European Parliament Election? - First Preference Vote
Base : All Irish Adults 18+
Total Local election Support (Unadjusted)
Fianna Fail
Fine Gael
Labour Green Party
Sinn Fein
Independent/Others
Will Not / DK
Total 511 85 108 28 4 54 103 128
100% 100% 100% 100% 100% 100% 100% 100%
WTD Base: 511 85 108 28 4 54 103 128
UNWTD 511 89 114 26 6 52 106 117
Richard Cahill, Independent
8 3 - 1 - 1 3 0
2% 3% - 2% - 1% 3% 0%
Deirdre Clune, Fine Gael
35 1 24 2 - 0 6 3
7% 1% 22% 6% - 1% 6% 2%
Brian Crowley, FiannaFail
122 53 18 2 1 4 26 18
24% 62% 17% 7% 15% 7% 25% 14%
Jillian Godsil, Independent
6 - - - 1 1 4 -
1% - - - 13% 1% 4% -
Simon Harris, Fine Gael
27 3 11 0 - 1 8 4
5% 4% 10% 1% - 2% 7% 3%
Kieran Hartley, Fianna Fail
2 0 - - - 1 0 1
0% 0% - - - 1% 0% 0%
Theresa Heaney, Catholic Democrats (The National Party)
3 2 0 - - - - 0
1% 2% 0% - - - - 0%
Sean Kelly, Fine Gael 58 11 26 2 0 4 11 4
11% 13% 24% 6% 8% 8% 10% 3%

European & Local Area Elections - South 16/05/2014
Page 4Table 1
Q1 Which of these candidates would you give your first preference vote to in the European Parliament Election? - First Preference Vote
Base : All Irish Adults 18+
Total Local election Support (Unadjusted)
Fianna Fail
Fine Gael
Labour Green Party
Sinn Fein
Independent/Others
Will Not / DK
Total 511 85 108 28 4 54 103 128
100% 100% 100% 100% 100% 100% 100% 100%
WTD Base: 511 85 108 28 4 54 103 128
UNWTD 511 89 114 26 6 52 106 117
Liadh Ní Riada, Sinn Fein
49 1 5 1 - 36 5 1
10% 2% 5% 3% - 66% 5% 1%
Diarmuid Patrick O'Flynn, Independent
5 1 1 - - - 2 0
1% 2% 1% - - - 2% 0%
Peter O'Loughlin, Independent
4 1 0 1 - - 1 1
1% 1% 0% 3% - - 1% 0%
Grace O'Sullivan, Green Party
10 - 1 - 1 1 4 3
2% - 1% - 16% 2% 4% 3%
Phil Prendergast, Labour Party
18 1 4 5 - 1 5 2
4% 1% 3% 19% - 2% 5% 2%
Jan Van De Ven, Direct Democracy Ireland
3 - - - - 3 - -
1% - - - - 5% - -
Undecided 161 7 18 15 2 2 27 89
31% 9% 17% 52% 47% 4% 27% 70%
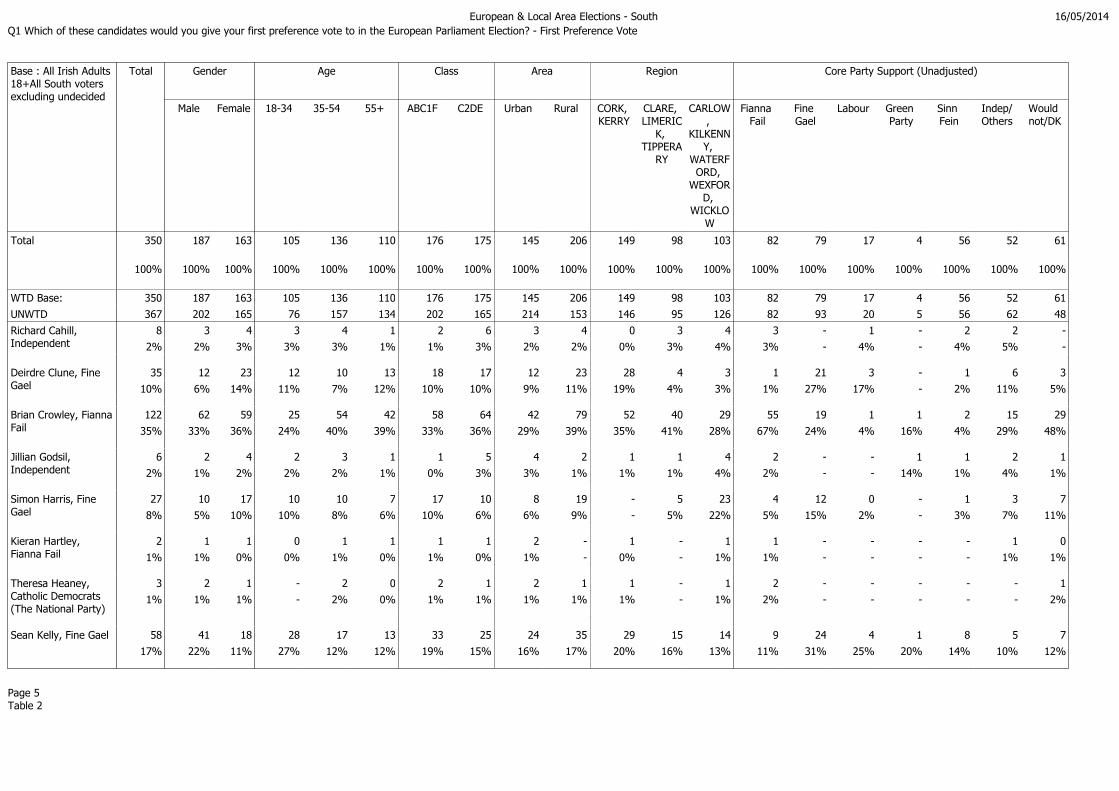
European & Local Area Elections - South 16/05/2014
Page 5Table 2
Q1 Which of these candidates would you give your first preference vote to in the European Parliament Election? - First Preference Vote
Base : All Irish Adults 18+All South voters excluding undecided
Total Gender Age Class Area Region Core Party Support (Unadjusted)
Male Female 18-34 35-54 55+ ABC1F C2DE Urban Rural CORK, KERRY
CLARE, LIMERICK,
TIPPERARY
CARLOW,
KILKENNY,
WATERFORD, WEXFORD,
WICKLOW
Fianna Fail
Fine Gael
Labour Green Party
Sinn Fein
Indep/Others
Would not/DK
Total 350 187 163 105 136 110 176 175 145 206 149 98 103 82 79 17 4 56 52 61
100% 100% 100% 100% 100% 100% 100% 100% 100% 100% 100% 100% 100% 100% 100% 100% 100% 100% 100% 100%
WTD Base: 350 187 163 105 136 110 176 175 145 206 149 98 103 82 79 17 4 56 52 61
UNWTD 367 202 165 76 157 134 202 165 214 153 146 95 126 82 93 20 5 56 62 48
Richard Cahill, Independent
8 3 4 3 4 1 2 6 3 4 0 3 4 3 - 1 - 2 2 -
2% 2% 3% 3% 3% 1% 1% 3% 2% 2% 0% 3% 4% 3% - 4% - 4% 5% -
Deirdre Clune, Fine Gael
35 12 23 12 10 13 18 17 12 23 28 4 3 1 21 3 - 1 6 3
10% 6% 14% 11% 7% 12% 10% 10% 9% 11% 19% 4% 3% 1% 27% 17% - 2% 11% 5%
Brian Crowley, FiannaFail
122 62 59 25 54 42 58 64 42 79 52 40 29 55 19 1 1 2 15 29
35% 33% 36% 24% 40% 39% 33% 36% 29% 39% 35% 41% 28% 67% 24% 4% 16% 4% 29% 48%
Jillian Godsil, Independent
6 2 4 2 3 1 1 5 4 2 1 1 4 2 - - 1 1 2 1
2% 1% 2% 2% 2% 1% 0% 3% 3% 1% 1% 1% 4% 2% - - 14% 1% 4% 1%
Simon Harris, Fine Gael
27 10 17 10 10 7 17 10 8 19 - 5 23 4 12 0 - 1 3 7
8% 5% 10% 10% 8% 6% 10% 6% 6% 9% - 5% 22% 5% 15% 2% - 3% 7% 11%
Kieran Hartley, Fianna Fail
2 1 1 0 1 1 1 1 2 - 1 - 1 1 - - - - 1 0
1% 1% 0% 0% 1% 0% 1% 0% 1% - 0% - 1% 1% - - - - 1% 1%
Theresa Heaney, Catholic Democrats (The National Party)
3 2 1 - 2 0 2 1 2 1 1 - 1 2 - - - - - 1
1% 1% 1% - 2% 0% 1% 1% 1% 1% 1% - 1% 2% - - - - - 2%
Sean Kelly, Fine Gael 58 41 18 28 17 13 33 25 24 35 29 15 14 9 24 4 1 8 5 7
17% 22% 11% 27% 12% 12% 19% 15% 16% 17% 20% 16% 13% 11% 31% 25% 20% 14% 10% 12%

European & Local Area Elections - South 16/05/2014
Page 6Table 2
Q1 Which of these candidates would you give your first preference vote to in the European Parliament Election? - First Preference Vote
Base : All Irish Adults 18+All South voters excluding undecided
Total Gender Age Class Area Region Core Party Support (Unadjusted)
Male Female 18-34 35-54 55+ ABC1F C2DE Urban Rural CORK, KERRY
CLARE, LIMERICK,
TIPPERARY
CARLOW,
KILKENNY,
WATERFORD, WEXFORD,
WICKLOW
Fianna Fail
Fine Gael
Labour Green Party
Sinn Fein
Indep/Others
Would not/DK
Total 350 187 163 105 136 110 176 175 145 206 149 98 103 82 79 17 4 56 52 61
100% 100% 100% 100% 100% 100% 100% 100% 100% 100% 100% 100% 100% 100% 100% 100% 100% 100% 100% 100%
WTD Base: 350 187 163 105 136 110 176 175 145 206 149 98 103 82 79 17 4 56 52 61
UNWTD 367 202 165 76 157 134 202 165 214 153 146 95 126 82 93 20 5 56 62 48
Liadh Ní Riada, Sinn Fein
49 28 21 8 18 24 25 24 26 23 26 12 11 0 - 1 - 36 4 7
14% 15% 13% 8% 13% 22% 14% 14% 18% 11% 17% 13% 11% 0% - 7% - 65% 8% 12%
Diarmuid Patrick O'Flynn, Independent
5 4 2 0 4 1 4 1 0 5 3 2 0 1 - - - 1 3 1
2% 2% 1% 0% 3% 1% 2% 1% 0% 2% 2% 2% 0% 2% - - - 1% 5% 1%
Peter O'Loughlin, Independent
4 2 2 2 1 1 0 4 3 1 - 1 3 - 0 - - 1 2 1
1% 1% 1% 2% 1% 1% 0% 2% 2% 1% - 1% 3% - 1% - - 2% 3% 1%
Grace O'Sullivan, Green Party
10 7 3 2 7 1 6 4 6 5 2 4 4 - 1 0 2 1 2 3
3% 4% 2% 2% 5% 1% 3% 3% 4% 2% 1% 4% 4% - 1% 3% 51% 2% 5% 6%
Phil Prendergast, Labour Party
18 11 7 10 4 4 7 11 12 7 4 11 3 3 2 6 - - 7 1
5% 6% 4% 10% 3% 4% 4% 6% 8% 3% 3% 11% 3% 4% 2% 38% - - 13% 1%
Jan Van De Ven, Direct Democracy Ireland
3 2 1 1 1 1 1 2 1 2 1 - 2 1 - - - 2 - -
1% 1% 1% 1% 1% 1% 1% 1% 1% 1% 1% - 2% 2% - - - 3% - -

European & Local Area Elections - South 16/05/2014
Page 7Table 2
Q1 Which of these candidates would you give your first preference vote to in the European Parliament Election? - First Preference Vote
Base : All Irish Adults 18+All South voters excluding undecided
Total Local election Support (Unadjusted)
Fianna Fail
Fine Gael
Labour Green Party
Sinn Fein
Independent/Others
Will Not / DK
Total 350 78 90 14 2 52 76 39
100% 100% 100% 100% 100% 100% 100% 100%
WTD Base: 350 78 90 14 2 52 76 39
UNWTD 367 80 96 17 4 50 79 40
Richard Cahill, Independent
8 3 - 1 - 1 3 0
2% 3% - 5% - 1% 4% 1%
Deirdre Clune, Fine Gael
35 1 24 2 - 0 6 3
10% 1% 26% 13% - 1% 8% 7%
Brian Crowley, FiannaFail
122 53 18 2 1 4 26 18
35% 68% 20% 15% 29% 7% 34% 46%
Jillian Godsil, Independent
6 - - - 1 1 4 -
2% - - - 25% 2% 6% -
Simon Harris, Fine Gael
27 3 11 0 - 1 8 4
8% 4% 12% 2% - 2% 10% 11%
Kieran Hartley, Fianna Fail
2 0 - - - 1 0 1
1% 0% - - - 1% 1% 1%
Theresa Heaney, Catholic Democrats (The National Party)
3 2 0 - - - - 0
1% 3% 0% - - - - 1%
Sean Kelly, Fine Gael 58 11 26 2 0 4 11 4
17% 14% 29% 12% 15% 8% 14% 11%

European & Local Area Elections - South 16/05/2014
Page 8Table 2
Q1 Which of these candidates would you give your first preference vote to in the European Parliament Election? - First Preference Vote
Base : All Irish Adults 18+All South voters excluding undecided
Total Local election Support (Unadjusted)
Fianna Fail
Fine Gael
Labour Green Party
Sinn Fein
Independent/Others
Will Not / DK
Total 350 78 90 14 2 52 76 39
100% 100% 100% 100% 100% 100% 100% 100%
WTD Base: 350 78 90 14 2 52 76 39
UNWTD 367 80 96 17 4 50 79 40
Liadh Ní Riada, Sinn Fein
49 1 5 1 - 36 5 1
14% 2% 6% 6% - 69% 7% 4%
Diarmuid Patrick O'Flynn, Independent
5 1 1 - - - 2 0
2% 2% 2% - - - 3% 1%
Peter O'Loughlin, Independent
4 1 0 1 - - 1 1
1% 1% 1% 7% - - 2% 1%
Grace O'Sullivan, Green Party
10 - 1 - 1 1 4 3
3% - 1% - 31% 2% 6% 9%
Phil Prendergast, Labour Party
18 1 4 5 - 1 5 2
5% 1% 4% 40% - 2% 7% 6%
Jan Van De Ven, Direct Democracy Ireland
3 - - - - 3 - -
1% - - - - 6% - -

European & Local Area Elections - South 16/05/2014
Page 9Table 3
Q1 Which of these candidates would you give your second preference vote to in the European Parliament Election? - Second Preference Vote
Base : All Irish Adults 18+All South voters excluding undecided
Total Gender Age Class Area Region Core Party Support (Unadjusted)
Male Female 18-34 35-54 55+ ABC1F C2DE Urban Rural CORK, KERRY
CLARE, LIMERICK,
TIPPERARY
CARLOW,
KILKENNY,
WATERFORD, WEXFORD,
WICKLOW
Fianna Fail
Fine Gael
Labour Green Party
Sinn Fein
Indep/Others
Would not/DK
Total 350 187 163 105 136 110 176 175 145 206 149 98 103 82 79 17 4 56 52 61
100% 100% 100% 100% 100% 100% 100% 100% 100% 100% 100% 100% 100% 100% 100% 100% 100% 100% 100% 100%
WTD Base: 350 187 163 105 136 110 176 175 145 206 149 98 103 82 79 17 4 56 52 61
UNWTD 367 202 165 76 157 134 202 165 214 153 146 95 126 82 93 20 5 56 62 48
Richard Cahill, Independent
9 7 2 5 2 2 3 6 3 6 2 6 0 2 1 - - 2 2 3
3% 4% 1% 5% 2% 1% 2% 3% 2% 3% 1% 7% 0% 2% 1% - - 3% 3% 5%
Deirdre Clune, Fine Gael
24 6 18 6 10 8 19 5 8 16 10 6 8 4 13 4 - 0 1 2
7% 3% 11% 6% 7% 8% 11% 3% 5% 8% 7% 6% 8% 5% 16% 22% - 1% 1% 3%
Brian Crowley, FiannaFail
63 32 30 30 16 18 31 31 28 34 36 15 12 10 19 5 1 7 12 9
18% 17% 18% 28% 11% 16% 18% 18% 20% 17% 24% 15% 12% 12% 24% 30% 17% 13% 23% 15%
Jillian Godsil, Independent
7 3 4 4 2 1 3 5 2 5 1 3 4 3 1 - - 2 1 -
2% 2% 2% 4% 1% 1% 2% 3% 1% 3% 0% 3% 4% 3% 2% - - 3% 2% -
Simon Harris, Fine Gael
16 9 7 4 6 5 12 3 7 9 1 1 13 3 4 0 1 3 2 1
4% 5% 4% 4% 5% 4% 7% 2% 5% 4% 1% 1% 13% 4% 6% 3% 34% 6% 4% 2%
Kieran Hartley, Fianna Fail
18 11 7 5 7 6 4 14 8 10 6 3 8 13 1 - - - 2 1
5% 6% 4% 5% 5% 6% 2% 8% 6% 5% 4% 4% 8% 16% 1% - - - 5% 2%
Theresa Heaney, Catholic Democrats (The National Party)
1 1 - - 1 - - 1 1 - 1 - - - - - 1 - - -
0% 0% - - 1% - - 0% 1% - 1% - - - - - 20% - - -
Sean Kelly, Fine Gael 43 25 17 9 17 17 28 15 17 26 20 20 3 9 15 2 - 6 7 3
12% 14% 11% 8% 12% 16% 16% 9% 11% 13% 13% 20% 3% 11% 19% 12% - 12% 14% 5%

European & Local Area Elections - South 16/05/2014
Page 10Table 3
Q1 Which of these candidates would you give your second preference vote to in the European Parliament Election? - Second Preference Vote
Base : All Irish Adults 18+All South voters excluding undecided
Total Gender Age Class Area Region Core Party Support (Unadjusted)
Male Female 18-34 35-54 55+ ABC1F C2DE Urban Rural CORK, KERRY
CLARE, LIMERICK,
TIPPERARY
CARLOW,
KILKENNY,
WATERFORD, WEXFORD,
WICKLOW
Fianna Fail
Fine Gael
Labour Green Party
Sinn Fein
Indep/Others
Would not/DK
Total 350 187 163 105 136 110 176 175 145 206 149 98 103 82 79 17 4 56 52 61
100% 100% 100% 100% 100% 100% 100% 100% 100% 100% 100% 100% 100% 100% 100% 100% 100% 100% 100% 100%
WTD Base: 350 187 163 105 136 110 176 175 145 206 149 98 103 82 79 17 4 56 52 61
UNWTD 367 202 165 76 157 134 202 165 214 153 146 95 126 82 93 20 5 56 62 48
Liadh Ní Riada, Sinn Fein
22 18 4 10 9 3 4 18 7 15 9 6 7 6 1 - - 9 4 2
6% 9% 3% 10% 6% 3% 2% 10% 5% 7% 6% 6% 6% 7% 1% - - 16% 7% 4%
Diarmuid Patrick O'Flynn, Independent
6 6 - - 2 4 1 5 4 2 3 2 0 1 - 0 - 4 - -
2% 3% - - 2% 3% 0% 3% 3% 1% 2% 2% 0% 2% - 3% - 7% - -
Peter O'Loughlin, Independent
5 4 1 - 4 1 1 4 2 2 1 2 2 2 - - - 2 1 -
1% 2% 0% - 3% 1% 1% 2% 2% 1% 0% 2% 2% 2% - - - 4% 1% -
Grace O'Sullivan, Green Party
7 2 5 1 4 2 5 2 3 4 3 1 3 2 1 - - 1 2 2
2% 1% 3% 1% 3% 2% 3% 1% 2% 2% 2% 1% 3% 3% 1% - - 1% 3% 3%
Phil Prendergast, Labour Party
21 9 12 8 10 3 14 7 11 10 10 3 8 3 6 2 1 2 4 4
6% 5% 8% 8% 7% 3% 8% 4% 8% 5% 7% 3% 8% 4% 8% 11% 16% 3% 7% 6%
Jan Van De Ven, Direct Democracy Ireland
2 2 - 2 0 - 2 - 0 2 - 0 2 - - - - - 2 -
1% 1% - 2% 0% - 1% - 0% 1% - 0% 2% - - - - - 4% -
Undecided / No Second Preference
107 52 55 20 48 40 50 58 42 65 47 29 31 24 17 3 1 17 13 33
31% 28% 34% 19% 35% 36% 28% 33% 29% 32% 31% 30% 30% 29% 21% 19% 14% 31% 26% 55%

European & Local Area Elections - South 16/05/2014
Page 11Table 3
Q1 Which of these candidates would you give your second preference vote to in the European Parliament Election? - Second Preference Vote
Base : All Irish Adults 18+All South voters excluding undecided
Total Local election Support (Unadjusted)
Fianna Fail
Fine Gael
Labour Green Party
Sinn Fein
Independent/Others
Will Not / DK
Total 350 78 90 14 2 52 76 39
100% 100% 100% 100% 100% 100% 100% 100%
WTD Base: 350 78 90 14 2 52 76 39
UNWTD 367 80 96 17 4 50 79 40
Richard Cahill, Independent
9 2 1 - - 2 2 3
3% 2% 1% - - 4% 2% 7%
Deirdre Clune, Fine Gael
24 4 15 1 0 0 3 0
7% 5% 17% 7% 15% 1% 4% 1%
Brian Crowley, FiannaFail
63 10 19 3 1 7 15 7
18% 13% 21% 23% 31% 14% 20% 19%
Jillian Godsil, Independent
7 3 2 - - 1 2 -
2% 3% 2% - - 1% 2% -
Simon Harris, Fine Gael
16 4 5 - - 2 4 1
4% 5% 5% - - 4% 5% 3%
Kieran Hartley, Fianna Fail
18 14 1 - - 1 2 -
5% 18% 1% - - 2% 3% -
Theresa Heaney, Catholic Democrats (The National Party)
1 - 1 - - - - -
0% - 1% - - - - -
Sean Kelly, Fine Gael 43 8 17 2 - 3 8 4
12% 10% 19% 15% - 7% 11% 10%

European & Local Area Elections - South 16/05/2014
Page 12Table 3
Q1 Which of these candidates would you give your second preference vote to in the European Parliament Election? - Second Preference Vote
Base : All Irish Adults 18+All South voters excluding undecided
Total Local election Support (Unadjusted)
Fianna Fail
Fine Gael
Labour Green Party
Sinn Fein
Independent/Others
Will Not / DK
Total 350 78 90 14 2 52 76 39
100% 100% 100% 100% 100% 100% 100% 100%
WTD Base: 350 78 90 14 2 52 76 39
UNWTD 367 80 96 17 4 50 79 40
Liadh Ní Riada, Sinn Fein
22 5 - 1 - 8 8 1
6% 6% - 7% - 15% 11% 2%
Diarmuid Patrick O'Flynn, Independent
6 1 - - - 5 0 -
2% 1% - - - 9% 1% -
Peter O'Loughlin, Independent
5 0 - - - - 4 -
1% 1% - - - - 6% -
Grace O'Sullivan, Green Party
7 2 2 - - 2 2 -
2% 2% 2% - - 3% 2% -
Phil Prendergast, Labour Party
21 4 5 3 1 1 5 3
6% 5% 5% 20% 29% 2% 7% 9%
Jan Van De Ven, Direct Democracy Ireland
2 2 - - - - 0 -
1% 2% - - - - 0% -
Undecided / No Second Preference
107 20 23 4 1 21 20 19
31% 26% 26% 28% 25% 40% 27% 50%

European & Local Area Elections - South 16/05/2014
Page 13Table 4
Q1 Which of these candidates would you give your second preference vote to in the European Parliament Election? - Second Preference Vote
Base : All Irish Adults 18+All South voters excluding undecided
Total Q1 Which of these candidates would you give your first preference vote to in the European Parliament Election? - First Preference Vote
Richard Cahill, Independent
Deirdre Clune, Fine Gael
Brian Crowley,Fianna Fail
Jillian Godsil, Independent
Simon Harris, Fine Gael
Kieran Hartley, Fianna Fail
Theresa Heaney, Catholic Democrats (The National Party)
Sean Kelly, Fine Gael
Liadh Ní Riada, Sinn Fein
DiarmuidPatrick O'Flynn, Independent
Peter O'Loughlin
, Independent
Grace O'Sullivan,Green Party
Phil Prendergast,
Labour Party
Jan Van De Ven, Direct Democracy
Ireland
Total 350 8 35 122 6 27 2 3 58 49 5 4 10 18 3
100% 100% 100% 100% 100% 100% 100% 100% 100% 100% 100% 100% 100% 100% 100%
WTD Base: 350 8 35 122 6 27 2 3 58 49 5 4 10 18 3
UNWTD 367 7 35 127 6 23 4 4 66 48 7 6 14 17 3
Richard Cahill, Independent
9 - - 5 1 - - - 2 0 - - 0 1 -
3% - - 4% 19% - - - 3% 1% - - 3% 4% -
Deirdre Clune, Fine Gael
24 1 - 8 - 4 - - 11 - - - - - -
7% 8% - 7% - 16% - - 18% - - - - - -
Brian Crowley, FiannaFail
63 0 16 - 2 5 1 2 20 8 3 - 1 6 -
18% 6% 46% - 29% 20% 31% 63% 34% 15% 47% - 7% 33% -
Jillian Godsil, Independent
7 3 1 - - - - - 1 1 - 1 1 - -
2% 44% 2% - - - - - 1% 2% - 30% 5% - -
Simon Harris, Fine Gael
16 2 1 6 - - - - 3 2 - - 1 - -
4% 26% 4% 5% - - - - 6% 4% - - 13% - -
Kieran Hartley, Fianna Fail
18 - - 16 - - - - - 1 - 1 1 - -
5% - - 13% - - - - - 1% - 21% 5% - -
Theresa Heaney, Catholic Democrats (The National Party)
1 - - - - - - - 1 - - - - - -
0% - - - - - - - 1% - - - - - -
Sean Kelly, Fine Gael 43 - 10 20 - - 0 - - 8 - - 0 5 -
12% - 28% 16% - - 13% - - 16% - - 3% 27% -
Liadh Ní Riada, Sinn Fein
22 - 1 8 - 1 - 1 6 - 1 1 1 - 3
6% - 4% 6% - 3% - 37% 10% - 12% 23% 8% - 100%

European & Local Area Elections - South 16/05/2014
Page 14Table 4
Q1 Which of these candidates would you give your second preference vote to in the European Parliament Election? - Second Preference Vote
Base : All Irish Adults 18+All South voters excluding undecided
Total Q1 Which of these candidates would you give your first preference vote to in the European Parliament Election? - First Preference Vote
Richard Cahill, Independent
Deirdre Clune, Fine Gael
Brian Crowley,Fianna Fail
Jillian Godsil, Independent
Simon Harris, Fine Gael
Kieran Hartley, Fianna Fail
Theresa Heaney, Catholic Democrats (The National Party)
Sean Kelly, Fine Gael
Liadh Ní Riada, Sinn Fein
DiarmuidPatrick O'Flynn, Independent
Peter O'Loughlin
, Independent
Grace O'Sullivan,Green Party
Phil Prendergast,
Labour Party
Jan Van De Ven, Direct Democracy
Ireland
Total 350 8 35 122 6 27 2 3 58 49 5 4 10 18 3
100% 100% 100% 100% 100% 100% 100% 100% 100% 100% 100% 100% 100% 100% 100%
WTD Base: 350 8 35 122 6 27 2 3 58 49 5 4 10 18 3
UNWTD 367 7 35 127 6 23 4 4 66 48 7 6 14 17 3
Diarmuid Patrick O'Flynn, Independent
6 - - 1 - - - - - 5 - - 0 - -
2% - - 1% - - - - - 9% - - 5% - -
Peter O'Loughlin, Independent
5 1 - 1 2 - - - - 1 - - - - -
1% 16% - 0% 33% - - - - 2% - - - - -
Grace O'Sullivan, Green Party
7 - 0 4 - 1 - - 1 1 1 - - - -
2% - 1% 3% - 4% - - 1% 1% 15% - - - -
Phil Prendergast, Labour Party
21 - 4 10 - 2 - - 5 1 - - - - -
6% - 11% 8% - 6% - - 8% 2% - - - - -
Jan Van De Ven, Direct Democracy Ireland
2 - - - - - - - 2 - - - - - -
1% - - - - - - - 3% - - - - - -
Undecided / No Second Preference
107 - 1 44 1 14 1 - 9 23 1 1 5 7 -
31% - 4% 36% 19% 51% 55% - 15% 47% 27% 26% 50% 36% -

European & Local Area Elections - South 16/05/2014
Page 15Table 5
Q2 To which party or independent candidate would you give your first preference vote in the local elections?
Base : All Irish Adults 18+
Total Gender Age Class Area Region Core Party Support (Unadjusted)
Male Female 18-34 35-54 55+ ABC1F C2DE Urban Rural CORK, KERRY
CLARE, LIMERICK,
TIPPERARY
CARLOW,
KILKENNY,
WATERFORD, WEXFORD,
WICKLOW
Fianna Fail
Fine Gael
Labour Green Party
Sinn Fein
Indep/Others
Would not/DK
Total 511 252 259 181 182 148 247 264 245 266 206 145 160 95 89 27 4 68 74 153
100% 100% 100% 100% 100% 100% 100% 100% 100% 100% 100% 100% 100% 100% 100% 100% 100% 100% 100% 100%
WTD Base: 511 252 259 181 182 148 247 264 245 266 206 145 160 95 89 27 4 68 74 153
UNWTD 511 264 247 133 208 170 280 231 313 198 198 134 179 94 106 26 5 68 83 128
Fianna Fail 85 49 36 28 31 26 39 47 35 50 34 22 30 63 7 1 - 1 5 8
17% 20% 14% 16% 17% 17% 16% 18% 14% 19% 16% 15% 19% 67% 8% 3% - 2% 6% 5%
Fine Gael 108 51 57 37 40 31 67 41 37 71 40 39 29 8 69 3 1 8 7 13
21% 20% 22% 20% 22% 21% 27% 15% 15% 27% 19% 27% 18% 9% 77% 12% 20% 12% 9% 8%
Labour 28 12 16 12 7 9 12 17 18 10 11 6 11 1 0 18 - 2 1 6
6% 5% 6% 7% 4% 6% 5% 6% 7% 4% 5% 4% 7% 1% 1% 67% - 3% 2% 4%
Green Party 4 1 3 1 3 0 2 2 3 1 3 - 2 - 1 - 2 - 1 -
1% 1% 1% 0% 2% 0% 1% 1% 1% 0% 1% - 1% - 1% - 46% - 1% -
Workers Party 1 - 1 - 1 - - 1 1 - 1 - - - - - - - - -
0% - 0% - 0% - - 0% 0% - 0% - - - - - - - - -
Sinn Fein 54 35 19 11 20 22 27 27 27 27 26 10 18 2 1 1 - 40 4 6
10% 14% 7% 6% 11% 15% 11% 10% 11% 10% 13% 7% 11% 2% 1% 4% - 58% 5% 4%
Independent 96 44 52 34 38 24 40 56 54 42 36 22 38 6 5 1 1 12 47 24
19% 18% 20% 19% 21% 16% 16% 21% 22% 16% 17% 15% 24% 6% 6% 4% 34% 18% 63% 15%
Other 7 4 3 4 1 2 4 3 3 4 2 3 2 3 - 0 - - 2 2
1% 2% 1% 2% 0% 2% 2% 1% 1% 2% 1% 2% 1% 3% - 1% - - 2% 1%

European & Local Area Elections - South 16/05/2014
Page 16Table 5
Q2 To which party or independent candidate would you give your first preference vote in the local elections?
Base : All Irish Adults 18+
Total Gender Age Class Area Region Core Party Support (Unadjusted)
Male Female 18-34 35-54 55+ ABC1F C2DE Urban Rural CORK, KERRY
CLARE, LIMERICK,
TIPPERARY
CARLOW,
KILKENNY,
WATERFORD, WEXFORD,
WICKLOW
Fianna Fail
Fine Gael
Labour Green Party
Sinn Fein
Indep/Others
Would not/DK
Total 511 252 259 181 182 148 247 264 245 266 206 145 160 95 89 27 4 68 74 153
100% 100% 100% 100% 100% 100% 100% 100% 100% 100% 100% 100% 100% 100% 100% 100% 100% 100% 100% 100%
WTD Base: 511 252 259 181 182 148 247 264 245 266 206 145 160 95 89 27 4 68 74 153
UNWTD 511 264 247 133 208 170 280 231 313 198 198 134 179 94 106 26 5 68 83 128
Don't Know / Will not vote
128 55 73 53 42 33 58 70 66 62 55 44 29 12 5 2 - 5 8 95
25% 22% 28% 29% 23% 22% 23% 27% 27% 23% 27% 30% 18% 12% 6% 9% - 8% 11% 62%

European & Local Area Elections - South 16/05/2014
Page 17Table 5
Q2 To which party or independent candidate would you give your first preference vote in the local elections?
Base : All Irish Adults 18+
Total Local election Support (Unadjusted)
Fianna Fail
Fine Gael
Labour Green Party
Sinn Fein
Independent/Others
Will Not / DK
Total 511 85 108 28 4 54 103 128
100% 100% 100% 100% 100% 100% 100% 100%
WTD Base: 511 85 108 28 4 54 103 128
UNWTD 511 89 114 26 6 52 106 117
Fianna Fail 85 85 - - - - - -
17% 100% - - - - - -
Fine Gael 108 - 108 - - - - -
21% - 100% - - - - -
Labour 28 - - 28 - - - -
6% - - 100% - - - -
Green Party 4 - - - 4 - - -
1% - - - 100% - - -
Workers Party 1 - - - - - - -
0% - - - - - - -
Sinn Fein 54 - - - - 54 - -
10% - - - - 100% - -
Independent 96 - - - - - 96 -
19% - - - - - 93% -
Other 7 - - - - - 7 -
1% - - - - - 7% -

European & Local Area Elections - South 16/05/2014
Page 18Table 5
Q2 To which party or independent candidate would you give your first preference vote in the local elections?
Base : All Irish Adults 18+
Total Local election Support (Unadjusted)
Fianna Fail
Fine Gael
Labour Green Party
Sinn Fein
Independent/Others
Will Not / DK
Total 511 85 108 28 4 54 103 128
100% 100% 100% 100% 100% 100% 100% 100%
WTD Base: 511 85 108 28 4 54 103 128
UNWTD 511 89 114 26 6 52 106 117
Don't Know / Will not vote
128 - - - - - - 128
25% - - - - - - 100%

European & Local Area Elections - South 16/05/2014
Page 19Table 6
Q2 To which party or independent candidate would you give your first preference vote in the local elections?
Base : All Irish Adults 18+All voters excluding undecided (Local elections)
Total Gender Age Class Area Region Core Party Support (Unadjusted)
Male Female 18-34 35-54 55+ ABC1F C2DE Urban Rural CORK, KERRY
CLARE, LIMERICK,
TIPPERARY
CARLOW,
KILKENNY,
WATERFORD, WEXFORD,
WICKLOW
Fianna Fail
Fine Gael
Labour Green Party
Sinn Fein
Indep/Others
Would not/DK
Total 383 197 186 128 140 115 190 193 179 204 152 101 130 83 83 25 4 63 66 58
100% 100% 100% 100% 100% 100% 100% 100% 100% 100% 100% 100% 100% 100% 100% 100% 100% 100% 100% 100%
WTD Base: 383 197 186 128 140 115 190 193 179 204 152 101 130 83 83 25 4 63 66 58
UNWTD 394 213 181 92 163 139 218 176 239 155 143 103 148 83 98 24 5 61 73 49
Fianna Fail 85 49 36 28 31 26 39 47 35 50 34 22 30 63 7 1 - 1 5 8
22% 25% 19% 22% 22% 22% 20% 24% 20% 24% 22% 22% 23% 76% 9% 3% - 2% 7% 14%
Fine Gael 108 51 57 37 40 31 67 41 37 71 40 39 29 8 69 3 1 8 7 13
28% 26% 30% 29% 28% 27% 35% 21% 21% 35% 26% 39% 22% 10% 82% 13% 20% 12% 10% 22%
Labour 28 12 16 12 7 9 12 17 18 10 11 6 11 1 0 18 - 2 1 6
7% 6% 8% 10% 5% 8% 6% 9% 10% 5% 7% 6% 9% 1% 1% 73% - 3% 2% 10%
Green Party 4 1 3 1 3 0 2 2 3 1 3 - 2 - 1 - 2 - 1 -
1% 1% 2% 1% 2% 0% 1% 1% 2% 0% 2% - 1% - 1% - 46% - 2% -
Workers Party 1 - 1 - 1 - - 1 1 - 1 - - - - - - - - -
0% - 0% - 0% - - 0% 0% - 0% - - - - - - - - -
Sinn Fein 54 35 19 11 20 22 27 27 27 27 26 10 18 2 1 1 - 40 4 6
14% 18% 10% 9% 14% 19% 14% 14% 15% 13% 17% 10% 14% 3% 1% 5% - 63% 6% 11%
Independent 96 44 52 34 38 24 40 56 54 42 36 22 38 6 5 1 1 12 47 24
25% 23% 28% 27% 27% 21% 21% 29% 30% 20% 24% 21% 29% 7% 6% 4% 34% 19% 71% 41%
Other 7 4 3 4 1 2 4 3 3 4 2 3 2 3 - 0 - - 2 2
2% 2% 2% 3% 1% 2% 2% 2% 2% 2% 1% 3% 2% 4% - 2% - - 2% 3%

European & Local Area Elections - South 16/05/2014
Page 20Table 6
Q2 To which party or independent candidate would you give your first preference vote in the local elections?
Base : All Irish Adults 18+All voters excluding undecided (Local elections)
Total Local election Support (Unadjusted)
Fianna Fail
Fine Gael
Labour Green Party
Sinn Fein
Independent/Others
Total 383 85 108 28 4 54 103
100% 100% 100% 100% 100% 100% 100%
WTD Base: 383 85 108 28 4 54 103
UNWTD 394 89 114 26 6 52 106
Fianna Fail 85 85 - - - - -
22% 100% - - - - -
Fine Gael 108 - 108 - - - -
28% - 100% - - - -
Labour 28 - - 28 - - -
7% - - 100% - - -
Green Party 4 - - - 4 - -
1% - - - 100% - -
Workers Party 1 - - - - - -
0% - - - - - -
Sinn Fein 54 - - - - 54 -
14% - - - - 100% -
Independent 96 - - - - - 96
25% - - - - - 93%
Other 7 - - - - - 7
2% - - - - - 7%

European & Local Area Elections - South 16/05/2014
Page 21Table 7
Q3 If there was a General Election tomorrow, to which party or independent candidate would you give your first preference vote?
Base : All Irish Adults 18+
Total Gender Age Class Area Region Core Party Support (Unadjusted)
Male Female 18-34 35-54 55+ ABC1F C2DE Urban Rural CORK, KERRY
CLARE, LIMERICK,
TIPPERARY
CARLOW,
KILKENNY,
WATERFORD, WEXFORD,
WICKLOW
Fianna Fail
Fine Gael
Labour Green Party
Sinn Fein
Indep/Others
Would not/DK
Total 511 252 259 181 182 148 247 264 245 266 206 145 160 95 89 27 4 68 74 153
100% 100% 100% 100% 100% 100% 100% 100% 100% 100% 100% 100% 100% 100% 100% 100% 100% 100% 100% 100%
WTD Base: 511 252 259 181 182 148 247 264 245 266 206 145 160 95 89 27 4 68 74 153
UNWTD 511 264 247 133 208 170 280 231 313 198 198 134 179 94 106 26 5 68 83 128
Fianna Fail 95 49 46 36 29 30 41 54 37 58 37 28 30 95 - - - - - -
19% 19% 18% 20% 16% 20% 17% 20% 15% 22% 18% 20% 19% 100% - - - - - -
Fine Gael 89 46 43 24 39 26 59 29 41 48 35 26 28 - 89 - - - - -
17% 18% 17% 13% 21% 17% 24% 11% 17% 18% 17% 18% 17% - 100% - - - - -
Labour 27 10 17 15 3 9 12 15 18 10 18 2 7 - - 27 - - - -
5% 4% 7% 8% 2% 6% 5% 6% 7% 4% 9% 2% 4% - - 100% - - - -
Green Party 4 2 2 1 3 - 2 2 3 1 1 - 3 - - - 4 - - -
1% 1% 1% 1% 1% - 1% 1% 1% 0% 1% - 2% - - - 100% - - -
Workers Party 1 - 1 - 1 - - 1 1 - 1 - - - - - - - - -
0% - 0% - 0% - - 0% 0% - 0% - - - - - - - - -
Sinn Fein 68 43 25 17 29 22 28 40 33 35 27 19 22 - - - - 68 - -
13% 17% 10% 9% 16% 15% 11% 15% 14% 13% 13% 13% 14% - - - - 100% - -
Independent 67 36 31 23 25 19 36 30 39 28 19 22 26 - - - - - 67 -
13% 14% 12% 13% 14% 12% 15% 11% 16% 10% 9% 16% 16% - - - - - 90% -
Other 8 2 6 3 2 2 4 4 4 4 2 1 4 - - - - - 8 -
1% 1% 2% 2% 1% 1% 1% 1% 2% 1% 1% 1% 2% - - - - - 10% -

European & Local Area Elections - South 16/05/2014
Page 22Table 7
Q3 If there was a General Election tomorrow, to which party or independent candidate would you give your first preference vote?
Base : All Irish Adults 18+
Total Gender Age Class Area Region Core Party Support (Unadjusted)
Male Female 18-34 35-54 55+ ABC1F C2DE Urban Rural CORK, KERRY
CLARE, LIMERICK,
TIPPERARY
CARLOW,
KILKENNY,
WATERFORD, WEXFORD,
WICKLOW
Fianna Fail
Fine Gael
Labour Green Party
Sinn Fein
Indep/Others
Would not/DK
Total 511 252 259 181 182 148 247 264 245 266 206 145 160 95 89 27 4 68 74 153
100% 100% 100% 100% 100% 100% 100% 100% 100% 100% 100% 100% 100% 100% 100% 100% 100% 100% 100% 100%
WTD Base: 511 252 259 181 182 148 247 264 245 266 206 145 160 95 89 27 4 68 74 153
UNWTD 511 264 247 133 208 170 280 231 313 198 198 134 179 94 106 26 5 68 83 128
Don't Know / Would not vote
153 65 89 62 50 41 65 89 69 84 67 46 41 - - - - - - 153
30% 26% 34% 34% 28% 28% 26% 34% 28% 32% 32% 32% 26% - - - - - - 100%

European & Local Area Elections - South 16/05/2014
Page 23Table 7
Q3 If there was a General Election tomorrow, to which party or independent candidate would you give your first preference vote?
Base : All Irish Adults 18+
Total Local election Support (Unadjusted)
Fianna Fail
Fine Gael
Labour Green Party
Sinn Fein
Independent/Others
Will Not / DK
Total 511 85 108 28 4 54 103 128
100% 100% 100% 100% 100% 100% 100% 100%
WTD Base: 511 85 108 28 4 54 103 128
UNWTD 511 89 114 26 6 52 106 117
Fianna Fail 95 63 8 1 - 2 9 12
19% 74% 8% 2% - 4% 9% 9%
Fine Gael 89 7 69 0 1 1 5 5
17% 9% 63% 2% 30% 1% 5% 4%
Labour 27 1 3 18 - 1 2 2
5% 1% 3% 65% - 2% 1% 2%
Green Party 4 - 1 - 2 - 1 -
1% - 1% - 45% - 1% -
Workers Party 1 - - - - - - -
0% - - - - - - -
Sinn Fein 68 1 8 2 - 40 12 5
13% 2% 7% 6% - 74% 12% 4%
Independent 67 5 4 1 1 4 45 7
13% 5% 4% 5% 26% 7% 44% 6%
Other 8 - 3 - - - 3 1
1% - 3% - - - 3% 1%

European & Local Area Elections - South 16/05/2014
Page 24Table 7
Q3 If there was a General Election tomorrow, to which party or independent candidate would you give your first preference vote?
Base : All Irish Adults 18+
Total Local election Support (Unadjusted)
Fianna Fail
Fine Gael
Labour Green Party
Sinn Fein
Independent/Others
Will Not / DK
Total 511 85 108 28 4 54 103 128
100% 100% 100% 100% 100% 100% 100% 100%
WTD Base: 511 85 108 28 4 54 103 128
UNWTD 511 89 114 26 6 52 106 117
Don't Know / Would not vote
153 8 13 6 - 6 26 95
30% 9% 12% 20% - 12% 25% 74%

European & Local Area Elections - South 16/05/2014
Page 25Table 8
Q3 If there was a General Election tomorrow, to which party or independent candidate would you give your first preference vote?
Base : All Irish Adults 18+All voters excluding undecided (General election)
Total Gender Age Class Area Region Core Party Support (Unadjusted)
Male Female 18-34 35-54 55+ ABC1F C2DE Urban Rural CORK, KERRY
CLARE, LIMERICK,
TIPPERARY
CARLOW,
KILKENNY,
WATERFORD, WEXFORD,
WICKLOW
Fianna Fail
Fine Gael
Labour Green Party
Sinn Fein
Indep/Others
Total 358 188 170 119 132 107 183 175 175 182 140 99 119 95 89 27 4 68 74
100% 100% 100% 100% 100% 100% 100% 100% 100% 100% 100% 100% 100% 100% 100% 100% 100% 100% 100%
WTD Base: 358 188 170 119 132 107 183 175 175 182 140 99 119 95 89 27 4 68 74
UNWTD 383 214 169 85 162 136 215 168 236 147 144 98 141 94 106 26 5 68 83
Fianna Fail 95 49 46 36 29 30 41 54 37 58 37 28 30 95 - - - - -
27% 26% 27% 30% 22% 28% 22% 31% 21% 32% 26% 29% 25% 100% - - - - -
Fine Gael 89 46 43 24 39 26 59 29 41 48 35 26 28 - 89 - - - -
25% 24% 25% 20% 30% 24% 32% 17% 23% 26% 25% 26% 23% - 100% - - - -
Labour 27 10 17 15 3 9 12 15 18 10 18 2 7 - - 27 - - -
8% 6% 10% 13% 3% 9% 7% 9% 10% 5% 13% 2% 6% - - 100% - - -
Green Party 4 2 2 1 3 - 2 2 3 1 1 - 3 - - - 4 - -
1% 1% 1% 1% 2% - 1% 1% 2% 0% 1% - 2% - - - 100% - -
Workers Party 1 - 1 - 1 - - 1 1 - 1 - - - - - - - -
0% - 0% - 0% - - 0% 0% - 0% - - - - - - - -
Sinn Fein 68 43 25 17 29 22 28 40 33 35 27 19 22 - - - - 68 -
19% 23% 15% 14% 22% 20% 15% 23% 19% 19% 19% 19% 18% - - - - 100% -
Independent 67 36 31 23 25 19 36 30 39 28 19 22 26 - - - - - 67
19% 19% 18% 19% 19% 17% 20% 17% 22% 15% 13% 23% 22% - - - - - 90%
Other 8 2 6 3 2 2 4 4 4 4 2 1 4 - - - - - 8
2% 1% 4% 3% 2% 2% 2% 2% 2% 2% 2% 1% 3% - - - - - 10%

European & Local Area Elections - South 16/05/2014
Page 26Table 8
Q3 If there was a General Election tomorrow, to which party or independent candidate would you give your first preference vote?
Base : All Irish Adults 18+All voters excluding undecided (General election)
Total Local election Support (Unadjusted)
Fianna Fail
Fine Gael
Labour Green Party
Sinn Fein
Independent/Others
Will Not / DK
Total 358 77 95 22 4 47 78 33
100% 100% 100% 100% 100% 100% 100% 100%
WTD Base: 358 77 95 22 4 47 78 33
UNWTD 383 80 100 21 6 49 88 38
Fianna Fail 95 63 8 1 - 2 9 12
27% 82% 9% 3% - 4% 12% 35%
Fine Gael 89 7 69 0 1 1 5 5
25% 9% 72% 2% 30% 1% 7% 16%
Labour 27 1 3 18 - 1 2 2
8% 1% 3% 81% - 3% 2% 7%
Green Party 4 - 1 - 2 - 1 -
1% - 1% - 45% - 2% -
Workers Party 1 - - - - - - -
0% - - - - - - -
Sinn Fein 68 1 8 2 - 40 12 5
19% 2% 8% 8% - 84% 15% 16%
Independent 67 5 4 1 1 4 45 7
19% 6% 4% 6% 26% 8% 58% 22%
Other 8 - 3 - - - 3 1
2% - 3% - - - 4% 4%

European & Local Area Elections - South 16/05/2014
Page 27Table 9
Adjusted Party Support : Q3 If there was a General Election tomorrow, to which party or independent candidate would you give your first preference vote?
Base : All voters excluding undecided (General election)Will definitely vote
Total Gender Age Class Area Region Core Party Support (Unadjusted)
Male Female 18-34 35-54 55+ ABC1F C2DE Urban Rural CORK, KERRY
CLARE, LIMERICK,
TIPPERARY
CARLOW,
KILKENNY,
WATERFORD, WEXFORD,
WICKLOW
Fianna Fail
Fine Gael
Labour Green Party
Sinn Fein
Indep/Others
Total 305 177 127 77 139 89 175 129 150 155 112 95 98 66 79 25 3 65 67
100% 100% 100% 100% 100% 100% 100% 100% 100% 100% 100% 100% 100% 100% 100% 100% 100% 100% 100%
WTD Base: 305 177 127 77 139 89 175 129 150 155 112 95 98 66 79 25 3 65 67
UNWTD 307 180 127 52 134 121 183 124 187 120 115 83 109 73 90 19 3 56 65
Fianna Fail 66 41 25 13 30 23 32 34 23 43 24 20 23 66 - - - - -
22% 23% 20% 17% 21% 26% 18% 26% 15% 28% 21% 21% 23% 100% - - - - -
Fine Gael 79 39 39 18 41 20 56 22 30 48 28 24 26 - 79 - - - -
26% 22% 31% 23% 30% 22% 32% 17% 20% 31% 25% 26% 27% - 100% - - - -
Labour 25 12 13 14 4 6 14 11 19 6 19 3 3 - - 25 - - -
8% 7% 10% 18% 3% 7% 8% 9% 13% 4% 17% 3% 3% - - 100% - - -
Green Party 3 2 1 1 2 - 1 1 2 0 0 - 2 - - - 3 - -
1% 1% 1% 1% 1% - 1% 1% 1% 0% 0% - 2% - - - 100% - -
Workers Party 1 - 1 - 1 - - 1 1 - 1 - - - - - - - -
0% - 1% - 1% - - 1% 1% - 1% - - - - - - - -
Sinn Fein 65 44 20 14 32 19 31 34 32 33 24 23 17 - - - - 65 -
21% 25% 16% 18% 23% 21% 17% 26% 21% 21% 22% 24% 18% - - - - 100% -
Independent 64 37 26 16 29 19 41 23 40 24 16 24 24 - - - - - 64
21% 21% 21% 21% 21% 21% 23% 18% 26% 15% 14% 25% 24% - - - - - 95%
Other 4 2 2 1 1 2 1 3 3 0 0 - 3 - - - - - 4
1% 1% 2% 1% 1% 2% 0% 2% 2% 0% 0% - 3% - - - - - 5%

European & Local Area Elections - South 16/05/2014
Page 28Table 9
Adjusted Party Support : Q3 If there was a General Election tomorrow, to which party or independent candidate would you give your first preference vote?
Base : All voters excluding undecided (General election)Will definitely vote
Total Local election Support (Unadjusted)
Fianna Fail
Fine Gael
Labour Green Party
Sinn Fein
Independent/Others
Will Not / DK
Total 305 58 83 20 4 47 69 22
100% 100% 100% 100% 100% 100% 100% 100%
WTD Base: 305 58 83 20 4 47 69 22
UNWTD 307 65 82 14 5 42 73 25
Fianna Fail 66 42 7 - - 4 5 7
22% 73% 8% - - 8% 8% 33%
Fine Gael 79 6 61 0 1 1 5 4
26% 11% 73% 2% 33% 1% 7% 18%
Labour 25 1 3 14 - 1 2 3
8% 2% 4% 70% - 3% 3% 13%
Green Party 3 - - - 2 - 1 -
1% - - - 39% - 1% -
Workers Party 1 - - - - - - -
0% - - - - - - -
Sinn Fein 65 2 8 4 - 37 12 2
21% 4% 10% 19% - 78% 17% 10%
Independent 64 6 3 2 1 4 42 6
21% 11% 3% 9% 29% 9% 60% 26%
Other 4 - 1 - - - 2 -
1% - 2% - - - 3% -

1
National Local Election Voting Intentions – Tabular Report

National Party Support 16/05/2014
Page 1Table 1
Q2 To which party or independent candidate would you give your first preference vote in the local elections?
Base : All Irish Adults 18+
Total Gender Age Class Area Dublin Region Region
Male Female 18-34 35-54 55+ ABC1F C2DE Urban Rural Dun Laoghair
e - Rathdow
n
Dublin City
Council
Fingal South Dublin
CC
CAVAN, DONEGA
L, LEITRIM, LOUTH
, MONAG
HAN
GALWAY, MAYO, ROSCOMMON, SLIGO
KILDARE, LAOIS,LONGFO
RD, MEATH, OFFALY,WESTME
ATH
CORK, KERRY
CLARE, LIMERIC
K, TIPPERA
RY
CARLOW,
KILKENNY,
WATERFORD,
WEXFORD,
WICKLOW
Total 1,545 757 788 526 570 449 734 811 945 600 63 137 128 118 140 177 212 216 175 180
100% 100% 100% 100% 100% 100% 100% 100% 100% 100% 100% 100% 100% 100% 100% 100% 100% 100% 100% 100%
WTD Base: 1,545 757 788 526 570 449 734 811 945 600 63 137 128 118 140 177 212 216 175 180
UNWTD 1,545 741 804 392 628 525 827 718 1,111 434 101 121 179 123 118 182 213 198 134 179
Fianna Fail 257 141 116 75 99 83 112 145 131 126 4 24 17 12 29 36 41 30 30 34
17% 19% 15% 14% 17% 18% 15% 18% 14% 21% 7% 17% 13% 10% 21% 21% 19% 14% 17% 19%
Fine Gael 293 131 163 88 116 89 181 113 139 154 14 20 15 19 22 33 42 45 54 33
19% 17% 21% 17% 20% 20% 25% 14% 15% 26% 21% 14% 12% 16% 16% 19% 20% 21% 31% 18%
Labour 84 35 49 26 27 31 41 43 66 18 8 6 7 7 8 9 7 11 10 12
5% 5% 6% 5% 5% 7% 6% 5% 7% 3% 12% 4% 6% 6% 6% 5% 3% 5% 6% 7%
Green Party 20 10 10 4 10 6 14 6 19 1 7 4 3 - 1 0 1 3 - 2
1% 1% 1% 1% 2% 1% 2% 1% 2% 0% 10% 3% 3% - 0% 0% 0% 1% - 1%
Workers Party 1 - 1 - 1 - - 1 1 - - - - - - - - 1 - -
0% - 0% - 0% - - 0% 0% - - - - - - - - 0% - -
Sinn Fein 199 127 71 68 82 49 82 117 124 75 5 13 21 18 29 10 36 29 14 22
13% 17% 9% 13% 14% 11% 11% 14% 13% 12% 9% 10% 16% 15% 21% 6% 17% 13% 8% 12%
Independent 279 134 145 93 98 88 123 156 183 97 7 21 23 15 26 52 37 35 21 43
18% 18% 18% 18% 17% 20% 17% 19% 19% 16% 11% 15% 18% 13% 19% 29% 18% 16% 12% 24%
Other 35 19 16 13 17 5 14 21 29 6 6 9 7 3 2 1 1 2 2 3
2% 3% 2% 2% 3% 1% 2% 3% 3% 1% 9% 6% 6% 3% 1% 0% 0% 1% 1% 1%
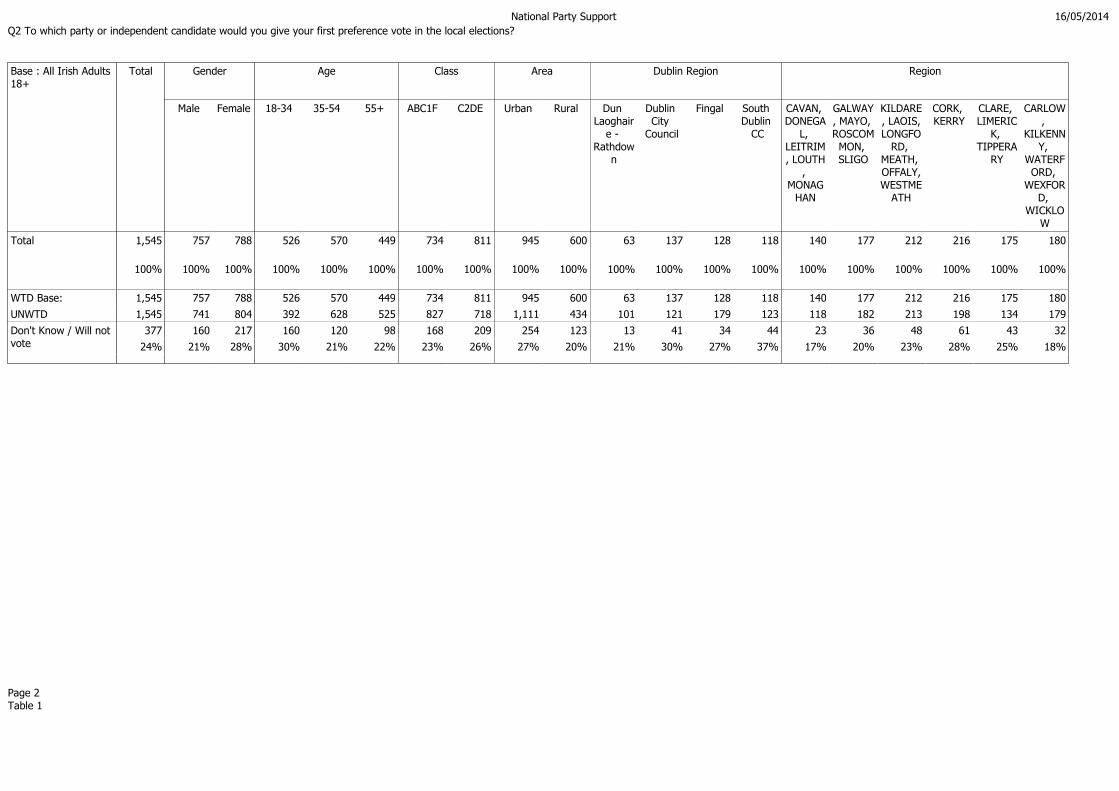
National Party Support 16/05/2014
Page 2Table 1
Q2 To which party or independent candidate would you give your first preference vote in the local elections?
Base : All Irish Adults 18+
Total Gender Age Class Area Dublin Region Region
Male Female 18-34 35-54 55+ ABC1F C2DE Urban Rural Dun Laoghair
e - Rathdow
n
Dublin City
Council
Fingal South Dublin
CC
CAVAN, DONEGA
L, LEITRIM, LOUTH
, MONAG
HAN
GALWAY, MAYO, ROSCOMMON, SLIGO
KILDARE, LAOIS,LONGFO
RD, MEATH, OFFALY,WESTME
ATH
CORK, KERRY
CLARE, LIMERIC
K, TIPPERA
RY
CARLOW,
KILKENNY,
WATERFORD,
WEXFORD,
WICKLOW
Total 1,545 757 788 526 570 449 734 811 945 600 63 137 128 118 140 177 212 216 175 180
100% 100% 100% 100% 100% 100% 100% 100% 100% 100% 100% 100% 100% 100% 100% 100% 100% 100% 100% 100%
WTD Base: 1,545 757 788 526 570 449 734 811 945 600 63 137 128 118 140 177 212 216 175 180
UNWTD 1,545 741 804 392 628 525 827 718 1,111 434 101 121 179 123 118 182 213 198 134 179
Don't Know / Will not vote
377 160 217 160 120 98 168 209 254 123 13 41 34 44 23 36 48 61 43 32
24% 21% 28% 30% 21% 22% 23% 26% 27% 20% 21% 30% 27% 37% 17% 20% 23% 28% 25% 18%

National Party Support 16/05/2014
Page 3Table 1
Q2 To which party or independent candidate would you give your first preference vote in the local elections?
Base : All Irish Adults 18+
Total Likelihood to vote Core Party Support (Unadjusted)
Would Vote
Would definitely vote
Would probably
vote
Might/might
not vote
Would Not Vote
Would probablynot vote
Would definitely not vote
Fianna Fail
Fine Gael
Labour Green Party
Sinn Fein
Indep/Others
Would not/DK
Total 1,545 1,296 1,055 241 72 170 68 102 255 316 79 19 238 253 385
100% 100% 100% 100% 100% 100% 100% 100% 100% 100% 100% 100% 100% 100% 100%
WTD Base: 1,545 1,296 1,055 241 72 170 68 102 255 316 79 19 238 253 385
UNWTD 1,545 1,347 1,143 204 64 131 52 79 246 339 86 29 216 285 343
Fianna Fail 257 233 197 35 9 15 4 11 178 19 2 2 10 12 33
17% 18% 19% 15% 13% 9% 6% 10% 70% 6% 2% 13% 4% 5% 9%
Fine Gael 293 268 215 54 14 9 5 4 10 215 7 1 10 18 33
19% 21% 20% 22% 19% 5% 8% 3% 4% 68% 8% 5% 4% 7% 9%
Labour 84 77 62 16 3 4 1 2 1 7 45 2 8 4 17
5% 6% 6% 7% 4% 2% 2% 2% 0% 2% 56% 13% 4% 1% 5%
Green Party 20 18 16 2 1 0 - 0 1 5 2 8 - 3 2
1% 1% 2% 1% 2% 0% - 0% 0% 2% 2% 42% - 1% 1%
Workers Party 1 1 1 - - - - - - - - - - - -
0% 0% 0% - - - - - - - - - - - -
Sinn Fein 199 176 157 20 5 17 10 7 5 5 2 - 162 11 14
13% 14% 15% 8% 7% 10% 15% 7% 2% 1% 3% - 68% 4% 4%
Independent 279 253 215 37 13 13 10 3 27 25 6 3 26 153 39
18% 19% 20% 16% 18% 8% 15% 3% 11% 8% 7% 17% 11% 60% 10%
Other 35 25 21 4 4 1 - 1 6 2 0 0 3 20 3
2% 2% 2% 1% 6% 1% - 1% 2% 1% 0% 2% 1% 8% 1%

National Party Support 16/05/2014
Page 4Table 1
Q2 To which party or independent candidate would you give your first preference vote in the local elections?
Base : All Irish Adults 18+
Total Likelihood to vote Core Party Support (Unadjusted)
Would Vote
Would definitely vote
Would probably
vote
Might/might
not vote
Would Not Vote
Would probablynot vote
Would definitely not vote
Fianna Fail
Fine Gael
Labour Green Party
Sinn Fein
Indep/Others
Would not/DK
Total 1,545 1,296 1,055 241 72 170 68 102 255 316 79 19 238 253 385
100% 100% 100% 100% 100% 100% 100% 100% 100% 100% 100% 100% 100% 100% 100%
WTD Base: 1,545 1,296 1,055 241 72 170 68 102 255 316 79 19 238 253 385
UNWTD 1,545 1,347 1,143 204 64 131 52 79 246 339 86 29 216 285 343
Don't Know / Will not vote
377 244 171 73 22 110 37 74 26 38 16 2 18 33 243
24% 19% 16% 30% 30% 65% 54% 72% 10% 12% 20% 8% 8% 13% 63%
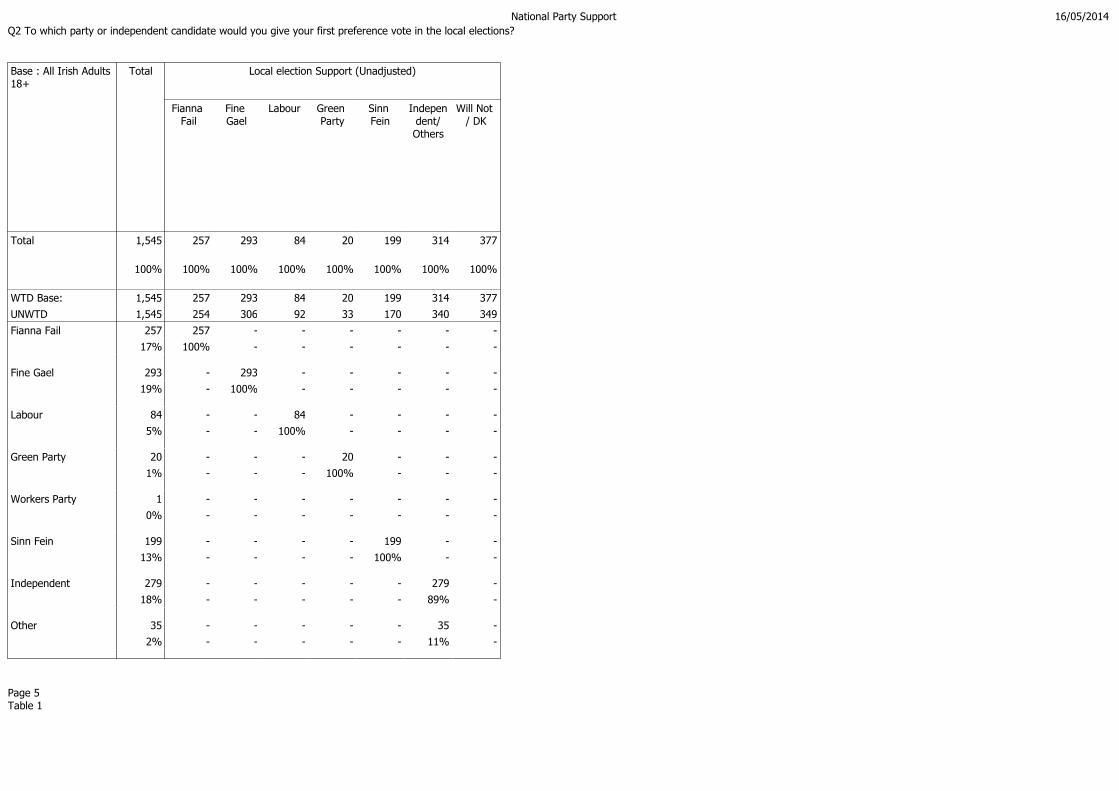
National Party Support 16/05/2014
Page 5Table 1
Q2 To which party or independent candidate would you give your first preference vote in the local elections?
Base : All Irish Adults 18+
Total Local election Support (Unadjusted)
Fianna Fail
Fine Gael
Labour Green Party
Sinn Fein
Independent/Others
Will Not / DK
Total 1,545 257 293 84 20 199 314 377
100% 100% 100% 100% 100% 100% 100% 100%
WTD Base: 1,545 257 293 84 20 199 314 377
UNWTD 1,545 254 306 92 33 170 340 349
Fianna Fail 257 257 - - - - - -
17% 100% - - - - - -
Fine Gael 293 - 293 - - - - -
19% - 100% - - - - -
Labour 84 - - 84 - - - -
5% - - 100% - - - -
Green Party 20 - - - 20 - - -
1% - - - 100% - - -
Workers Party 1 - - - - - - -
0% - - - - - - -
Sinn Fein 199 - - - - 199 - -
13% - - - - 100% - -
Independent 279 - - - - - 279 -
18% - - - - - 89% -
Other 35 - - - - - 35 -
2% - - - - - 11% -

National Party Support 16/05/2014
Page 6Table 1
Q2 To which party or independent candidate would you give your first preference vote in the local elections?
Base : All Irish Adults 18+
Total Local election Support (Unadjusted)
Fianna Fail
Fine Gael
Labour Green Party
Sinn Fein
Independent/Others
Will Not / DK
Total 1,545 257 293 84 20 199 314 377
100% 100% 100% 100% 100% 100% 100% 100%
WTD Base: 1,545 257 293 84 20 199 314 377
UNWTD 1,545 254 306 92 33 170 340 349
Don't Know / Will not vote
377 - - - - - - 377
24% - - - - - - 100%

National Party Support 16/05/2014
Page 7Table 2
Q2 To which party or independent candidate would you give your first preference vote in the local elections?
Base : All Irish Adults 18+All voters excluding undecided (Local elections)
Total Gender Age Class Area Dublin Region Region
Male Female 18-34 35-54 55+ ABC1F C2DE Urban Rural Dun Laoghair
e - Rathdow
n
Dublin City
Council
Fingal South Dublin
CC
CAVAN, DONEGA
L, LEITRIM, LOUTH
, MONAG
HAN
GALWAY, MAYO, ROSCOMMON, SLIGO
KILDARE, LAOIS,LONGFO
RD, MEATH, OFFALY,WESTME
ATH
CORK, KERRY
CLARE, LIMERIC
K, TIPPERA
RY
CARLOW,
KILKENNY,
WATERFORD,
WEXFORD,
WICKLOW
Total 1,168 597 571 367 450 351 566 601 691 477 50 97 94 74 117 141 164 155 132 148
100% 100% 100% 100% 100% 100% 100% 100% 100% 100% 100% 100% 100% 100% 100% 100% 100% 100% 100% 100%
WTD Base: 1,168 597 571 367 450 351 566 601 691 477 50 97 94 74 117 141 164 155 132 148
UNWTD 1,196 600 596 264 501 431 651 545 848 348 80 88 138 84 98 145 173 143 103 148
Fianna Fail 257 141 116 75 99 83 112 145 131 126 4 24 17 12 29 36 41 30 30 34
22% 24% 20% 20% 22% 24% 20% 24% 19% 26% 8% 25% 18% 16% 25% 26% 25% 19% 23% 23%
Fine Gael 293 131 163 88 116 89 181 113 139 154 14 20 15 19 22 33 42 45 54 33
25% 22% 28% 24% 26% 25% 32% 19% 20% 32% 27% 20% 16% 26% 19% 23% 26% 29% 41% 22%
Labour 84 35 49 26 27 31 41 43 66 18 8 6 7 7 8 9 7 11 10 12
7% 6% 9% 7% 6% 9% 7% 7% 10% 4% 15% 6% 8% 9% 7% 6% 4% 7% 7% 8%
Green Party 20 10 10 4 10 6 14 6 19 1 7 4 3 - 1 0 1 3 - 2
2% 2% 2% 1% 2% 2% 2% 1% 3% 0% 13% 4% 4% - 0% 0% 0% 2% - 1%
Workers Party 1 - 1 - 1 - - 1 1 - - - - - - - - 1 - -
0% - 0% - 0% - - 0% 0% - - - - - - - - 1% - -
Sinn Fein 199 127 71 68 82 49 82 117 124 75 5 13 21 18 29 10 36 29 14 22
17% 21% 13% 18% 18% 14% 14% 19% 18% 16% 11% 14% 23% 24% 25% 7% 22% 19% 11% 15%
Independent 279 134 145 93 98 88 123 156 183 97 7 21 23 15 26 52 37 35 21 43
24% 23% 25% 25% 22% 25% 22% 26% 26% 20% 14% 22% 24% 20% 22% 37% 23% 22% 16% 29%
Other 35 19 16 13 17 5 14 21 29 6 6 9 7 3 2 1 1 2 2 3
3% 3% 3% 3% 4% 2% 2% 4% 4% 1% 12% 9% 8% 4% 2% 0% 0% 2% 2% 2%

National Party Support 16/05/2014
Page 8Table 2
Q2 To which party or independent candidate would you give your first preference vote in the local elections?
Base : All Irish Adults 18+All voters excluding undecided (Local elections)
Total Likelihood to vote Core Party Support (Unadjusted)
Would Vote
Would definitely vote
Would probably
vote
Might/might
not vote
Would Not Vote
Would probablynot vote
Would definitely not vote
Fianna Fail
Fine Gael
Labour Green Party
Sinn Fein
Indep/Others
Would not/DK
Total 1,168 1,051 884 167 50 59 31 28 228 278 63 17 219 220 142
100% 100% 100% 100% 100% 100% 100% 100% 100% 100% 100% 100% 100% 100% 100%
WTD Base: 1,168 1,051 884 167 50 59 31 28 228 278 63 17 219 220 142
UNWTD 1,196 1,103 962 141 41 50 23 27 223 299 72 27 195 244 135
Fianna Fail 257 233 197 35 9 15 4 11 178 19 2 2 10 12 33
22% 22% 22% 21% 19% 25% 13% 38% 78% 7% 3% 14% 4% 5% 24%
Fine Gael 293 268 215 54 14 9 5 4 10 215 7 1 10 18 33
25% 26% 24% 32% 28% 15% 17% 12% 4% 77% 10% 6% 5% 8% 23%
Labour 84 77 62 16 3 4 1 2 1 7 45 2 8 4 17
7% 7% 7% 9% 6% 6% 4% 8% 1% 2% 71% 14% 4% 2% 12%
Green Party 20 18 16 2 1 0 - 0 1 5 2 8 - 3 2
2% 2% 2% 1% 2% 0% - 1% 0% 2% 2% 45% - 1% 1%
Workers Party 1 1 1 - - - - - - - - - - - -
0% 0% 0% - - - - - - - - - - - -
Sinn Fein 199 176 157 20 5 17 10 7 5 5 2 - 162 11 14
17% 17% 18% 12% 10% 29% 33% 24% 2% 2% 4% - 74% 5% 10%
Independent 279 253 215 37 13 13 10 3 27 25 6 3 26 153 39
24% 24% 24% 22% 26% 22% 33% 11% 12% 9% 9% 18% 12% 70% 28%
Other 35 25 21 4 4 1 - 1 6 2 0 0 3 20 3
3% 2% 2% 2% 8% 2% - 5% 3% 1% 1% 2% 2% 9% 2%

National Party Support 16/05/2014
Page 9Table 2
Q2 To which party or independent candidate would you give your first preference vote in the local elections?
Base : All Irish Adults 18+All voters excluding undecided (Local elections)
Total Local election Support (Unadjusted)
Fianna Fail
Fine Gael
Labour Green Party
Sinn Fein
Independent/Others
Total 1,168 257 293 84 20 199 314
100% 100% 100% 100% 100% 100% 100%
WTD Base: 1,168 257 293 84 20 199 314
UNWTD 1,196 254 306 92 33 170 340
Fianna Fail 257 257 - - - - -
22% 100% - - - - -
Fine Gael 293 - 293 - - - -
25% - 100% - - - -
Labour 84 - - 84 - - -
7% - - 100% - - -
Green Party 20 - - - 20 - -
2% - - - 100% - -
Workers Party 1 - - - - - -
0% - - - - - -
Sinn Fein 199 - - - - 199 -
17% - - - - 100% -
Independent 279 - - - - - 279
24% - - - - - 89%
Other 35 - - - - - 35
3% - - - - - 11%

1
National General Election Voting Intentions Tabular Report

National Party Support 16/05/2014
Page 10Table 3
Q3 If there was a General Election tomorrow, to which party or independent candidate would you give your first preference vote?
Base : All Irish Adults 18+
Total Gender Age Class Area Dublin Region Region
Male Female 18-34 35-54 55+ ABC1F C2DE Urban Rural Dun Laoghair
e - Rathdow
n
Dublin City
Council
Fingal South Dublin
CC
CAVAN, DONEGA
L, LEITRIM, LOUTH
, MONAG
HAN
GALWAY, MAYO, ROSCOMMON, SLIGO
KILDARE, LAOIS,LONGFO
RD, MEATH, OFFALY,WESTME
ATH
CORK, KERRY
CLARE, LIMERIC
K, TIPPERA
RY
CARLOW,
KILKENNY,
WATERFORD,
WEXFORD,
WICKLOW
Total 1,545 757 788 526 570 449 734 811 945 600 63 137 128 118 140 177 212 216 175 180
100% 100% 100% 100% 100% 100% 100% 100% 100% 100% 100% 100% 100% 100% 100% 100% 100% 100% 100% 100%
WTD Base: 1,545 757 788 526 570 449 734 811 945 600 63 137 128 118 140 177 212 216 175 180
UNWTD 1,545 741 804 392 628 525 827 718 1,111 434 101 121 179 123 118 182 213 198 134 179
Fianna Fail 255 132 123 79 94 82 113 142 123 132 7 22 13 11 24 43 33 35 33 35
16% 17% 16% 15% 17% 18% 15% 17% 13% 22% 11% 16% 10% 10% 17% 24% 15% 16% 19% 19%
Fine Gael 316 154 163 80 124 112 193 124 182 134 16 23 20 25 25 41 54 39 42 32
20% 20% 21% 15% 22% 25% 26% 15% 19% 22% 26% 17% 16% 21% 18% 23% 26% 18% 24% 18%
Labour 79 27 52 30 17 32 40 39 63 16 5 12 9 9 3 9 6 17 2 7
5% 4% 7% 6% 3% 7% 6% 5% 7% 3% 8% 9% 7% 7% 2% 5% 3% 8% 1% 4%
Green Party 19 7 11 4 9 5 9 10 18 0 3 2 5 - - 0 3 1 - 2
1% 1% 1% 1% 2% 1% 1% 1% 2% 0% 5% 2% 4% - - 0% 1% 1% - 1%
Workers Party 1 - 1 - 1 - - 1 1 - - - - - - - - 1 - -
0% - 0% - 0% - - 0% 0% - - - - - - - - 0% - -
Sinn Fein 238 145 93 79 109 50 89 149 161 77 5 19 29 22 32 15 32 29 28 26
15% 19% 12% 15% 19% 11% 12% 18% 17% 13% 9% 14% 23% 19% 23% 8% 15% 13% 16% 14%
Independent 224 114 110 85 76 63 115 109 141 82 9 22 20 13 23 35 25 19 23 30
14% 15% 14% 16% 13% 14% 16% 13% 15% 14% 14% 16% 16% 11% 17% 20% 12% 9% 13% 17%
Other 30 15 14 13 13 3 11 18 27 3 6 7 4 3 2 - 1 1 1 4
2% 2% 2% 3% 2% 1% 2% 2% 3% 0% 10% 5% 3% 2% 2% - 0% 1% 0% 2%
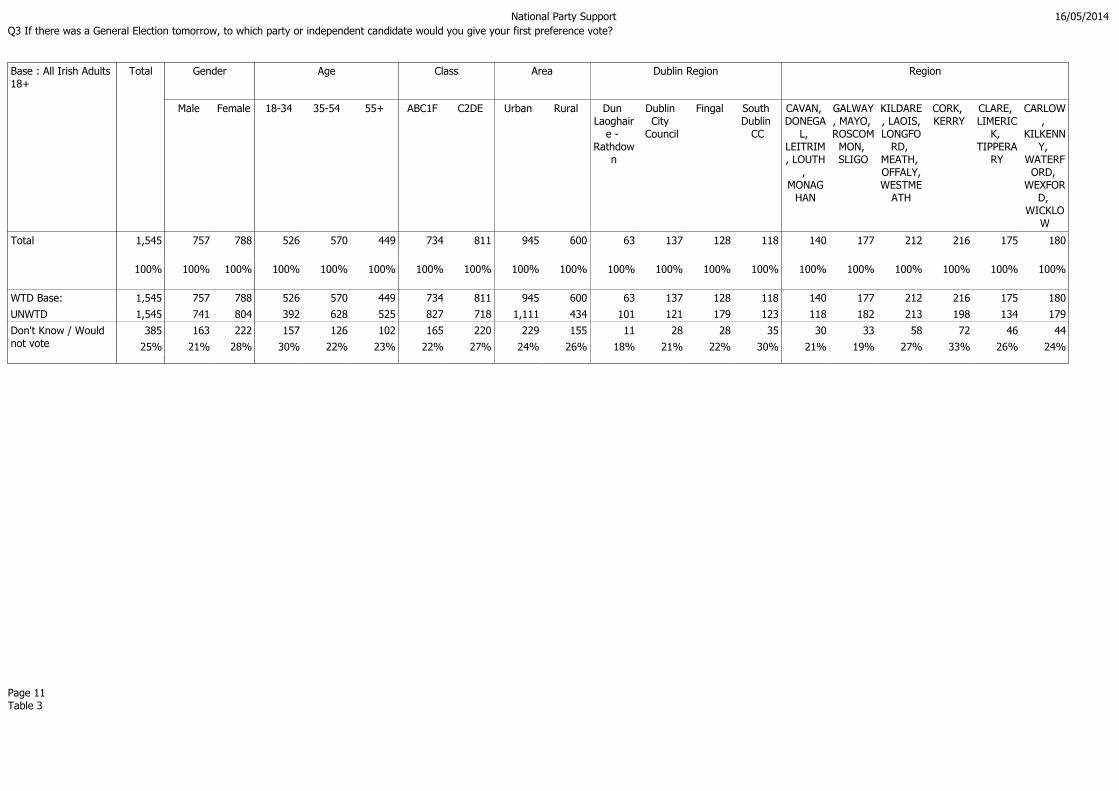
National Party Support 16/05/2014
Page 11Table 3
Q3 If there was a General Election tomorrow, to which party or independent candidate would you give your first preference vote?
Base : All Irish Adults 18+
Total Gender Age Class Area Dublin Region Region
Male Female 18-34 35-54 55+ ABC1F C2DE Urban Rural Dun Laoghair
e - Rathdow
n
Dublin City
Council
Fingal South Dublin
CC
CAVAN, DONEGA
L, LEITRIM, LOUTH
, MONAG
HAN
GALWAY, MAYO, ROSCOMMON, SLIGO
KILDARE, LAOIS,LONGFO
RD, MEATH, OFFALY,WESTME
ATH
CORK, KERRY
CLARE, LIMERIC
K, TIPPERA
RY
CARLOW,
KILKENNY,
WATERFORD,
WEXFORD,
WICKLOW
Total 1,545 757 788 526 570 449 734 811 945 600 63 137 128 118 140 177 212 216 175 180
100% 100% 100% 100% 100% 100% 100% 100% 100% 100% 100% 100% 100% 100% 100% 100% 100% 100% 100% 100%
WTD Base: 1,545 757 788 526 570 449 734 811 945 600 63 137 128 118 140 177 212 216 175 180
UNWTD 1,545 741 804 392 628 525 827 718 1,111 434 101 121 179 123 118 182 213 198 134 179
Don't Know / Would not vote
385 163 222 157 126 102 165 220 229 155 11 28 28 35 30 33 58 72 46 44
25% 21% 28% 30% 22% 23% 22% 27% 24% 26% 18% 21% 22% 30% 21% 19% 27% 33% 26% 24%
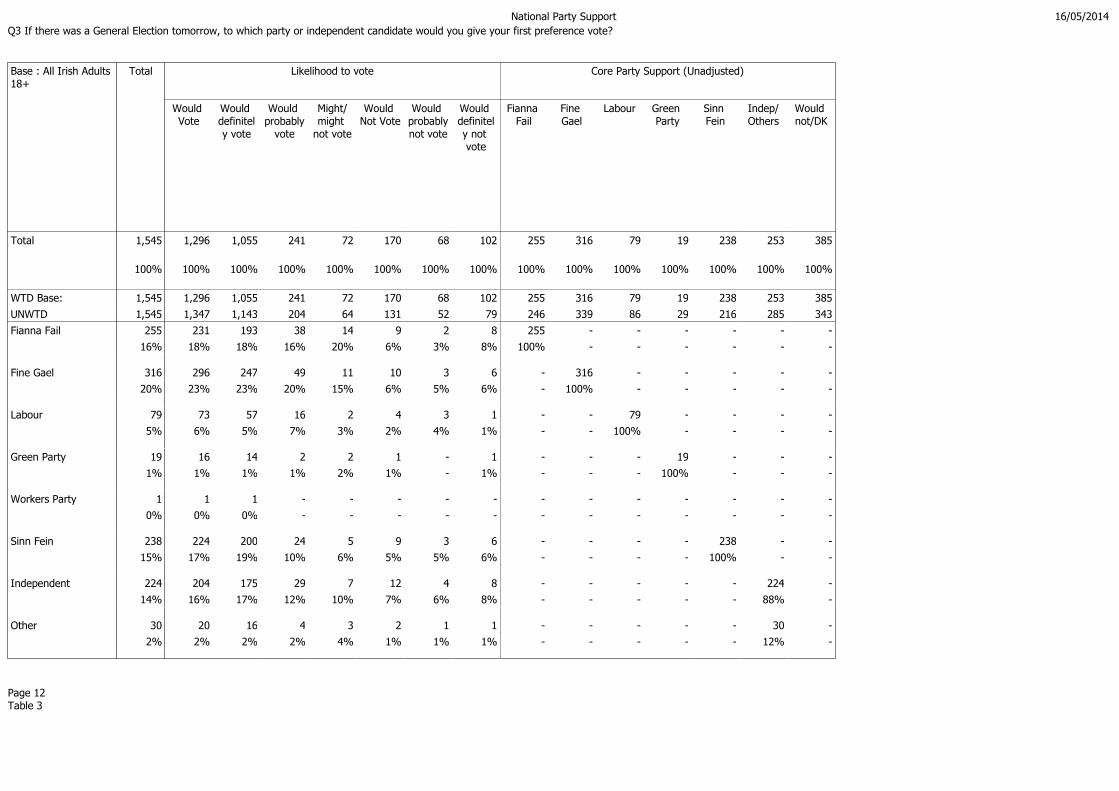
National Party Support 16/05/2014
Page 12Table 3
Q3 If there was a General Election tomorrow, to which party or independent candidate would you give your first preference vote?
Base : All Irish Adults 18+
Total Likelihood to vote Core Party Support (Unadjusted)
Would Vote
Would definitely vote
Would probably
vote
Might/might
not vote
Would Not Vote
Would probablynot vote
Would definitely not vote
Fianna Fail
Fine Gael
Labour Green Party
Sinn Fein
Indep/Others
Would not/DK
Total 1,545 1,296 1,055 241 72 170 68 102 255 316 79 19 238 253 385
100% 100% 100% 100% 100% 100% 100% 100% 100% 100% 100% 100% 100% 100% 100%
WTD Base: 1,545 1,296 1,055 241 72 170 68 102 255 316 79 19 238 253 385
UNWTD 1,545 1,347 1,143 204 64 131 52 79 246 339 86 29 216 285 343
Fianna Fail 255 231 193 38 14 9 2 8 255 - - - - - -
16% 18% 18% 16% 20% 6% 3% 8% 100% - - - - - -
Fine Gael 316 296 247 49 11 10 3 6 - 316 - - - - -
20% 23% 23% 20% 15% 6% 5% 6% - 100% - - - - -
Labour 79 73 57 16 2 4 3 1 - - 79 - - - -
5% 6% 5% 7% 3% 2% 4% 1% - - 100% - - - -
Green Party 19 16 14 2 2 1 - 1 - - - 19 - - -
1% 1% 1% 1% 2% 1% - 1% - - - 100% - - -
Workers Party 1 1 1 - - - - - - - - - - - -
0% 0% 0% - - - - - - - - - - - -
Sinn Fein 238 224 200 24 5 9 3 6 - - - - 238 - -
15% 17% 19% 10% 6% 5% 5% 6% - - - - 100% - -
Independent 224 204 175 29 7 12 4 8 - - - - - 224 -
14% 16% 17% 12% 10% 7% 6% 8% - - - - - 88% -
Other 30 20 16 4 3 2 1 1 - - - - - 30 -
2% 2% 2% 2% 4% 1% 1% 1% - - - - - 12% -

National Party Support 16/05/2014
Page 13Table 3
Q3 If there was a General Election tomorrow, to which party or independent candidate would you give your first preference vote?
Base : All Irish Adults 18+
Total Likelihood to vote Core Party Support (Unadjusted)
Would Vote
Would definitely vote
Would probably
vote
Might/might
not vote
Would Not Vote
Would probablynot vote
Would definitely not vote
Fianna Fail
Fine Gael
Labour Green Party
Sinn Fein
Indep/Others
Would not/DK
Total 1,545 1,296 1,055 241 72 170 68 102 255 316 79 19 238 253 385
100% 100% 100% 100% 100% 100% 100% 100% 100% 100% 100% 100% 100% 100% 100%
WTD Base: 1,545 1,296 1,055 241 72 170 68 102 255 316 79 19 238 253 385
UNWTD 1,545 1,347 1,143 204 64 131 52 79 246 339 86 29 216 285 343
Don't Know / Would not vote
385 231 152 79 28 122 52 70 - - - - - - 385
25% 18% 14% 33% 39% 72% 77% 69% - - - - - - 100%
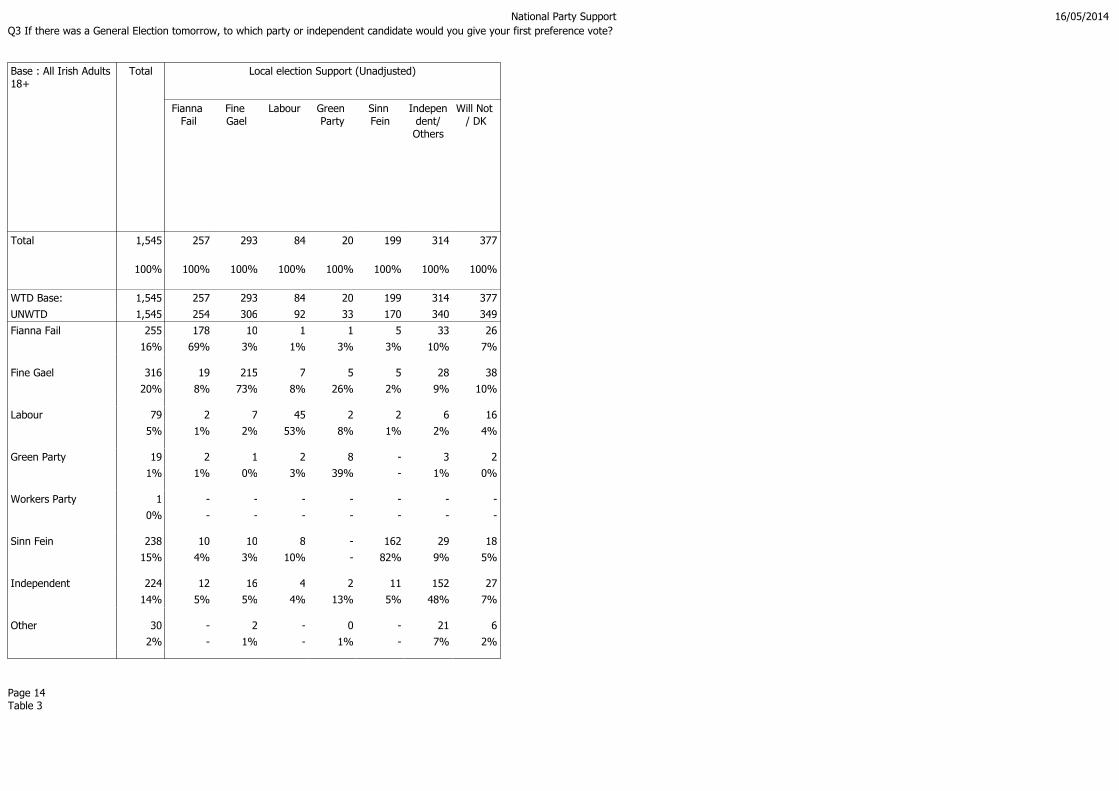
National Party Support 16/05/2014
Page 14Table 3
Q3 If there was a General Election tomorrow, to which party or independent candidate would you give your first preference vote?
Base : All Irish Adults 18+
Total Local election Support (Unadjusted)
Fianna Fail
Fine Gael
Labour Green Party
Sinn Fein
Independent/Others
Will Not / DK
Total 1,545 257 293 84 20 199 314 377
100% 100% 100% 100% 100% 100% 100% 100%
WTD Base: 1,545 257 293 84 20 199 314 377
UNWTD 1,545 254 306 92 33 170 340 349
Fianna Fail 255 178 10 1 1 5 33 26
16% 69% 3% 1% 3% 3% 10% 7%
Fine Gael 316 19 215 7 5 5 28 38
20% 8% 73% 8% 26% 2% 9% 10%
Labour 79 2 7 45 2 2 6 16
5% 1% 2% 53% 8% 1% 2% 4%
Green Party 19 2 1 2 8 - 3 2
1% 1% 0% 3% 39% - 1% 0%
Workers Party 1 - - - - - - -
0% - - - - - - -
Sinn Fein 238 10 10 8 - 162 29 18
15% 4% 3% 10% - 82% 9% 5%
Independent 224 12 16 4 2 11 152 27
14% 5% 5% 4% 13% 5% 48% 7%
Other 30 - 2 - 0 - 21 6
2% - 1% - 1% - 7% 2%

National Party Support 16/05/2014
Page 15Table 3
Q3 If there was a General Election tomorrow, to which party or independent candidate would you give your first preference vote?
Base : All Irish Adults 18+
Total Local election Support (Unadjusted)
Fianna Fail
Fine Gael
Labour Green Party
Sinn Fein
Independent/Others
Will Not / DK
Total 1,545 257 293 84 20 199 314 377
100% 100% 100% 100% 100% 100% 100% 100%
WTD Base: 1,545 257 293 84 20 199 314 377
UNWTD 1,545 254 306 92 33 170 340 349
Don't Know / Would not vote
385 33 33 17 2 14 42 243
25% 13% 11% 21% 11% 7% 13% 64%

National Party Support 16/05/2014
Page 16Table 4
Q3 If there was a General Election tomorrow, to which party or independent candidate would you give your first preference vote?
Base : All Irish Adults 18+All voters excluding undecided (General election)
Total Gender Age Class Area Dublin Region Region
Male Female 18-34 35-54 55+ ABC1F C2DE Urban Rural Dun Laoghair
e - Rathdow
n
Dublin City
Council
Fingal South Dublin
CC
CAVAN, DONEGA
L, LEITRIM, LOUTH
, MONAG
HAN
GALWAY, MAYO, ROSCOMMON, SLIGO
KILDARE, LAOIS,LONGFO
RD, MEATH, OFFALY,WESTME
ATH
CORK, KERRY
CLARE, LIMERIC
K, TIPPERA
RY
CARLOW,
KILKENNY,
WATERFORD,
WEXFORD,
WICKLOW
Total 1,160 594 566 369 444 347 570 591 716 445 52 109 100 83 110 143 154 144 129 136
100% 100% 100% 100% 100% 100% 100% 100% 100% 100% 100% 100% 100% 100% 100% 100% 100% 100% 100% 100%
WTD Base: 1,160 594 566 369 444 347 570 591 716 445 52 109 100 83 110 143 154 144 129 136
UNWTD 1,202 617 585 274 500 428 663 539 868 334 82 93 145 99 94 147 161 144 98 141
Fianna Fail 255 132 123 79 94 82 113 142 123 132 7 22 13 11 24 43 33 35 33 35
22% 22% 22% 21% 21% 23% 20% 24% 17% 30% 13% 20% 13% 14% 22% 30% 21% 25% 25% 25%
Fine Gael 316 154 163 80 124 112 193 124 182 134 16 23 20 25 25 41 54 39 42 32
27% 26% 29% 22% 28% 32% 34% 21% 25% 30% 31% 21% 20% 30% 23% 28% 35% 27% 32% 24%
Labour 79 27 52 30 17 32 40 39 63 16 5 12 9 9 3 9 6 17 2 7
7% 5% 9% 8% 4% 9% 7% 7% 9% 4% 10% 11% 9% 11% 3% 6% 4% 12% 2% 5%
Green Party 19 7 11 4 9 5 9 10 18 0 3 2 5 - - 0 3 1 - 2
2% 1% 2% 1% 2% 2% 2% 2% 3% 0% 6% 2% 5% - - 0% 2% 1% - 2%
Workers Party 1 - 1 - 1 - - 1 1 - - - - - - - - 1 - -
0% - 0% - 0% - - 0% 0% - - - - - - - - 1% - -
Sinn Fein 238 145 93 79 109 50 89 149 161 77 5 19 29 22 32 15 32 29 28 26
20% 24% 16% 21% 25% 14% 16% 25% 22% 17% 10% 18% 29% 26% 30% 10% 21% 20% 22% 19%
Independent 224 114 110 85 76 63 115 109 141 82 9 22 20 13 23 35 25 19 23 30
19% 19% 19% 23% 17% 18% 20% 18% 20% 19% 17% 21% 20% 16% 21% 25% 16% 13% 18% 22%
Other 30 15 14 13 13 3 11 18 27 3 6 7 4 3 2 - 1 1 1 4
3% 3% 3% 4% 3% 1% 2% 3% 4% 1% 12% 7% 4% 3% 2% - 1% 1% 0% 3%

National Party Support 16/05/2014
Page 17Table 4
Q3 If there was a General Election tomorrow, to which party or independent candidate would you give your first preference vote?
Base : All Irish Adults 18+All voters excluding undecided (General election)
Total Likelihood to vote Core Party Support (Unadjusted)
Would Vote
Would definitely vote
Would probably
vote
Might/might
not vote
Would Not Vote
Would probablynot vote
Would definitely not vote
Fianna Fail
Fine Gael
Labour Green Party
Sinn Fein
Indep/Others
Total 1,160 1,065 903 162 44 47 16 31 255 316 79 19 238 253
100% 100% 100% 100% 100% 100% 100% 100% 100% 100% 100% 100% 100% 100%
WTD Base: 1,160 1,065 903 162 44 47 16 31 255 316 79 19 238 253
UNWTD 1,202 1,116 975 141 40 45 18 27 246 339 86 29 216 285
Fianna Fail 255 231 193 38 14 9 2 8 255 - - - - -
22% 22% 21% 23% 33% 20% 11% 24% 100% - - - - -
Fine Gael 316 296 247 49 11 10 3 6 - 316 - - - -
27% 28% 27% 30% 25% 20% 20% 20% - 100% - - - -
Labour 79 73 57 16 2 4 3 1 - - 79 - - -
7% 7% 6% 10% 4% 8% 17% 3% - - 100% - - -
Green Party 19 16 14 2 2 1 - 1 - - - 19 - -
2% 1% 2% 1% 4% 3% - 4% - - - 100% - -
Workers Party 1 1 1 - - - - - - - - - - -
0% 0% 0% - - - - - - - - - - -
Sinn Fein 238 224 200 24 5 9 3 6 - - - - 238 -
20% 21% 22% 15% 10% 19% 21% 18% - - - - 100% -
Independent 224 204 175 29 7 12 4 8 - - - - - 224
19% 19% 19% 18% 17% 25% 27% 25% - - - - - 88%
Other 30 20 16 4 3 2 1 1 - - - - - 30
3% 2% 2% 2% 7% 4% 4% 4% - - - - - 12%

National Party Support 16/05/2014
Page 18Table 4
Q3 If there was a General Election tomorrow, to which party or independent candidate would you give your first preference vote?
Base : All Irish Adults 18+All voters excluding undecided (General election)
Total Local election Support (Unadjusted)
Fianna Fail
Fine Gael
Labour Green Party
Sinn Fein
Independent/Others
Will Not / DK
Total 1,160 224 260 67 18 185 272 134
100% 100% 100% 100% 100% 100% 100% 100%
WTD Base: 1,160 224 260 67 18 185 272 134
UNWTD 1,202 225 270 75 31 163 296 141
Fianna Fail 255 178 10 1 1 5 33 26
22% 80% 4% 2% 3% 3% 12% 20%
Fine Gael 316 19 215 7 5 5 28 38
27% 9% 83% 10% 29% 2% 10% 28%
Labour 79 2 7 45 2 2 6 16
7% 1% 3% 67% 9% 1% 2% 12%
Green Party 19 2 1 2 8 - 3 2
2% 1% 0% 4% 44% - 1% 1%
Workers Party 1 - - - - - - -
0% - - - - - - -
Sinn Fein 238 10 10 8 - 162 29 18
20% 4% 4% 13% - 88% 11% 14%
Independent 224 12 16 4 2 11 152 27
19% 5% 6% 5% 14% 6% 56% 20%
Other 30 - 2 - 0 - 21 6
3% - 1% - 2% - 8% 5%

National Party Support 16/05/2014
Page 19Table 5
Adjusted Party Support : Q3 If there was a General Election tomorrow, to which party or independent candidate would you give your first preference vote?
Base : All voters excluding undecided (General election)Will definitely vote
Total Gender Age Class Area Dublin Region Region
Male Female 18-34 35-54 55+ ABC1F C2DE Urban Rural Dun Laoghair
e - Rathdow
n
Dublin City
Council
Fingal South Dublin
CC
CAVAN, DONEGA
L, LEITRIM, LOUTH
, MONAG
HAN
GALWAY, MAYO, ROSCOMMON, SLIGO
KILDARE, LAOIS,LONGFO
RD, MEATH, OFFALY,WESTME
ATH
CORK, KERRY
CLARE, LIMERIC
K, TIPPERA
RY
CARLOW,
KILKENNY,
WATERFORD,
WEXFORD,
WICKLOW
Total 881 455 426 215 359 307 450 431 552 329 41 84 83 66 84 113 103 112 95 98
100% 100% 100% 100% 100% 100% 100% 100% 100% 100% 100% 100% 100% 100% 100% 100% 100% 100% 100% 100%
WTD Base: 881 455 426 215 359 307 450 431 552 329 41 84 83 66 84 113 103 112 95 98
UNWTD 975 512 463 167 420 388 559 416 708 267 67 78 118 83 77 118 127 115 83 109
Fianna Fail 163 89 74 28 70 66 77 87 81 83 5 15 8 9 14 31 15 24 20 23
19% 20% 17% 13% 19% 21% 17% 20% 15% 25% 12% 18% 10% 14% 16% 27% 15% 21% 21% 23%
Fine Gael 229 107 122 47 91 91 140 89 130 99 10 16 17 19 19 30 40 28 24 26
26% 23% 29% 22% 25% 30% 31% 21% 24% 30% 23% 19% 21% 29% 23% 27% 39% 25% 26% 27%
Labour 66 26 40 20 16 30 34 32 53 12 4 13 6 6 1 6 4 19 3 3
7% 6% 9% 9% 4% 10% 8% 7% 10% 4% 11% 16% 7% 9% 1% 5% 4% 17% 3% 3%
Green Party 22 9 13 4 10 9 11 11 21 0 6 3 3 - - 1 5 0 - 2
2% 2% 3% 2% 3% 3% 2% 2% 4% 0% 14% 3% 3% - - 1% 5% 0% - 2%
Workers Party 1 - 1 - 1 - - 1 1 - - - - - - - - 1 - -
0% - 0% - 0% - - 0% 0% - - - - - - - - 1% - -
Sinn Fein 183 118 65 53 86 44 74 109 117 66 6 13 24 18 27 13 19 24 23 17
21% 26% 15% 24% 24% 14% 16% 25% 21% 20% 13% 15% 28% 27% 32% 11% 18% 22% 24% 18%
Independent 197 99 98 62 73 62 103 94 131 66 7 23 19 13 20 32 18 16 24 24
22% 22% 23% 29% 20% 20% 23% 22% 24% 20% 18% 28% 23% 19% 24% 29% 18% 14% 25% 24%
Other 20 8 12 2 12 5 11 9 18 2 3 1 7 1 4 - 1 0 - 3
2% 2% 3% 1% 3% 2% 2% 2% 3% 1% 8% 1% 8% 2% 4% - 1% 0% - 3%

National Party Support 16/05/2014
Page 20Table 5
Adjusted Party Support : Q3 If there was a General Election tomorrow, to which party or independent candidate would you give your first preference vote?
Base : All voters excluding undecided (General election)Will definitely vote
Total Likelihood to vote Core Party Support (Unadjusted) Local election Support (Unadjusted)
Would Vote
Would definitely vote
Fianna Fail
Fine Gael
Labour Green Party
Sinn Fein
Indep/Others
Fianna Fail
Fine Gael
Labour Green Party
Sinn Fein
Independent/Others
Will Not / DK
Total 881 881 881 163 229 66 22 183 218 154 185 60 20 139 234 89
100% 100% 100% 100% 100% 100% 100% 100% 100% 100% 100% 100% 100% 100% 100% 100%
WTD Base: 881 881 881 163 229 66 22 183 218 154 185 60 20 139 234 89
UNWTD 975 975 975 198 282 62 22 183 227 186 223 59 25 139 246 96
Fianna Fail 163 163 163 163 - - - - - 115 8 0 0 5 21 14
19% 19% 19% 100% - - - - - 74% 4% 0% 2% 4% 9% 16%
Fine Gael 229 229 229 - 229 - - - - 16 150 4 4 4 22 29
26% 26% 26% - 100% - - - - 10% 81% 7% 22% 3% 9% 32%
Labour 66 66 66 - - 66 - - - 3 4 39 2 2 6 10
7% 7% 7% - - 100% - - - 2% 2% 65% 10% 1% 3% 12%
Green Party 22 22 22 - - - 22 - - 1 - 5 10 - 4 1
2% 2% 2% - - - 100% - - 1% - 8% 53% - 2% 1%
Workers Party 1 1 1 - - - - - - - - - - - - -
0% 0% 0% - - - - - - - - - - - - -
Sinn Fein 183 183 183 - - - - 183 - 8 8 7 - 118 30 11
21% 21% 21% - - - - 100% - 5% 4% 12% - 85% 13% 13%
Independent 197 197 197 - - - - - 197 12 14 4 2 9 136 21
22% 22% 22% - - - - - 91% 8% 7% 7% 11% 6% 58% 23%
Other 20 20 20 - - - - - 20 - 1 - 1 - 15 3
2% 2% 2% - - - - - 9% - 1% - 3% - 7% 3%

1
The Questionnaires

BEHAVIOUR & ATTITUDES POLL QUESTIONNAIRE – May 2014
Good Morning/afternoon/evening my name is ………………… (Name) and I am calling from Behaviour and Attitudes, the independent market research company based in Dublin. We are currently conducting a study on a number of issues. The study will take less than 10 minutes to complete.
The interview will be conducted in accordance with Market Research Society guidelines - all results will be shown in aggregate form and for quality control purposes this call may be monitored by a supervisor.
ASK ALL ADULTS 18YRS+
As you are probably aware, The 2014 European Parliament election in Ireland will be held on Friday 23rd May. I am now going to read out a list of the 14 candidates for the European Parliament Election in this constituency. READ OUT LIST IN FULL
Q.1 Which of these candidates would you give your first preference vote to in the European Parliament Election? Read out the list of candidates a second time, after they have given their first preference. And your second preference? CONTINUE TO RESPONDENT’S THIRD, FOURTH, FIFTH PREFERENCE, ALL THE WAY DOWN THE LIST
Thomas Byrne, Fianna Fail
Matt Carthy, Sinn Fein
Mark Dearey, Green Party
T.J. Fay, Independent
Mark Fitzsimons, Independent
Luke ‘Ming’ Flanagan, Independent
Pat The Cope Gallagher, Fianna Fail
Ben Gilroy, Direct Democracy Ireland
Marian Harkin, Independent
Jim Higgins, Fine Gael
Lorainne Higgins, Labour Party
Mairead McGuinness, Fine Gael
Ronan Mullan, Independent
Cordelia Nic Fhearraigh, Fis Nua
Don’t know 1
Would not vote 2
None of these 3
MIDLANDS NORTH WEST CONSTITUENCY J.5607

Q.2 The 2014 Irish local elections will be held in all local government areas of Ireland on Friday, 23 May 2014, on the same day as the European Parliament election. To to which party or independent candidate would you give your first preference vote in the local elections?
Fianna Fail 1
Fine Gael 2
Labour Party 3
Green Party 4
Workers Party 5
Sinn Fein 6
Independent 7
Other specify _________________ 8
Don’t know 9
Would not vote 10
Q.3 If there was a General Election tomorrow, to which party or independent candidate would you give your first preference vote? DO NOT READ OUT
Fianna Fail 1
Fine Gael 2
Labour Party 3
Green Party 4
Workers Party 5
Sinn Fein 6
Independent 7
Other specify _________________ 8
Don’t know 9
Would not vote 10

Q.4 How likely would you be to vote if there was a General Election tomorrow? PROBE TO APPROPRIATE CODE
Would definitely vote 1 Would probably vote 2 Might/might not vote 3 Would probably not vote 4 Would definitely not vote 5 Don’t know 6
Q.5 And to which party or independent candidate did you give your first preference vote
in the last General Election? DO NOT READ OUT
Q.6 Are you eligible to vote in Irish General Elections, or not?
Yes, eligible 1
No – not eligible 2
Don’t know 3
Q.7 And are you an Irish citizen, or not?
Yes 1
No 2
Don’t know 3
Fianna Fail 1
Fine Gael 2
Labour 3
Green Party 4
Workers Party 5
Sinn Fein 6
Independent 7
Other specify _________________ 8
Don’t know 9
Did not vote 10

BEHAVIOUR & ATTITUDES POLL QUESTIONNAIRE – May 2014
Good Morning/afternoon/evening my name is ………………… (Name) and I am calling from Behaviour and Attitudes, the independent market research company based in Dublin. We are currently conducting a study on a number of issues. The study will take less than 10 minutes to complete.
The interview will be conducted in accordance with Market Research Society guidelines - all results will be shown in aggregate form and for quality control purposes this call may be monitored by a supervisor.
ASK ALL ADULTS 18YRS+
As you are probably aware, The 2014 European Parliament election in Ireland will be held on Friday 23rd May. I am now going to read out a list of the 12 candidates for the European Parliament Election in this constituency. READ OUT LIST IN FULL
Q.1 Which of these candidates would you give your first preference vote to in the European Parliament Election? Read out the list of candidates a second time, after they have given their first preference. And your second preference? CONTINUE TO RESPONDENT’S THIRD, FOURTH, FIFTH PREFERENCE, ALL THE WAY DOWN THE LIST
Lynn Boylan (Lynn Ní Bhaoigheallain) Sinn Fein
Nessa Childers, Independent
Emer Costello, Labour Party
Thomas Darcy, Direct Democracy Ireland
Mary Fitzptatick, Fianna Fail
Brian Hayes, Fine Gael
Paul Murphy, Stop the Water Tax/ Socialist Party
Eamon Ryan, Green Party
Brid Smith, People Before Profit Alliance
Jim Tallon, Independent
Raymond Patrick Whitehead, Direct Democracy Ireland
Damon Matthew Wise, Fis Nua
Don’t know 1
Would not vote 2
None of these 3
DUBLIN CONSTITUENCY J.5607

Q.2 The 2014 Irish local elections will be held in all local government areas of Ireland on Friday, 23 May 2014, on the same day as the European Parliament election. To to which party or independent candidate would you give your first preference vote in the local elections?
Fianna Fail 1
Fine Gael 2
Labour Party 3
Green Party 4
Workers Party 5
Sinn Fein 6
Independent 7
Other specify _________________ 8
Don’t know 9
Would not vote 10
Q.3 If there was a General Election tomorrow, to which party or independent candidate would you give your first preference vote? DO NOT READ OUT
Fianna Fail 1
Fine Gael 2
Labour Party 3
Green Party 4
Workers Party 5
Sinn Fein 6
Independent 7
Other specify _________________ 8
Don’t know 9
Would not vote 10

Q.4 How likely would you be to vote if there was a General Election tomorrow? PROBE TO APPROPRIATE CODE
Would definitely vote 1 Would probably vote 2 Might/might not vote 3 Would probably not vote 4 Would definitely not vote 5 Don’t know 6
Q.5 And to which party or independent candidate did you give your first preference vote
in the last General Election? DO NOT READ OUT
Q.6 Are you eligible to vote in Irish General Elections, or not?
Yes, eligible 1
No – not eligible 2
Don’t know 3
Q.7 And are you an Irish citizen, or not?
Yes 1
No 2
Don’t know 3
Fianna Fail 1
Fine Gael 2
Labour 3
Green Party 4
Workers Party 5
Sinn Fein 6
Independent 7
Other specify _________________ 8
Don’t know 9
Did not vote 10

BEHAVIOUR & ATTITUDES POLL QUESTIONNAIRE – May 2014
Good Morning/afternoon/evening my name is ………………… (Name) and I am calling from Behaviour and Attitudes, the independent market research company based in Dublin. We are currently conducting a study on a number of issues. The study will take less than 10 minutes to complete.
The interview will be conducted in accordance with Market Research Society guidelines - all results will be shown in aggregate form and for quality control purposes this call may be monitored by a supervisor.
ASK ALL ADULTS 18YRS+
As you are probably aware, The 2014 European Parliament election in Ireland will be held on Friday 23rd May. I am now going to read out a list of the 15 candidates for the European Parliament Election in this constituency. READ OUT LIST IN FULL
Q.1 Which of these candidates would you give your first preference vote to in the European Parliament Election? Read out the list of candidates a second time, after they have given their first preference. And your second preference? CONTINUE TO RESPONDENT’S THIRD, FOURTH, FIFTH PREFERENCE, ALL THE WAY DOWN THE LIST
Richard Cahill, Independent
Deirdre Clune, Fine Gael
Brian Crowley, Fianna Fail
Jillian Godsil, Independent
Simon Harris, Fine Gael
Kieran Hartley, Fianna Fail
Theresa Heaney, Catholic Democrats (The National Party)
Sean Kelly, Fine Gael
Liadh Ní Riada, Sinn Fein
Diarmuid Patrick O'Flynn, Independent
Peter O'Loughlin, Independent
Dónal Ó'Ríordáin, Fis Nua
Grace O'Sullivan, Green Party
Phil Prendergast, Labour Party
Jan Van De Ven, Direct Democracy Ireland
Don’t know 1
Would not vote 2
None of these 3
SOUTH CONSTITUENCY J.5607
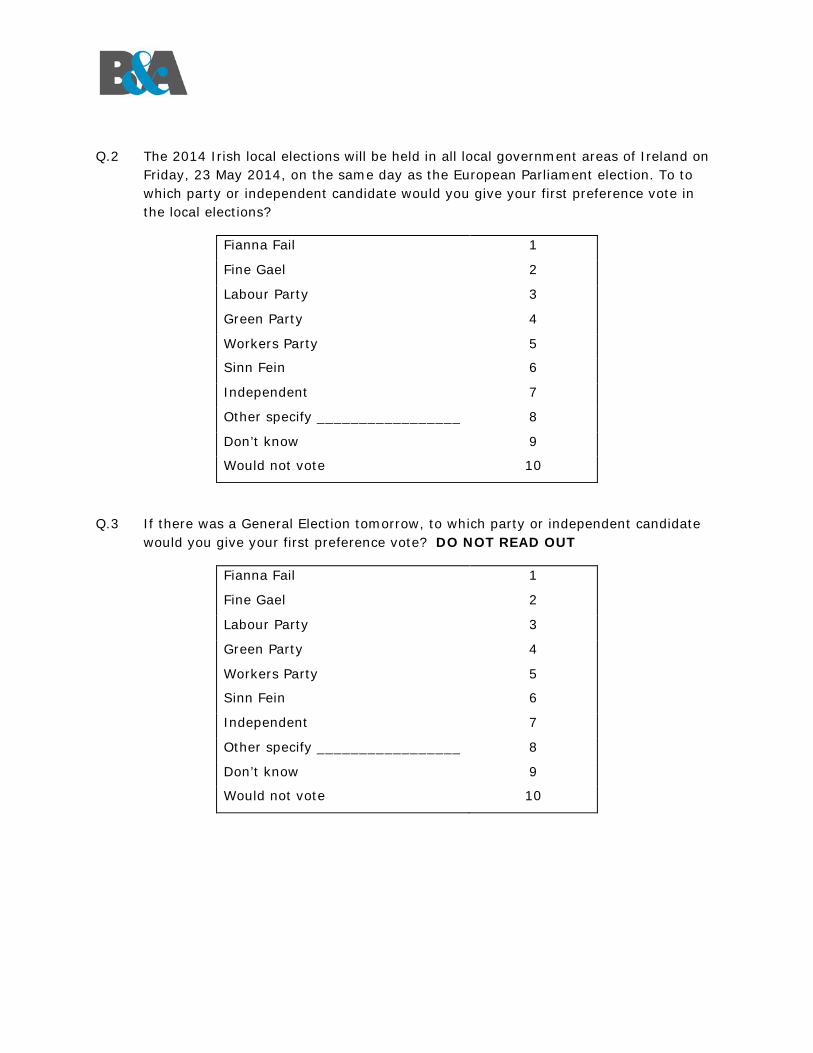
Q.2 The 2014 Irish local elections will be held in all local government areas of Ireland on Friday, 23 May 2014, on the same day as the European Parliament election. To to which party or independent candidate would you give your first preference vote in the local elections?
Fianna Fail 1
Fine Gael 2
Labour Party 3
Green Party 4
Workers Party 5
Sinn Fein 6
Independent 7
Other specify _________________ 8
Don’t know 9
Would not vote 10
Q.3 If there was a General Election tomorrow, to which party or independent candidate would you give your first preference vote? DO NOT READ OUT
Fianna Fail 1
Fine Gael 2
Labour Party 3
Green Party 4
Workers Party 5
Sinn Fein 6
Independent 7
Other specify _________________ 8
Don’t know 9
Would not vote 10

Q.4 How likely would you be to vote if there was a General Election tomorrow? PROBE TO APPROPRIATE CODE
Would definitely vote 1 Would probably vote 2 Might/might not vote 3 Would probably not vote 4 Would definitely not vote 5 Don’t know 6
Q.5 And to which party or independent candidate did you give your first preference vote
in the last General Election? DO NOT READ OUT
Q.6 Are you eligible to vote in Irish General Elections, or not?
Yes, eligible 1
No – not eligible 2
Don’t know 3
Q.7 And are you an Irish citizen, or not?
Yes 1
No 2
Don’t know 3
Fianna Fail 1
Fine Gael 2
Labour 3
Green Party 4
Workers Party 5
Sinn Fein 6
Independent 7
Other specify _________________ 8
Don’t know 9
Did not vote 10


![Session 201 20- 20AccuGrade 20Product 20Line 20- 20May 207 202010[1]](https://img.pdfslide.net/doc/110x75/577cbfea1a28aba7118e78c2/session-201-20-20accugrade-20product-20line-20-20may-207-2020101.jpg)