Embed Size (px)
Citation preview
ecture for summer studentsJ uly 1972.
:..r J l 19 '- RADIO STARS
R. M. Hj ellming
Since about 1890 people have been trying to detect radio emission
from stars, beginning with our own' Sun. However, it was not until the
1940's that Reber, Southworth, and Hey independently detected radio emission
from the Sun. Only during the last decade have any other radio stars been
discovered. Between the 1940's and the early 1960's, radio astronomers
had the habit of calling any new radio source a radio star. However, the
data eventually showed that in all cases these sources were not single
gravitationally bound bodies, as are all stars; by definition.
To appreciate the problem of detecting radio stars, let us consider
-26 -2 -1the simple relationship between flux density, Sv (in flux units, 10 Wm Hz )
and brightness temperature, T (in K) for a uniform source of solid angle
0 (= nO /4 where 0 is an equivalent disc diameter):S
T 2S =B
Sv 2 (1)
1970 ?
In equation (1) . is measured in arcseconds.
One of the most sensitive radio instruments presently available is the
NRAO interferometer for which the minimum detectable flux density is 0.005 flux
units for eight hours of observing. Therefore, for a source to be detectable
S > '0.005
and using equation (1)
2 2
TB 2 > 9.9X, (2)
2or T 2> 135 at 3.7 cm
2 (3)T 0 > 1210 at 11.1 cmB %
The optical sizes of the stars with the largest apparent diameters
(the red supergiants) are at the most 0."05, hence for these one needs
T > 53,000°K at 3.7 cm
T > 484,000 °K at 11.1 cm
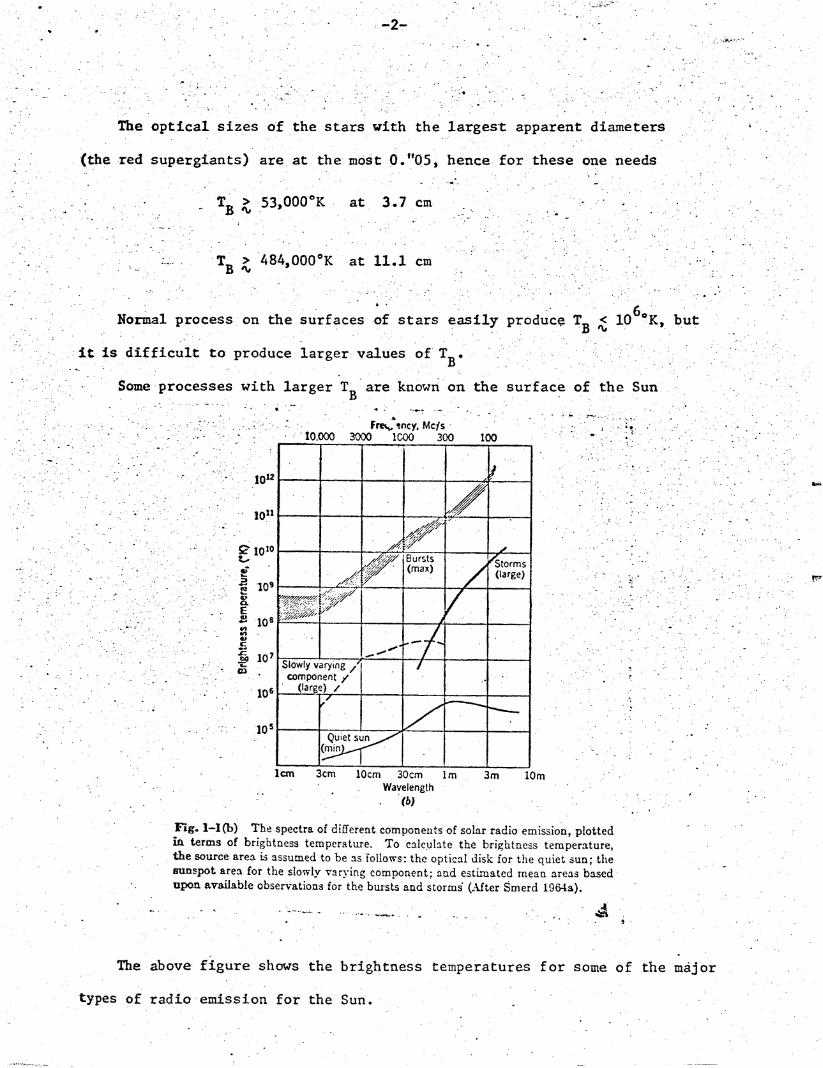
Normal process on the surfaces of stars easily produce TB i10 6K, but
it is difficult to produce larger values of Tg.
Some processes with larger TB are known on the surface of the SunS - . ,.
cc
L.
V
0
C
to0
10.000 300(Frec. .ncy. Mcjs -
0 1 CO 300 Ito
10"12
1011
10 1oB78ursts Storms
component/ j '
10 (la rg e)/ 1
10 s
cm tsun 0
icm 3cm 10cm 30cm Im "3m 1 r
Wavelength- (b)
Fig. 1-1(b) The spectra of different components of solar radio emission, plottedin terms of brightness temperature. To calculate the brightness temperature,
the source area is assumed to be as follows: the optical disk for the quiet sun; themunspot area for the slowly varying component; and estimated mean areas basedupon available observations for the bursts and storms (After Smerd 1964a).
The above figure shows the brightness temperatures for some of the major
types of radio emission for the Sun.
--'
~.
'':I
.dil 'q IDm
'-3-
Quiet Sun - chromosphere and coronal thermal emission
Slowly varying component - radio emission associated with sunspots
or plages
Storms - non-thermal emission with time scales of hours to days. At
sunspot maximum, in progress about 10% -of the time
Radio bursts - short lived non-thermal events with time scales of a few
minutes to hours.
" Unfortunately, the quiet Sun at 10 cm could be seen only if closer than
0.07 pc, the slowly varying component could be seen only at less than 0.1 pc,
and very strong bursts could be seen only within 2.5 pc. .
The nearest star, ProximaCentauri, is only 1.3 pc away. You thus can
see that only unusual processes are likely to produce a radio star. The worst
problem with stars is that : is always rather small, hence it takes a fantastic
" TB to make up for this.
Despite all this, there are now five ,(or more) different types of
S radio.stars. *
FLARE STARS
Certain red dwarf stars are known to increase their brightness radically
for brief periods of time (typically a few hours). These objects are called
S flare stars, and the flares they exhibit could be more intense versions of the
well known solar flares. Since the solar flares are accompanied by intense
radio bursts, the possibility of detecting these flare stars led British and
Australian radio astronomers to monitor them extensively in the last decade.
During several thousand hours of observing time, these investigators have
found several cases of simultaneous radio and optical flares for a few stars,
notably UV CETI, YZ CANIS NINORIS, and V371 ORIONIS. These were the first
true radio stars.
-4-
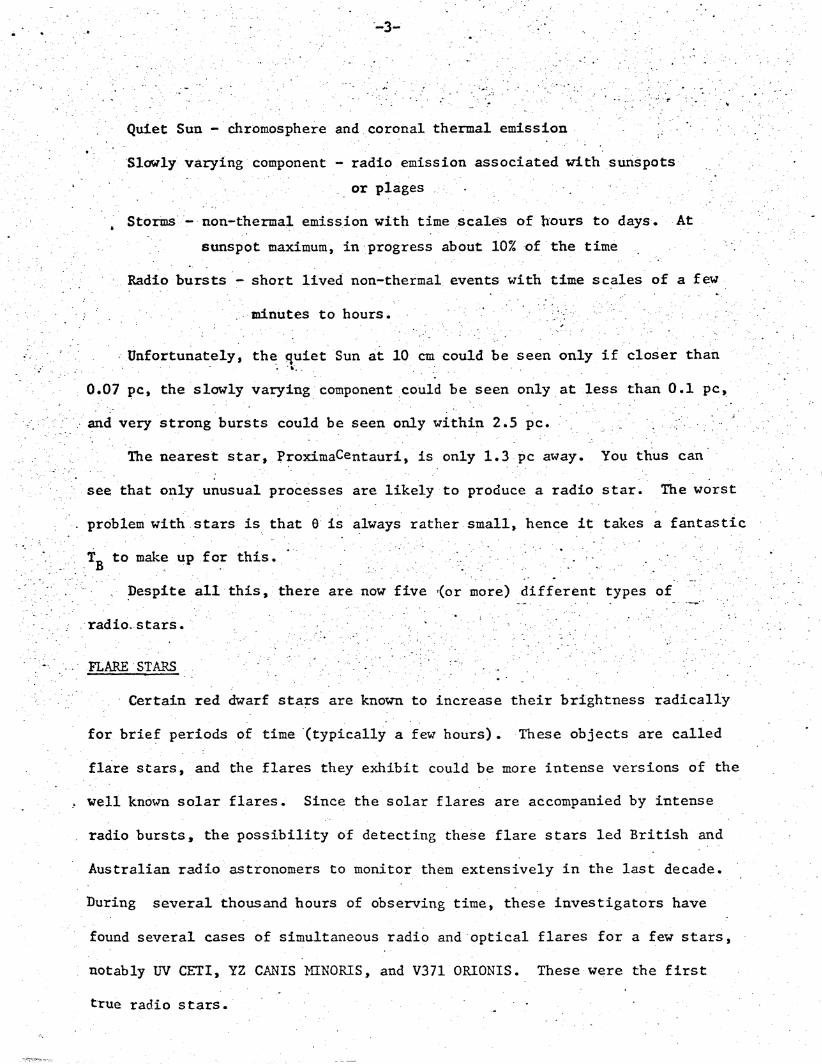
One of the best examples is the flare of YZ CANIS MINORIS shown below.
The interpretation of radio flare stars is still quite uncertain. There
have been attempts to attribute the radio emission to shock waves moving through a
corona, or to non-thermal flare phenomena like the radio bursts on the Sun.
There is the difficulty, however, that the brightness temperatures are at least
1510 K in some cases. This is a few orders of magnitude greater than has
been observed on the Sun.
o 40 ... : . . : .,- .
01"00 02OO f03400' 0400" 0500 060OO'- .UT JANUARY 19.1969
NOVAE
These stars, called novae) were first detected as radio stars by myself and
..ss .s .how -f .ilnl -it .....tie .hc •yial ,.c 00
C. M. Wade in June 1970 with the Green Bank interferometer. Three novae:
Nova Delphini 1967, Nova Serpentis 1970, and Nova Scuti" 1970 have so far
been detected.
-5-
Data for about 1-1/2 years .of observations, of Nova Delphini 1967 and
Nova Serpentis 1970 are plotted as a function of t, the time since initial
outburst. Most of the measurements are at 3.7 and 11.1 cm, but several measure-
ments at 0.35, 0.95, and 1.95 cm were made at various times. The solid -
curves are the fits to a thermal model in which emission measure, E, and
solid angle, s are varying as functions of "time. The following are the
solutions for the parameters:
Nova Serpentis 1970:
1.2 1.2 0.2
S
262.1
6I)t -22 5 + 0.3 1
x *=S• (1.O2 + 02) t ( --
3.7
0.4
i.e.. . .a t1
S
E a t
0.4+ 0. .
3 .-
For fre ex = (6 + 1) t shl (
E 0" ""t-
" '• . °' , . -. f. l a t -,..: ""::: =(I0 +O2) - "6 : . ,.".....- ...."
for one-dimension expansion
C a ts
-6-
hence we see that the expansion of Nova Serpentis 1970 is slightly confined
in at least one dimension. However, Nova Delphini 1967 must be somewhat
Sconfined in its expansion for all directions.
Further analysis of this data is still underway. Recent data .indicate
both Novae may have become resolvable. If so, we will soon have distances
determinable by the radio data.
*1.%.. - . ..
.
... ~ - r.
,. : ,-- ~ ....,,... .,
z ....
c. ..;is~fi~, ~-
-
r
.
.-
-
..
' 2.
" t
.I , , ... •* .
' 4 f " r a " " i / 1 r ' . , : . • i / !' '1 r ,.. r . . . . , .-
, • .r -." r -
1 0
t(years)
10
N
N
(10 "
to
O© .a ,
1 .
" " ,
. ., - ,
. .
. ,'
r
,r
a . '
st
. . ,, ,
_ , j .
.r
. " .'
. 1
"
,1
. e.
r
r
. . " .,
;,.
. i , " 1
"
. i
" !
.. f r
"
,, " ' -
. .
. .. .. L.
. . - .
10 o
I
E
I 10"
to
-10-
3.0 3.2 3,4 3.6 3.8t. (years)
10 3, .10
4.0o (~
4.2
" . t - i "
a
C f '. 'R .r
1 .
.
I .
r }
.
. .
" s+
,i
,
.'
. .
,"
1 r
. r "{ " " "
. . r , i
- ., .
."
+ r .. .
. ' ', .
a
!..
} .
-'
" i !
!
.
RED SUPERGIANTS
This type of radio star must be placed in the maybe category. Kellerman
and Pauliny-toth have reported a possible flare in the red .supergiant called
Betelguese (a ORIONIS). On February 21, 1966, they found a flux of
(0.11 - 0.03) f.u. at a wavelength of 1.9 cm. No signal was found, however,
on eleven following nights.
In addition, Seaquist reported a possible detection-of R AURIGAE, another
. .
red supergiant. However, again the result- is not reproducible.
This non-reproducibility is the curse of this subject. We know now that
every known radio star is variable and some are erratically variable, hence it
may be.difficult to obtain a particular flare on a particular star.
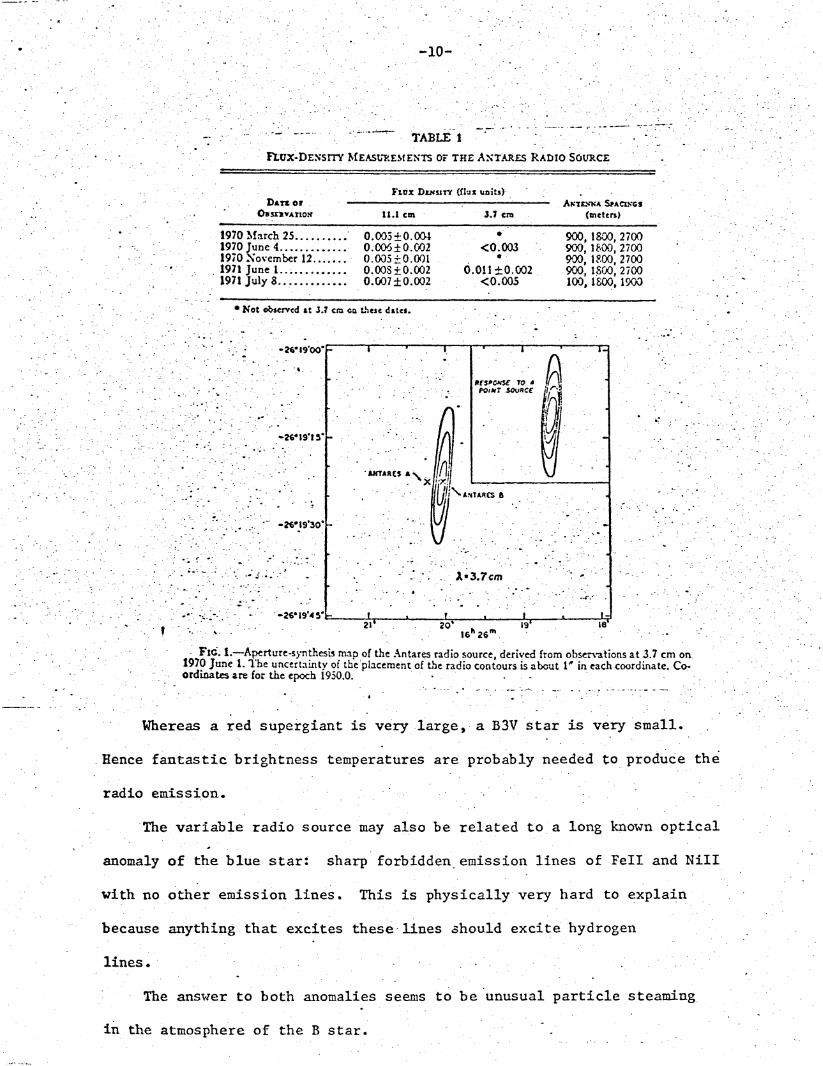
ANTARES B
Extensi've observations of Antares, another red supergiant, have produced
an unexpected result and a new type of radio star. Observations at 11.1 cm
by myself and C. M. Wade on the NRAO interferometer have shown that in March,
June and November 1970, Antares had a flux density of 0.005 + 0.001 flux units.
In June the flux at 3;7 cm was less than 0.003 f.n. On June 1, 1971 the Antares
radio source was "flaring" at 3.7 cm to a level of 0.011 + .002 f.u. A month
later it was again less than 0.005 f.u. at this wave-length.
Antares A. the red supergiant, but rather.was Antares B, a B3V blue companion
3".2 from the supergiant. The following table and a 3.7 cm map of the source
proves this.
------ I- I -- ---- ; a 4 ~~ . -C-L-CIO- e~~Url
-10 -
TABLE 1
FLUX-DENSISTY MEASUREMENTS OF THE ANTARES RADIO SOURCE
Faux D.rnsrr (flux units),DArs o ANrt-NA SPACInGs
OasravAno 11.1 cm 3.7 cm (meters)
1970 March 25......... 0.003±0.004 * 900, 1800, 27001970 June 4........... 0.006±0.C002 <0.003 900, 1800, 27001970 November 12....... 0.000.001 * 900, 1800, 27001971 June ............. 0.008±0.002 0.0114±0.002 900, 1800, 27001971 July 8............. 0.007±0.002 <0.005 100, 1800, 1900
S ri-- r rrr .r-
SNot observed at 3.7 cm on these dates.
- • 2f" ." •Z.o'
RfstcnwE TO sPo lt .SOuRCE j.'
.. . . ..a. . ... ,T R ."
. " .
*2*19'30'
21 204 Is' " ;
. - . 16 26 m
FI. 1.--Aperture-synthesis mnp of the Antares radio source, derived from observations at 3.7 cm on.1970 June 1. The uncertainty of the placement of the radio contours is about 1" in each coordinate. Co.ordinates are for the epoch 1950.0.
Whereas a red supergiant is very large, a B3V star is very small.
Hence fantastic brightness temperatures are probably needed to produce the
radio emission.
The variable radio source may also be related to a long known optical
anomaly of the blue star: sharp forbidden emission lines of Fell and NiIl
with no other emission lines. This is physically very hard to explain
because anything that excites these lines should excite hydrogen
lines.
The answer to both anomalies seems to be unusual particle steaming
in the atmosphere of the B star.
-II-
Radio Binary Stars
The most important contribution Antares B has made to the radio star
business is the clue that matter streaming in binary systems might be
important. Following up this clue, the eclipsing binary 8 Persei (Algol)
was immediately detected in October 1971. Several days later another
famous binary star, . Lyrae, was found to be a radio star. The following
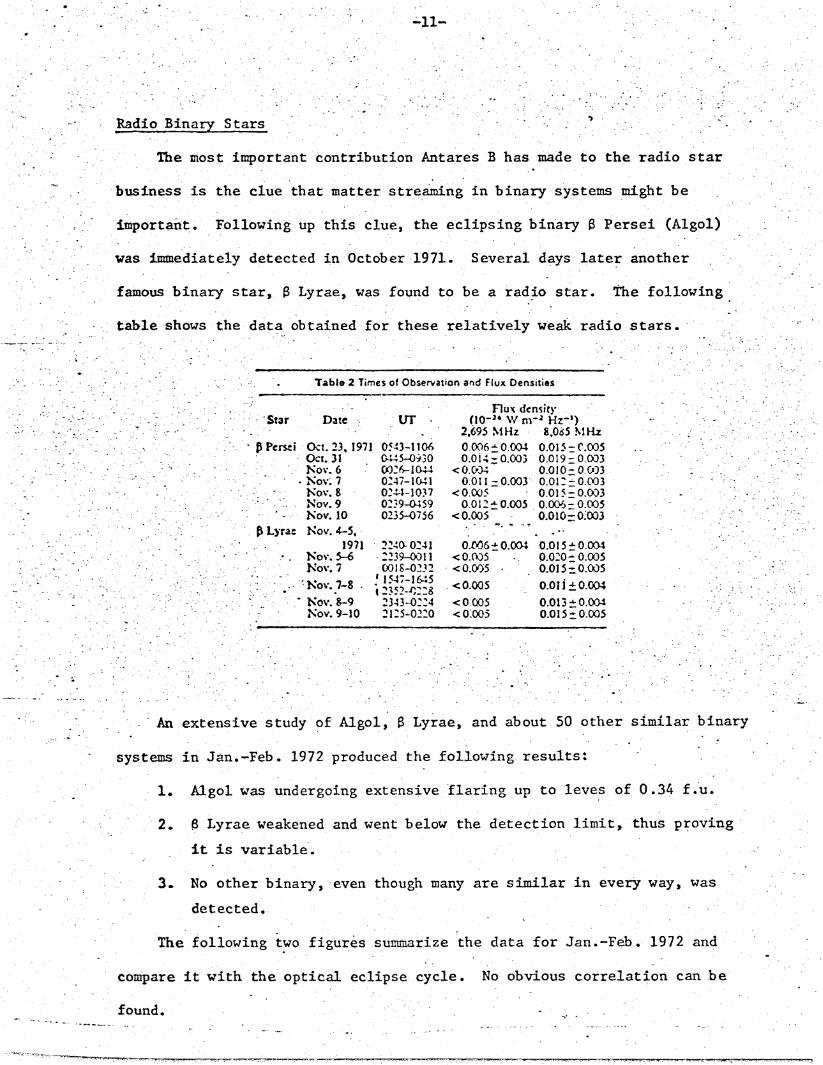
table shows the data obtained for these relatively weak radio stars.
Tablo 2 Times of Observation and Flux Densities
Flux densityStar Date UT (t0 -
2' W m -2 Hz-')2,695 MHz 8,065 MHz
. .Persci Oct.23, 1971 0543-1106 0.006±0.004 0.015-C..005Oct. 31 445-0930 0.0i14 0,0 0 3 0.0 19 - 0 .0 0 3
Nov. 6 0026-1044 <0.04 0.00410- 0.C033Nov. 7 0247-1041 0.011 - 0.003 0.01=- 0.003S Nov. 8 0244-1037 < 0.005 0..015 0.03Nov. 9 0239-0459 0.0112 0.005 0.006 0.005N . Nov. 10 0235-0756 <0.005 0.010= 0003
. Lyrae Nov. 4-5,. .1971 224 0241 O.6±O0.0C5 0.015 A0.004
Nov. 5-6 2239-011 <0.005 .. 0.020- 0.005Nov. 7 0018-0232 <0.005 - 0.015-0.005
. Nov. 7-8 . -23 ,28 <0.005 0.011 ±0.004-Nov.8-9 343- 04 <0.005 0.013 ± 0.0(0
Nov. 9-10 2125-0220 < 0005 0.015 : 0.005
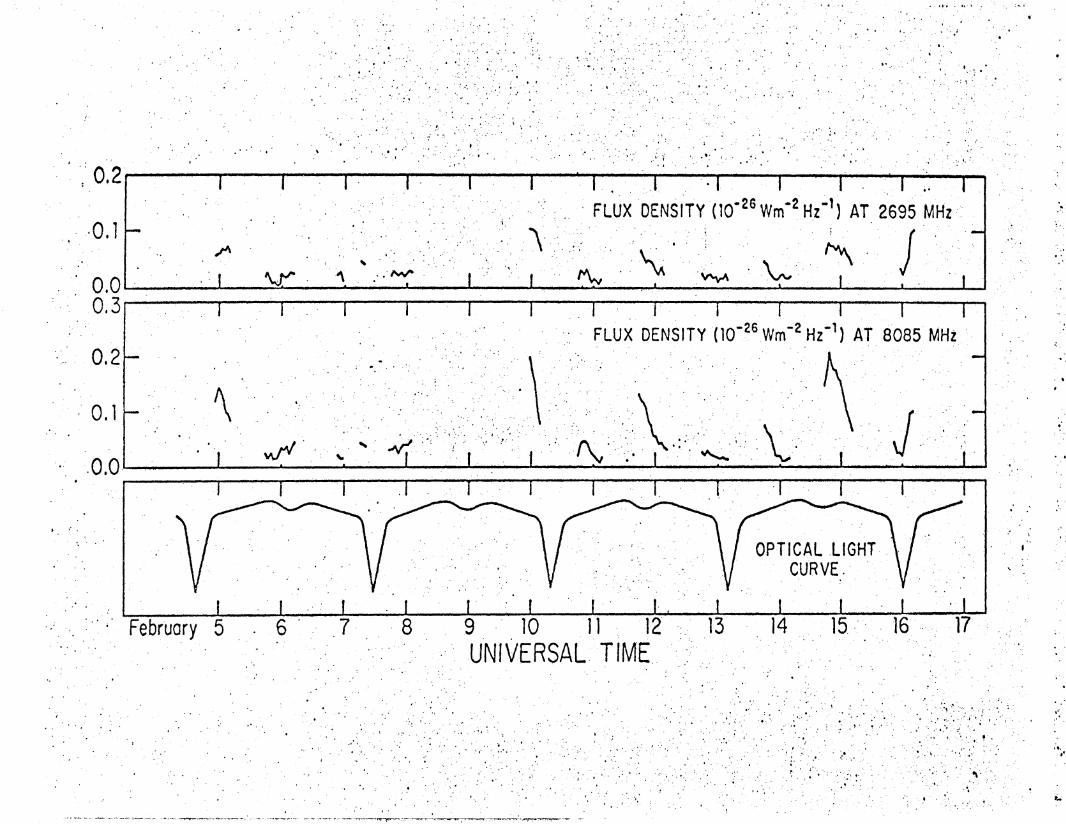
An extensive study of Algol, S Lyrae, and about 50 other similar binar
systems in Jan.-Feb. 1972 produced the following results:
1. Algol was undergoing extensive flaring up to leves of 0.34 f.u.
2. 8 Lyrae weakened and went below the detection limit, thus proving
it is variable.
3. No other binary, even though many are similar in every way, was
detected.
The following two figures summarize the data for Jan.-Feb. 1972 and
compare it with the optical eclipse cycle. No obvious correlation can be
found.
- - -- - - - ~ ---
:"I~T~T?9~"~ -~'~.~7P~?3~'PC-~n~ .... .,. _ v. _r~-~ ?r-~I1lcc a~rlm~r~r~-r ln~r~~
... .
. < " _
-
,
-y

0.1
0.2
O,3
0.2
0, 1
.O,0
12.0 13.0 14.0 .15.,0 16.0 17.0 18.0 19.0UNIVERSAL T
20.0IME
21.0.. 22.0 23.0 24.0 January
. . . . .( I'ft..~~ ~ ~ .. *.. .N* 9'f t 4.'.*~-~* .9. , . .*,.,* .-. 9-.-.... .. *.*9 Y* . .* .
LUX DENSITY (26 Wm H) AT 269 MHz
S"1 . , I . I i I ,I-2
FLUX DENSITY (126 Wm2 H) AT 808695 MHz
....
1 1 1 .1'0-'I
-C
OP T ICALLIGH
S" ,' ,,U VE
" . o . • , +, ,
° . . - ., ,. ., - + . ' . • .: • .• + , , .+ . " . , . , .. .- . , ". - .: .
•1 .. .. " ..,)~~ o+ " I _I ...: ... i_.._ -:.i - .... "_
• . , .
".'C A :i .L.,.
+ . , . .
.y . ..
"
j
a .
"
'
r
. ,
: "_
,
" .
I" 1,'
. i
*1
I,.
E
.
I
S I"
: : t "
• t ,1
.,r
r
° °
i !
, .• , :
...
" 4
i
I I I " I " . . I I
A
z V t
1 . , , I I I I
S.. FLUX OENSITY (i02 Wm' 2Hz-') AT
vv ,A\vAY
2695
J
5 .6 7 8 9 10 11 12UNIVERSAL TIME.
13 14 15 16 17
0,2
o0.1
0.00,3
0.2
0.1
0.0
MHz
FLUX DENSITY (10-6 Wm H z ) AT 8085 MHz
. . .. . .. . , OPTICAL I
CURVE.
February
- I - - - -1 ~ -~r- - --- r -- ~ ---- - I -- - .- __. -- I I -
w } c w
' . , ..
..
. , ,
t }
r 1 a
" " "
"
. ..
° " ' '.: . .
i ' I r
". .. .
" " I
' ! "
i .
~ a
" ,.
" i ...r
.
w.rw
._
,.
. . ' .-
..
" .
:
i: . .. - r
"
!
' +
..
. . "
r r
.
1 " r
. .
.
.
'
i ,
. ' '
o,
•'. .-', , - ..
. . ,
-14-
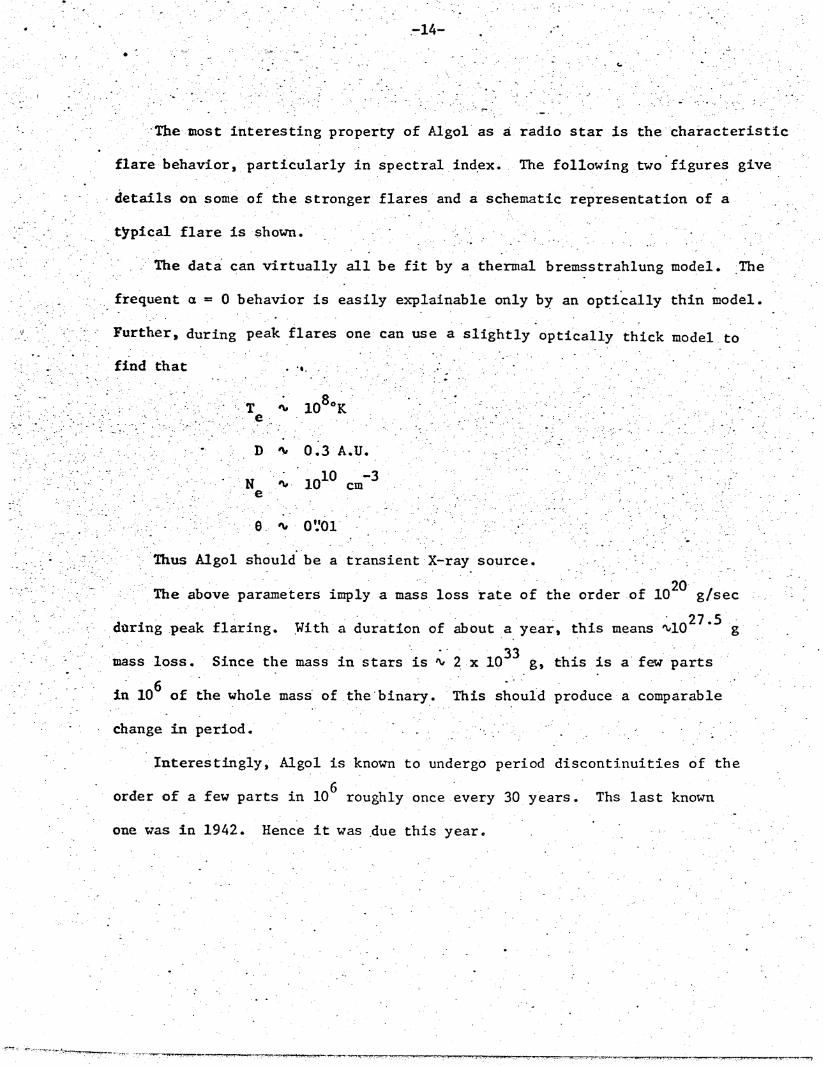
The most interesting property of Algol as a radio star is the characteristic
flare behavior, particularly in spectral index. The following two figures give
details on some of the stronger flares and a schematic representation of a
typical flare is shown.
The data can virtually all be fit by a thermal bremsstrahlung model. The
. frequent a = 0 behavior is easily explainable only by an optically thin model.
Further, during peak flares one can use a slightly optically thick model to
find that ..
T "'10 K.. • ... ... .. . .
D- 4 0.3JA.U.
10 -3. _ N 10 cm
e
Thus Algol should be a transient X-ray source.
20* The above parameters imply a mass loss rate of the order of 10 g/sec
27.5during peak flaring. With a duration of about a year, this means 110 g
33mass loss. Since the mass in stars is v 2 x 10 g, this is a few parts
in 106 of the whole mass of the binary. This should produce a comparable
change in period.
Interestingly, Algol is known to undergo period discontinuities of the
order of a few parts in 106 roughly once every 30 years. Ths last known
one was in 1942. Hence it was due this year.
1~ r*~ lr7~.yr~q?~l~~sz~ r~~.~~.~~?rra-~ - e~--~Cce -srt! n --- ' - - s ,
''
ALGO
JAN. I1 122
-0.5I .
o02
0
o
00 , ,t I t l l , I , I2200 0000 0200 0400 0600 0800 1000.
UT
v. - :. q, , , - -- - -
0*-
S..,
**.
1800 2000 2200 0000 0200 0400 0600UT
I . I , 1 . I 1
I . t . 1
* . 1
•1 * 1 . 1v
e00 ,
SJ. . JAN. 22 23
* * . • "
.0...
2000 2200 0000 0200 0400 0600UT
IIB I I b
* 0
1800 2000 2200 0000 0200 0400 0600
UT
*.
1800 200 220 0000 0200 0400
UT
2000 2200
UTUT
S n.t
0 I. .
-* **
i t I
1800 2000 2200 0000 0200 0400UT
031
say oz
+,,
j ', ,
I..
S 111
,I'n - r r . z -- L . . .. . ---- -----
S I I I. _
.. : ,
a
f . .
a .
.
" ,
f +
e w
r
;.
rt
"
.. t
R + r
" " ' "
.
* +
" "
" i,
' ' .. .
} .
r 1
i
f
i '
",
"
°.
f'
t' . •
. •
r:-

... * " -. .
.- -DY. w r - .4! . '. iw 1 . + "~ w !.~f .wwr. s "M r I Y " .r f " +""" M '1 ; r Nr i" « .4 M I
SCHEMATIC FLARE BEHAVIOR OF ALGOL"+ 1.0
+0.5
0- .0
* 0.5
1.0
+ 0.2
0.0
+. 0.3
+0.2
0.0.* C
-. ,. + 0.2
'. ' 1 ' - I ' ' I I' 1' I
SPECTRAL INDEX
- " " - . ." " ,- i . " -
' S I
T j )
I .- , II . I , I-
1 I I . I
• , • .. "
I 1 * r I... '
FLUX DENSITY (10-26 Wm2 Hz- 1)AT 2695 MHz
.)0
-
-
r V ! I
TIME (HOURS)
--
-. 1 1 1 1[ _ _t
A
- -- ~-~ --
C.
.,
" - " .
,3 . . ..+z. i ' ,
...... ,,. ,..." ' "
. ..
.,.
" - - .. . . . . "-
.- , - .. - . .. .. . - . . - . .
-15-
.PULSARS.
Pulsars are true radio stars. Because they have been a subject of special
lectures this summer I will not discuss them.
X-RAY STARS
One of the most interesting developments of the last year is the
coupling between X-ray astronomy and radio astronomy because of the fact that
many X-ray sources are radio stars.- .- .. *.
It all began with Sco X-l. In 1968 Andrew and Purton found it was a
radio source and in 1969 Ables obtained data indicating it was a variable
TN 5910source. I and C. 1. Wade entered the subject-last-yer and have had a great
deal of fun since then. The first thing we found, by using an interferometer
which could accurately place radiation in the field of view, was that
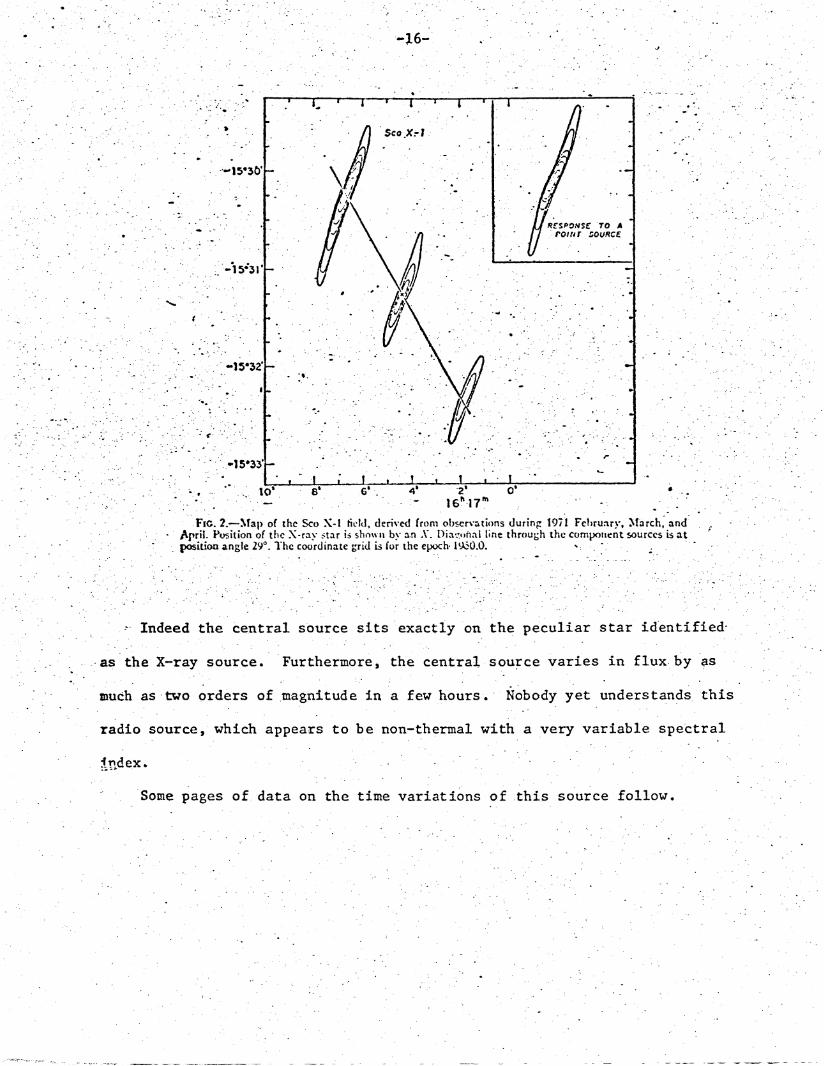
Sco X-l is a triple radio source with the components arranged in a line..
The next page shows a map of the source. This is reminiscent of one of the
major unsolved phenomena in radio astronomy: why do double sources tend to
be arranged on opposite sides of interesting objects.
~--smre ~llppr.r~--~-~ ~I - -- -- -- --.
-16--
Sco X l
* . . . .
RCSPONSE TO AP OoiNT SOURCE
S .... 15*33':. .r
, • 04 2O
Frc. 2.-Map of the Sco S-1 tield, derived from observations during 1971 February, March, andApril. Position of the X-ray star is shown by an X. Diathal line through the component sources is atposition angle 290. The coordinate grid is for the epoch 19O.O.
* Indeed the central source sits exactly on the peculiar star identified
as the X-ray source. Furthermore, the central source varies in flux'by as
much as two orders of magnitude in a few hours. Nobody yet understands this
radio source, which appears to be non-thermal with a very variable spectral
rtdex.
Some pages of data on the time variations of this source follow.
- .. 1. . .M ! * - . . .. - .
CkI Cv N en4 C , eot v.- S. MARCH 26
. 0.08 -
0.06
0.04
0.02
0.00
0. 12
0. 10S 1
0.08
0.04
0.02 ff0.00 f
-. 12 14 16 18 20
JUNE 3
S3.7
Sl.
12 14 16 18 20
-SEPTEMBER 29-
- S37
- ", • "1t
- JUNE 20
S .
S12141618 20t
12 14 -16 -18 20
i
ji
12 14 16 18 20
OCTOB.0ER 28-7 -OCTOBER 28 r CIOBER 29- OCTOBER 30 OCTOBER 310.04
03.1 531 33.1 [3.7
.... 0 0. - - -I I
S 0.04 S. Sltt St Sl.
0.02
0.00 -. --t -12 14. 16 18 20 2 141618 16 8 20 12 14 16 18 20
NOVEMBER 5- -NOVEMBER 6 NOVEMBER 70.06 s t.tf t Si.0.04 4
0.02
0.00 1 i L 4 i i1I
12 14 16 18 20 12 14 16 18 20 12 14 16 18 20
- NOVEMBER 19 - -NOVEMBER 20-0.04- -..
0.02
0.06
0.04 I t0.02
80.00
12 14 16 18 20 1214 161 '8 20
j 'x' y ixr, ,.y-K - .' , IrF-w, - ~wI-_ f- - . -1- -+ ±MT ' "*r- -. ; sI-- - -- n -
SI.
• l -I . . . . r
$cc Z? .
--- DECEMBER 3. 1970 DECEMBER 4,1970 DECEMBER 6, 1970
' OC lJ S ; t/.dP; PA0006 to S/l. l; "P P 00/5 ! .u
.12 14 16 18 20 12 14 16 18 20 12 14 16 18 20 1ST4 I 8 1 t i I 1I ' l I
14 .16 18 20 14 16 18 20 14 16 18 20 O T
- FEBRUARY 23, 1971 FEBRUARY 24, 1971 FEBRUARY 25. 1971
0.04 */.531; MAP) 0.011 u.
0.040 { .
0.04 S~l / ju 00/0.la. . //; P 0010 L. S 5.///; IMP CO/3 ol u.
0.02 i jil ii ij lj 1
12- 14 16 18 20 12 14 16 18 20 12 14 16 18 20 15
I " I -
I . It . , I I-~ I . . _ - - . .8 . 0.. 12. 14 16. 8 ) 12 14 6 8 10 12 14 Ur
- FEBRUARY 26. 1971 FEBRUARY 27. 1971 MARCH 22. 1971--
008. 5/37t; MP/ = 0025 l 5S7;M4P/ 000 .as. S(3 7; MAP) 0012 Lv.
0/ 04.0
000 t f 1 + 1 4 s4 1
8 10 12 14
5////; AIlMA/= 0012 I .
2 14 16 18 .20 12 14 16 18 20 LST
I--8 . 10 I . 6 8 10 12 14 /-8 10 12 14 o , 6 8 , 12 14 UT
MARCH 24. 197.1
0.04 S 3.7; M AP - 0004
fU.
002
0.00 + }# + 4 L
0.04k S(11.I ; A P/A0004/u
0.02
12' 4 16 18 20 LST
6 5B 10 12 14 UT
s(l.,; M/AP/ = 0.66 . .
E f+
. .
t
14 16 t 214 , 18 20
S0/010 iLu.
• .: .
5(11.1; MAPI
F
*-~*TlrKI-----~----- ~~cr~ ~-- rcLrc.~.rur~lrmrr*lr~n*n- r.r U ----- --- *r r~ np -~p~r --- - -- ~ -I I -L--- rr- LI -- -- ; .r
cc.t:r -, ::
wr. ur r~Cr.' r
1;
4}
-- ,.2
MARC 25. 1971 ARCH26 971 MARCH 27. 1971
0.02 ; MAP : u .. ? 'x . .?.A : L
1.2 14 16 18 20 12 14 16 18 20 12" 14 16 . 18 20 1ST-t , .
6 8 10 12 14 6 8 10 12 .14 6 8 10 12 14 UT
MARCH 29. 19710.06 /7;AP007f
0.04
0.02 ..
0.00$ 44}4 ~ ~4
MARCH 30. 1971 MARCH 31, 1971
S/J 7, AMP 00/"9 .5 7u.; //AP/ I 0.0 f u.1444 4 444
0.08o.os
S0.06
S 12" fr 2
6 8 10 12
APR*L 1.1971
0.04 S /3 ; AP 0003r fu
0.16
0..14
0.12
0.10
0.08
0.06
0.04
L 4 44#$
12 14 16 18 20I . -t_ + . ,
6 8 10 12
MAY 20, 19710.04 5/3. ; MAPJ 0009 u.0.02-
0 oo00 4t +4 } j
1* ~ 1 , ,8 .52 14 16 18 20
S/. f/ 4A 0 -P 0039 /v.
12 14 16 18 20
S6 8 10 12
APRIL 2, 1971 .-
srJ.7; MPJ -O? u.
sf 7; MAPI .005 u.
12 14 16 18 20t I . I . I
.
Icr
.
"
E
12 14 16 .18 20 LST6 1 . 8 .1 1
6 8 10 12 UT
6 8 10 12 2 4 6 8 10
• . z + "
LST
2 4 6 8 10 UT
5(11 A'4P] -08 fu
14 16 18 20L " I ! I • I •
$S /; MAP) : 0067 .
4 1 4
12 14 16 18 20I-. , . .. I ...
LST
UT
._,
,..--
-
.. ,,-.:.. . . " - ~C . ~: '~- --~~I~~?+r c7~wmr3p 4~ I--P'~SMP~nrr ~ ~ ~ ~.~.Y~V--'Xi,_
.. r. .. . rs

+" -20-
.The idea of hunting for other X-ray sources by looking for radio variables
.in the relatively large X-ray error boxes has lead to a number of successful
'detections and one important identification.
GX17+2: A lovely Sco X-l like flare was detected for this object
i May 27, 1971. The fact that it appeared and disappeared
is shown beautifully by, not only the map, but by the
amplitude and phase data for two different days.
.4
GXI7+2
14'02' Moy 27..1971
14*9O3 - .4 Oil'
, .... . .. -
16' 14s 12S 10' . 08' 06s 04s
18 13m
Fo. 1.--Map of the radio source appearing in the GX 17±2 field on 1971 May 27. The crcle repre-sents the error limit of the MIT X-ray position (with the 4' collimator); the polygon represents the,error limit of the Uhuru X-ray position.
"GXI7+ 2 My 27. 1971- 1 -GXt7 + 2 Moy 30. 1971003
. 02 S . .-
.200 • " " *
6 . 6 *SO- ...f 1. ! i + 4 ." .
" 0 ,* so0 - -," *
4 16 18 20 22 144 6 48 20 22 LST
0._ 8 t4 6o U
S6 18 20 22 14 .6 20 2 tsr
4 6 8 10 4 6 8 10 or
-21-
CYG X-l: The identification of a radio counterpart to CYG X-1 was made in-
dependently with the Green Bank interferometer and the Westerbork
array. The following is the GB 11.1 cm map of the source. The
accurate radio position led to an identification with HDE 226868
a spectroscopic binary with a BOIb star.and a nearly invisible
companion. Recent work has found a weak helium emission line
associated with the "other" object. If this data is confirmed,
the mass of the "other" star is. 15 solar masses, and would be
indeed a "black hole". .
*35* 06 esro
CYGX-I . o,
. . . .. Poi-t .ce
35*04
" 0 ° . ..02. - - "-°
ara. 3T- a fotho s it the B-. reseto pitso the ourr tce r40 35 30Is 25% 20' 1 to 05"
* tE,.e y r t
theurate rio posittion e iat h D
.. e ero .... o heIi:lu psii
SGX9+1: In Nov. 1971, a weak radio source appeared in the error box of this
X-ray source.
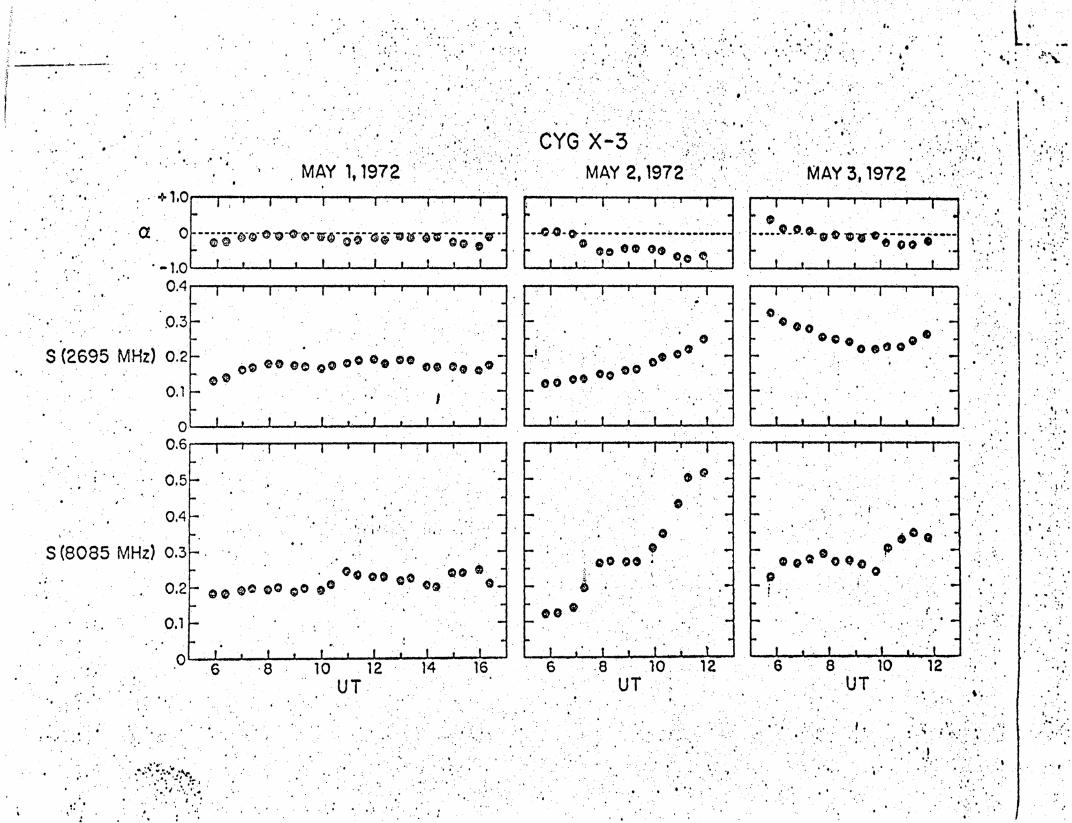
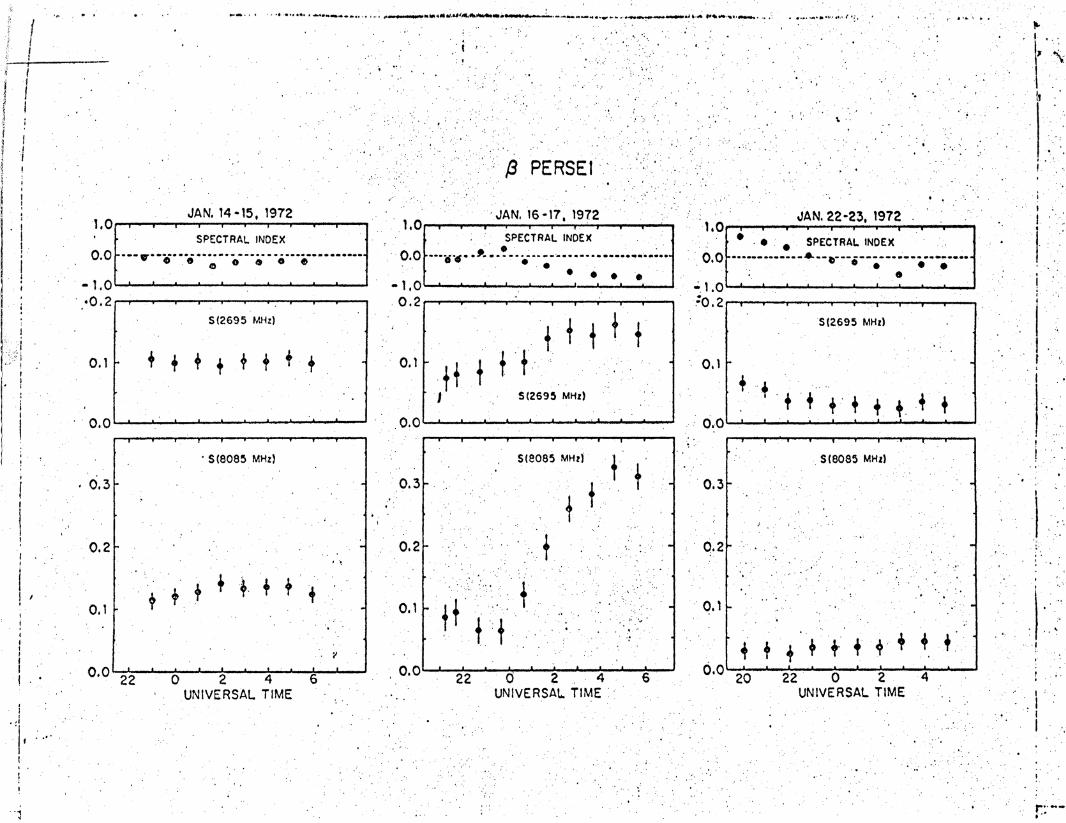
CYG X-3: This radio counterpart was first detected with the Westerbork array.
It is unusual because
1) It is the strongest of the radio stars
"2) Its spectrum is mostly thermal
3) Most of the time it looks just like 8 Persei (Algol). The
following two figures show this.
Most recently we have found CYG X-3 to undergo rapid flaring at mm
.: avelengths on time scales of minutes.
i
- ~
4
.
i . , _ ... rq ..
'
r+ i • • ,y ,
i (Ii, " .. o" .+, . •° ,. " . . ) ,+ ' + ,
.. orS . '
:i i b
CYG X-3MAY 1,1972 IA At.0
MIViT 4, ltw 4
a
0i4I.
Q0.3 -
S 2695 MHz) 0.2
0
0.A4 }
S (8085 MHz) 0.3
0.2
0.1[
ni
r"
00
wir rb
1 ' I ' I " I
.
! t I i " 1 t "
6 "8 10 12 14 16UT
0 0-
00.
. . .oo o *
1 I , .
.J , o" o " + +'+ ~ -
6 8
UT10 12
I ' I ' I ' I
* , .40-9 +i +
A ., , .4 04 *
*' t o I'Ir ~. o
6 8 10 12UTI
* 4
1 4 4
.. .
" "
• , . f
• +. + . . . " . . : .... . L .. .I.4 •. .. 4
, . .
:~ . +" Y
.. " , . f •! ,
'
" , i -
.
.. , .• • . :. .'
* 4
.'" "• '" " i + It +
• I
V . ' V. .
.+ - ,o . • . .$4"- , . • . , ' .. .
" - . " ..
• r . . . .4 4
4444 .p
r. ..
i '
" f .
v 1l '
so
',
B..
08;
oo o- ,00,o000,
. 1 . 1
- o oo a
MAY 3 1972
.. . o ... -. *•
- --- OWVW
1
I
i.
t..
i
" . ' :r .
s ; 1!
I •
I
S
,..
' R
. . "
"
" i
-r I ' I" ' I I ' i
r
' .''
I '
.. ,
". .
I41
ii
.v I'a.
i[ t 1 l --__ -s _ -'
p i- i . I + "1 P1 i i . * r i *SNJ 1r.. . , .. , n lr SI* LML){I )1.# L I C I * rC ' -. l*.a a. r.. . *i. temp. .. N:I"
h
I
ii
i I"4 O
I.0
0.0
1.0
0.3
0.2
061
. 0.01 *
r,
/: PERSEI
JAN. 14-15. 1972 JAN. 1I-17 19792
SPECTRAL INDEX : SPECTRAL INDEX
S-----* - 0. ,0 -
0.21- 1 , "". ..
22 0 2 4UNIVERSAL TIME
6
0.1 f
0.0
0.3
0.2
0.1
0.022 0 2 4
UNIVERSAL TIME6
JAN. 22-23, 1972
S SPECTRAL INDEX0.0[..e.. .-.-, -.--- -" * *
toS
0.
0.
0 (
0.3{-
0.2
0.1
... . .. ............ ......20 22 0 2
UNIVERSAL TIME4
a nI- -- -
S(2695 MHz)
'l ', I' + I' 'I '' l
21
s 2
S(2695 MHz)
O " . ,.
v i ! I • • r •
SS(8085 MHz)
ri r ~ ~ rr rr r~rr .~rr, , 'o ,
, 1t + + 4 +1p * I * p
S(8085 MHz)
. .
..
- 1- +
.i Ir • i v 1 r i ~ .w
S(8085 MHz)
t t t. t !.
. .,•
, , . . ..
li
*.,
i I,-I 1 ,I ~J, 1 - _ _ _ I - AA'
I r ' . ... " L __ "L ' __ '
' . I E • ! s l l .f ! .
.. +
. .
.~ .t /I
t
I .
. .
• ." . .,
iI
S..
1'
...
I .
3
,,""
...• . •
" . ...
..., ..
.. .
r
. i
f .
. . .
- .
...
695 MHz)
O
f:"