Embed Size (px)
Citation preview
Evaluating Social Programs J-PAL, USAID DRG April 10 – 11, 2013

J-PAL, MIT 30 Memorial Drive Cambridge, MA 02142 povertyactionlab.org
Table of Contents Course Schedule...........................................................................................................................1 List of Participants/ Groups........................................................................................................3
Course Material
Case Study 1: Women as Policymakers…….....................................................................5
Case Study 2: Get out the Vote……………..…...................................................................11
Case Study 3: Combating Corruption in Road Construction.......................................22
Exercise: Random Sampling and Law of Large Numbers............................................34
Checklist for Reviewing Randomized Evaluations of Social Programs...................................42
Impact Evaluation Glossary......................................................................................................50

WORKSHOP AGENDA: J-‐PAL, USAID DRG
Workshop on Evaluating DRG Programs, April 10-‐11, 2013
USAID Learning Center, Washington, DC
Wednesday
April 10, 2013
Thursday
April 11, 2013
9:00 – 10:30 Welcoming Remarks
Presentation 1: What is Evaluation, Why Evaluate
(Marc Shotland)
Case Study 3: Evaluation Design
Corruption and Roads
10:30 – 10:45 Coffee Break Coffee Break
10:45 – 12:15 Case study 1: Theory of change and Measuring Outcomes Women as Policymakers
Presentation 4: Defining Development Hypotheses
J-‐PAL’s Governance Initiative (Conner Brannen)
12:30 – 1:30 Lunch Lunch
1:45 – 3:15 Presentation 2: Impact Evaluation Methods
(Marc Shotland)
Presentation 5: From Evidence to Policy
(Iqbal Dhaliwal)
3:15 – 3:45 Coffee Break Coffee Break
3:45 – 5:00 Case Study 2 and Exercise: Why Randomize Get Out the Vote
Closing Remarks
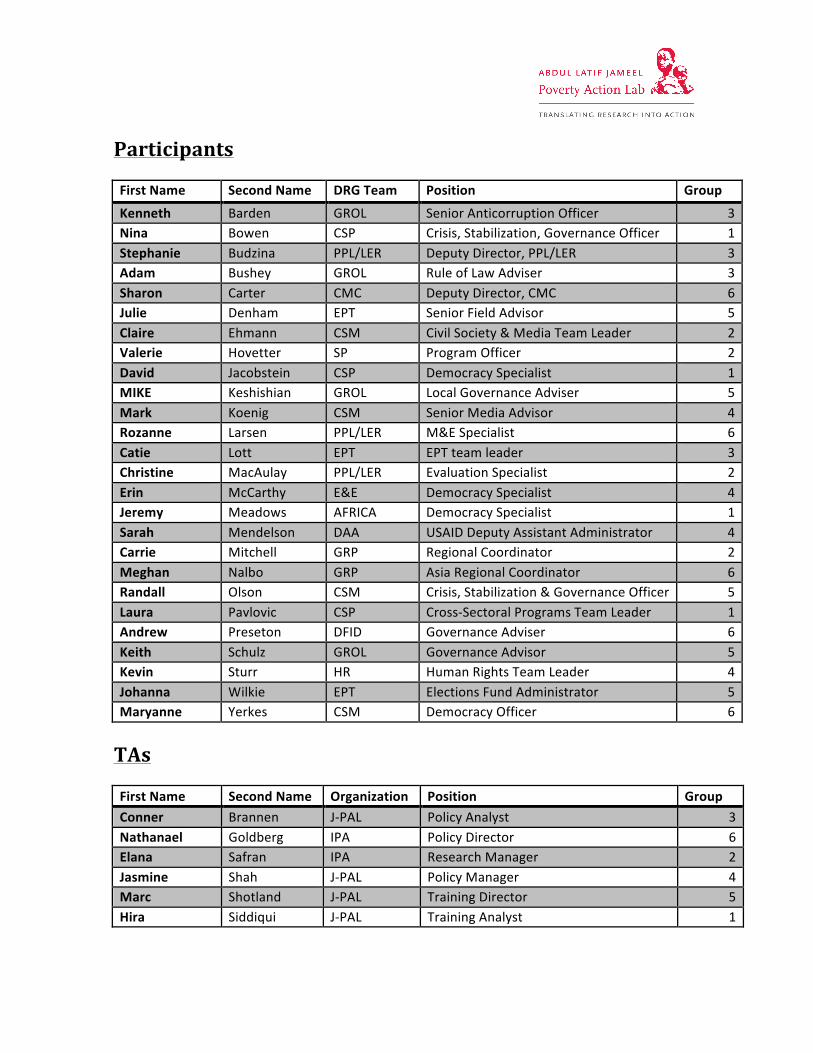
Participants First Name Second Name DRG Team Position Group
Kenneth Barden GROL Senior Anticorruption Officer 3 Nina Bowen CSP Crisis, Stabilization, Governance Officer 1 Stephanie Budzina PPL/LER Deputy Director, PPL/LER 3 Adam Bushey GROL Rule of Law Adviser 3 Sharon Carter CMC Deputy Director, CMC 6 Julie Denham EPT Senior Field Advisor 5 Claire Ehmann CSM Civil Society & Media Team Leader 2 Valerie Hovetter SP Program Officer 2 David Jacobstein CSP Democracy Specialist 1 MIKE Keshishian GROL Local Governance Adviser 5 Mark Koenig CSM Senior Media Advisor 4 Rozanne Larsen PPL/LER M&E Specialist 6 Catie Lott EPT EPT team leader 3 Christine MacAulay PPL/LER Evaluation Specialist 2 Erin McCarthy E&E Democracy Specialist 4 Jeremy Meadows AFRICA Democracy Specialist 1 Sarah Mendelson DAA USAID Deputy Assistant Administrator 4 Carrie Mitchell GRP Regional Coordinator 2 Meghan Nalbo GRP Asia Regional Coordinator 6 Randall Olson CSM Crisis, Stabilization & Governance Officer 5 Laura Pavlovic CSP Cross-‐Sectoral Programs Team Leader 1 Andrew Preseton DFID Governance Adviser 6 Keith Schulz GROL Governance Advisor 5 Kevin Sturr HR Human Rights Team Leader 4 Johanna Wilkie EPT Elections Fund Administrator 5 Maryanne Yerkes CSM Democracy Officer 6 TAs First Name Second Name Organization Position Group Conner Brannen J-‐PAL Policy Analyst 3 Nathanael Goldberg IPA Policy Director 6 Elana Safran IPA Research Manager 2 Jasmine Shah J-‐PAL Policy Manager 4 Marc Shotland J-‐PAL Training Director 5 Hira Siddiqui J-‐PAL Training Analyst 1
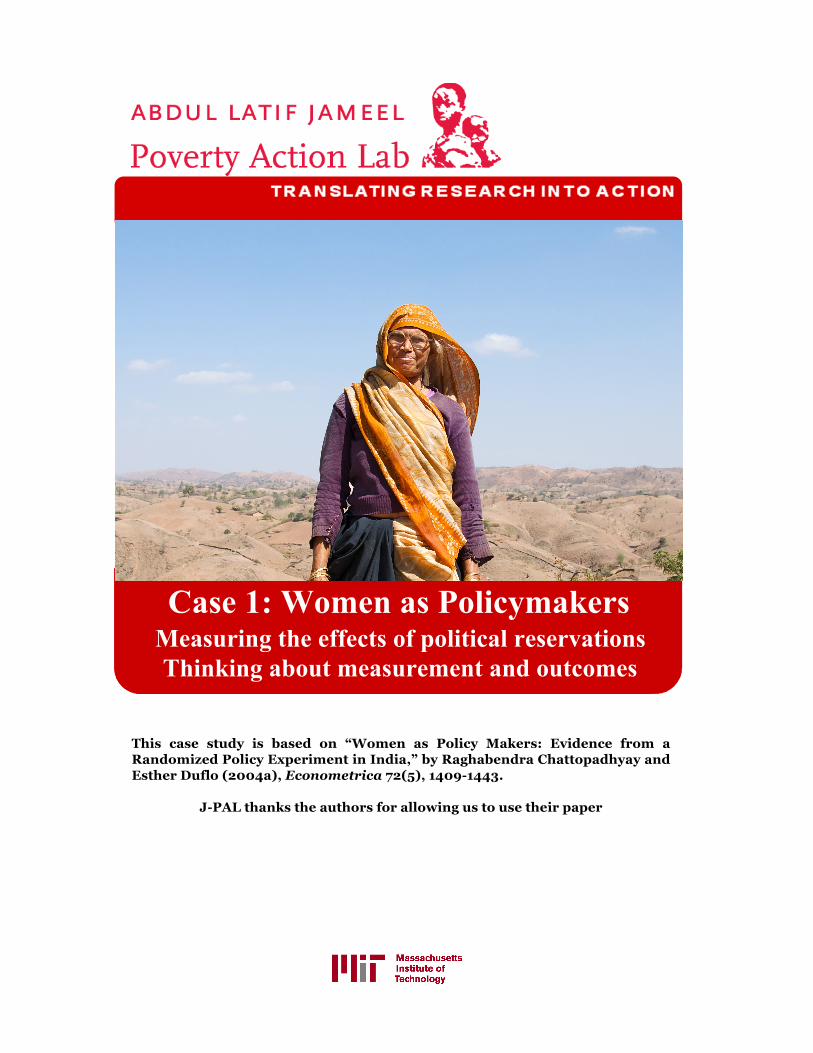
This case study is based on “Women as Policy Makers: Evidence from a Randomized Policy Experiment in India,” by Raghabendra Chattopadhyay and Esther Duflo (2004a), Econometrica 72(5), 1409-1443.
J-PAL thanks the authors for allowing us to use their paper
Case 3: Women as Policymakers
Measuring the effects of political reservations
Thinking about measurement and outcomes
Case 1: Women as Policymakers
Measuring the effects of political reservations
Thinking about measurement and outcomes
J-PAL Executive Education Course Case Study 1: Women as Policymakers
Key Vocabulary
India amended its federal constitution in 1992, devolving power over local development programs from the states to rural councils, or Gram Panchayats (Village Councils). The Village Councils now choose what development programs to undertake and how much of the budget to invest in them. The states are also required to reserve a third of Village Council seats and Village Council chairperson positions for women. In most states, the schedule on which different villages must reserve seats and positions is determined randomly. This creates the opportunity to rigorously assess the impact of quotas on politics and government: Do the policies differ when there are more women in government? Do the policies chosen by women in power reflect the policy priorities of women? Since randomization was part of the Indian government program itself, the evaluation planning centered on collecting the data needed to measure impact. The researchers’ questions were what data to collect and what data collection instruments to use.
Empowering the Panchayati Raj Village Councils, known locally as Panchayats, have a long tradition in rural India. Originally, panchayats were assemblies (yat) of five (panch) elders, chosen by the community, convened to mediate disputes between people or villages. In modern times Village Councils have been formalized into institutions of local self-government, and are no longer limited to only “five elders”. This formalization came about through the constitution. In 1992, India enacted the 73rd amendment, which directed the states to establish a three-tier Panchayati Raj system. The Village Council is the grassroot unit1 of this system, each council consisting of councilors elected every five years. The councilors elect from among themselves a council chairperson called a Pradhan. Decisions are made by a majority vote and the chairperson has no veto power. But as the only councilor with a full-time appointment, the chairperson wields effective power. The 73rd amendment aimed to decentralize the delivery of public goods and services essential for development in rural areas. The states were directed to delegate the power to plan and implement local development programs to the Village Councils. Funds still come from the central government but are no longer earmarked for specific uses. Instead, the Village Council decides which programs to implement and 1 Village councils, called Gram Panchayats, form the basic units of the Panchayat Raj. Village council chairs, elected by the members of the village council, serve as members of the block—subdistrict—council (panchayat samiti). At the top of the system is the district council (zilla parishad) made up of the block council chairs.
1. Hypothesis: a proposed explanation of and for the effects of a given intervention. Hypotheses are intended to be made ex-ante, or prior to the implementation of the intervention. 2. Indicators: metrics used to quantify and measure specific short-term and long-term effects of a program. 3. Logical Framework: a management tool used to facilitate the design, execution, and evaluation of an intervention. It involves identifying strategic elements (inputs, outputs, outcomes and impact) and their causal relationships, indicators, and the assumptions and risks that may influence success and failure. 4. Theory of Change: describes a strategy or blueprint for achieving a given long-term goal. It identifies the preconditions, pathways and interventions necessary for an initiative's success.
J-PAL Executive Education Course Case Study 1: Women as Policymakers
how much to invest in them. As of 2005, Village Councils can chose programs from 29 specified areas, including welfare services (for example, public assistance for widows, care for the elderly, maternity care, antenatal care, and child health) and public works (for example, drinking water, roads, housing, community buildings, electricity, irrigation, and education). Empowering women in the Panchayati Raj The population covered by a single Village Council can be large and diverse. In West Bengal, for example, each council represents up to 12 villages and up to 10,000 people, who can vary by religion, ethnicity, caste, and, of course, gender. Political voice varies by group identities drawn along these lines. If policy preferences vary by group identity and if the councilors’ identities influence policy choices, then groups underrepresented in politics and government could be shut out as Village Councils could ignore those groups’ policy priorities. There were fears that the newly empowered Village Councils would undermine the development priorities of traditionally marginalized groups, such as low-caste members or women. To remedy this, the 73rd amendment included two mandates to ensure that investments reflected the needs of everyone in the Village Council. The first mandate secures community input. If Village Council investments are to reflect a community’s priorities, the councilors must first know what those priorities are. Accordingly, Village Councils are required to hold a general assembly every six months or every year to report on activities in the preceding period and to submit the proposed budget to the community for ratification. In addition, the Chairpersons are required to set up regular office hours to allow constituents to formally request services and lodge complaints. Both requirements allow constituents to articulate their policy preferences. The second mandate secures representation in the council for women. States are required to reserve at least a third of all council seats and Chairperson positions for women. Furthermore, states must ensure that the seats reserved for women are “allotted by rotation to different constituencies in a Panchayat [Village Council]” and that the chairperson positions reserved for women are “allotted by rotation to different Panchayats [Village Councils].” In other words, they have to ensure that reserved seats and chairperson positions rotate evenly within and across the Village Councils. 2
2 There were also reserved quotas for disadvantaged castes. The formula to determine caste-based quotas was more complicated given the varying composition of castes in different villages. Simultaneous research on the impact of these caste-based quotas was conducted, but is not discussed here.

J-PAL Executive Education Course Case Study 1: Women as Policymakers
Randomized quotas in India: What can it teach us? Your evaluation team has been entrusted with the responsibility to estimate the impact of quotas for women in the Village Councils. Your evaluation should address all dimensions in which quotas for women are changing local communities in India. What could these dimensions be? What data will you collect? What instruments will you use? As a first step you want to understand all you can about the quota policy. What needs did it address? What are the pros and cons of the policy? What can we learn from it?
What data to collect, What questions to answer? First, you need to be very clear about the likely impact of the program. It is on those dimensions that you believe will be affected that you will try to collect data. What are the main areas in which the quota policy should be evaluated? In which areas do you expect to see a difference as a result of quotas? What are all the possible effects of quotas?
Discussion Topic 1: Gender quotas in the Village Councils
1. What were the main goals of the Village Councils? 2. Women are underrepresented in politics and government. Only 10 percent of
India’s national assembly members are women, compared to 17 percent worldwide. Does it matter that women are underrepresented? Why and why not?
3. What were the framers of the 73rd amendment trying to achieve when they introduced quotas for women?
Gender quotas have usually been followed by dramatic increases in the political representation of women. Rwanda, for example, jumped from 24th place in the “women in parliament” rankings to first place (49 percent) after the introduction of quotas in 1996. Similar changes have been seen in Argentina, Burundi, Costa Rica, Iraq, Mozambique, and South Africa. Indeed, as of 2005, 17 of the top 20 countries in the rankings have quotas. Imagine that your group is the national parliament of a country deciding whether to adopt quotas for women in the national parliament. Randomly divide your group into two parties, one against and one for quotas.
Discussion Topic 2: Using a logical framework to delineate your intermediate and final outcomes of interest
1. Brainstorm the possible effects of quotas, both positive and negative.
2. What evidence would you collect to strengthen the case of those who are for or against quotas? For each potential effect on your list, list also the indicator(s) you would use for that effect. For example, if you say that quotas will affect political participation of women, the indicator could be “number of women attending the General Assembly.”
J-PAL Executive Education Course Case Study 1: Women as Policymakers
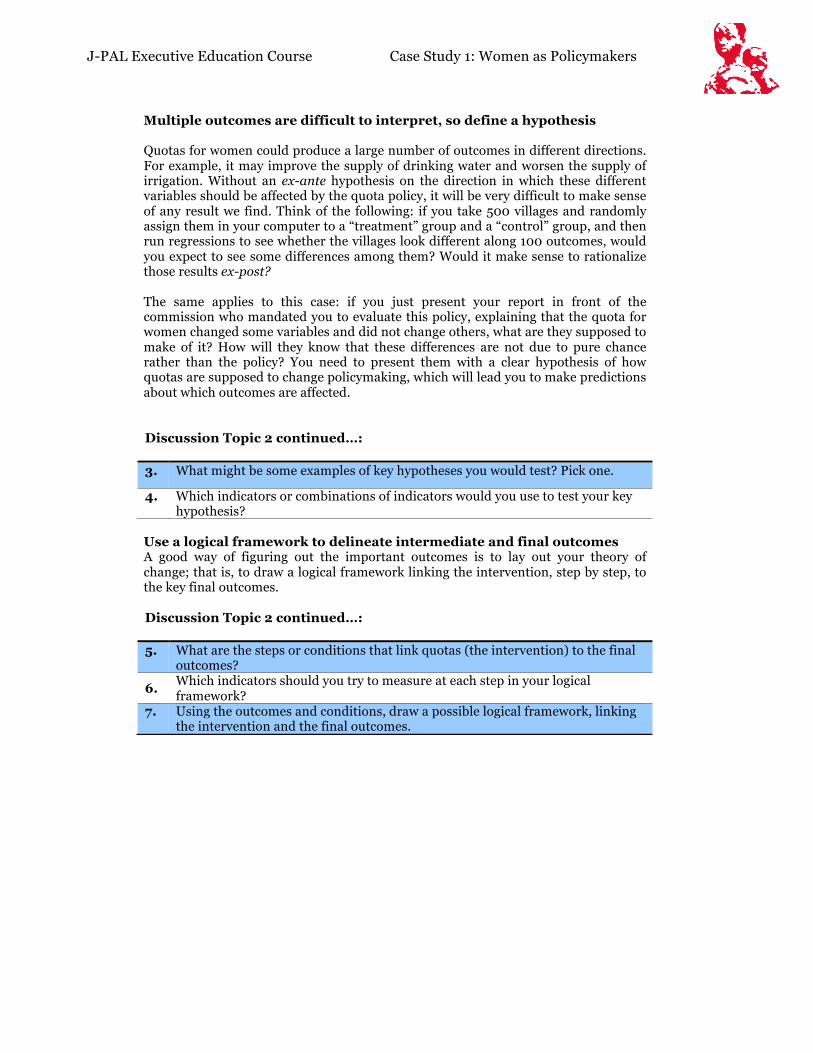
Multiple outcomes are difficult to interpret, so define a hypothesis Quotas for women could produce a large number of outcomes in different directions. For example, it may improve the supply of drinking water and worsen the supply of irrigation. Without an ex-ante hypothesis on the direction in which these different variables should be affected by the quota policy, it will be very difficult to make sense of any result we find. Think of the following: if you take 500 villages and randomly assign them in your computer to a “treatment” group and a “control” group, and then run regressions to see whether the villages look different along 100 outcomes, would you expect to see some differences among them? Would it make sense to rationalize those results ex-post? The same applies to this case: if you just present your report in front of the commission who mandated you to evaluate this policy, explaining that the quota for women changed some variables and did not change others, what are they supposed to make of it? How will they know that these differences are not due to pure chance rather than the policy? You need to present them with a clear hypothesis of how quotas are supposed to change policymaking, which will lead you to make predictions about which outcomes are affected.
Use a logical framework to delineate intermediate and final outcomes A good way of figuring out the important outcomes is to lay out your theory of change; that is, to draw a logical framework linking the intervention, step by step, to the key final outcomes.
Discussion Topic 2 continued…:
3. What might be some examples of key hypotheses you would test? Pick one.
4. Which indicators or combinations of indicators would you use to test your key hypothesis?
Discussion Topic 2 continued…:
5. What are the steps or conditions that link quotas (the intervention) to the final outcomes?
6. Which indicators should you try to measure at each step in your logical framework?
7. Using the outcomes and conditions, draw a possible logical framework, linking the intervention and the final outcomes.
Case 1 voteDo phone calls to encourage voting work
Why randomi
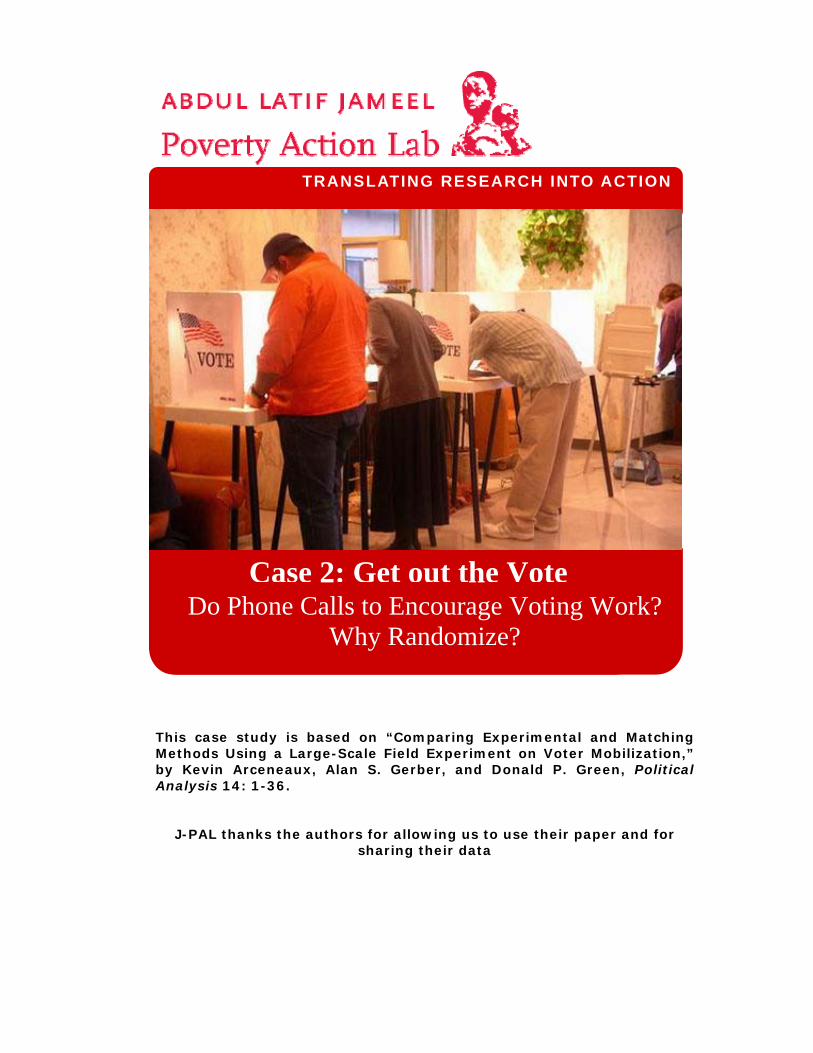
This case study is based on “Comparing Experimental and Matching Methods Using a Large-Scale Field Experiment on Voter Mobilization,” by Kevin Arceneaux, Alan S. Gerber, and Donald P. Green, Political Analysis 14: 1-36.
J-PAL thanks the authors for allowing us to use their paper and for sharing their data
TRANSLATING RESEARCH INTO ACTION
Case 2: Get out the VoteDo Phone Calls to Encourage Voting Work?
Why Randomize?
Case 3 – Get out the Vote
Key Vocabulary
In late 2002, a non-partisan civic group Vote 2002 Campaign ran a get-out-the-vote initiative to encourage voting in that year’s U.S. congressional elections. In the 7 days preceding the election, Vote 2002 placed 60,000 phone calls to potential voters, encouraging them to “come out and vote” on election day. Did the program work? How can we estimate its impact?
Voterturnoutwasindeclinesincethe1960sWhile voter turnout (the number of eligible voters that participate in an election) was declining since the 1960s, it was particularly low in the 1998 and 2000 U.S. elections. Only 47 percent of eligible voters voted in the 2000 congressional and presidential elections; the record low was 35 percent in the 1998 mid-term elections. Vote2002get‐out‐the‐voteCampaignFacing the 2002 midterm election and fearing another low turnout, civic groups in Iowa and Michigan launched the Vote 2002Campaign to boost voter turnout. In the week preceding the election, Vote 2002 volunteers placed phone calls to 60,000 voters and gave them the following message:
1. Counterfactual: What would have happened to the participants in an intervention had they not received the intervention. The counterfactual cannot be observed from the treatment group; can only be inferred from the comparison group. 2. Comparison Group: A group that is meant to “represent” the counterfactual. In an experimental design, the comparison group (control group) is a randomly assigned group from the same population that is not intended to receive the intervention. 3. Impact: the true impact of the intervention is the difference in outcomes between the treatment group and its counterfactual. This is estimated by measuring the difference in outcomes between treatment and comparison groups. 4. Omitted Variable Bias: statistical bias that occurs when certain variables/characteristics (often unobservable), which are correlated with both the primary outcome and a variable of interest (e.g. participation in an intervention), are omitted from a regression analysis. Because these variables are not included as controls in the regression, one incorrectly attributes the measured impact solely to the program. 5. Selection Bias: a type of omitted variable bias in which individuals who participate in a program are systematically different from those who don’t, and those differences are correlated with the outcome. This can occur when the treatment group is made of deliberately (non-randomly) chosen individuals (either self-selected, or selected by another).
Hello,mayIspeakwith[Mrs.IdaCook]please?Hi.Thisis[Carmen Campbell] calling from Vote 2002, a non‐partisaneffortworkingtoencouragecitizenstovote.Wejustwanted to remindyou thatelectionsarebeingheldthisTuesday.The success of our democracydepends onwhetherweexerciseourrighttovoteornot,sowehopeyou'llcomeoutandvotethisTuesday.CanIcountonyoutovotenextTuesday?As telemarketing replaces more traditional face-to-face campaigning, such as door-to-door canvassing, there is considerable debate over its effectiveness. Many believe the decline in voter turnout is a direct result of changing campaign practices. It is therefore worth asking in this context, did the Vote 2002 Campaign work? Did it increase voter turnout at the 2002 congressional elections?
DidtheVote2002Campaignwork?What is required in order for us to measure whether a program worked, whether it had impact? In general, to ask if an intervention works is to ask if it achieves its goal of changing certain outcomes for its participants, and ensure that those changes are not caused by some other factors or events happening at the same time. To show that the intervention causes the observed changes, we need to simultaneously show that if it had not been implemented, the observed changes would not have occurred (or would be different). But how do we know what would have happened? If the intervention happened, it happened. Measuring what would have happened requires entering an imaginary world in which the intervention was never introduced to this group. The outcomes of this group in this imaginary world are referred to as thecounterfactual. Since we cannot observe the true counterfactual, the best we can do is to estimate it by constructing (“mimicking”) it. The key challenge of impact evaluation is constructing thecounterfactual. We typically do this by selecting a group of people that resemble the participants as much as possible but who did not participate in the intervention. This group is called the comparison group. Because we want to be able to say that it was the intervention and not some other factor that caused the changes in outcomes, it is important that the only difference between the comparison group and the participants is that the comparison group did not participate in the intervention. We then estimate “impact” as the difference in outcomes observed at the end of the intervention between the comparison group and the participants. The impact estimate is only as accurate as the comparison group is successful at mimicking the counterfactual. If the comparison group poorly represents the counterfactual, the impact is poorly estimated.

Case 3 – Get out the Vote
Therefore the method used to select the comparison group is a key decision in the design of any impact evaluation. That brings us back to our questions: Did the Vote 2002 Campaign work? What was its impact on voter turnout? Vote 2002had access to a list of the telephone numbers of 60,000 people. They called all 60,000, but they were able to speak to only 25,000. For each call, they recorded whether or not the call was completed successfully. They also had census data on the voter’s age, gender, household size, whether the voter was newly registered, which state and district the voter was from and data on how competitive the previous election was in that district, and whether the individual had voted in the past. Afterwards, from official voting records, they were able to determine whether, in the end, the voters they had called did actually go out and vote. What comparison groups can we use? The following experts illustrate different methods of evaluating impact. (Refer to the table on the last page of the case for a list of different evaluation methods). Method1:News Release: Vote 2002 Campaign is a huge success
“In 1998, during the last congressional elections, fewer than half of registered voters in Iowa and Michigan showed up on Election Day. This reflects national trends of declining voter turnout. The get-out-the-vote
campaign was organized to reverse this trend. And was it ever successful! For the people we called, we saw an 18 percentage point increase in voter turnout.” Discussion Topic 1: What type of evaluation does this news release imply? What represents the counterfactual? What are the problems with this type of evaluation? Method2:
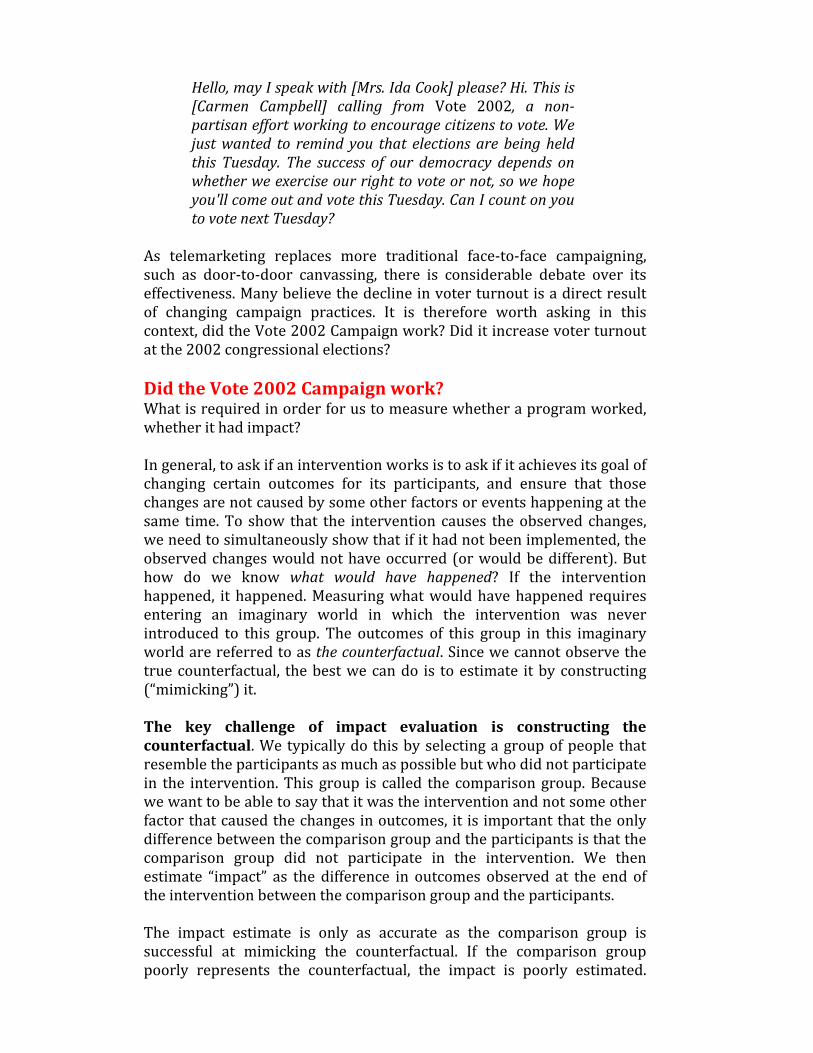
Opinion:Get‐out‐the‐voteprogram‐goodbutnotgreatIn a recent news release, the Vote 2002 Campaign claimed to be able to increase voter turnout by nearly 20 percentage points. These estimates are significantly inflated. They are looking at the people they talked to, measuring changes in their rates of voting over time, and attributing the entire difference to their campaign. They are ignoring the possibility that these changes reflect increased political awareness in the country at large, perhaps the result of a declining economy, and escalating concerns over national security. If we compare people who were reached by the campaign’s phone calls to those who weren’t—both groups that were affected by these national events, and incidentally, both of whom reached the polls in greater numbers this time—we find that the actual impact of the program is 11 percentage points, rather than 18.
Discussion Topic 2:
1. What type of evaluation is this opinion piece employing? 2. What represents the counterfactual? 3. What are the problems with this type of evaluation?
Case 3 – Get out the Vote
Method3:
Editorial: If you haven’t been paying close attention, you may have missed the public spat over the effectiveness of the Vote 2002, get-out-the-vote (GOTV) campaign. Campaign organizers claimed to have increased voter turnout by twenty percentage points. An opposing commentator wrote an opinion piece suggesting the impact is it’s closer to half that. However, both analyses managed to get it wrong. The first is wrong in that it doesn’t use a comparison group, and simply observes changes in voting patterns. The second uses the wrong metric to measure impact. Voting campaigns are meant to bring new voters to the polls, not simply talk to those who vote anyway. The opposing analyst compares the voter turnout among those who were reached with other people who were not reached. Many of those they called were already voting in the prior elections. The analysis should therefore measure improvement in voting rates—not the final level. This also helps control for the fact that these two groups had different voting rates in prior elections. When we repeated the analysis using the more-appropriate outcome measure, we find voting rates for those who were reached improved only marginally compared to those not reached (a 10.9 percentage point increase compared to 9 percentage point increase). This 1.9 percentage point difference is still statistically significant, but marginal relative to the other analyses. Had these evaluators thought to look at the more appropriate outcome, they would recognize that the get-out-the-vote program is not only less successful than it reports, but less successful than even its detractors claim!
Discussion Topic 3: 1. What type of evaluation is this opinion piece employing? 2. What represents the counterfactual? 3. What are the problems with this type of evaluation?
Method4:Regression
Report:Thenumbersdon’tlie,unlessyourstatisticiansareasleepGet-out-the-vote program celebrates victory, estimating a large percentage point improvement in voting rates. Others show almost no impact. A closer look shows that, the truth, as usual, is somewhere in between. This report uses sophisticated statistical methods to measure the true impact of this campaign. We were concerned about other variables confounding previous results, such as age, and household size. For example, it is entirely possible that senior citizens are more likely to vote and more likely to answer the phone. If the group that answered the phone is older on average, then we may expect them to vote at higher rates than those

who didn’t answer the phone. Indeed, those who answered the phone were on average 56 years old, while those who didn’t were 51. To observe the possible bias caused by omitting key variables, we conducted one analysis without controlling for these differences, and one with controls. This also allowed us to obtain the true impact of the campaign.
Dependent Variable: Voted in 2002
Reached vs. Not-Reached Reached vs. Not-Reached
Reached 0.1085 * 0.0462 *(0.0041) (0.0035)
Treated
Age 0.0026 *(0.0001)
Household Size 0.0634 *(0.0035)
Female -0.0091 (0.0035)
Newly registered 0.0729 *(0.0065)
From Iowa -0.0564 *(0.0037)
In a competitive district 0.0334 *(0.0034)
Voted in 2000 0.3941 *(0.0041)
Voted in 1998 0.2134 *(0.0041)
Constant 0.5364 -0.0158 (0.0026) (0.0087)
Observations 59972 59972
Looking at above table, we find that the estimate falls by almost 6 percentage points when we control for the appropriate characteristics, showing that most of the change in outcome is being driven by all these other differences between the two groups. This suggests that for every 60 people who were called, and every 25 people who answered the phone, roughly one more person voted. At first glance, that may not appear impressive. But the other way to look at it is: the entire campaign convinced nearly 1,150 more voters to vote. As we saw in the last election, that is more than enough to tip the balance one direction or the other.
Discussion Topic 4: 1. What type of evaluation is this opinion piece employing? 2. What represents the counterfactual? 3. What are the problems with this type of evaluation?
Case 3 – Get out the Vote
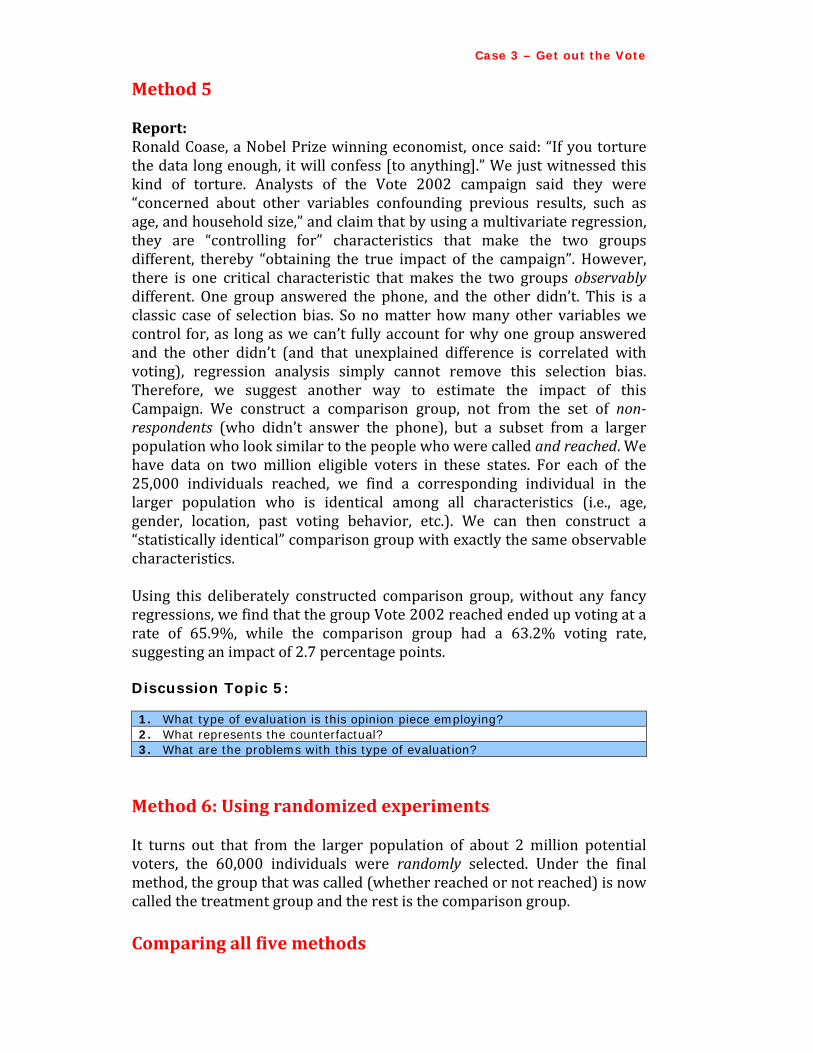
Method5 Report:Ronald Coase, a Nobel Prize winning economist, once said: “If you torture the data long enough, it will confess [to anything].” We just witnessed this kind of torture. Analysts of the Vote 2002 campaign said they were “concerned about other variables confounding previous results, such as age, and household size,” and claim that by using a multivariate regression, they are “controlling for” characteristics that make the two groups different, thereby “obtaining the true impact of the campaign”. However, there is one critical characteristic that makes the two groups observablydifferent. One group answered the phone, and the other didn’t. This is a classic case of selection bias. So no matter how many other variables we control for, as long as we can’t fully account for why one group answered and the other didn’t (and that unexplained difference is correlated with voting), regression analysis simply cannot remove this selection bias. Therefore, we suggest another way to estimate the impact of this Campaign. We construct a comparison group, not from the set of non‐respondents (who didn’t answer the phone), but a subset from a larger population who look similar to the people who were called andreached. We have data on two million eligible voters in these states. For each of the 25,000 individuals reached, we find a corresponding individual in the larger population who is identical among all characteristics (i.e., age, gender, location, past voting behavior, etc.). We can then construct a “statistically identical” comparison group with exactly the same observable characteristics. Using this deliberately constructed comparison group, without any fancy regressions, we find that the group Vote 2002 reached ended up voting at a rate of 65.9%, while the comparison group had a 63.2% voting rate, suggesting an impact of 2.7 percentage points. Discussion Topic 5: 1. What type of evaluation is this opinion piece employing? 2. What represents the counterfactual? 3. What are the problems with this type of evaluation? Method6:UsingrandomizedexperimentsIt turns out that from the larger population of about 2 million potential voters, the 60,000 individuals were randomly selected. Under the final method, the group that was called (whether reached or not reached) is now called the treatment group and the rest is the comparison group. Comparingallfivemethods
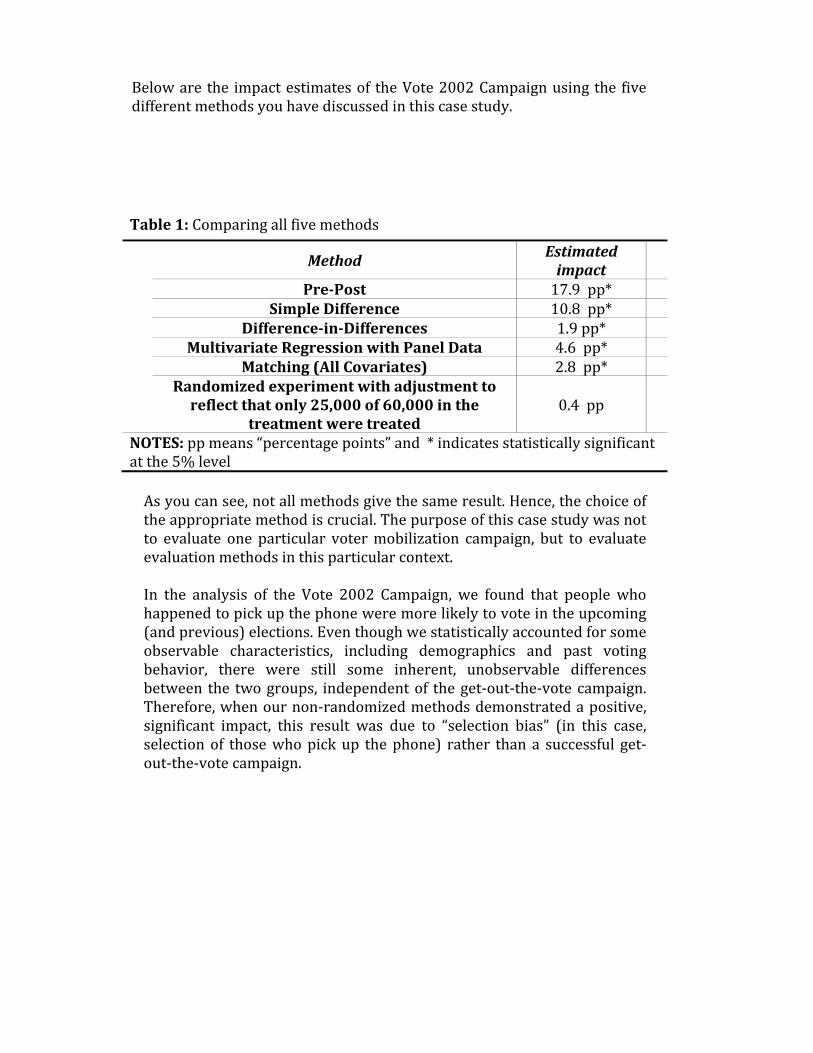
Below are the impact estimates of the Vote 2002 Campaign using the five different methods you have discussed in this case study. Table1: Comparing all five methods Method Estimated
impact
Pre‐Post 17.9 pp* SimpleDifference 10.8 pp*
Difference‐in‐Differences 1.9 pp* MultivariateRegressionwithPanelData 4.6 pp*
Matching(AllCovariates) 2.8 pp* Randomizedexperimentwithadjustmenttoreflectthatonly25,000of60,000inthe
treatmentweretreated0.4 pp
NOTES:pp means “percentage points” and * indicates statistically significant at the 5% level As you can see, not all methods give the same result. Hence, the choice of the appropriate method is crucial. The purpose of this case study was not to evaluate one particular voter mobilization campaign, but to evaluate evaluation methods in this particular context. In the analysis of the Vote 2002 Campaign, we found that people who happened to pick up the phone were more likely to vote in the upcoming (and previous) elections. Even though we statistically accounted for some observable characteristics, including demographics and past voting behavior, there were still some inherent, unobservable differences between the two groups, independent of the get-out-the-vote campaign. Therefore, when our non-randomized methods demonstrated a positive, significant impact, this result was due to “selection bias” (in this case, selection of those who pick up the phone) rather than a successful get-out-the-vote campaign.
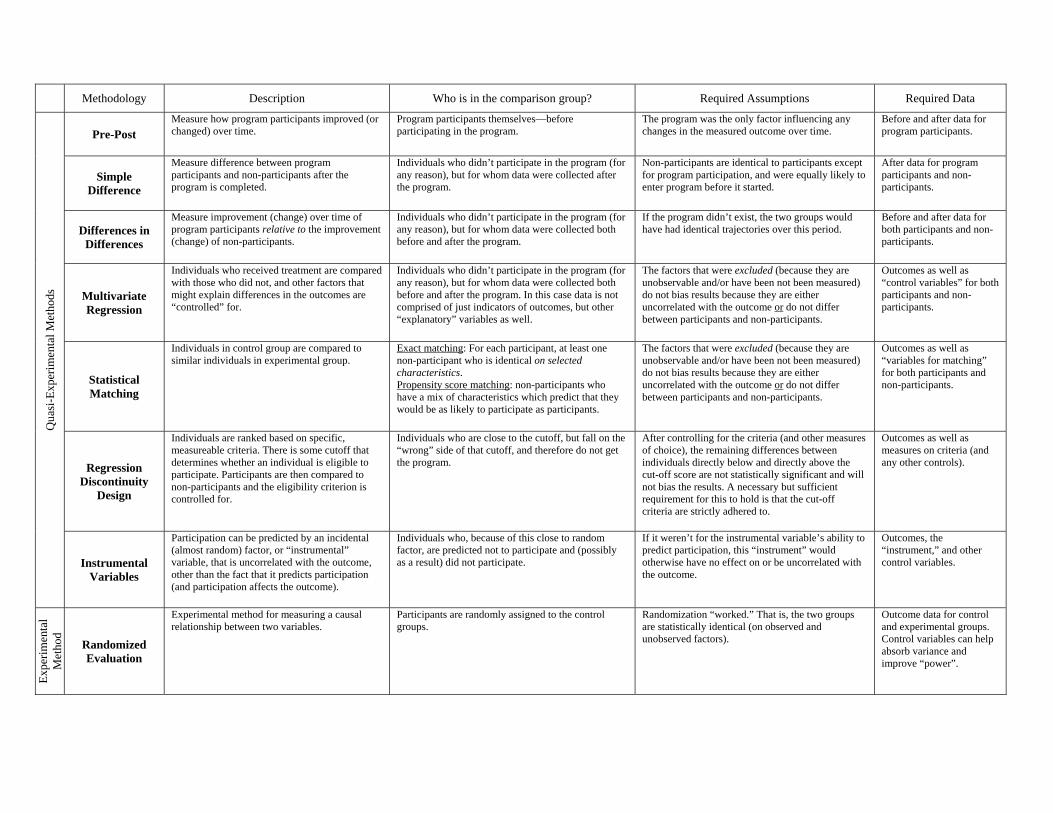
Methodology Description Who is in the comparison group? Required Assumptions Required Data
Qua
si-E
xper
imen
tal M
etho
ds
Pre-Post Measure how program participants improved (or changed) over time.
Program participants themselves—before participating in the program.
The program was the only factor influencing any changes in the measured outcome over time.
Before and after data for program participants.
Simple Difference
Measure difference between program participants and non-participants after the program is completed.
Individuals who didn’t participate in the program (for any reason), but for whom data were collected after the program.
Non-participants are identical to participants except for program participation, and were equally likely to enter program before it started.
After data for program participants and non-participants.
Differences in Differences
Measure improvement (change) over time of program participants relative to the improvement (change) of non-participants.
Individuals who didn’t participate in the program (for any reason), but for whom data were collected both before and after the program.
If the program didn’t exist, the two groups would have had identical trajectories over this period.
Before and after data for both participants and non-participants.
Multivariate Regression
Individuals who received treatment are compared with those who did not, and other factors that might explain differences in the outcomes are “controlled” for.
Individuals who didn’t participate in the program (for any reason), but for whom data were collected both before and after the program. In this case data is not comprised of just indicators of outcomes, but other “explanatory” variables as well.
The factors that were excluded (because they are unobservable and/or have been not been measured) do not bias results because they are either uncorrelated with the outcome or do not differ between participants and non-participants.
Outcomes as well as “control variables” for both participants and non-participants.
Statistical Matching
Individuals in control group are compared to similar individuals in experimental group.
Exact matching: For each participant, at least one non-participant who is identical on selected characteristics. Propensity score matching: non-participants who have a mix of characteristics which predict that they would be as likely to participate as participants.
The factors that were excluded (because they are unobservable and/or have been not been measured) do not bias results because they are either uncorrelated with the outcome or do not differ between participants and non-participants.
Outcomes as well as “variables for matching” for both participants and non-participants.
Regression Discontinuity
Design
Individuals are ranked based on specific, measureable criteria. There is some cutoff that determines whether an individual is eligible to participate. Participants are then compared to non-participants and the eligibility criterion is controlled for.
Individuals who are close to the cutoff, but fall on the “wrong” side of that cutoff, and therefore do not get the program.
After controlling for the criteria (and other measures of choice), the remaining differences between individuals directly below and directly above the cut-off score are not statistically significant and will not bias the results. A necessary but sufficient requirement for this to hold is that the cut-off criteria are strictly adhered to.
Outcomes as well as measures on criteria (and any other controls).
Instrumental Variables
Participation can be predicted by an incidental (almost random) factor, or “instrumental” variable, that is uncorrelated with the outcome, other than the fact that it predicts participation (and participation affects the outcome).
Individuals who, because of this close to random factor, are predicted not to participate and (possibly as a result) did not participate.
If it weren’t for the instrumental variable’s ability to predict participation, this “instrument” would otherwise have no effect on or be uncorrelated with the outcome.
Outcomes, the “instrument,” and other control variables.
Exp
erim
enta
l M
etho
d
Randomized Evaluation
Experimental method for measuring a causal relationship between two variables.
Participants are randomly assigned to the control groups.
Randomization “worked.” That is, the two groups are statistically identical (on observed and unobserved factors).
Outcome data for control and experimental groups. Control variables can help absorb variance and improve “power”.
Case 3: Reducing Inefficiencies in Road Construction How to Randomize?
This case study is based on “Monitoring Corruption: Evidence from a Field Experiment in Indonesia.” By Benjamin Olken, Journal of Political Economy, 2007, vol. 115, no. 2
J-PAL thanks the author for allowing us to use his paper.
TRANSLATING RESEARCH INTO ACTION
Key Vocabulary
Corruption plagues many developing countries where the world’s poorest live, and combating it continues to be an arduous task. It adds significant costs to the provision of public services, often making them inaccessible to those who need it most. Many observers suggest that the right combination of government-‐led monitoring and punishments schemes, such as audit-‐based accountability efforts, can control misappropriation of funds. But often the very individuals tasked with monitoring and enforcing punishments are themselves prone to corruption. Another approach, which has gained prominence in recent years, is to utilize community-‐level monitoring to reduce “leakages.” Local community members have the most to gain from a successful anti-‐corruption program, and are thus believed to have better incentives to appropriately monitor government programs in their locality. However, there is little empirical evidence regarding the effectiveness of such strategies. If community-‐level monitoring is used to combat corruption in government programs, will we see a reduction in leakages? Further, is this approach more effective than to centralized, government-‐led audits? What experimental designs could test the impact of these interventions?
The Kecamatan Development Program (KDP) KDP is an Indonesian Government program established in 1998, supported by a loan from the World Bank. As of 2004, KDP funded projects in approximately 15,000 villages each year. Each village received an average of Rp. 80 million (US$8,800), which they usually used to surface existing dirt roads. KDP-‐funded projects are large relative to ordinary local government activities. In 2001, the average annual village budget was Rp. 71 million (US$7,800), so implementation of a KDP project more
1. Leakages: loss of funds due to corruption 2. Spillovers: individuals in the control group (or those not targeted for
direct treatment) are indirectly affected by the treatment. In economics, these are called externalities. They can also be referred to as “contamination.”
3. Level of Randomization: the level of observation (e.g. individual, household, school, village) at which treatment and control groups are randomly assigned.
than doubled average local government expenditures.
The influx of such a large amount of money through KDP creates opportunities for a high level of leakages.
The Problem of Leakages KDP project implementation teams are often complicit in facilitating program leakages through several methods. The teams may inflate expenditures by, for instance, paying a certain amount for road materials (e.g. rock, gravel, sand), but reporting having paid 50 percent more on official project budgets. Implementation teams may also deflate quantities of reported material procurement. For example, teams claim to procure enough rock, sand, and gravel to make a road that is 20cm thick but instead build a road that is only 15cm thick. Another strategy employed by the teams is to report inflated costs for labor, and/or report expenses for volunteer labor provided by villagers. In each of these examples, the implementation teams pocket the leakages or share them with complicit partners, such as a supplier that produced an inflated receipt to corroborate a false budget report. Ultimately, such practices deteriorate the intended benefits of KDP projects. Leakages may result in insufficient funding for other village priorities and poor-‐quality roads that require expensive ongoing maintenance and do not optimally facilitate local economic development. Program Accountability Structure Two checks on corruption are built into KDP. First, communities are given an official role in monitoring the flow of KDP money going into the village and its utilization. Specifically, KDP funds are disbursed in three installments. To receive the second and third payments, village implementation teams must produce accountability reports and attend an open village meeting where they present how the previous installment was spent. Only after village members approve accountability reports at the meeting is the next payment released. Though it is difficult to identify deflated quantities through this approach, it can be particularly useful to catch over-‐reporting of the cost of materials and labor, given that people in the village are typically aware of market prices and wages. Critically, however, in practice only village leaders who control project funds are likely to attend the accountability meetings. Many of these leaders may be complicit in siphoning off project funds through kickbacks.
Second, each project is subject to audits by an independent agency within the central government to scrutinize expenditure reports and monitor the quality of roads constructed, and to punish culprits where appropriate. While legal prosecution is rare, officials found to have stolen money are forced to publicly return the money, which can result in shame and substantial social sanctions. Further, the village would be less likely to win KDP projects in the future. However, many distrust the willingness and ability of the independent auditors to uphold accountability controls. Indeed, they are often complicit in corruption. For example, the auditors may accept bribes from the implementation team or village leader. Notably, even in the absence of auditor corruption, projects had only about a four percent chance of being audited by the government. Overall, in spite of measures to promote accountability, corruption accounted for a large percent of reported project expenses. Proposed Interventions I. Stimulating Community Participation Many policymakers and researchers believe that social sanctions wield a lot of power over the behavior of decision-‐makers. In the case of KDP, social sanctions could potentially be harnessed by making the village accountability meetings more inclusive and democratic, and hence more effective in catching any misappropriation of funds. However, two barriers may be obstructing community participation: (a) villagers are not aware of accountability meetings, or believe they are not invited; (b) fear of retaliation stops potential “whistle blowers” from exposing questionable activities. Researchers therefore proposed two interventions: Invitations: Invitations to accountability meetings would be distributed throughout the community, encouraging direct participation in the monitoring process and reducing elite capture of the process. There were two methods of distributing invitations: (a) by sending them home with school children and (b) by asking the heads of hamlets and neighborhood associations to distribute them throughout their respective village areas. Comment cards: An anonymous comment form would be distributed along with the invitations, providing villagers an opportunity to relay information about the project to be shared at the meetings, without fear of retaliation. II. Increasing the Probability of Audits The effectiveness of audits at reducing leakages is likely tied to the probability of being audited. With only four percent of KDP projects being audited, implementation teams and village leaders are quite willing to take the risk of
misappropriating funds. To test this assumption, researchers proposed the following: after funds are awarded, but before construction begins, villages would be told that their project would be audited by a government agency with 100 percent certainty. These audits would carry the possibility of criminal action for perpetrators. To harness the potential power of social sanctions, the results of the audits would be read publicly at an open village meeting. Addressing Key Experimental Issues through Evaluation Design: To examine the role of enhanced community monitoring and government audits on leakages, researchers conducted a randomized evaluation in 608 villages (in 156 subdistricts) in East Java and Central Java, Indonesia’s most populous provinces. Each village in the study was about to start building a village road with KDP funding. There was a concern that the audit treatment might be likely to spill over from one village to another, since officials in other villages might worry that when the auditors came to the subdistrict, their villages might be audited as well. The participation treatments, however, would be less likely to have similar spillover effects, since the treatment was directly observable in the different villages early on. What randomization strategies could be used to evaluate the following questions? How would you design the study? Who would be in the treatment and control groups, and how would they be randomly assigned to these groups? What is the appropriate level of randomization? How would you control for spillovers? Discussion Topic 1: Testing the effectiveness of audits
1. How would you determine the relative effectiveness of a 100% chance of audit versus only 4% chance of audit?
Discussion Topic 2: Testing the effectiveness of community involvement
1. How would you determine the effectiveness of meeting invitations?
2. How would you determine the relative effectiveness of distributing invitations by sending them home with school children, versus asking the heads of hamlets and neighborhood associations to distribute them throughout their areas of the village?
3. How would you determine the relative effectiveness of comment cards versus the status quo accountability meetings?
Discussion Topic 3: Addressing all questions with a single evaluation
1. Could a single evaluation explore all these issues at once?
2. What comparisons could be made and what would the interpretation be?

Exercise A: Understanding random sampling and the law of large numbers In this exercise, we will visually explore random samples of different sizes from a given population. In particular, we will try to demonstrate that larger sample sizes tend to be more reflective of the underlying population.
1) Open the file “Exercise A_SamplingDistributions.xlsm”.
2) If prompted, select “Enable Macros”.
3) Navigate to the “Randomize” worksheet, which allows you to choose a random sample of size “Sample Size” from the data contained in the “control” worksheet.
4) Enter “10” for “Sample Size and click the “Randomize” button. Observe the distribution
of the various characteristics between Treatment, Control and Expected. With a sample size this small, the percentage difference from the expected average is quite high for reading scores. Click “Randomize” multiple times and observe how the distribution changes.
5) Now, try “50” for the sample size. What happens to the distributions? Randomize a few
times and observe the percentage difference for the reading scores.
6) Increase the sample size to “500”, “2000” and “10000”, and repeat the observations from step 5. What can we say about larger sample sizes? How do they affect our Treatment and Control samples? Should the percentage difference between Treatment, Control and Expected always go down as we increase sample size?

Checklist For Reviewing a Randomized Controlled Trial of a Social Program or Project, To Assess Whether It Produced Valid Evidence

Updated February 2010 This publication was produced by the Coalition for Evidence-Based Policy, with funding support from the William T. Grant Foundation, Edna McConnell Clark Foundation, and Jerry Lee Foundation. This publication is in the public domain. Authorization to reproduce it in whole or in part for educational purposes is granted. We welcome comments and suggestions on this document ([email protected]).
2

3
Checklist For Reviewing a Randomized Controlled Trial of a Social Program or Project, To Assess Whether It Produced Valid Evidence
This is a checklist of key items to look for in reading the results of a randomized controlled trial of a social program, project, or strategy (“intervention”), to assess whether it produced valid evidence on the intervention’s effectiveness. This checklist closely tracks guidance from both the U.S. Office of Management and Budget (OMB) and the U.S. Education Department’s Institute of Education Sciences (IES)1; however, the views expressed herein do not necessarily reflect the views of OMB or IES. This checklist limits itself to key items, and does not try to address all contingencies that may affect the validity of a study’s results. It is meant to aid – not substitute for – good judgment, which may be needed for example to gauge whether a deviation from one or more checklist items is serious enough to undermine the study’s findings. A brief appendix addresses how many well-conducted randomized controlled trials are needed to produce strong evidence that an intervention is effective.
Checklist for overall study design
Random assignment was conducted at the appropriate level – either groups (e.g., classrooms,
housing projects), or individuals (e.g., students, housing tenants), or both.
Random assignment of individuals is usually the most efficient and least expensive approach. However, it may be necessary to randomly assign groups – instead of, or in addition to, individuals – in order to evaluate (i) interventions that may have sizeable “spillover” effects on nonparticipants, and (ii) interventions that are delivered to whole groups such as classrooms, housing projects, or communities. (See reference 2 for additional detail.2)
The study had an adequate sample size – one large enough to detect meaningful effects of the intervention.
Whether the sample is sufficiently large depends on specific features of the intervention, the sample population, and the study design, as discussed elsewhere.3 Here are two items that can help you judge whether the study you’re reading had an adequate sample size: If the study found that the intervention produced statistically-significant effects (as discussed
later in this checklist), then you can probably assume that the sample was large enough. If the study found that the intervention did not produce statistically-significant effects, the
study report should include an analysis showing that the sample was large enough to detect meaningful effects of the intervention. (Such an analysis is known as a “power” analysis.4)
Reference 5 contains illustrative examples of sample sizes from well-conducted randomized controlled trials conducted in various areas of social policy.5

Checklist to ensure that the intervention and control groups remained equivalent
during the study
The study report shows that the intervention and control groups were highly similar in key
characteristics prior to the intervention (e.g., demographics, behavior).
If the study asked sample members to consent to study participation, they provided such consent before learning whether they were assigned to the intervention versus control group.
If they provided consent afterward, their knowledge of which group they are in could have affected their decision on whether to consent, thus undermining the equivalence of the two groups.
Few or no control group members participated in the intervention, or otherwise benefited from
it (i.e., there was minimal “cross-over” or “contamination” of controls).
The study collected outcome data in the same way, and at the same time, from intervention and control group members.
The study obtained outcome data for a high proportion of the sample members originally
randomized (i.e., the study had low sample “attrition”).
As a general guideline, the studies should obtain outcome data for at least 80 percent of the sample members originally randomized, including members assigned to the intervention group who did not participate in or complete the intervention. Furthermore, the follow-up rate should be approximately the same for the intervention and the control groups. The study report should include an analysis showing that sample attrition (if any) did not undermine the equivalence of the intervention and control groups.
The study, in estimating the effects of the intervention, kept sample members in the original group to which they were randomly assigned. This even applies to:
Intervention group members who failed to participate in or complete the intervention (retaining
them in the intervention group is consistent with an “intention-to-treat” approach); and
Control group members who may have participated in or benefited from the intervention (i.e., “cross-overs,” or “contaminated” members of the control group).6
Checklist for the study’s outcome measures
The study used “valid” outcome measures – i.e., outcome measures that are highly correlated
with the true outcomes that the intervention seeks to affect. For example:
Tests that the study used to measure outcomes (e.g., tests of academic achievement or psychological well-being) are ones whose ability to measure true outcomes is well-established.
4

If sample members were asked to self-report outcomes (e.g., criminal behavior), their reports were corroborated with independent and/or objective measures if possible (e.g., police records).
The outcome measures did not favor the intervention group over the control group, or vice-versa.
For instance, a study of a computerized program to teach mathematics to young students should not measure outcomes using a computerized test, since the intervention group will likely have greater facility with the computer than the control group.7
The study measured outcomes that are of policy or practical importance – not just
intermediate outcomes that may or may not predict important outcomes.
As illustrative examples: (i) the study of a pregnancy prevention program should measure outcomes such as actual pregnancies, and not just participants’ attitudes toward sex; and (ii) the study of a remedial reading program should measure outcomes such as reading comprehension, and not just the ability to sound out words.
Where appropriate, the members of the study team who collected outcome data were
“blinded” – i.e., kept unaware of who was in the intervention and control groups.
Blinding is important when the study measures outcomes using interviews, tests, or other instruments that are not fully structured, possibly allowing the person doing the measuring some room for subjective judgment. Blinding protects against the possibility that the measurer’s bias (e.g., as a proponent of the intervention) might influence his or her outcome measurements. Blinding would be important, for example, in a study that measures the incidence of hitting on the playground through playground observations, or a study that measures the word identification skills of first graders through individually-administered tests.
Preferably, the study measured whether the intervention’s effects lasted long enough to constitute meaningful improvement in participants’ lives (e.g., a year, hopefully longer).
This is important because initial intervention effects often diminish over time – for example, as changes in intervention group behavior wane, or as the control group “catches up” on their own.
Checklist for the study’s reporting of the intervention’s effects
If the study claims that the intervention has an effect on outcomes, it reports (i) the size of the
effect, and whether the size is of policy or practical importance; and (ii) tests showing the effect is statistically significant (i.e., unlikely to be due to chance).
These tests for statistical significance should take into account key features of the study design, including:
Whether individuals (e.g., students) or groups (e.g., classrooms) were randomly assigned;
Whether the sample was sorted into groups prior to randomization (i.e., “stratified,” “blocked,” or
“paired”); and Whether the study intends its estimates of the intervention’s effect to apply only to the sites (e.g.,
housing projects) in the study, or to be generalizable to a larger population.
5
The study reports the intervention’s effects on all the outcomes that the study measured, not just those for which there is a positive effect.
This is so you can gauge whether any positive effects are the exception or the pattern. In addition, if the study found only a limited number of statistically-significant effects among many outcomes measured, it should report tests showing that such effects were unlikely to have occurred by chance.
Appendix: How many randomized controlled trials are needed to produce strong
evidence of effectiveness?
To have strong confidence that an intervention would be effective if faithfully replicated, one generally would look for evidence including the following:
The intervention has been demonstrated effective, through well-conducted randomized controlled trials, in more than one site of implementation.
Such a demonstration might consist of two or more trials conducted in different implementation sites, or alternatively one large multi-site trial.
The trial(s) evaluated the intervention in the real-world community settings and conditions where it would normally be implemented (e.g., community drug abuse clinics, public schools, job training program sites).
This is as opposed to tightly-controlled conditions, such as specialized sites that researchers set up at a university for purposes of the study, or settings where the researchers themselves administer the intervention.
There is no strong countervailing evidence, such as well-conducted randomized controlled trials of the intervention showing an absence of effects.
6

7
References 1 U.S. Office of Management and Budget (OMB), What Constitutes Strong Evidence of Program Effectiveness, http://www.whitehouse.gov/omb/part/2004_program_eval.pdf, 2004; U.S. Department of Education’s Institute of Education Sciences, Identifying and Implementing Educational Practices Supported By Rigorous Evidence, http://www.ed.gov/rschstat/research/pubs/rigorousevid/index.html, December 2003; What Works Clearinghouse of the U.S. Education Department’s Institute of Education Sciences, Key Items To Get Right When Conducting A Randomized Controlled Trial in Education, prepared by the Coalition for Evidence-Based Policy, http://ies.ed.gov/ncee/wwc/pdf/guide_RCT.pdf.
2 Random assignment of groups rather than, or in addition to, individuals may be necessary in situations such as the following:
(a) The intervention may have sizeable “spillover” effects on individuals other than those who receive it.
For example, if there is good reason to believe that a drug-abuse prevention program for youth in a public housing project may produce sizeable reductions in drug use not only among program participants, but also among their peers in the same housing project (through peer-influence), it is probably necessary to randomly assign whole housing projects to intervention and control groups to determine the program’s effect. A study that only randomizes individual youth within a housing project to intervention versus control groups will underestimate the program’s effect to the extent the program reduces drug use among both intervention and control-group students in the project.
(b) The intervention is delivered to groups such as classrooms or schools (e.g., a classroom curriculum or
schoolwide reform program), and the study seeks to distinguish the effect of the intervention from the effect of other group characteristics (e.g., quality of the classroom teacher).
For example, in a study of a new classroom curriculum, classrooms in the sample will usually differ in two ways: (i) whether they use the new curriculum or not, and (ii) who is teaching the class. Therefore, if the study (for example) randomly assigns individual students to two classrooms that use the curriculum versus two classrooms that don’t, the study will not be able to distinguish the effect of the curriculum from the effect of other classroom characteristics, such as the quality of the teacher. Such a study therefore probably needs to randomly assign whole classrooms and teachers (a sufficient sample of each) to intervention and control groups, to ensure that the two groups are equivalent not only in student characteristics but also in classroom and teacher characteristics. For similar reasons, a study of a schoolwide reform program will probably need to randomly assign whole schools to intervention and control groups, to ensure that the two groups are equivalent not only in student characteristics but also school characteristics (e.g., teacher quality, average class size).
3 What Works Clearinghouse of the U.S. Education Department’s Institute of Education Sciences, Key Items To Get Right When Conducting A Randomized Controlled Trial in Education, op. cit., no. 1. 4 Resources that may be helpful in reviewing or conducting power analyses include: the William T. Grant Foundation’s free consulting service in the design of group-randomized trials, at http://sitemaker.umich.edu/group-based/consultation_service; Steve Raudenbush et. al., Optimal Design Software for Group Randomized Trials, at http://sitemaker.umich.edu/group-based/optimal_design_software; Peter Z. Schochet, Statistical Power for Random Assignment Evaluations of Education Programs (http://www.mathematica-mpr.com/publications/PDFs/statisticalpower.pdf), prepared for the U.S. Education Department’s Institute of Education Sciences, June 22, 2005; and Howard S. Bloom, “Randomizing Groups to Evaluate Place-Based Programs,” in Learning More from Social Experiments: Evolving Analytical Approaches, edited by Howard S. Bloom. New York: Russell Sage Foundation Publications, 2005, pp. 115-172. 5 Here are illustrative examples of sample sizes from well-conducted randomized controlled trials in various areas of social policy: (i) 4,028 welfare applicants and recipients were randomized in a trial of Portland Oregon’s Job Opportunities and Basic Skills Training Program (a welfare-to work program), to evaluate the program’s effects on employment and earnings – see http://evidencebasedprograms.org/wordpress/?page_id=140; (ii) between 400 and 800 women were randomized in each of three trials of the Nurse-Family Partnership (a nurse home visitation program for low-income, pregnant women), to evaluate the program’s effects on a range of maternal and child outcomes, such as child abuse and neglect, criminal arrests, and welfare dependency – see http://evidencebasedprograms.org/wordpress/?page_id=57; 206 9th graders were randomized in a trial of Check and
8
Connect (a school dropout prevention program for at-risk students), to evaluate the program’s effects on dropping out of school – see http://evidencebasedprograms.org/wordpress/?page_id=92; 56 schools containing nearly 6000 students were randomized in a trial of LifeSkills Training (a substance-abuse prevention program), to evaluate the program’s effects on students’ use of drugs, alcohol, and tobacco – see http://evidencebasedprograms.org/wordpress/?page_id=128. 6 The study, after obtaining estimates of the intervention’s effect with sample members kept in their original groups, can sometimes use a “no-show” adjustment to estimate the effect on intervention group members who actually participated in the intervention (as opposed to no-shows). A variation on this technique can sometimes be used to adjust for “cross-overs.” See Larry L. Orr, Social Experimentation: Evaluating Public Programs With Experimental Methods, Sage Publications, Inc., 1999, p. 62 and 210; and Howard S. Bloom, “Accounting for No-Shows in Experimental Evaluation Designs,” Evaluation Review, vol. 8, April 1984, pp. 225-246. 7 Similarly, a study of a crime prevention program that involves close police supervision of program participants should not use arrest rates as a measure of criminal outcomes, because the supervision itself may lead to more arrests for the intervention group.
Evaluating Social Programs Course: Evaluation Glossary
(Sources: 3ie and The World Bank) Attribution The extent to which the observed change in outcome is the result of the intervention, having allowed for all other factors which may also affect the outcome(s) of interest. Attrition Either the drop out of subjects from the sample during the intervention, or failure to collect data from a subject in subsequent rounds of a data collection. Either form of attrition can result in biased impact estimates. Baseline Pre-intervention, ex-ante. The situation prior to an intervention, against which progress can be assessed or comparisons made. Baseline data are collected before a program or policy is implemented to assess the “before” state. Bias The extent to which the estimate of impact differs from the true value as a result of problems in the evaluation or sample design. Cluster A cluster is a group of subjects that are similar in one way or another. For example, in a sampling of school children, children who attend the same school would belong to a cluster, because they share the same school facilities and teachers and live in the same neighborhood. Cluster sample Sample obtained by drawing a random sample of clusters, after which either all subjects in selected clusters constitute the sample or a number of subjects within each selected cluster is randomly drawn. Comparison group A group of individuals whose characteristics are similar to those of the treatment groups (or participants) but who do not receive the intervention. Comparison groups are used to approximate the counterfactual. In a randomized evaluation, where the evaluator can ensure that no confounding factors affect the comparison group, it is called a control group. Confidence level The level of certainty that the true value of impact (or any other statistical estimate) will fall within a specified range. Confounding factors Other variables or determinants that affect the outcome of interest.
Contamination When members of the control group are affected by either the intervention (see “spillover effects”) or another intervention that also affects the outcome of interest. Contamination is a common problem as there are multiple development interventions in most communities. Cost-effectiveness An analysis of the cost of achieving a one unit change in the outcome. The advantage compared to cost-benefit analysis, is that the (often controversial) valuation of the outcome is avoided. Can be used to compare the relative efficiency of programs to achieve the outcome of interest. Counterfactual The counterfactual is an estimate of what the outcome would have been for a program participant in the absence of the program. By definition, the counterfactual cannot be observed. Therefore it must be estimated using comparison groups. Dependent variable A variable believed to be predicted by or caused by one or more other variables (independent variables). The term is commonly used in regression analysis. Difference-in-differences (also known as double difference or D-in-D) The difference between the change in the outcome in the treatment group compared to the equivalent change in the control group. This method allows us to take into account any differences between the treatment and comparison groups that are constant over time. The two differences are thus before and after and between the treatment and comparison groups. Evaluation Evaluations are periodic, objective assessments of a planned, ongoing or completed project, program, or policy. Evaluations are used to answer specific questions often related to design, implementation and/or results. Ex ante evaluation design An impact evaluation design prepared before the intervention takes place. Ex ante designs are stronger than ex post evaluation designs because of the possibility of considering random assignment, and the collection of baseline data from both treatment and control groups. Also called prospective evaluation. Ex post evaluation design An impact evaluation design prepared once the intervention has started, and possibly been completed. Unless the program was randomly assigned, a quasi-experimental design has to be used.

External validity The extent to which the causal impact discovered in the impact evaluation can be generalized to another time, place, or group of people. External validity increases when the evaluation sample is representative of the universe of eligible subjects. Follow-up survey Also known as “post-intervention” or “ex-post” survey. A survey that is administered after the program has started, once the beneficiaries have benefited from the program for some time. An evaluation can include several follow-up surveys. Hawthorne effect The “Hawthorne effect” occurs when the mere fact that you are observing subjects makes them behave differently. Hypothesis A specific statement regarding the relationship between two variables. In an impact evaluation the hypothesis typically relates to the expected impact of the intervention on the outcome. Impact The effect of the intervention on the outcome for the beneficiary population. Impact evaluation An impact evaluation tries to make a causal link between a program or intervention and a set of outcomes. An impact evaluation tries to answer the question of whether a program is responsible for changes in the outcomes of interest. Contrast with “process evaluation”. Independent variable A variable believed to cause changes in the dependent variable, usually applied in regression analysis. Indicator An indicator is a variable that measures a phenomenon of interest to the evaluator. The phenomenon can be an input, an output, an outcome, or a characteristic. Inputs The financial, human, and material resources used for the development intervention. Intention to treat (ITT) estimate The average treatment effect calculated across the whole treatment group, regardless of whether they actually participated in the intervention or not. Compare to “treatment on the treated estimate”. Intra-cluster correlation Intra-cluster correlation is correlation (or similarity) in outcomes or characteristics between subjects that belong to the same cluster. For example, children that attend the
same school would typically be similar or correlated in terms of their area of residence or socio-economic background. Logical model Describes how a program should work, presenting the causal chain from inputs, through activities and outputs, to outcomes. While logical models present a theory about the expected program outcome, they do not demonstrate whether the program caused the observed outcome. A theory-based approach examines the assumptions underlying the links in the logical model. John Henry effect The “John Henry effect” happens when comparison subjects work harder to compensate for not being offered a treatment. When one compares treated units to those “harder-working” comparison units, the estimate of the impact of the program will be biased: we will estimate a smaller impact of the program than the true impact we would find if the comparison units did not make the additional effort. Minimum desired effect Minimum change in outcomes that would justify the investment that has been made in an intervention, accounting not only for the cost of the program and the type of benefits that it provides, but also on the opportunity cost of not having invested funds in an alternative intervention. The minimum desired effect is an input for power calculations: evaluation samples need to be large enough to detect at least the minimum desired effects with sufficient power. Null hypothesis A null hypothesis is a hypothesis that might be falsified on the basis of observed data. The null hypothesis typically proposes a general or default position. In evaluation, the default position is usually that there is no difference between the treatment and control group, or in other words, that the intervention has no impact on outcomes. Outcome A variable that measures the impact of the intervention. Can be intermediate or final, depending on what it measures and when. Output The products and services that are produced (supplied) directly by an intervention. Outputs may also include changes that result from the intervention which are relevant to the achievement of outcomes. Power calculation A calculation of the sample required for the impact evaluation, which depends on the minimum effect size that we want to be able to detect (see “minimum desired effect”) and the required level of confidence.
Pre-post comparison Also known as a before and after comparison. A pre-post comparison attempts to establish the impact of a program by tracking changes in outcomes for program beneficiaries over time using measures both before and after the program or policy is implemented. Process evaluation A process evaluation is an evaluation that tries to establish the level of quality or success of the processes of a program. For example: adequacy of the administrative processes, acceptability of the program benefits, clarity of the information campaign, internal dynamics of implementing organizations, their policy instruments, their service delivery mechanisms, their management practices, and the linkages among these. Contrast with “impact evaluation”. Quasi-experimental design Impact evaluation designs that create a control group using statistical procedures. The intention is to ensure that the characteristics of the treatment and control groups are identical in all respects, other than the intervention, as would be the case in an experimental design. Random assignment An intervention design in which members of the eligible population are assigned at random to either the treatment group (receive the intervention) or the control group (do not receive the intervention). That is, whether someone is in the treatment or control group is solely a matter of chance, and not a function of any of their characteristics (either observed or unobserved). Random sample The best way to avoid a biased or unrepresentative sample is to select a random sample. A random sample is a probability sample where each individual in the population being sampled has an equal chance (probability) of being selected. Randomized evaluation (RE) (also known as randomized controlled trial, or RCT) An impact evaluation design in which random assignment is used to allocate the intervention among members of the eligible population. Since there should be no correlation between participant characteristics and the outcome, and differences in outcome between the treatment and control can be fully attributed to the intervention, i.e. there is no selection bias. However, REs may be subject to several types of bias and so need follow strict protocols. Also called “experimental design”. Regression analysis A statistical method which determines the association between the dependent variable and one or more independent variables.
Selection bias A possible bias introduced into a study by the selection of different types of people into treatment and comparison groups. As a result, the outcome differences may potentially be explained as a result of pre-existing differences between the groups, rather than the treatment itself. Significance level The significance level is usually denoted by the Greek symbol, α (alpha). Popular levels of significance are 5% (0.05), 1% (0.01) and 0.1% (0.001). If a test of significance gives a p-value lower than the α-level, the null hypothesis is rejected. Such results are informally referred to as 'statistically significant'. The lower the significance level, the stronger the evidence required. Choosing level of significance is an arbitrary task, but for many applications, a level of 5% is chosen, for no better reason than that it is conventional. Spillover effects When the intervention has an impact (either positive or negative) on units not in the treatment group. Ignoring spillover effects results in a biased impact estimate. If there are spillover effects then the group of beneficiaries is larger than the group of participants. Stratified sample Obtained by dividing the population of interest (sampling frame) into groups (for example, male and female), then by drawing a random sample within each group. A stratified sample is a probabilistic sample: every unit in each group (or strata) has the same probability of being drawn. Treatment group The group of people, firms, facilities or other subjects who receive the intervention. Also called participants. Treatment on the treated (TOT) estimate The treatment on the treated estimate is the impact (average treatment effect) only on those who actually received the intervention. Compare to intention to treat. Unobservables Characteristics which cannot be observed or measured. The presence of unobservables can cause selection bias in quasi-experimental designs.