Embed Size (px)
Citation preview
Volume 106, Number 1, January–February 2001Journal of Research of the National Institute of Standards and Technology
[J. Res. Natl. Inst. Stand. Technol. 106, 25–46 (2001)]
The Kilogram and Measurementsof Mass and Force
Volume 106 Number 1 January–February 2001
Z. J. Jabbour and S. L. Yaniv
National Institute of Standards andTechnology,Gaithersburg, MD 20899-0001
This paper describes the facilities, measure-ment capabilities, and ongoing researchactivities in the areas of mass and forceat the National Institute of Standards andTechnology (NIST). The first section of thepaper is devoted to mass metrology andstarts with a brief historical perspectiveon the developments that led to thecurrent definition of the kilogram. Anoverview of mass measurementprocedures is given with a brief discussionof current research on alternative materi-als for mass standards and surface profilesof the U.S. national prototype kilograms.A brief outlook into the future possible
redefinition of the unit of mass based onfundamental principles is included. Thesecond part of this paper focuses on theunit of force and describes the realizationof the unit, measurement procedures,uncertainty in the realized force, facilities,and current efforts aimed at therealization of small forces.
Key words: force; kilogram; mass; uncer-tainty.
Available online: http://www.nist.gov/jres
1. The Kilogram and Mass Measurements1.1 The Unit of Mass
From the early history of humankind to modern times,mass measurements have formed the corner stone fortrade and commerce. The use of weights and balances astools to perform mass measurements for trade datesback thousands of years and is most likely associatedwith the early civilizations of the Nile Valley and theMiddle East. Since those times, mass standards and thetechnology of balances and mass measurements havegreatly evolved to meet the growing and changing needsof society. The activities of everyday life have alwaysbeen affected either directly or indirectly by massmeasurements. Whenever one buys groceries, takesmedication, designs a bridge, space shuttle, or airplane,trades goods—whether grains, gold, or gemstones—
mass plays a crucial and vital role. In addition to thedirect impact on trade and commerce, mass measure-ments impact the scientific community as well as abroad range of manufacturing industries includingaerospace, aircraft, automotive, chemical, semiconduc-tor, materials, nuclear, pharmaceutical, construction,and instrument manufacturing. To ensure equity andequivalence in trade and manufacturing at the nationaland international levels, uniform standards are needed.While mass standards have been in existence for thou-sands of years and some countries had rather controlledpolicies on weights, uniformity was not guaranteedacross boundaries and sometimes not even within theboundaries of one country. In the United States, the unit
25
Volume 106, Number 1, January–February 2001Journal of Research of the National Institute of Standards and Technology
of mass was the avoirdupois pound, and many standardswere brought over from England to the colonies to serveas standards for trade. However, this did not form arobust system and non-uniformity remained a majorissue. The United States government formally recog-nized this need and empowered Congress to “fix thestandards of weights and measures” in the Constitutionof the United States. Many attempts at adopting auniform system of weights were made. It wasn’tuntil 1875 that the United States along with 16 othercountries signed the Meter Convention that establishedthe foundations of the International System of Units (SI)that would finally provide the long sought after uni-formity in the standards of weights and measures. Adetailed account of the history of weights and measuresin the United States can be found in Ref. [1].
The foundation of the SI lies with the 1791 decisionof the French National Assembly to adopt a uniformsystem based entirely on the unit of length, the meter,defined at the time as being equal to one ten-millionthof the length of the quadrant of the earth meridian. Theunit of mass would be the mass of a cubic decimeter ofwater at 4 �C, the temperature of maximum density.Based on these definitions, a prototype meter and kilo-gram were manufactured and deposited in the Archivesof the French Republic in 1799 forming the basis of thepresently adopted SI. The prototype kilogram becameknown as the Kilogram of the Archives. In 1875, theMeter Convention founded the “Comite Internationaldes Poids et Mesures” (CIPM), which took the responsi-bility of manufacturing replicas of the meter and kilo-gram prototypes, and the “Bureau International desPoids et Mesures” (BIPM) whose function would be toserve as the custodian of the prototypes, carry out futureinternational comparisons, and serve as the center fordisseminating the metric system. In 1878, three 1 kgcylinders, KI, KII, and KIII, made of 90 % platinum—10 % iridium alloy were ordered from Johnson Mattheyin England; they were delivered in 1879. They werepolished, adjusted, and compared with the Kilogram ofthe Archives by four observers in 1880 at the Obser-vatory of Paris. The mass of KIII was found to be theclosest to that of the Kilogram of the Archives. KIII wasplaced in a safe at the BIPM in 1882, was chosen by theCIPM to be the International Prototype Kilogram, andwas ratified as such by the 1st “Conference Generaledes Poids et Mesures” (CGPM) in 1889. In 1901, the3rd CGPM in Paris established the definition of the unitof mass: “The Kilogram is the unit of mass; it is equalto the mass of the International Prototype of the Kilo-gram.” The International Prototype Kilogram is oftenreferred to as “IPK” and is frequently designated withthe Gothic letter K. In 1884, 40 replicas of the kilogramwere delivered from Johnson Matthey; they were com-
pared to the mass of the IPK in 1888. In 1889, 34 ofthese replicas were distributed to the signatories of theMeter Convention who requested them. Calibrationcertificates accompanied the replicas with mass valuesbased on comparisons with the IPK. These replicaswere in turn used by the different countries as nationalstandards. At that time, the United States was allocatedtwo Pt-Ir prototype kilograms, K20 and K4. K20 arrivedin the United States in 1890 and was designated as theprimary national standard of mass. K4 arrived later thatsame year and was assigned as a check standard tomonitor the constancy of K20. Over a century later,K20 and K4 still hold their respective positions. The sixremaining replicas were kept at the BIPM to serve ascheck standards for IPK. In addition to the original 40copies, more replicas were constructed to serve thegrowing needs of the international community. In 1996,the U.S. acquired a new prototype kilogram, K79.
Since its foundation in 1875 and until 1973, the BIPMused two equal-arm mechanical balances: the Bungebalance that was in service between 1879 and 1951 andthe Rueprecht balance that served the BIPM’s needsfrom 1878 until 1974 [2]. In 1970, the National Bureauof Standards (NBS), predecessor to NIST, donated a1 kg balance, known as NBS-2, to the BIPM. NBS-2was designed and developed at NIST to allow for thesimultaneous measurement of six 1 kg standards. Theunique constant-load, double-knife-edge design allowedmetrologists to achieve state-of-the-art resolution andrepeatability [3]. NBS-2 was used for the calibration of1 kg standards at the BIPM between 1973 and 1992,replacing the Rueprecht balance that was nearing 100years of age. Currently the BIPM uses state-of-the-artbalances that are either commercially available or devel-oped at the BIPM.
The unit of mass is only available at the BIPM. There-fore, the prototypes serving as national standards ofmass must be returned periodically to the BIPM forcalibration either on an individual basis, which couldbe done anytime, or as part of a simultaneous recalibra-tion of all the prototypes known as “periodic verifica-tion.” Since the existence of the prototypes there hasbeen only three such periodic verifications. The latestone, the third periodic verification, took place between1988 and 1992. For it, the IPK was used with the NBS-2balance. The results of the third periodic verificationdemonstrated a long-term instability of the unit of masson the order of approximately 30 �g/kg over the lastcentury [4]; this instability is attributed to surfaceeffects that are not yet fully understood. Mass standards,including IPK and its replicas, are stored in ambient air;therefore, their surfaces are subject to the adsorption orabsorption of atmospheric contamination resulting in again in mass over time; they also may lose mass from
26
Volume 106, Number 1, January–February 2001Journal of Research of the National Institute of Standards and Technology
usage. The BIPM has developed a recommendedmethod [5] for cleaning platinum-iridium (Pt-Ir) proto-types to remove surface contaminants and restore theartifact to its original state. In 1989, the CIPM inter-preted the 1901 definition of the kilogram [6]. The inter-pretation, which does not imply a redefinition of thekilogram, refers to the kilogram as being equal to themass of the IPK just after cleaning and washing usingthe BIPM method.
In 2001, the kilogram remains as the only SI base unitdefined by an artifact and thus is constantly in danger ofbeing damaged or destroyed. In addition, the definitionof the kilogram makes no provision for either the artifactsurface parameters or for any environmental storingconditions. Environmental effects combined with wearand other material and surface properties constitute themost probable reason for the observed instability inmass over time. The instability in the definition of thekilogram propagates to other SI base units that are tiedto the kilogram such as the ampere, mole, and candela.It also propagates to derived quantities such as density,force, and pressure. Therefore, the impact of theinstability in the unit of mass spans a broad rangeof applications in the scientific and engineeringsectors.
While comparisons of nearly identical 1 kg massstandards can be performed with a relative precision of10–10 with commercially available balances and with10–12 with special balances, it is clear that the limitationin the field of mass metrology lies within the artifactdefinition itself. Therefore, the ultimate need for massmetrology is to redefine the unit of mass in terms of afundamental constant of nature. At the same time, it isalso crucial to pursue more stable and ideal artifacts andtransfer standards, as this will be, at least for the foresee-able future, the only practical dissemination tool.
1.2 Mass Measurement1.2.1 Cleaning and Handling of Mass Standards
Mass standards are typically stored and used inambient air; therefore, they accumulate contaminantsand must be cleaned occasionally to restore them to theiroriginal mass values. Cleaning policies and protocolsdepend on the artifact material and can vary greatlyamong laboratories.
The internationally accepted cleaning method of theplatinum-iridium prototypes is known as “the BIPMcleaning method” and it is described in Ref. [5]. Thismethod was developed at the BIPM between 1939and 1946; it evolved from years of experimentation oncleaning methods that included using a variety ofsolvents. The currently used BIPM method consists ofrubbing the artifact with chamois cloth that has beensoaked in a mixture of equal proportions of ether and
alcohol. Since the ether and alcohol mixture leaves aresidue, the artifact is then cleaned in a jet of steam fromdoubly distilled water. Results show that this procedureis effective in removing contamination from the surface[4]. It is worth noting that this method relies on thehuman touch and therefore can be highly irreproducible.NIST follows this protocol to clean the nationalstandards of mass K20, K4, and K79 when necessary.All other NIST mass standards and those submitted forcalibration are generally made of stainless steel and aresubjected to different cleaning procedures, dependingon their size and construction, as described below.
Mass standards made of one-piece construction in therange of 1 g to 1 kg are cleaned by washing the artifactswith condensing alcohol vapor, usually referred to as“vapor degreasing.” Following washing, the artifacts areallowed to dry and any droplets on the surface are gentlypatted dry.
Mass standards larger than 1 kg and all weights oftwo-piece construction are cleaned by wiping withlint-free cheesecloth moistened with alcohol.
Fractional weights (1 mg to 500 mg) are cleaned bysoaking them in alcohol followed by gently patting themdry.
When mass standards are contaminated with oilyresidues, they are cleaned with acetone followed byalcohol using lint-free cheesecloth. Typically, unlessspecified otherwise by the customers, all mass standardsare cleaned before calibration.
After cleaning, weights are allowed to stabilize for aperiod of 7 to 10 days before calibration. The stabiliza-tion period is determined based on the results of charac-terization of the stability of mass standards by monitor-ing the mass of a selected set of weights after cleaning[7]. Before calibration, weights are stored inside or nearthe balance, under cover, for a period of at least 24 hoursto reach thermal equilibrium with the surroundingtemperature. Weights larger than 10 kg require a longerthermal stabilization period depending on their size.
The handling of mass standards requires specialprecautions. Care must always be taken to minimize therisks of dropping and therefore damaging the surface ofthe artifacts. In order to minimize contamination, massstandards must always be kept in a relatively dust freeenvironment with appropriate air filtration. When not inuse, mass standards must be kept under a glass bell jaror other appropriate cover. In addition, mass standardsmust never be handled with bare hands. Usually specialhandling devices such as tweezers are used to avoiddirect contact. If handling by hand is required, glovesmust be worn. Gloves must be chosen to be powder freeand such that their use doesn’t result in contamination ofthe artifact. In addition to contamination, handling bydirect contact with the human body results in change intemperature that will later require additional thermal
27
Volume 106, Number 1, January–February 2001Journal of Research of the National Institute of Standards and Technology
stabilization time. If handling devices are used, the partthat comes in contact with the mass standards must beclean, non-abrasive, and non-magnetic. Before calibra-tion, dust particles that could have accumulated on thesurface of the artifacts can be removed by either blow-ing air using a bulb type rubber syringe or by lightlybrushing with a clean brush.
1.2.2 Density Determination
High precision mass measurements require applyingan air buoyancy correction that in turn requires theknowledge of the air density as well as the volumes ordensities of the artifacts.
The air density is computed using the internationallyaccepted equation for the determination of the densityof moist air [8] from the measurement of the CO2 con-concentration, temperature, barometric pressure, andrelative humidity. All the environmental transducers areregularly calibrated by the appropriate groups at NISTand are traceable to the national standards of tempera-ture, pressure, and humidity. The standard uncertaintyin the air density is 0.000 17 kg/m3 based upon standarduncertainties of the measured temperature, barometricpressure, and relative humidity of 5 mK, 10 Pa, and0.5 %, respectively.
Mass standards typically have rounded edges, knobs,and recessed bottoms, therefore determining the volumeby geometric means is neither very accurate nor practi-cal. Volumes (or densities) are measured using animmersed balance and hydrostatic weighing systems.Since both systems require immersion of the weights ina fluid, all standards must be of a one-piece constructionto avoid introducing fluid into any cavities in theweights.
The immersed balance procedure developed at NISTby Davis and Schoonover [9] uses the novel idea ofimmersing a modified electronic balance in a bath offluorocarbon fluid. Volumes of mass standards inthe range from 100 g to 1 kg are measured by compari-son to volume standards, of the same nominal value,determined to a higher precision by the hydro-static technique described below. Check standardsare incorporated in the measurements to monitor theaccuracy of the process. The relative combined standarduncertainty in the density using this procedureis 0.004 %. Artifacts of other denominations between100 g and 1 kg, and special requests requiring higherprecision, are performed using hydrostatic weighingtechniques.
The hydrostatic weighing procedure uses siliconas density reference standards [10]. The use of solidobjects as reference standards for density measurements
was first developed at NIST in 1974 [11]; this methodeliminated the use of water as a density referencestandard and is currently used in most laboratorieswhere high-precision density measurements are re-quired. The hydrostatic weighing system currently in useis essentially the same system developed at NIST in1974 for the measurement of silicon density standardswith an electronic top-loading balance replacing themechanical balance. A fluorocarbon fluid is used formost of the measurements while water is occasionallyused. Check standards are incorporated in the measure-ments to monitor the accuracy of the process. Massdeterminations in air and in the fluid are done againstNIST mass standards to eliminate errors due to non-linearity of the balance. The density of the siliconreference standards used is known with a relativestandard uncertainty of 7.5�10–7 from hydrostaticweighing by comparison against stainless steel sphereswhose volumes were measured using laser interfero-metry [1]. The relative combined standard uncertaintyin the density using the hydrostatic system is 0.001 %.
Typically for large weights (above 1 kg), the densityof a sample of the same material is measured. Thesample should preferably be from the same bar and cutfrom a location as close to the weight as possible tominimize any effects due to nonhomogeneity of thematerial.
For weights smaller than 100 g and for all weightsmade of two-piece construction, either the manufac-turer’s stated density or the density supplied by thecustomer is used.
A new, fully automated hydrostatic density measur-ing system based on silicon spheres as referencestandards is currently being developed. A new systemfor measuring the density of artifacts in the range from2 kg to 10 kg is also under development. Both systemsare expected to be in operation by 2002.
1.3 Dissemination of the Unit of Mass
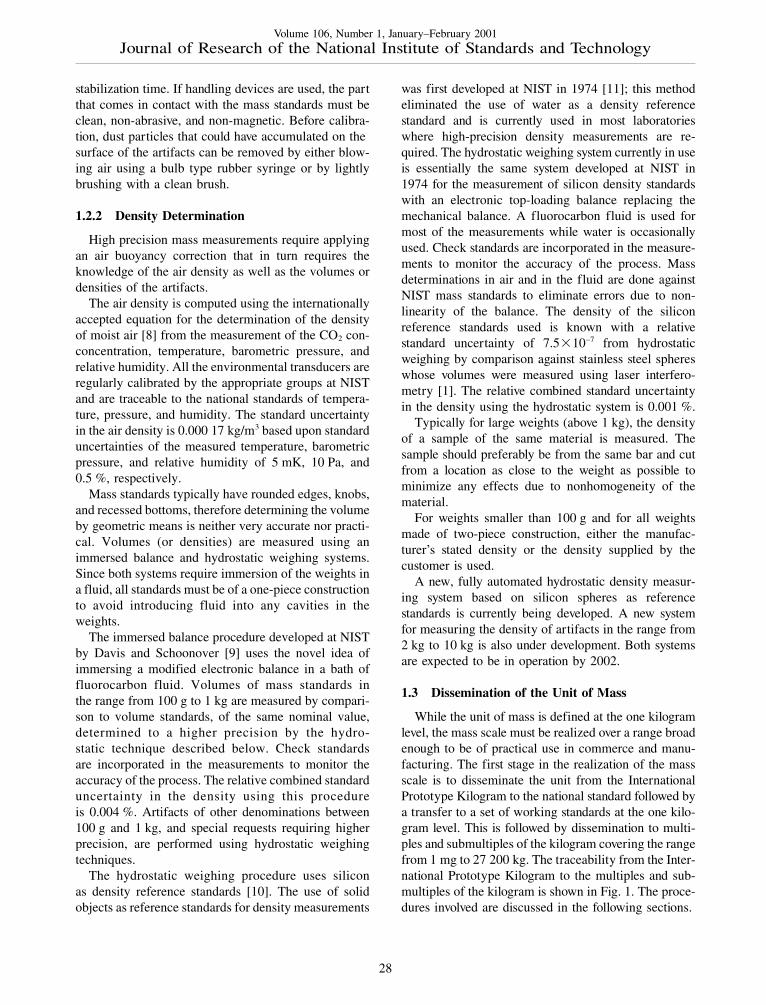
While the unit of mass is defined at the one kilogramlevel, the mass scale must be realized over a range broadenough to be of practical use in commerce and manu-facturing. The first stage in the realization of the massscale is to disseminate the unit from the InternationalPrototype Kilogram to the national standard followed bya transfer to a set of working standards at the one kilo-gram level. This is followed by dissemination to multi-ples and submultiples of the kilogram covering the rangefrom 1 mg to 27 200 kg. The traceability from the Inter-national Prototype Kilogram to the multiples and sub-multiples of the kilogram is shown in Fig. 1. The proce-dures involved are discussed in the following sections.
28
Volume 106, Number 1, January–February 2001Journal of Research of the National Institute of Standards and Technology
1.3.1 Dissemination From the InternationalPrototype Kilogram to the NationalStandards
The link between the SI unit of mass and the U.S.national standard of mass is maintained through periodiccalibrations of the national standard at the BIPM. TheU.S. national standard of mass, K20, was calibrated atthe BIPM six times during its lifetime, the latest calibra-tion being in 1999 when it was calibrated against theBIPM working standards using a commercial electronicbalance. K4, the U.S. check standard, was calibratedat the BIPM three times. Table 1 shows the dates ofcalibration along with the masses reported on thecalibration certificates of the U.S. prototypes from theBIPM. The combined standard uncertainty (coveragefactor k = 1) ranged from 2 �g to 4 �g. The densitiesof the prototype kilograms K20 and K4 have been mea-
sured at the BIPM using hydrostatic weighing tech-niques with water as a reference standard; the measuredvalues are 21 539.14 kg/m3 and 21 531.77 kg/m3,respectively with a relative standard uncertaintyestimated at 0.003 %[13].
The masses reported in Table 1 are obtained aftercleaning and washing of the prototypes using the BIPMmethod. When the prototype kilograms are not cleaned,a correction to the “after cleaning” mass is applied. Thiscorrection is based on a model developed by the BIPM.Based on this model, a platinum-iridium kilogram gains1.11 �g per month for the first 3 months after cleaning.The rate of change of mass then decreases to approxi-mately 1 �g per year [4].
1.3.2 Dissemination to the Stainless SteelSecondary Standards
The U.S. unit of mass is traceable to the IPK throughthe primary national standard of mass, K20. The massunit is first transferred from K20 to a set of secondarystainless steel (SS) kilogram standards manufacturedfrom nonmagnetic SS alloys with nominal density of8000 kg/m3, polished surfaces, and chamfered edges.Prior to the mass calibration, the densities are deter-mined using the hydrostatic weighing method withsilicon reference standards, as described above.
Fig. 1. Traceability of mass measurements to the SI unit of mass.
Table 1. Year of calibration and masses reported by BIPM for theU.S. prototypes
Year K20 K4
1889 1 kg – 0.039 mg 1 kg – 0.075 mg1937 1 kg – 0.021 mg1948 1 kg – 0.019 mg1984 1 kg – 0.022 mg 1 kg – 0.106 mg1992 1 kg – 0.021 mg1999 1 kg – 0.039 mg 1 kg – 0.116 mg
29
Volume 106, Number 1, January–February 2001Journal of Research of the National Institute of Standards and Technology
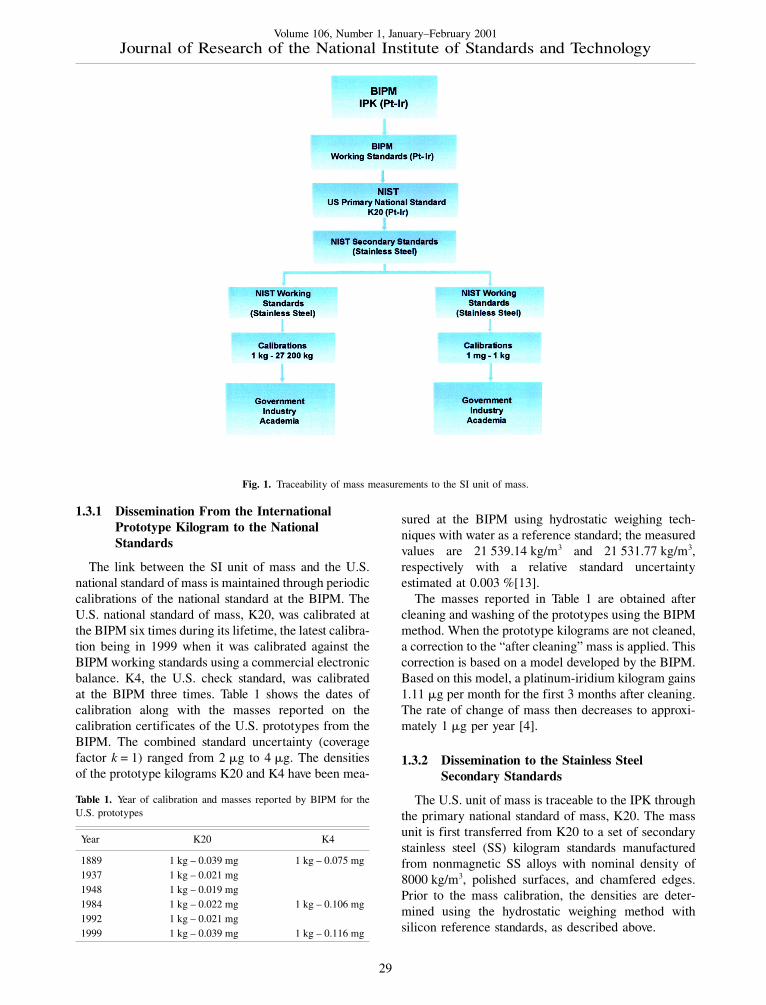
The standards are cleaned after the density measure-ments by vapor degreasing and are allowed to stabilizebefore calibration as outlined earlier. Subsequent clean-ing is performed only if a weight has been subject tounusual contamination. A commercially available andfully automated electronic 1 kg mass comparator with aresolution of 1 �g is used. This comparator is equippedwith a weight-handling mechanism that allows for thesimultaneous measurement of four mass standards ofequal nominal mass, which in this case is 1 kg. Figure 2shows K20, K4, and two stainless steel kilogramstandards inside the balance during calibration. K20 andK4 are cylindrical weights while the knob weights arethe stainless steel secondary standards. Since a balanceis essentially a force transducer that measures the netvertical forces acting on an object, the balance readingreflects the difference between the gravitational andbuoyant forces; if the balance is calibrated and thesensitivity is measured [14], the balance reading allowsfor the determination of the mass value. Typically, massmeasurements are performed by comparison weighinginvolving a reference R and an unknown X:
mR – �aVR = CR (1)
mX – �aVX = CX (2)
where mR and mx, VR and Vx, CR and Cx denote the mass,volume, and balance reading for the reference R andthe unknown X, respectively while �a refers to the airdensity during the measurement.
Comparing the above two equations by taking thedifference allows for the determination of the value ofthe unknown:
mX = mR – �a(VR – VX)–C (3)
where C = CR–CX, and the assumption was made thatthe air density �a does not change during this compari-son. Equation (3) represents the simplest and mostfundamental mass measurement process. It is evidentfrom Eq. (3) that the air buoyancy correction is propor-tional to the difference in volumes between the refer-ence and the unknown. Therefore, the comparison oftwo artifacts of different volumes such as a 1 kg weightmade of Pt-Ir and a 1 kg weight made of stainless steel
Fig. 2. The national standard of mass K20, K4, and secondarystainless steel standards inside the balance during measurement.
30
Volume 106, Number 1, January–February 2001Journal of Research of the National Institute of Standards and Technology
results in a buoyancy correction of 94.2 mg assuming anair density of 1.2 kg/m3, a volume of 125 cm3 for astainless steel kilogram, and a volume of 46.5 cm3 fora Pt-Ir kilogram. In order to minimize any effect ofbalance nonlinearity, small weights with total mass ofapproximately 94 mg are added to the stainless steelkilograms. The stainless steel kilograms are calibrated inpairs, denoted X1 and X2, against the national standardK20 while K4 acts as a check standard. The small addedmasses to X1 and X2 are represented by z1 and z2,respectively. Difference measurements Yi are obtainedwith all possible combinations between all fourstandards; this results in six differences:
The (+) and (–) signs in the above matrix indicate theorder in the difference measurement: (+) and (–) forobservation Y1 indicates a measurement of the differ-ence between K20 and K4 where K20 is measured first.Therefore, the above matrix translates into the followingequations after taking into account the buoyancy correc-tion:
Such a series of difference measurements is known asa weighing design. This particular weighing design isreferred to as a 4-1 design indicating that it involves fourweights of equal nominal mass. Fixing the value of oneof the standards allows one to solve this system of equa-tions using the method of the least squares [15]. In thiscase, the mass of K20 is known from the calibration atthe BIPM and is therefore used as the restraint:
mK20 = R . (7)
These weighing designs have been developed at NISTby Cameron et al. in 1979. A full description can befound in Ref. [15]. Such measurements allow one todetermine the masses of the unknown standards X1 and
X2 as well as K4 from linear combinations of the massdifferences Y1, ........ ,Y6 and the value of the restraint asdescribed in Ref. [15] after correcting each mass differ-ence for the buoyancy correction associated with thestandards involved [16].
Since the mass of K4 is known from a calibration atthe BIPM, the determination of its mass here serves asa check of the accuracy of the process as discussedbelow.
The difference in the geometry between the Pt-Ir andstainless steel standards results in a difference in therelative locations of the center of mass. This results in achange in the measured mass that is proportional to thegravitational gradient over the range between the loca-tions of the two centers of gravity. The gravitationalcorrection is given by:
1 kg1g
�g�h
(�h ) (8)
where �h represents the distance between the centers ofmass of the two artifacts being compared, g is the accel-
eration of free fall, and�g�h
is the gravitational field
gradient. In order to quantify this correction, the gravita-tional gradients as well as the absolute acceleration offree fall at the location where the mass calibrations areperformed were measured by the National GeodeticSurvey to be [(3.35�10–6)�(0.06�10–6)] s–2 and(9.800 998 6�10–7) m/s2, respectively. For �h = 1 cm,which is typical, the gravitational correction is 3 �g.
The combined standard uncertainty in the mass of asecondary stainless steel kilogram is computed from thebasic equation for mass determination [Eq. (3)] basedon the ISO Guide for the Expression of Uncertaintyin Measurement [17], resulting in the followingcontributions:
a) Air density: the uncertainty component due to airdensity is proportional to the difference in volumebetween the two standards being compared. It isevident here that the dominant component is due tothe large difference in volume �80 cm3) between thePt-Ir and secondary SS kilograms. This uncertaintycomponent is uair = 13.3 �g for an uncertainty in theair density of 0.000 17 kg/m3.
b) Balance: the uncertainties due to repeatability andreproducibility are computed in accordance withthe model developed by C. M. Croarkin using theprocedures outlined in Ref. [18]. In this case,ubalance = 2.3 �g.
c) Reference, K20: this component is taken from thecalibration certificate of K20 supplied by theBIPM; ureference = 4 �g based on the 1999 calibrationcertificate.
Observation (1) (2) (3) (4)
K20 K4 X1+z1 X2+z2Y1 + –
Y2 + –
Y3 + –
Y4 + –
Y5 + –
Y6 + –
(mK20 – �a1VK20) – (mK4 – �a1VK4) = Y1 (1)
(mK20 – �a2VK20) – (mX1 – �a2VX1 + mz1 – �a2Vz1) = Y2 (2)
(mK20 – �a3VK20) – (mX2 – �a3VX2 + mz2 – �a3Vz2) = Y3 (3)
(mK4 – �a4VK4) – (mX1 – �a4VX1 + mz1 – �a4Vz1) = Y4 (4)
(mK4 – �a5VK4) – (mX2 – �a5VX2 + mz2 – �a5Vz2) = Y5 (5)
(mX1 – �a6VX1 + mz1 – �a6Vz1) – (mX2 – �a6VX2 + mz2 – �a6Vz2) = Y6 (6)
31
Volume 106, Number 1, January–February 2001Journal of Research of the National Institute of Standards and Technology
d) Added masses: uncertainty in the small massesadded to the stainless steel kilograms to compensatefor the large difference due to the buoyancy correc-tion. The uncertainty in the 94 mg as obtained fromprevious calibration against NIST standards is givenby uadd-mass = 0.1 �g.
e) Volume of standards: this component of the uncer-tainty, uvolumes, is due to the uncertainty in the vol-umes of the reference K20 and the unknown weights,X1 or X2. This uncertainty component is negligiblewhen the air densities at the time of calibration andthe time of use of the standards are comparable [19].
f) Other less significant uncertainty components notincluded in the above list are: utemperature, due to possi-ble errors in the temperature volume expansioncoefficients and ugravity, from the gravitational correc-tions.
The combined standard uncertainty is given by
U=�u 2air+u 2
balance+u 2reference+u 2
add-mass+u 2volumes+u 2
temperature+u 2gravity. (9)
When all the uncertainties mentioned above are in-cluded, the combined standard uncertainty of the massof a secondary stainless steel standard kilogram is foundto be 14 �g (coverage factor k = 1).
The secondary standards are used as referencestandards in the calibration of the working standards atthe 1 kg level. The calibration procedure is similar anduses the same automated comparator. However, sincethe secondary and working standards have similarvolumes, the buoyancy correction is very small. There-fore, the need for added masses is eliminated and theuncertainty in the buoyancy correction is minimized.The major contributions to the uncertainty becomethe uncertainty in the reference standard used,ureference = 14 �g and the combined repeatability andreproducibility of the balance, ubalance = 2.3 �g. Thecombined standard uncertainty in the 1 kg workingstandard is therefore computed to be 14.2 �g.
1.3.3 Dissemination to Multiples and Submultiplesof the Kilogram
Two sets of stainless steel working standards at thekilogram level are used to disseminate the unit of massto multiples and submultiples of the kilogram. Thesestandards have similar properties as the secondarystandards. At NIST, mass measurements traceable to thenational standard of mass are regularly performed in therange from 1 mg to 27 200 kg. Typically, weightscome in sets consisting of weights of various denomi-nations. For example, a 1 g to 1 kg set consists of the
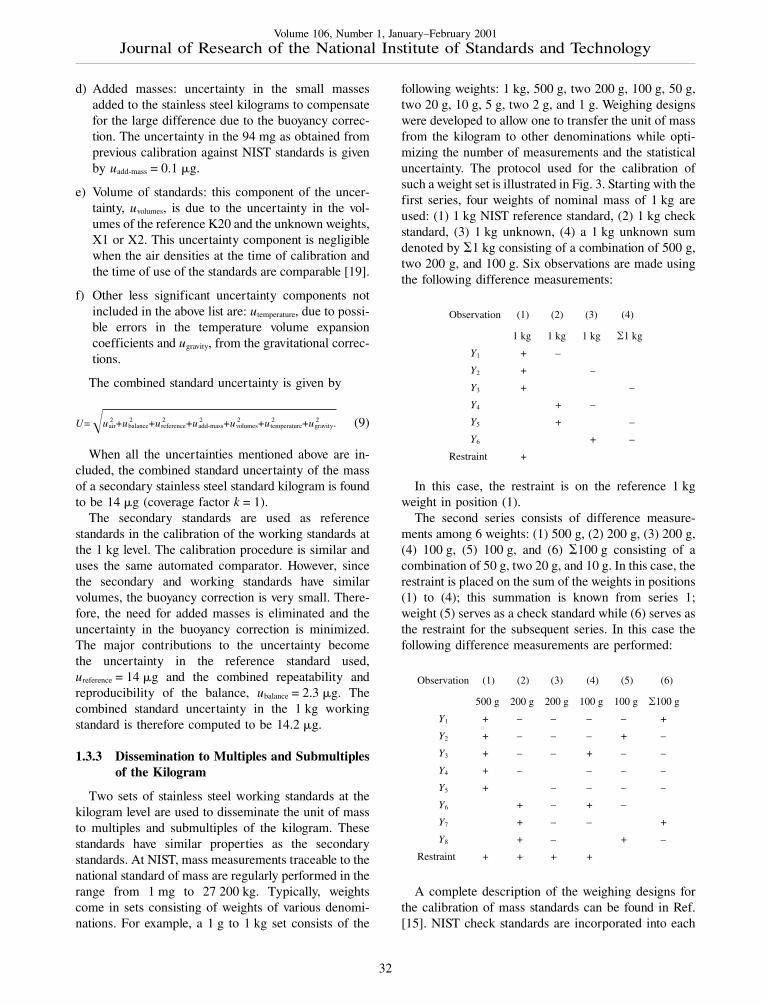
following weights: 1 kg, 500 g, two 200 g, 100 g, 50 g,two 20 g, 10 g, 5 g, two 2 g, and 1 g. Weighing designswere developed to allow one to transfer the unit of massfrom the kilogram to other denominations while opti-mizing the number of measurements and the statisticaluncertainty. The protocol used for the calibration ofsuch a weight set is illustrated in Fig. 3. Starting with thefirst series, four weights of nominal mass of 1 kg areused: (1) 1 kg NIST reference standard, (2) 1 kg checkstandard, (3) 1 kg unknown, (4) a 1 kg unknown sumdenoted by �1 kg consisting of a combination of 500 g,two 200 g, and 100 g. Six observations are made usingthe following difference measurements:
In this case, the restraint is on the reference 1 kgweight in position (1).
The second series consists of difference measure-ments among 6 weights: (1) 500 g, (2) 200 g, (3) 200 g,(4) 100 g, (5) 100 g, and (6) �100 g consisting of acombination of 50 g, two 20 g, and 10 g. In this case, therestraint is placed on the sum of the weights in positions(1) to (4); this summation is known from series 1;weight (5) serves as a check standard while (6) serves asthe restraint for the subsequent series. In this case thefollowing difference measurements are performed:
A complete description of the weighing designs forthe calibration of mass standards can be found in Ref.[15]. NIST check standards are incorporated into each
Observation (1) (2) (3) (4)
1 kg 1 kg 1 kg �1 kg
Y1 + –
Y2 + –
Y3 + –
Y4 + –
Y5 + –
Y6 + –
Restraint +
Observation (1) (2) (3) (4) (5) (6)
500 g 200 g 200 g 100 g 100 g �100 g
Y1 + – – – – +
Y2 + – – – + –
Y3 + – – + – –
Y4 + – – – –
Y5 + – – – –
Y6 + – + –
Y7 + – – +
Y8 + – + –
Restraint + + + +
32
Volume 106, Number 1, January–February 2001Journal of Research of the National Institute of Standards and Technology
series of measurements, and a NIST reference standardis only used at the starting series; the tie to the sub-sequent series is provided by the measurement of theunknowns as determined from the previous series.Similar procedures are used for calibration of themultiples of the kilogram. The observations are cor-rected for air buoyancy as well as temperature beforethe masses are calculated using the least squaresmethod [15].
Since most mass standards in use are made of stain-less steel of similar density to that of the NIST workingand check standards, the uncertainty in the buoyancycorrection is negligible. Therefore the major contribu-tions to the uncertainty are (1) the uncertainty in thereference standard and (2) the combined repeatabilityand reproducibility of the balance. Uncertainties due tothe volumes of the unknowns cannot be included due to
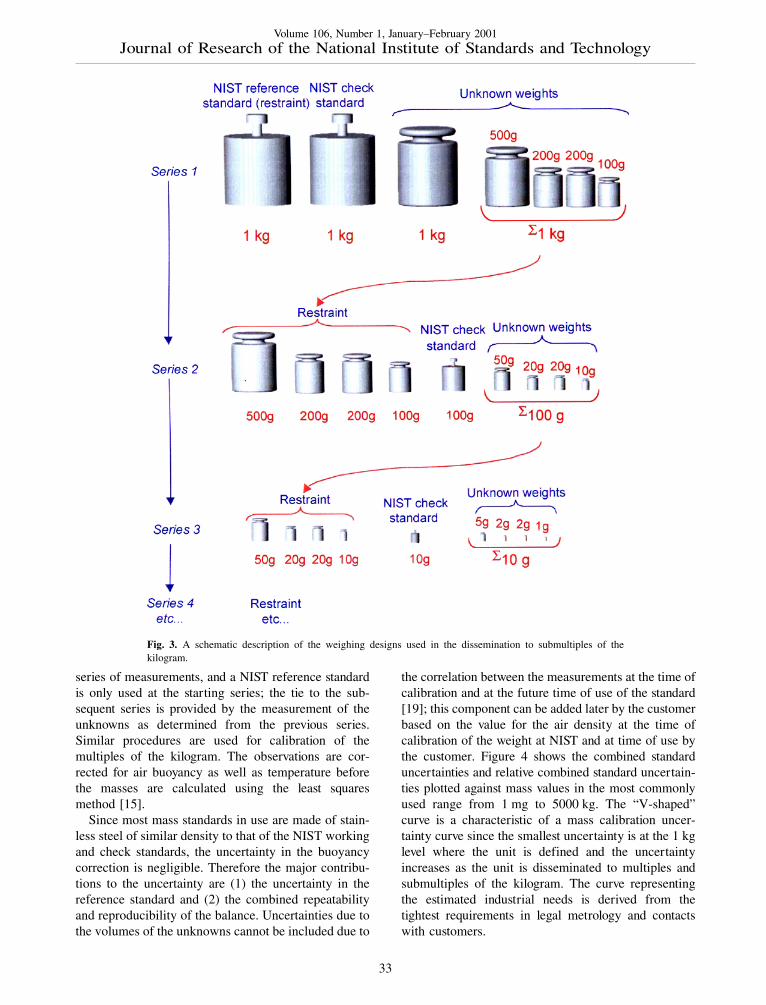
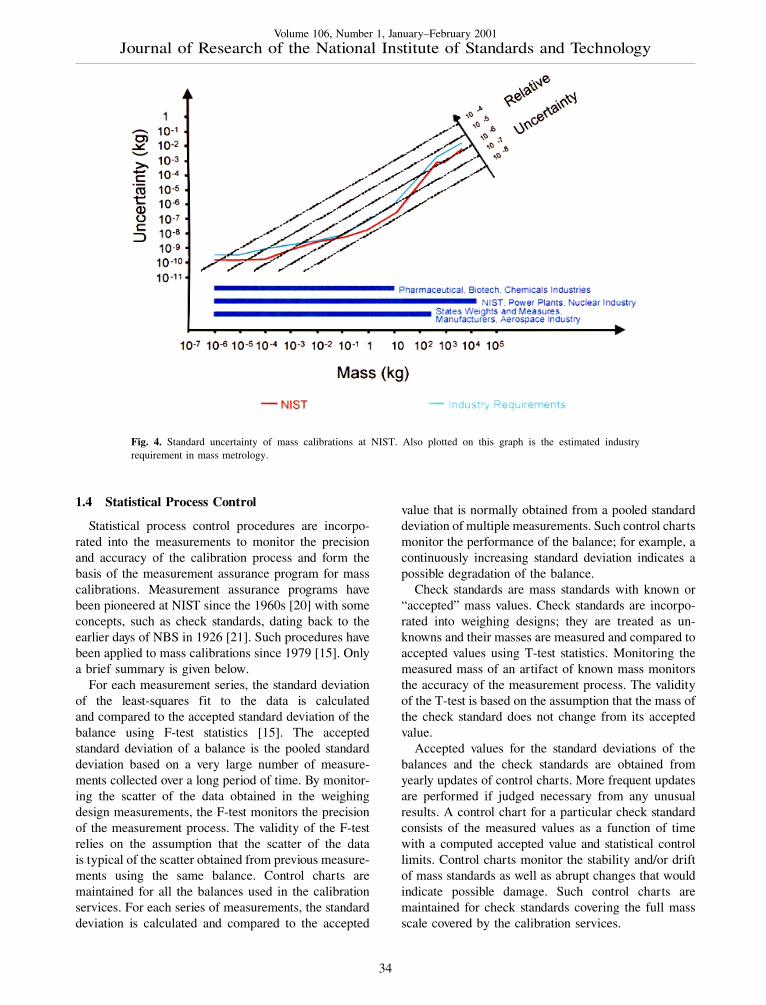
the correlation between the measurements at the time ofcalibration and at the future time of use of the standard[19]; this component can be added later by the customerbased on the value for the air density at the time ofcalibration of the weight at NIST and at time of use bythe customer. Figure 4 shows the combined standarduncertainties and relative combined standard uncertain-ties plotted against mass values in the most commonlyused range from 1 mg to 5000 kg. The “V-shaped”curve is a characteristic of a mass calibration uncer-tainty curve since the smallest uncertainty is at the 1 kglevel where the unit is defined and the uncertaintyincreases as the unit is disseminated to multiples andsubmultiples of the kilogram. The curve representingthe estimated industrial needs is derived from thetightest requirements in legal metrology and contactswith customers.
Fig. 3. A schematic description of the weighing designs used in the dissemination to submultiples of thekilogram.
33
Volume 106, Number 1, January–February 2001Journal of Research of the National Institute of Standards and Technology
1.4 Statistical Process Control
Statistical process control procedures are incorpo-rated into the measurements to monitor the precisionand accuracy of the calibration process and form thebasis of the measurement assurance program for masscalibrations. Measurement assurance programs havebeen pioneered at NIST since the 1960s [20] with someconcepts, such as check standards, dating back to theearlier days of NBS in 1926 [21]. Such procedures havebeen applied to mass calibrations since 1979 [15]. Onlya brief summary is given below.
For each measurement series, the standard deviationof the least-squares fit to the data is calculatedand compared to the accepted standard deviation of thebalance using F-test statistics [15]. The acceptedstandard deviation of a balance is the pooled standarddeviation based on a very large number of measure-ments collected over a long period of time. By monitor-ing the scatter of the data obtained in the weighingdesign measurements, the F-test monitors the precisionof the measurement process. The validity of the F-testrelies on the assumption that the scatter of the datais typical of the scatter obtained from previous measure-ments using the same balance. Control charts aremaintained for all the balances used in the calibrationservices. For each series of measurements, the standarddeviation is calculated and compared to the accepted
value that is normally obtained from a pooled standarddeviation of multiple measurements. Such control chartsmonitor the performance of the balance; for example, acontinuously increasing standard deviation indicates apossible degradation of the balance.
Check standards are mass standards with known or“accepted” mass values. Check standards are incorpo-rated into weighing designs; they are treated as un-knowns and their masses are measured and compared toaccepted values using T-test statistics. Monitoring themeasured mass of an artifact of known mass monitorsthe accuracy of the measurement process. The validityof the T-test is based on the assumption that the mass ofthe check standard does not change from its acceptedvalue.
Accepted values for the standard deviations of thebalances and the check standards are obtained fromyearly updates of control charts. More frequent updatesare performed if judged necessary from any unusualresults. A control chart for a particular check standardconsists of the measured values as a function of timewith a computed accepted value and statistical controllimits. Control charts monitor the stability and/or driftof mass standards as well as abrupt changes that wouldindicate possible damage. Such control charts aremaintained for check standards covering the full massscale covered by the calibration services.
Fig. 4. Standard uncertainty of mass calibrations at NIST. Also plotted on this graph is the estimated industryrequirement in mass metrology.
34
Volume 106, Number 1, January–February 2001Journal of Research of the National Institute of Standards and Technology
1.5 Facilities
Electronic mass comparators, fully and partiallyautomated, are used for calibrations in the range from1 mg to 10 kg, while mechanical balances are used tocover the range between 10 kg and 27 200 kg. Partialautomation refers to the automation of the data collec-tion from the comparators and from the transducersmonitoring the environment, as well as the automaticanalysis of the collected data; full automation alsoincludes the remote operation of the comparators [22].The environmental conditions in the calibration labora-tories are such that the relative humidity is set between40 % and 50 %with variations of no more than 5 % per24 h and the temperature is set between 20 �C and 22 �Cwith maximum variations of 0.5 �C over a period of12 h. Electrostatic filters are used to insure propercleanliness with 97 % filtration efficiency.
A special area is dedicated to the calibration of largeweights between 30 kg and 27 200 kg using mechanicalbalances. The temperature is maintained between 21 �Cand 23 �C with maximum variations of 1.5 �C per 12 h.This special area was designed to allow for the receiv-ing, handling, and shipping of large weights and lacksany humidity control.
A clean room facility with tight environmentalcontrol houses a state-of-the-art, fully automated andremotely operated 1 kg, 100 g, and 10 kg comparators.The environmental conditions are such that temperatureis controlled to within 0.1 �C at a temperature between20 �C and 22 �C and the temperature gradients are lessthan 0.1 �C over an elevation of 1 m. The relative humid-ity is controlled to within 2 % at a relative humiditybetween 45 % and 50 %. Cleanliness of class 1000 isaccomplished with a HEPA filtration system with99.99 % efficiency for particles of size 0.5 �m orlarger.
NIST also maintains facilities for hydrostatic [10,11]and immersed [9] solid density measurements and forthe characterization of the magnetic properties of massstandards [23].
1.6 Alternative Materials for Mass Standards
Efforts are currently underway to develop andmanufacture alternative mass standards to minimize theuncertainty due to the buoyancy correction, the majorcontribution to the uncertainty. Two of the methods forminimizing this uncertainty are to minimize the differ-ence in volume between the mass standard and unknownor perform measurements in vacuum. Since the behaviorof mass standards under vacuum is not yet fullyunderstood and is not practical as a disseminationmethod, methods to minimize the difference in volumehave been investigated. This requires using a material
whose density is close to that of platinum-iridium.Tungsten with a density of 19 300 kg/m3 satisfies thiscriteria and reduces the uncertainty associated with theair buoyancy correction to �1 �g. At the time of publi-cation of this paper, the possibility of machining asurface of tungsten to an average surface roughness of100 nm using chemo-mechanical polishing techniqueshave been demonstrated [24]. Stability tests of suchartifacts is planned for the near future.
1.7 Characterization of the Surfaces of MassStandards
In an effort to understand the stability of massstandards, we have characterized the surface roughnessand profiles of our national prototype kilograms K4 andK79 using noncontact surface profiling and opticalmicroscopy techniques. K4 and K79 are representativesof the two existing types of surface finish for primaryplatinum-iridium kilograms. K4 is one of the first40 replicas made; it was hand polished. K79 is represen-tative of the newer family of Pt-Ir kilograms manufac-tured at the BIPM turned using a diamond tool. Asummary of the results is provided here. For a moredetailed account of the work, see Ref. [25].
1.7.1 K4
K4 is one of two mass standards originally allocatedto the United States. The second mass standard, K20, isthe national standard of mass in the United States. BothK4 and K20 belong to the original group of 40 proto-type kilograms. All 40 kilograms were manufacturedfrom the same alloy and by the same process. It isbelieved that the surface of K4 is representative of thesurfaces of the original national mass standards.
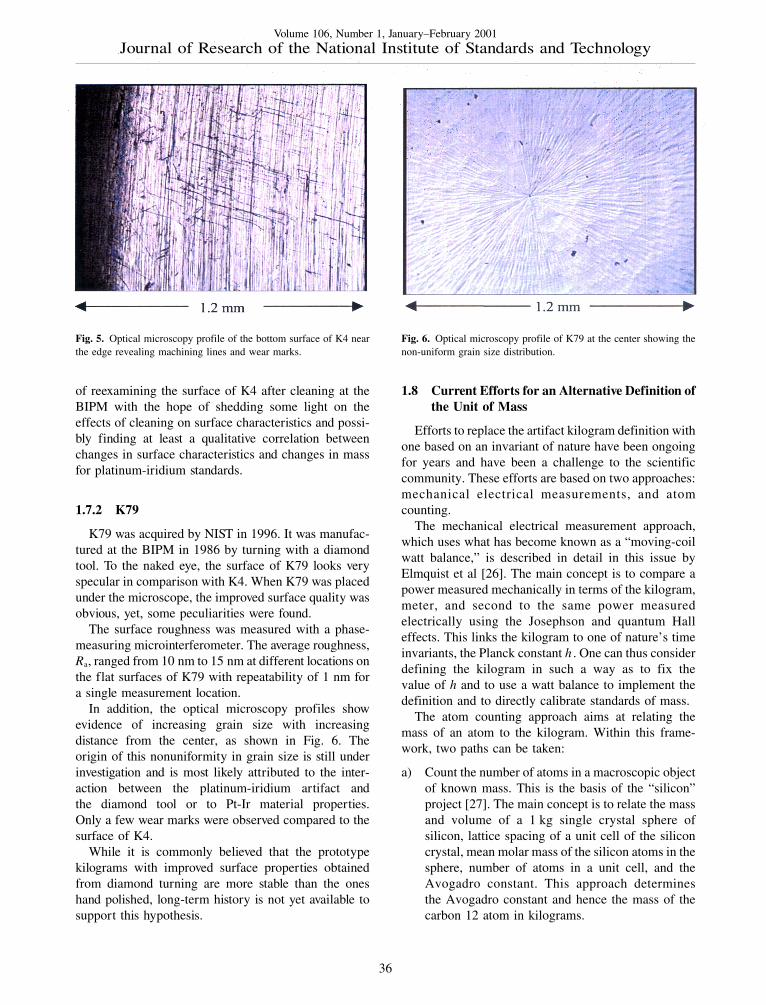
The machining lines on K4 are visible to the nakedeye. In addition, a few scratches are notably present onthe flat and cylindrical surfaces and have been histori-cally reported [19]. Optical microscope profiles reveal,in addition to the machining lines and numerous randomscratches, wear lines due to usage on balance pans for aperiod spanning over more than a century. These linescan be seen in Fig. 5 as short line-segments perpendic-ular to the machining lines. Using a white-lightscanning interferometer, we have measured averageroughness values, Ra, ranging from 63 nm to 84 nm atdifferent locations on the flat surfaces of K4 excludingthe center. The repeatability in a single measurementlocation of the average roughness is 1 nm. A detailedmapping of the surface of K4 can be found in Ref. [25].
It is worth noting that in spite of the peculiar surfacetexture that K4 exhibits, its mass, relative to IPK, hasonly changed by 41 �g between calibrations at theBIPM in 1889 and 1999. We are currently in the process
35
Volume 106, Number 1, January–February 2001Journal of Research of the National Institute of Standards and Technology
of reexamining the surface of K4 after cleaning at theBIPM with the hope of shedding some light on theeffects of cleaning on surface characteristics and possi-bly finding at least a qualitative correlation betweenchanges in surface characteristics and changes in massfor platinum-iridium standards.
1.7.2 K79
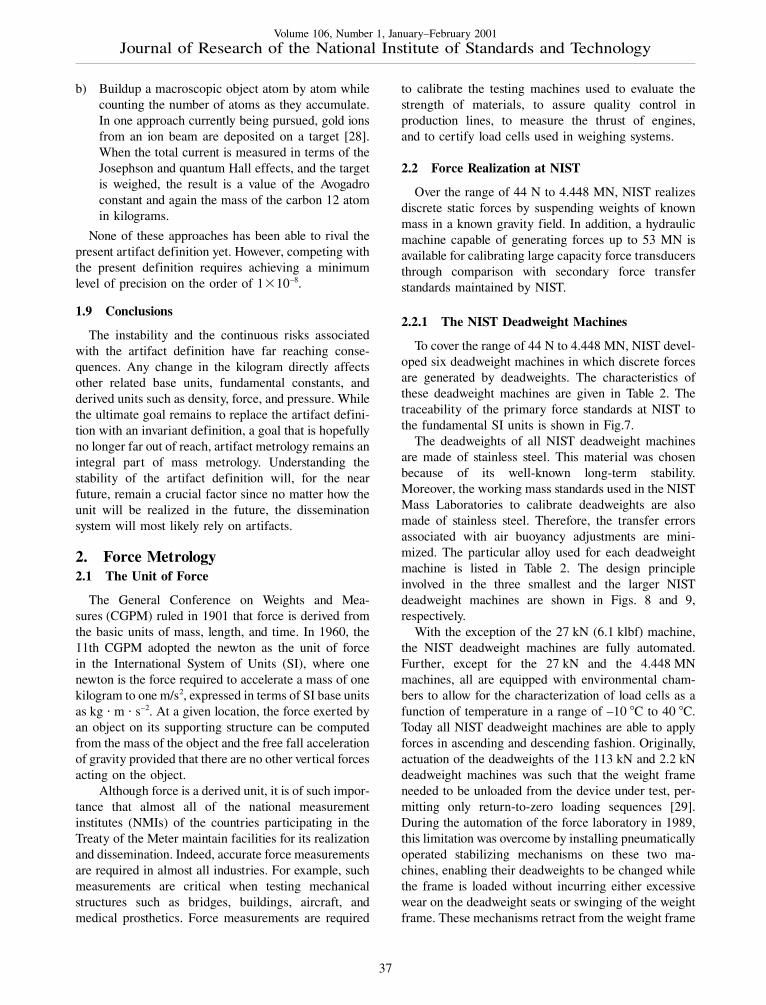
K79 was acquired by NIST in 1996. It was manufac-tured at the BIPM in 1986 by turning with a diamondtool. To the naked eye, the surface of K79 looks veryspecular in comparison with K4. When K79 was placedunder the microscope, the improved surface quality wasobvious, yet, some peculiarities were found.
The surface roughness was measured with a phase-measuring microinterferometer. The average roughness,Ra, ranged from 10 nm to 15 nm at different locations onthe flat surfaces of K79 with repeatability of 1 nm fora single measurement location.
In addition, the optical microscopy profiles showevidence of increasing grain size with increasingdistance from the center, as shown in Fig. 6. Theorigin of this nonuniformity in grain size is still underinvestigation and is most likely attributed to the inter-action between the platinum-iridium artifact andthe diamond tool or to Pt-Ir material properties.Only a few wear marks were observed compared to thesurface of K4.
While it is commonly believed that the prototypekilograms with improved surface properties obtainedfrom diamond turning are more stable than the oneshand polished, long-term history is not yet available tosupport this hypothesis.
1.8 Current Efforts for an Alternative Definition ofthe Unit of Mass
Efforts to replace the artifact kilogram definition withone based on an invariant of nature have been ongoingfor years and have been a challenge to the scientificcommunity. These efforts are based on two approaches:mechanical electrical measurements, and atomcounting.
The mechanical electrical measurement approach,which uses what has become known as a “moving-coilwatt balance,” is described in detail in this issue byElmquist et al [26]. The main concept is to compare apower measured mechanically in terms of the kilogram,meter, and second to the same power measuredelectrically using the Josephson and quantum Halleffects. This links the kilogram to one of nature’s timeinvariants, the Planck constant h . One can thus considerdefining the kilogram in such a way as to fix thevalue of h and to use a watt balance to implement thedefinition and to directly calibrate standards of mass.
The atom counting approach aims at relating themass of an atom to the kilogram. Within this frame-work, two paths can be taken:
a) Count the number of atoms in a macroscopic objectof known mass. This is the basis of the “silicon”project [27]. The main concept is to relate the massand volume of a 1 kg single crystal sphere ofsilicon, lattice spacing of a unit cell of the siliconcrystal, mean molar mass of the silicon atoms in thesphere, number of atoms in a unit cell, and theAvogadro constant. This approach determinesthe Avogadro constant and hence the mass of thecarbon 12 atom in kilograms.
Fig. 5. Optical microscopy profile of the bottom surface of K4 nearthe edge revealing machining lines and wear marks.
Fig. 6. Optical microscopy profile of K79 at the center showing thenon-uniform grain size distribution.
36
Volume 106, Number 1, January–February 2001Journal of Research of the National Institute of Standards and Technology
b) Buildup a macroscopic object atom by atom whilecounting the number of atoms as they accumulate.In one approach currently being pursued, gold ionsfrom an ion beam are deposited on a target [28].When the total current is measured in terms of theJosephson and quantum Hall effects, and the targetis weighed, the result is a value of the Avogadroconstant and again the mass of the carbon 12 atomin kilograms.
None of these approaches has been able to rival thepresent artifact definition yet. However, competing withthe present definition requires achieving a minimumlevel of precision on the order of 1�10–8.
1.9 Conclusions
The instability and the continuous risks associatedwith the artifact definition have far reaching conse-quences. Any change in the kilogram directly affectsother related base units, fundamental constants, andderived units such as density, force, and pressure. Whilethe ultimate goal remains to replace the artifact defini-tion with an invariant definition, a goal that is hopefullyno longer far out of reach, artifact metrology remains anintegral part of mass metrology. Understanding thestability of the artifact definition will, for the nearfuture, remain a crucial factor since no matter how theunit will be realized in the future, the disseminationsystem will most likely rely on artifacts.
2. Force Metrology2.1 The Unit of Force
The General Conference on Weights and Mea-sures (CGPM) ruled in 1901 that force is derived fromthe basic units of mass, length, and time. In 1960, the11th CGPM adopted the newton as the unit of forcein the International System of Units (SI), where onenewton is the force required to accelerate a mass of onekilogram to one m/s2, expressed in terms of SI base unitsas kg m s–2. At a given location, the force exerted byan object on its supporting structure can be computedfrom the mass of the object and the free fall accelerationof gravity provided that there are no other vertical forcesacting on the object.
Although force is a derived unit, it is of such impor-tance that almost all of the national measurementinstitutes (NMIs) of the countries participating in theTreaty of the Meter maintain facilities for its realizationand dissemination. Indeed, accurate force measurementsare required in almost all industries. For example, suchmeasurements are critical when testing mechanicalstructures such as bridges, buildings, aircraft, andmedical prosthetics. Force measurements are required
to calibrate the testing machines used to evaluate thestrength of materials, to assure quality control inproduction lines, to measure the thrust of engines,and to certify load cells used in weighing systems.
2.2 Force Realization at NIST
Over the range of 44 N to 4.448 MN, NIST realizesdiscrete static forces by suspending weights of knownmass in a known gravity field. In addition, a hydraulicmachine capable of generating forces up to 53 MN isavailable for calibrating large capacity force transducersthrough comparison with secondary force transferstandards maintained by NIST.
2.2.1 The NIST Deadweight Machines
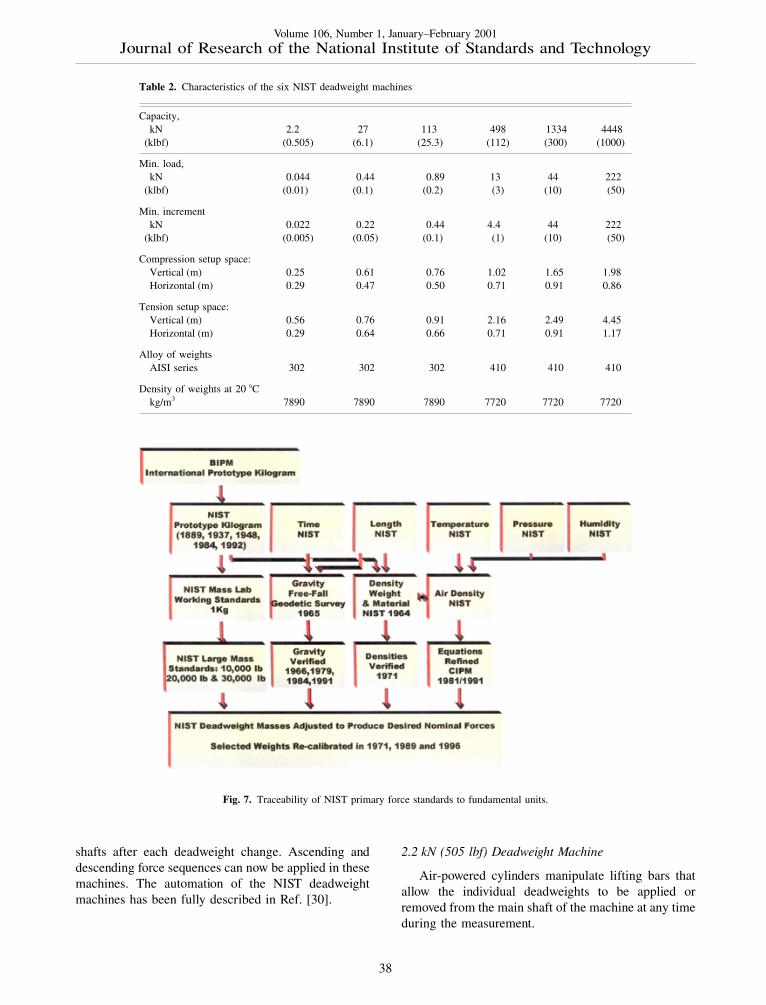
To cover the range of 44 N to 4.448 MN, NIST devel-oped six deadweight machines in which discrete forcesare generated by deadweights. The characteristics ofthese deadweight machines are given in Table 2. Thetraceability of the primary force standards at NIST tothe fundamental SI units is shown in Fig.7.
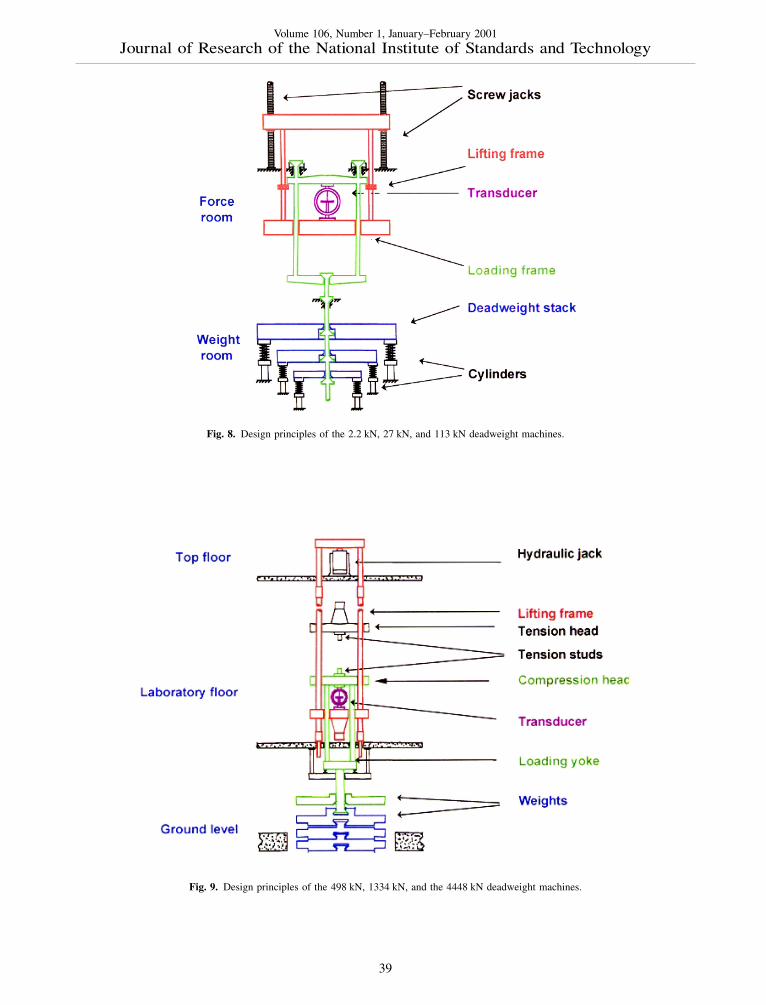
The deadweights of all NIST deadweight machinesare made of stainless steel. This material was chosenbecause of its well-known long-term stability.Moreover, the working mass standards used in the NISTMass Laboratories to calibrate deadweights are alsomade of stainless steel. Therefore, the transfer errorsassociated with air buoyancy adjustments are mini-mized. The particular alloy used for each deadweightmachine is listed in Table 2. The design principleinvolved in the three smallest and the larger NISTdeadweight machines are shown in Figs. 8 and 9,respectively.
With the exception of the 27 kN (6.1 klbf) machine,the NIST deadweight machines are fully automated.Further, except for the 27 kN and the 4.448 MNmachines, all are equipped with environmental cham-bers to allow for the characterization of load cells as afunction of temperature in a range of –10 �C to 40 �C.Today all NIST deadweight machines are able to applyforces in ascending and descending fashion. Originally,actuation of the deadweights of the 113 kN and 2.2 kNdeadweight machines was such that the weight frameneeded to be unloaded from the device under test, per-mitting only return-to-zero loading sequences [29].During the automation of the force laboratory in 1989,this limitation was overcome by installing pneumaticallyoperated stabilizing mechanisms on these two ma-chines, enabling their deadweights to be changed whilethe frame is loaded without incurring either excessivewear on the deadweight seats or swinging of the weightframe. These mechanisms retract from the weight frame
37
Volume 106, Number 1, January–February 2001Journal of Research of the National Institute of Standards and Technology
shafts after each deadweight change. Ascending anddescending force sequences can now be applied in thesemachines. The automation of the NIST deadweightmachines has been fully described in Ref. [30].
Table 2. Characteristics of the six NIST deadweight machines
Capacity,kN 2.2 27 113 498 1334 4448
(klbf) (0.505) (6.1) (25.3) (112) (300) (1000)
Min. load,kN 0.044 0.44 0.89 13 44 222
(klbf) (0.01) (0.1) (0.2) (3) (10) (50)
Min. incrementkN 0.022 0.22 0.44 4.4 44 222
(klbf) (0.005) (0.05) (0.1) (1) (10) (50)
Compression setup space:Vertical (m) 0.25 0.61 0.76 1.02 1.65 1.98Horizontal (m) 0.29 0.47 0.50 0.71 0.91 0.86
Tension setup space:Vertical (m) 0.56 0.76 0.91 2.16 2.49 4.45Horizontal (m) 0.29 0.64 0.66 0.71 0.91 1.17
Alloy of weightsAISI series 302 302 302 410 410 410
Density of weights at 20 �Ckg/m3 7890 7890 7890 7720 7720 7720
2.2 kN (505 lbf) Deadweight Machine
Air-powered cylinders manipulate lifting bars thatallow the individual deadweights to be applied orremoved from the main shaft of the machine at any timeduring the measurement.
Fig. 7. Traceability of NIST primary force standards to fundamental units.
38
Volume 106, Number 1, January–February 2001Journal of Research of the National Institute of Standards and Technology
Fig. 8. Design principles of the 2.2 kN, 27 kN, and 113 kN deadweight machines.
Fig. 9. Design principles of the 498 kN, 1334 kN, and the 4448 kN deadweight machines.
39
Volume 106, Number 1, January–February 2001Journal of Research of the National Institute of Standards and Technology
27 kN (6.1 klbf) Deadweight Machine
Hydraulic cylinders raise and lower the deadweightsindividually onto the main shaft, usually only while themachine is in the unloaded position. When the requireddeadweight complement is selected, the main shaftis positioned to allow force application to the unit-under-test. Limited ascending and descending loading is possi-ble in this machine under special circumstances.A unique feature of this deadweight machine is thatnominal metric forces can be applied by activating anauxiliary deadweight set. This deadweight machine isoperated manually.
113 kN (25.3 klbf) Deadweight Machine
Each deadweight is positioned by a pair of hydrauliccylinders. These cylinders allow application or removalof the deadweight to the main shaft at any time. Amanually placed set of auxiliary metric conversiondeadweights is available for this machine, which pro-duces nominal forces in 4.903 kN increments up to107.873 kN. These conversion deadweights are usedonly in nonautomated measurements.
498 kN (112 klbf) Deadweight Machine
Calibration forces are generated in this machine byserially applying deadweights from two different stacks.The minimum force is 13.3 kN (3000 lbf) which con-sists of the calibrated frame and main shaft of themachine and is always included as the first applied force.All other applied forces must be added to this minimum.The main stack consists of ten 44.4 kN (10 000 lbf)deadweights. The second stack consists of nine 4.44 kN(1000 lbf) deadweights. The deadweights are removedor added to the minimum 13.3 kN (3000 lbf) frame inincrements of 4.44 kN (1 000 lbf). An examination ofthe available deadweight combinations reveals that insome cases it is necessary to unload part of the smallstack in order to reach a particular ascending forcewithout first overshooting it.
1.33 MN (300 000 lbf) Deadweight Machine
All deadweights in this machine are applied sequen-tially with no further individual manipulation possible.The deadweights are of three different sizes. There arethirteen 44 kN (10 klbf) deadweights, four 89 kN(20 klbf) deadweights and three 133 kN (30 klbf) dead-weights. This arrangement allows the sequential calibra-tion in ten equally spaced increments of nominal 444 kN(100 klbf), 890 kN (200 klbf), and 1.33 MN (300 klbf)force transducers.
4.45 MN (1 000 000 lbf) Deadweight Machine
This deadweight machine simply applies twenty222 kN (50 000 lbf) forces sequentially. The main lift-ing frame raises hydraulically to pick up additionaldeadweights in the stack. This machine has been fullyautomated.
2.2.2 Weight Adjustment
When the force laboratory was built in 1965 the forcemeasurement unit in English speaking countries was thepound force (lbf). Accordingly, in 1965, a decision wasmade to adjust the mass of the weights of the dead-weight machines to exert nominal pound forces; thestandard pound force being defined as the force actingon a one-pound mass in a gravitational field for whichthe acceleration of free fall is 9.80665 m/s2. The actualmass required to produce a nominal force was computedfrom the following equation:
F =mg
9.80665 m/s2 �1–�a
�w�, (9)
where F is the generated standard pound force, m is themass of the weight in lb, g is the local acceleration offree fall at the elevation of the center of gravity of theweight in m /s2, �a is the air density, and �w is the densityof the weight material. The uncertainties in the determi-nation of m , �a, and g are the principal sources of uncer-tainty in the realized force.
The mass of each weight of the NIST deadweightmachines was determined in the Mass Laboratories ofthe National Bureau of Standards (NBS), the predeces-sor of NIST. These calibrations were performed in 1965prior to the assembly of the deadweights in themachines. Over the years some of the deadweights wererecalibrated in the Mass Laboratories.
The 498 kN deadweight machine was partially dis-assembled in 1971, and again in 1979 and in 1989, withmost of its deadweights removed and recalibrated eachtime. Any changes in the mass of the deadweights of thesmall and large weight stacks were well within theassigned uncertainties. The 2.2 kN deadweight machinewas completely refurbished in 1996, and all of its dead-weights were removed and recalibrated at that time; thechanges in the mass of the weights were again wellwithin the stated uncertainties. The results of the re-calibration of the weights indicate that, as expected, thealloys used in both the smaller and larger NIST dead-weight machines are very stable over time.
40
Volume 106, Number 1, January–February 2001Journal of Research of the National Institute of Standards and Technology
For each of the larger machines, the value of g wasestimated at the approximate center of gravity of themajor components and at the center of gravity of thedeadweight stacks. The gravity reference is located onthe concrete slab in Room 129 of the first floor ofBuilding 202 at the NIST site in Gaithersburg, MD,where the deadweight machines are located. A secondsite located in the basement of the same room, approx-imately 9 m laterally and 2.2 m below the first site, waschosen to establish a permanent reference point forabsolute determination of the acceleration of free fall bygravity meter measurements. The assigned value of g atthis location is (9.801018�5�10–6) m/s2, this value isbased upon an absolute determination conducted byTate in 1965. All other gravity values are based upon agravity gradient of –0.000003 m/s2 per meter elevation[31]. Subsequent gravity surveys conducted at severallocations within the force laboratory by the NationalOceanic and Atmospheric Administration confirmedthe results obtained in 1965, and tied the measuredvalues to the National gravity base.
During a year, the air density at the Gaithersburg sitemay vary over a range of 1.145 kg/m3 to 1.226 kg/m3.In 1965, when the facility was built, a decision wasmade to use an average yearly value of air density equalto 1.185 kg/m3.
2.2.3 Uncertainty in the Forces Realized byDeadweights
The relative combined standard uncertainties of theforces realized by the deadweight machines over therange of 44 N to 4.448 MN incorporate the uncertain-ties associated with the determination of the mass of thedeadweights, the acceleration due to gravity, and the airdensity as follows:
(a) The relative standard uncertainty in the determina-tion of the mass of the deadweights, uwa <0.0003 %.
(b) The maximum uncertainty caused by the use of anaverage air density. This is the largest systematicuncertainty in the applied force and is equal to0.0005 %. The estimated relative standard uncer-tainty, assuming a rectangular probability distribu-tion, is uwb � 0.0003 %.
(c) The relative standard uncertainty associated withthe variation in the acceleration of free fall withheight, assuming a rectangular probability distribu-tion, is uwc 0.0001 %.
The combined standard uncertainty in the force real-ized by deadweight application is computed as
uw = �u 2wa+u 2
wb+u 2wc . (10)
using the values listed in (a), (b), and (c) above yields acombined relative standard uncertainty in the realizedforce uw = 0.0005 % [32].
2.3 Comparison Force Calibration
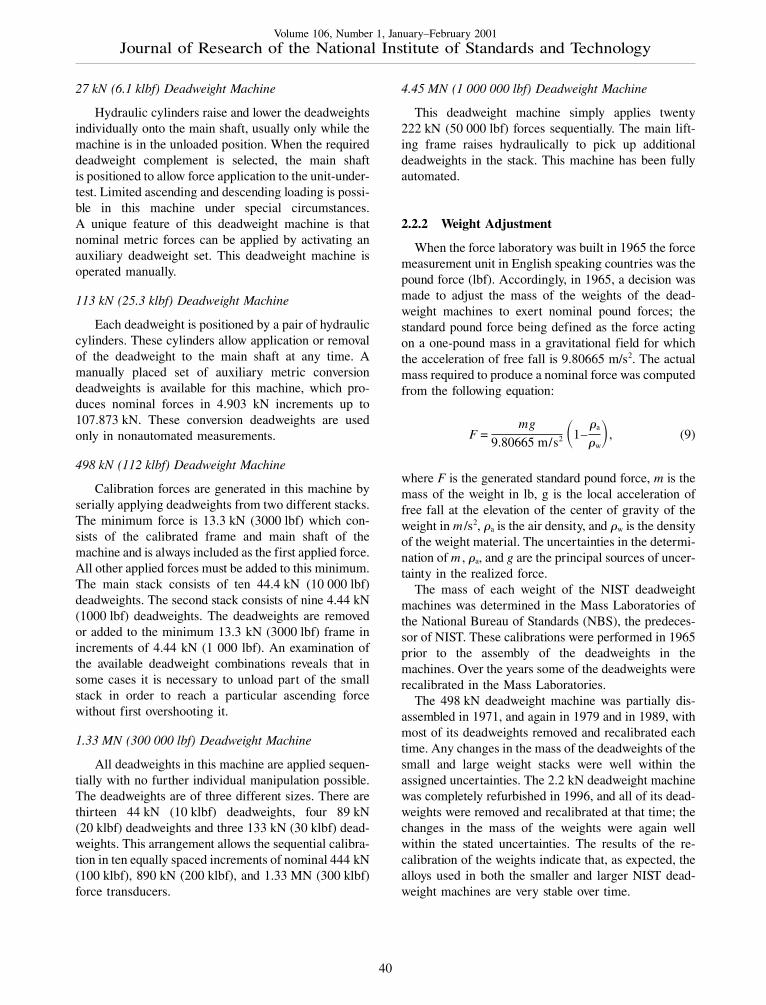
Above 4.448 MN, NIST provides compression cali-brations up to 53 MN by comparison with NIST transferstandard strain gage load cells using a 53 MN capacityuniversal testing machine shown schematically in Fig.10 [33]. For this purpose, NIST maintains a set of three4.448 MN NIST transfer standards, each calibrated inthe 4.448 MN deadweight machine, and a set of four13 MN transfer standards each calibrated by compari-son with three 4.448 MN transfer standards. In the
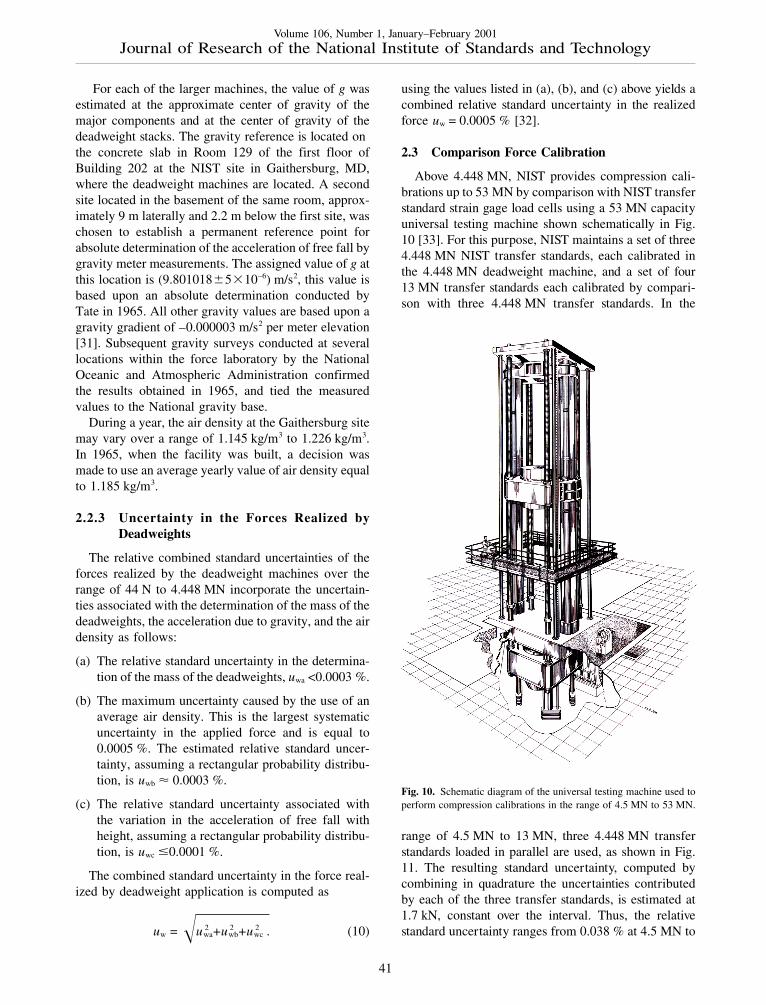
range of 4.5 MN to 13 MN, three 4.448 MN transferstandards loaded in parallel are used, as shown in Fig.11. The resulting standard uncertainty, computed bycombining in quadrature the uncertainties contributedby each of the three transfer standards, is estimated at1.7 kN, constant over the interval. Thus, the relativestandard uncertainty ranges from 0.038 % at 4.5 MN to
Fig. 10. Schematic diagram of the universal testing machine used toperform compression calibrations in the range of 4.5 MN to 53 MN.
41
Volume 106, Number 1, January–February 2001Journal of Research of the National Institute of Standards and Technology
0.013 % at 13 MN. From 13 MN to 40 MN, three13 MN transfer standards are used. The resulting stan-dard uncertainty is estimated at 5 kN, constant over theinterval, with relative standard uncertainties rangingfrom 0.038 % at 13 MN to 0.013 % at 40 MN. From40 MN to 53 MN, four 13 MN transfer standards areused resulting in an estimated standard uncertainty of5.9 kN, and a relative standard uncertainty ranging from0.015 % at 40 MN to 0.011 % at 53 MN.
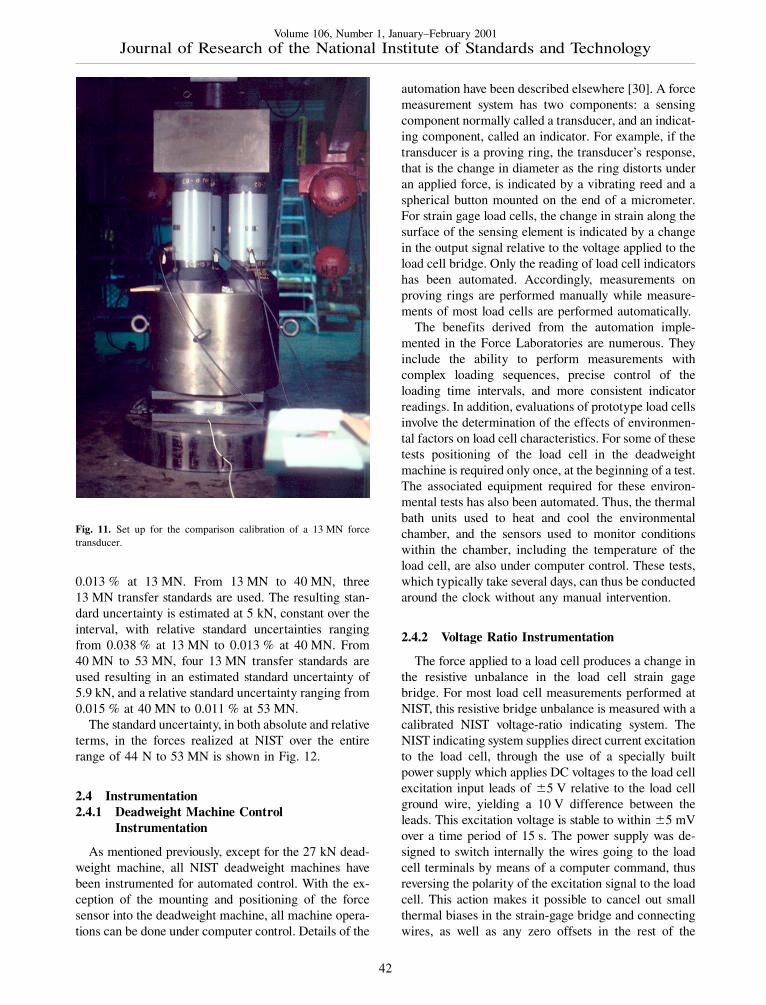
The standard uncertainty, in both absolute and relativeterms, in the forces realized at NIST over the entirerange of 44 N to 53 MN is shown in Fig. 12.
2.4 Instrumentation2.4.1 Deadweight Machine Control
Instrumentation
As mentioned previously, except for the 27 kN dead-weight machine, all NIST deadweight machines havebeen instrumented for automated control. With the ex-ception of the mounting and positioning of the forcesensor into the deadweight machine, all machine opera-tions can be done under computer control. Details of the
automation have been described elsewhere [30]. A forcemeasurement system has two components: a sensingcomponent normally called a transducer, and an indicat-ing component, called an indicator. For example, if thetransducer is a proving ring, the transducer’s response,that is the change in diameter as the ring distorts underan applied force, is indicated by a vibrating reed and aspherical button mounted on the end of a micrometer.For strain gage load cells, the change in strain along thesurface of the sensing element is indicated by a changein the output signal relative to the voltage applied to theload cell bridge. Only the reading of load cell indicatorshas been automated. Accordingly, measurements onproving rings are performed manually while measure-ments of most load cells are performed automatically.
The benefits derived from the automation imple-mented in the Force Laboratories are numerous. Theyinclude the ability to perform measurements withcomplex loading sequences, precise control of theloading time intervals, and more consistent indicatorreadings. In addition, evaluations of prototype load cellsinvolve the determination of the effects of environmen-tal factors on load cell characteristics. For some of thesetests positioning of the load cell in the deadweightmachine is required only once, at the beginning of a test.The associated equipment required for these environ-mental tests has also been automated. Thus, the thermalbath units used to heat and cool the environmentalchamber, and the sensors used to monitor conditionswithin the chamber, including the temperature of theload cell, are also under computer control. These tests,which typically take several days, can thus be conductedaround the clock without any manual intervention.
2.4.2 Voltage Ratio Instrumentation
The force applied to a load cell produces a change inthe resistive unbalance in the load cell strain gagebridge. For most load cell measurements performed atNIST, this resistive bridge unbalance is measured with acalibrated NIST voltage-ratio indicating system. TheNIST indicating system supplies direct current excitationto the load cell, through the use of a specially builtpower supply which applies DC voltages to the load cellexcitation input leads of �5 V relative to the load cellground wire, yielding a 10 V difference between theleads. This excitation voltage is stable to within �5 mVover a time period of 15 s. The power supply was de-signed to switch internally the wires going to the loadcell terminals by means of a computer command, thusreversing the polarity of the excitation signal to the loadcell. This action makes it possible to cancel out smallthermal biases in the strain-gage bridge and connectingwires, as well as any zero offsets in the rest of the
Fig. 11. Set up for the comparison calibration of a 13 MN forcetransducer.
42
Volume 106, Number 1, January–February 2001Journal of Research of the National Institute of Standards and Technology
indicating system. The switching is not done if the loadcell is not designed to accommodate reversed polarityexcitation. The excitation voltage and the load cell out-put voltage are sampled simultaneously by an 8.5 digitcomputing voltmeter operating in the voltage-ratiomode; the voltmeter calculates the correspondingvoltage ratio internally and returns that value in digitalform to the computer. The voltmeter is read severaltimes, with the excitation voltage polarity reversedbetween readings; the final voltage ratio is taken as theaverage of the voltage ratios measured at each polarity.The sampling time at each polarity, and the delay afterswitching polarity before resuming the sampling, arespecified by the operator through the computer control/acquisition program. A typical time for one completevoltage ratio reading is 10 s. This time can be shortenedor lengthened as appropriate for the measurement beingconducted. Calibration of the voltmeters in the voltage-ratio mode is done by providing calibrated DC voltagesignals simultaneously to both inputs, with the DCcalibrated signals derived from a 10 V Josephsonjunction reference voltage array maintained by theElectricity Division of the NIST Electronics andElectrical Engineering Laboratory. The NIST Elec-tricity Division calibrates the Force Laboratories volt-meters each year. In the Force Laboratories the calibra-tion of all voltmeters is maintained by monthlycomparison with the voltmeter most recently calibrated
by the Electricity Division. This is accomplishedthrough the use of two devices: a precision voltagereference divider having a 100:1 ratio and a load cellsimulator that is stable to within �5 nV/V over a 24 htime interval.
2.4.3 Uncertainty in Voltage Ratio Measurement
The standard uncertainty associated with the digitalvoltmeters used in the NIST Force Laboratories forvoltage-ratio measurement arises from the following:
(a) The uncertainty in calibration of the voltage-ratio ofthe voltmeters as determined by the NIST Electric-ity Division using a Josephson junction voltagearray as a primary standard; the relative standarduncertainty in the voltage ratio over the range from1 mV/V to 10 mV/V is
uva 0.0002 %.
(b) Differences between voltmeter calibrations per-formed by the NIST Electricity Division and com-parisons to a 10 mV/V reference ratio obtainedwith a precision reference divider used in the ForceLaboratories to track the voltmeter drift. Theestimated relative standard uncertainty of thesedifferences is uvb � 0.0003 %.
Fig. 12. Standard uncertainty in the forces realized at NIST.
43
Volume 106, Number 1, January–February 2001Journal of Research of the National Institute of Standards and Technology
(c) The repeatability in measurements for eachvoltmeter (made at one-month intervals) of the10 mV/V response relative to the precision refer-ence divider; the relative standard uncertainty foran individual voltmeter is uvc = 0.0003 % of thereference ratio.
(d) The non-linearity in the voltage-ratio measurementresponse of the voltmeters in the range of 1 mV/Vto 10 mV/V; the estimated relative standard uncer-tainty based on Electricity Division data isuvd � 0.0001 % of the reference ratio.
The combined standard uncertainty in the voltage-ratio instrument is given by:
uv = �u 2va+u 2
vb+u 2vc+u 2
vd . (11)
Inserting the values given above yields a relativestandard uncertainty for the voltage ratio of about0.0005 %.
2.5 Procedures
The forces realized at NIST are disseminated toindustry, government, and the research communitythrough the force calibration services that NISTprovides. The objective in calibrating a force sensor is todetermine the functional relationship between theapplied load and the sensor response. In the Force Lab-oratory, this is accomplished by applying a series ofwell-known forces to the sensor and observing its re-sponse on a readout instrument. Many force sensors canbe calibrated in both tension and compression modeswith the responses expected to be somewhat different ineach mode. Due to hysteresis effects, the response mayalso depend on whether the loads are applied in ascend-ing or descending order. Accordingly, for any onesensor, there may be several distinct calibration curves.
Force calibrations at NIST are usually performedaccording to the procedures specified by the AmericanSociety for Testing and Materials (ASTM) StandardPractice E74 [34]. A minimum of 30 forces are appliedduring the course of each calibration. These forces areapplied in two or more calibration runs with typicallythree positions of the sensor in the deadweight machineto minimize the machine-sensor interactions [35-36].The applied forces are selected at approximately every10 % increment over of the entire calibration range.Upon request, a device may be calibrated by modifiedprocedures tailored to meet particular end uses. Forexample, additional loads may be added, and the loadingsequence may include both ascending and descendingloads to thoroughly characterize the hysteresis of the
force transducer. To obtain the actual response of thetransducer, the indicator reading observed during aforce application is corrected for the reading observedwithout any force application. The calibration curve isderived by fitting a polynomial to the data using themethod of least squares. The calibration curve is of theform:
D = A0 + � Ai F i , (12)
where D is the response, F is the applied force, Ai are thecoefficients yielded by the least-squares fit and thesummation is usually carried to an order of two or three.
ASTM E 74-95 [34] specifies a standard deviationthat is calculated from the differences between the val-ues observed during the course of calibration and thecorresponding values computed from the calibrationcurve. This standard deviation is given by:
s = �� d 2j
(n–m ), (13)
where s is the standard deviation, the dj are the differ-ences between the measured and calculated deflections,n is the number of measured deflections, and m is thenumber of degrees of freedom in the polynomial, whichis the degree of the polynomial plus one. This standarddeviation is one of the terms used in estimating thecombined uncertainty as reported in the NIST calibra-tion reports where it is denoted as ur. The uncertaintiescontained in ur are ordinarily much greater than theuncertainty in the applied load. The two major sourcesof systematic errors are mechanical misalignment andload-time effects [35,36]. Complex mechanical interac-tions between the force sensor and the deadweightmachine can cause bending, shear, and torsional loads toact in combination with the precisely known verticalforce. In addition, the transducer response is also depen-dent upon the load history. A detailed statistical analysisthat yields separate estimates of uncertainty arisingfrom various possible sources of error can be found inRef. [37].
The combined standard uncertainty stated in NISTforce calibration reports is computed using the follow-ing equation:
Uc = �u 2w+u 2
v +u 2r . (14)
where Uc is the combined standard uncertainty asdefined in Ref. [17], uw is the standard uncertainty of theapplied deadweight, uv is the standard uncertainty of the
44
Volume 106, Number 1, January–February 2001Journal of Research of the National Institute of Standards and Technology
calibration of the voltage-ratio measurement instrumen-tation, and ur is the standard deviation calculated accord-ingly to ASTM E 74-95. It should be noted that the termuv applies only in calibrations involving voltage-ratiomeasurements performed using the NIST voltmeters.
In addition to performing calibrations, the ForceLaboratory performs pattern evaluation tests of loadcells used in weighing systems, which provide the basisfor the classification by weights and measures officialsof load cell families used in weighing systems. Thesetests are performed in accordance with the specifica-tions of the National Conference of Weights andMeasures Publication 14 [38], and a similar inter-national standard, OIML R60 [39], adopted by theInternational Organization of Legal Metrology. Whilethere are some differences between the national andinternational standards, they are minimal. Both proce-dures prescribe deadweight loading tests of prototypeload cells for the linearity, hysteresis, repeatability, andcreep over a temperature range of –10 �C to 40 �C. Inaddition, both require that canister load cells be testedfor atmospheric pressure sensitivity over a range of95 kPa to 105 kPa.
2.6 Current Force Metrology Research
Two main efforts are now underway at NIST in thearea of force metrology. They include:
a) The development of a research laboratory for therealization, measurement and repeatable dis-semination of very small forces (in the micro- andnano-newton range) to address the emergent forcemeasurement needs of a growing class of nano-technologies, including atomic microscopes,nanoindentors, and micro-electromechanicalsystems (MEMS); and
b) The development of a testing facility to assess thesusceptibility of digital load cells to electro-magnetic radiation.
Acknowledgments
The authors gratefully acknowledge the dedication ofT. Bartel, K. Chesnutwood, W. Crupe, S. Ho, J. Keller,L. Martinez, and R. Seifarth in providing measurementservices of the highest quality to the U.S. Governmentand industry. Z. J. J. gratefully acknowledges V. Lee forthe automation of the balances and M. C. Croarkin ofthe Statistical Engineering Division of the NIST Infor-mation Technology Laboratory for her invaluable contri-butions to the development and implementation ofstatistical process control procedures.
3. References[1] L. V. Judson, Weights and measures standards of the United
States, a brief history, NBS Spec. Pub. 447 (1963) updated(1976).
[2] H. P. Chester and P. Vigoureux, eds, The International Bureau ofWeights and Measures 1875-1975, NBS Spec. Pub. 420 (1975).
[3] H. E. Almer, National Bureau of Standards kilogram balanceNBS no. 2, J. Res. Natl. Bur. Stand. (U.S) 76C, 1-10 (1972).
[4] Girard G., The third periodic verification of national prototypesof the kilogram (1988-1992), Metrologia 31, 317-336 (1994).
[5] Girard G., The washing and cleaning of kilogram prototypes atthe BIPM, BIPM (1990).
[6] BIPM, Proc.-Verb. Com. Int. Poids Mesures 57, 15-17 (1989).[7] Z. J. Jabbour, Effects of cleaning on mass standards, manuscript
in preparation.[8] R. S. Davis, Equation for the determination of the density of
moist air (1981/91), Metrologia 29, 67-70 (1992).[9] R. M. Schoonover and R. S. Davis, Quick and accurate density
determination of laboratory weights, Proc. 8th conf. IMEKOTech. Comm. TC3 (1980).
[10] H. A. Bowman and R. M. Schoonover, Procedure for high-preci-sion density determinations by hydrostatic weighing, J. Res.Natl. Bur. Stand. (U.S.) 71C (3), 179-198 (1967).
[11] H. A. Bowman, R. M. Schoonover, C. L. Carroll, The utilizationof solid objects as reference standards in density measurements,Metrologia 10, 117-121 (1974).
[12] R. D. Deslattes, Proceedings of course LXVIII Metrology andFundamental Constants, Summer School of Physics—EnricoFermi, Varenna Italy (1976), Soc. Italiana di Fisica, Bologna,38-113 (1980).
[13] R. S. Davis, Private Communication.[14] R. S. Davis, Note on the choice of a sensitivity weight in preci-
sion weighing, J. Res. Natl. Bur. Stand. (U.S.) 92 (3), 239-242(1987).
[15] J. M. Cameron, M. C. Croarkin, and R. C. Raybold, Designs forthe calibration of standards of mass, NBS Tech. Note 952 (1977).
[16] R. N. Varner, R. C. Raybold, National Bureau of Standards masscalibrations andomputer software, NBS Tech. Note 1127 (1980).
[17] Guide to the expression of uncertainty in measurement, ISO(1993).
[18] M. C. Croarkin, An extended error model for comparisoncalibration, Metrologia 26, 107-113 (1989).
[19] R. S. Davis, Recalibration of the U.S. national prototype kilo-gram, J. Res. Natl. Bur. Stand. (U.S.) 90 (4), 263-283 (1985).
[20] P. E. Pontius, J. M. Cameron, Realistic uncertainties and themass measurement process, NBS Monogr. 163, (1979).
[21] A. T. Pienkowsky, Short tests for sets of laboratory weights, Sci.papers Bur. Stand. (S-527) 21, 65-93 (1926).
[22] V. Lee, Technical Documentation for the Mass CalibrationLaboratory Balance Automation, NISTIR 6283 (1999).
[23] R. S. Davis, Determining the magnetic properties of 1 kg massstandards, J. Res. Natl. Inst. Stand. Technol. 100 (3), 209-225(1995).
[24] E. Paul, Private Communication.[25] Z. J. Jabbour and C. J. Evans, Surface roughness and profiles of
platinum-iridium prototype kilograms, manuscript in prepara-tion.
[26] R. E. Elmquist, M. E. Cage, Y. T. Tang, A. Jeffery, J. R. Kinard,R. F. Dziuba, N. M. Oldham, and E. R. Williams, The Ampereand Electrical Standards, J. Res. Natl. Inst. Stand. Technol. 000(2001).
45
Volume 106, Number 1, January–February 2001Journal of Research of the National Institute of Standards and Technology
[27] P. Seyfried and P. Becker, The role of NA in the SI: an atomicpath to the kilogram, Metrologia 31, 167-172 (1994).
[28] M. Glaeser, Proposal for a novel method of precisely determin-ing the atomic mass unit by the accumulation of ions, Rev. Sci.Instrum. 62, 2493-2494 (1991).
[29] R. A. Mitchell, Force Calibration at the National Bureau ofStandards, NBS Technical Note 1227, U.S. Department ofCommerce, National Bureau of Standards, Gaithersburg, MD(1986).
[30] K. W. Yee, Automation of Strain Gage Load Cell Force Calibra-tions, Proc.1992 Natl. Conf. of Stand. Lab. Workshop andSymposium, Washington, DC (1992) pp. 387-391 .
[31] R. D. Tate, Acceleration Due to Gravity at the National Bureauof Standards, J. Res. Natl. Bur. Stand. (U.S.) 72 (1), 1-20 (1967).
[32] T. W. Bartel, S. L. Yaniv, and R. L. Seifarth, Force MeasurementServices at NIST: Equipment, Procedures, and Uncertainty,1997 Natl. Conf. of Stad. Lab. Workshop and Symposium (1997)pp. 421-431
[33] A. F. Kirkstein, Universal Testing Machine of 12-Million lbfCapacity at the national Bureau of Standards, Spec.Pub. 355(1971).
[34] ASTM E 74-95, Standard Practice of Calibration of Force-Measuring Instruments for Verifying the Force Indication ofTesting Machines, ASTM Annual Book of ASTM Standards,Volume 03.01 (1996).
[35] R. A. Mitchell and P. E. Pontius, Inherent Problems in ForceMeasurement, Exper. Mech. 22, 81-88 (1982).
[36] M. Peters, A. Sawla, and D. Peschel, Uncertainty in ForceMeasurement, Report of the CCM Working Group Force, PTB-Tericht MA-17 (1990).
[37] C.P. Reeve, A Statistical Model for the Calibration of ForceSensors, NBS Technical Note 1246, (1988).
[38] NIST handbook 44, Specifications, Tolerances, and OtherTechnical Requirements for Weighing and Measuring Devices,(1999).
[39] International Organization for Legal Metrology R60, Metrologi-cal Regulations for Load Cells, Bureau International for LegalMetrology, Paris, France (1991).
About the authors: Zeina J. Jabbour joined the PhysicsLaboratory at NIST in 1994 as a National ResearchCouncil Postdoctoral fellow. She is currently the Leaderof the Mass and Force Group of the ManufacturingMetrology Division in the Manufacturing EngineeringLaboratory at NIST. Simone L. Yaniv served as theLeader of the Force Group from August 1986 throughOctober 2000. She served as the senior program analystin the Director’s Office of the Manufacturing Engineer-ing Laboratory from 1994 to 1995, and as the DeputyChief of the Automated Production Technology Division,the predecessor of the Manufacturing MetrologyDivision, from 1995 to 1998. She is now retired.
46