Embed Size (px)
Citation preview
MADISON STREAM TEAM WATER QUALITY MONITORING PROJECT
SAMPLING AND ANALYSIS PLAN
Prepared for the Montana Department of Environmental Quality
November 8, 2012
Updated June 4, 2013
Prepared by:
Adam Sigler MSU Extension Water Quality P. O. Box 173120 Bozeman, MT 59717-3120 Sunni Heikes-Knapton Madison Watershed Coordinator PO Box 606 Ennis, MT 59729 Approvals:
________________________________________________ _____________
Robert Ray (Watershed Protection Section Supervisor) Date
________________________________________________ _____________
Mindy McCarthy (QA Officer) Date

Page intentionally left blank
Contents INTRODUCTION ........................................................................................................................................ 6
PROJECT OBJECTIVES ............................................................................................................................... 6
SAMPLING DESIGN ................................................................................................................................... 6
PROJECT TEAM RESPONSIBILITIES .......................................................................................................... 11
SAMPLING METHODS ............................................................................................................................ 11
FIELD METHODS ............................................................................................................................................ 11 PHOTO-POINT COLLECTION ............................................................................................................................ 12 FLOW (DISCHARGE) MEASUREMENT ................................................................................................................ 13 WATER SAMPLE COLLECTION AND HANDLING FOR LABORATORY ANALYSIS .............................................................. 13
QUALITY ASSURANCE AND QUALITY CONTROL REQUIREMENTS ............................................................ 15
DATA QUALITY OBJECTIVES ............................................................................................................................ 15 DATA QUALITY INDICATORS ............................................................................................................................ 16 QUALITY ASSURANCE FOR FIELD QUALITY CONTROL SAMPLES ............................................................................... 16 QUALIFYING DATA THAT FAILS DATA QUALITY CRITERIA ......................................................................................... 17
TRAINING ............................................................................................................................................... 17
DATA ANALYSIS, RECORD KEEPING & REPORTING REQUIREMENTS ....................................................... 18
REFERENCES ........................................................................................................................................... 19
MST BUDGET 2013 ................................................................................................................................. 20
QUALITY CONTROL CHECKLIST ............................................................................................................... 22
QA/QC TERMS ....................................................................................................................................... 23
DATA QUALIFIERS AND DESCRIPTIONS .................................................................................................. 27
EXAMPLE QAQC MATRIX........................................................................................................................ 28
List of Figures and Tables
Figure 1: Upper Madison Watershed, stream segments on the MT DEQ 303d list. ......... 7
Figure 3: Sites in Madison Stream Team sampling program ........................................... 21
Table 1: Lab parameters to be analyzed by stream during 2012. ..................................... 8
Table 2: Sample site IDs, names, coordinates and descriptions. ........................................ 8
Table 3: Sample site selection rational ............................................................................... 9
Table 4: Project team members and responsibilities ....................................................... 11
Table 5: Field instruments and performance characteristics ........................................... 12
Table 6: Lab parameter analytical methods, reporting limits, hold times, and preservatives. .................................................................................................................... 14
Table 7: Data quality indicator criteria for field QC samples ............................................ 16
Table 8: Data quality indicator criteria for lab QC samples .............................................. 17

Page intentionally left blank
Madison Stream Team Sampling and Analysis Plan Page 6
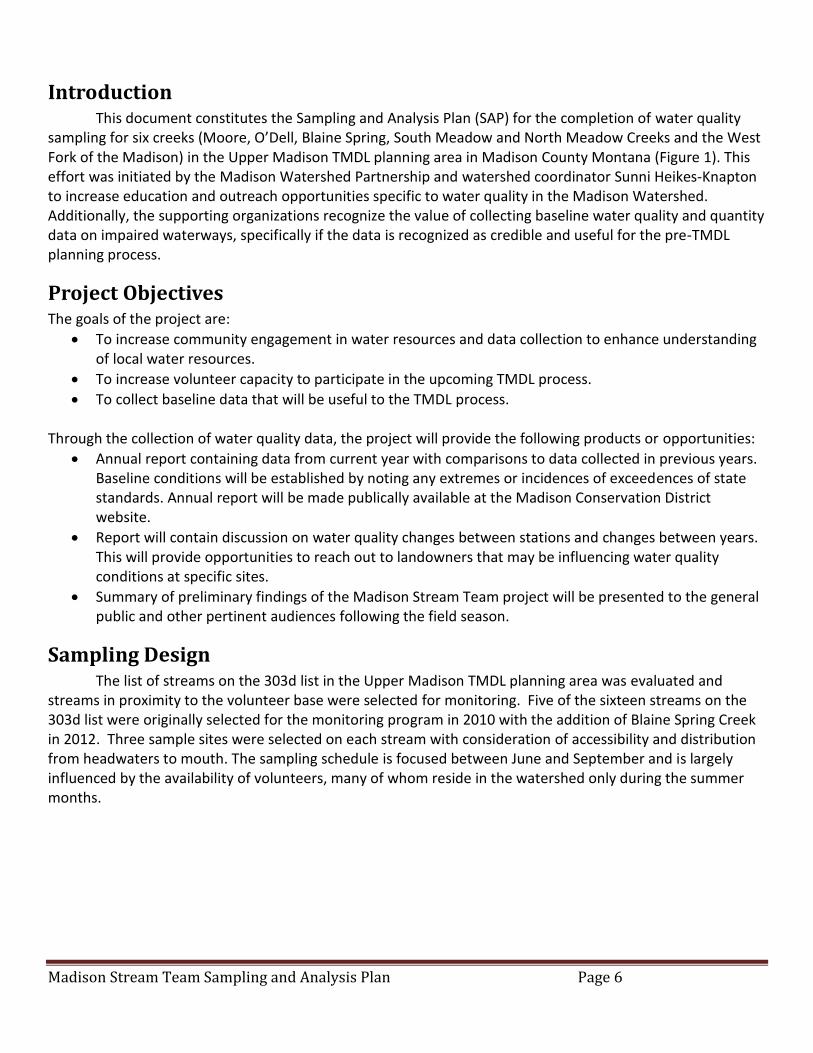
Introduction This document constitutes the Sampling and Analysis Plan (SAP) for the completion of water quality sampling for six creeks (Moore, O’Dell, Blaine Spring, South Meadow and North Meadow Creeks and the West Fork of the Madison) in the Upper Madison TMDL planning area in Madison County Montana (Figure 1). This effort was initiated by the Madison Watershed Partnership and watershed coordinator Sunni Heikes-Knapton to increase education and outreach opportunities specific to water quality in the Madison Watershed. Additionally, the supporting organizations recognize the value of collecting baseline water quality and quantity data on impaired waterways, specifically if the data is recognized as credible and useful for the pre-TMDL planning process.
Project Objectives The goals of the project are:
To increase community engagement in water resources and data collection to enhance understanding of local water resources.
To increase volunteer capacity to participate in the upcoming TMDL process.
To collect baseline data that will be useful to the TMDL process. Through the collection of water quality data, the project will provide the following products or opportunities:
Annual report containing data from current year with comparisons to data collected in previous years. Baseline conditions will be established by noting any extremes or incidences of exceedences of state standards. Annual report will be made publically available at the Madison Conservation District website.
Report will contain discussion on water quality changes between stations and changes between years. This will provide opportunities to reach out to landowners that may be influencing water quality conditions at specific sites.
Summary of preliminary findings of the Madison Stream Team project will be presented to the general public and other pertinent audiences following the field season.
Sampling Design The list of streams on the 303d list in the Upper Madison TMDL planning area was evaluated and
streams in proximity to the volunteer base were selected for monitoring. Five of the sixteen streams on the 303d list were originally selected for the monitoring program in 2010 with the addition of Blaine Spring Creek in 2012. Three sample sites were selected on each stream with consideration of accessibility and distribution from headwaters to mouth. The sampling schedule is focused between June and September and is largely influenced by the availability of volunteers, many of whom reside in the watershed only during the summer months.
Madison Stream Team Sampling and Analysis Plan Page 7
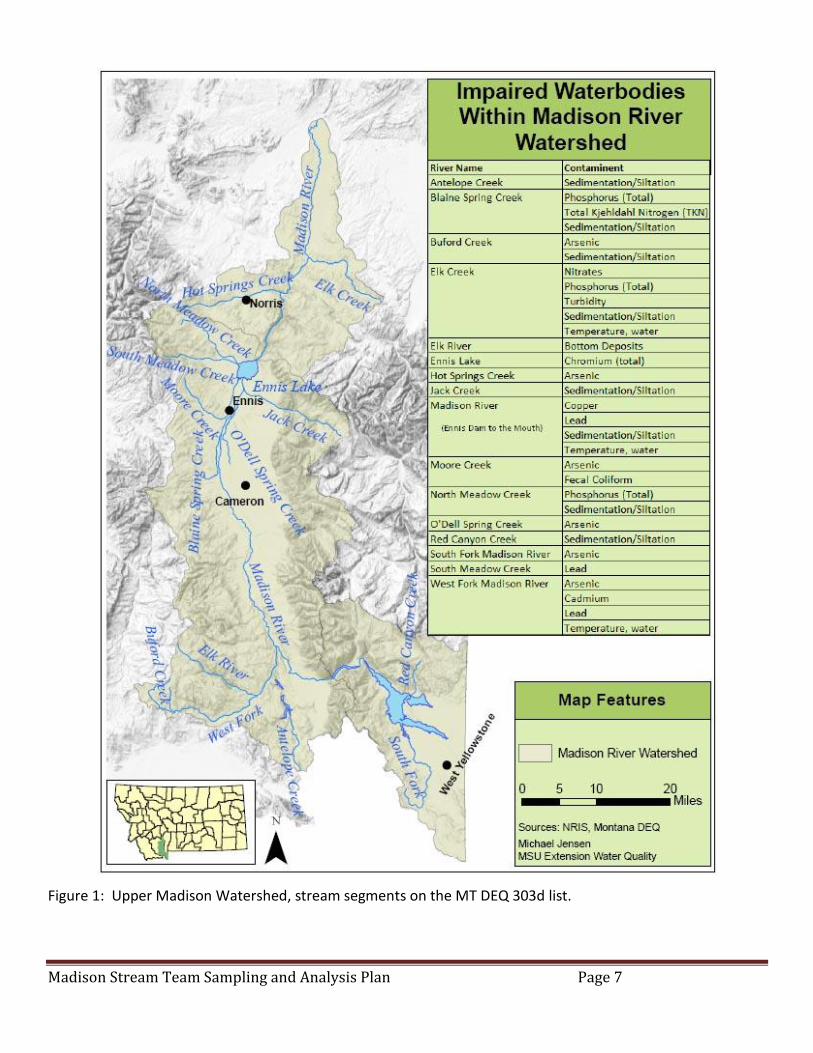
Figure 1: Upper Madison Watershed, stream segments on the MT DEQ 303d list.
Madison Stream Team Sampling and Analysis Plan Page 8
Data collection activities to be conducted at each site on each sample date are outlined in tabular format in the separate SOP. On each visit to each site for each stream, collection of field parameters (temperature, pH, specific conductance, and dissolved oxygen), discharge, turbidity and nuisance algae photo documentation will occur. Pebble counts will occur at each site on each stream once per year during low flow (August). Water samples will be collected for chemical analysis on Moore, O’Dell, South and North Meadow Creeks, Blaine Spring Creek, and the West Fork of the Madison.
Lab analysis in 2013 will target a suite of nutrients and arsenic. Nutrient analytes include total persulfate nitrogen, total phosphorus, and nitrate plus nitrite. Quality assurance and quality control measures (blank and duplicate samples) will be collected during the July sampling events. Samples will be collected at all sites along all streams at each site visit. A detailed outline of the parameters which are slated to be analyzed at each site is presented in Table 1.
The chemistry sampling plan was put together with input from Katie Makarowski (MDEQ) and based on results from previous years samplings.
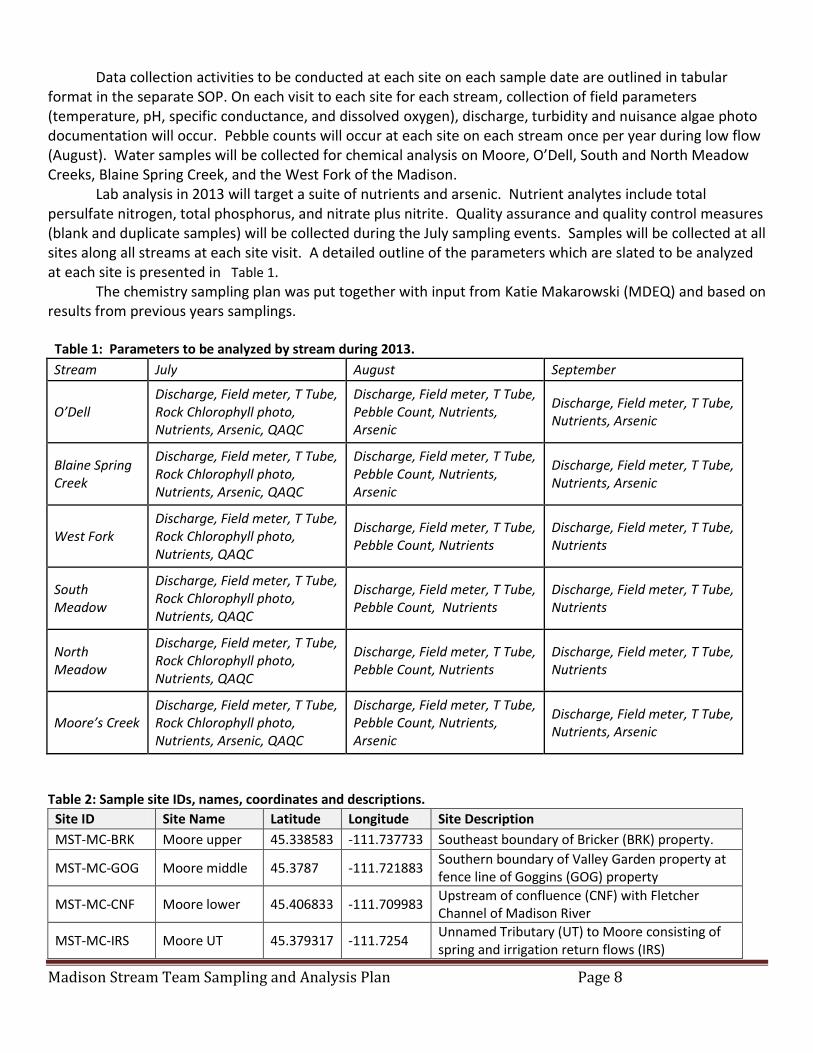
Table 1: Parameters to be analyzed by stream during 2013.
Stream July August September
O’Dell Discharge, Field meter, T Tube, Rock Chlorophyll photo, Nutrients, Arsenic, QAQC
Discharge, Field meter, T Tube, Pebble Count, Nutrients, Arsenic
Discharge, Field meter, T Tube, Nutrients, Arsenic
Blaine Spring Creek
Discharge, Field meter, T Tube, Rock Chlorophyll photo, Nutrients, Arsenic, QAQC
Discharge, Field meter, T Tube, Pebble Count, Nutrients, Arsenic
Discharge, Field meter, T Tube, Nutrients, Arsenic
West Fork Discharge, Field meter, T Tube, Rock Chlorophyll photo, Nutrients, QAQC
Discharge, Field meter, T Tube, Pebble Count, Nutrients
Discharge, Field meter, T Tube, Nutrients
South Meadow
Discharge, Field meter, T Tube, Rock Chlorophyll photo, Nutrients, QAQC
Discharge, Field meter, T Tube, Pebble Count, Nutrients
Discharge, Field meter, T Tube, Nutrients
North Meadow
Discharge, Field meter, T Tube, Rock Chlorophyll photo, Nutrients, QAQC
Discharge, Field meter, T Tube, Pebble Count, Nutrients
Discharge, Field meter, T Tube, Nutrients
Moore’s Creek Discharge, Field meter, T Tube, Rock Chlorophyll photo, Nutrients, Arsenic, QAQC
Discharge, Field meter, T Tube, Pebble Count, Nutrients, Arsenic
Discharge, Field meter, T Tube, Nutrients, Arsenic
Table 2: Sample site IDs, names, coordinates and descriptions.
Site ID Site Name Latitude Longitude Site Description
MST-MC-BRK Moore upper 45.338583 -111.737733 Southeast boundary of Bricker (BRK) property.
MST-MC-GOG Moore middle 45.3787 -111.721883 Southern boundary of Valley Garden property at fence line of Goggins (GOG) property
MST-MC-CNF Moore lower 45.406833 -111.709983 Upstream of confluence (CNF) with Fletcher Channel of Madison River
MST-MC-IRS Moore UT 45.379317 -111.7254 Unnamed Tributary (UT) to Moore consisting of spring and irrigation return flows (IRS)
Madison Stream Team Sampling and Analysis Plan Page 9
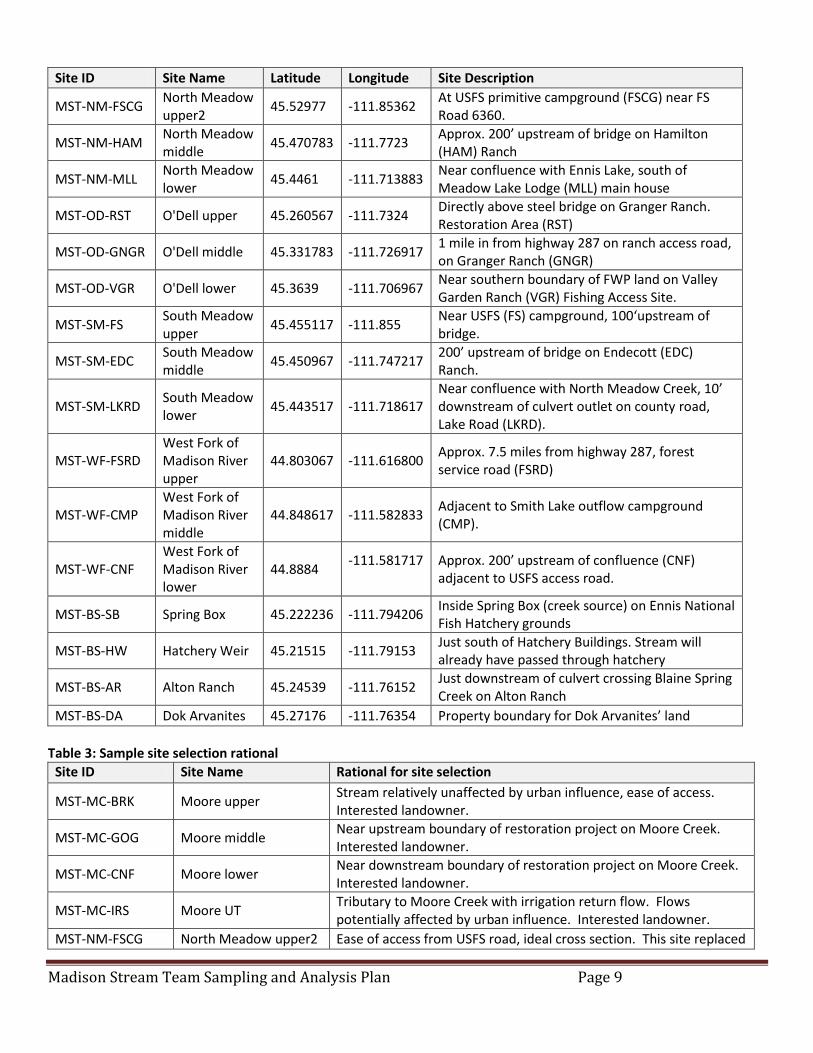
Site ID Site Name Latitude Longitude Site Description
MST-NM-FSCG North Meadow upper2
45.52977 -111.85362 At USFS primitive campground (FSCG) near FS Road 6360.
MST-NM-HAM North Meadow middle
45.470783 -111.7723 Approx. 200’ upstream of bridge on Hamilton (HAM) Ranch
MST-NM-MLL North Meadow lower
45.4461 -111.713883 Near confluence with Ennis Lake, south of Meadow Lake Lodge (MLL) main house
MST-OD-RST O'Dell upper 45.260567 -111.7324 Directly above steel bridge on Granger Ranch. Restoration Area (RST)
MST-OD-GNGR O'Dell middle 45.331783 -111.726917 1 mile in from highway 287 on ranch access road, on Granger Ranch (GNGR)
MST-OD-VGR O'Dell lower 45.3639 -111.706967 Near southern boundary of FWP land on Valley Garden Ranch (VGR) Fishing Access Site.
MST-SM-FS South Meadow upper
45.455117 -111.855 Near USFS (FS) campground, 100‘upstream of bridge.
MST-SM-EDC South Meadow middle
45.450967 -111.747217 200’ upstream of bridge on Endecott (EDC) Ranch.
MST-SM-LKRD South Meadow lower
45.443517 -111.718617 Near confluence with North Meadow Creek, 10’ downstream of culvert outlet on county road, Lake Road (LKRD).
MST-WF-FSRD West Fork of Madison River upper
44.803067 -111.616800 Approx. 7.5 miles from highway 287, forest service road (FSRD)
MST-WF-CMP West Fork of Madison River middle
44.848617 -111.582833 Adjacent to Smith Lake outflow campground (CMP).
MST-WF-CNF West Fork of Madison River lower
44.8884 -111.581717
Approx. 200’ upstream of confluence (CNF) adjacent to USFS access road.
MST-BS-SB Spring Box 45.222236 -111.794206 Inside Spring Box (creek source) on Ennis National Fish Hatchery grounds
MST-BS-HW Hatchery Weir 45.21515 -111.79153 Just south of Hatchery Buildings. Stream will already have passed through hatchery
MST-BS-AR Alton Ranch 45.24539 -111.76152 Just downstream of culvert crossing Blaine Spring Creek on Alton Ranch
MST-BS-DA Dok Arvanites 45.27176 -111.76354 Property boundary for Dok Arvanites’ land
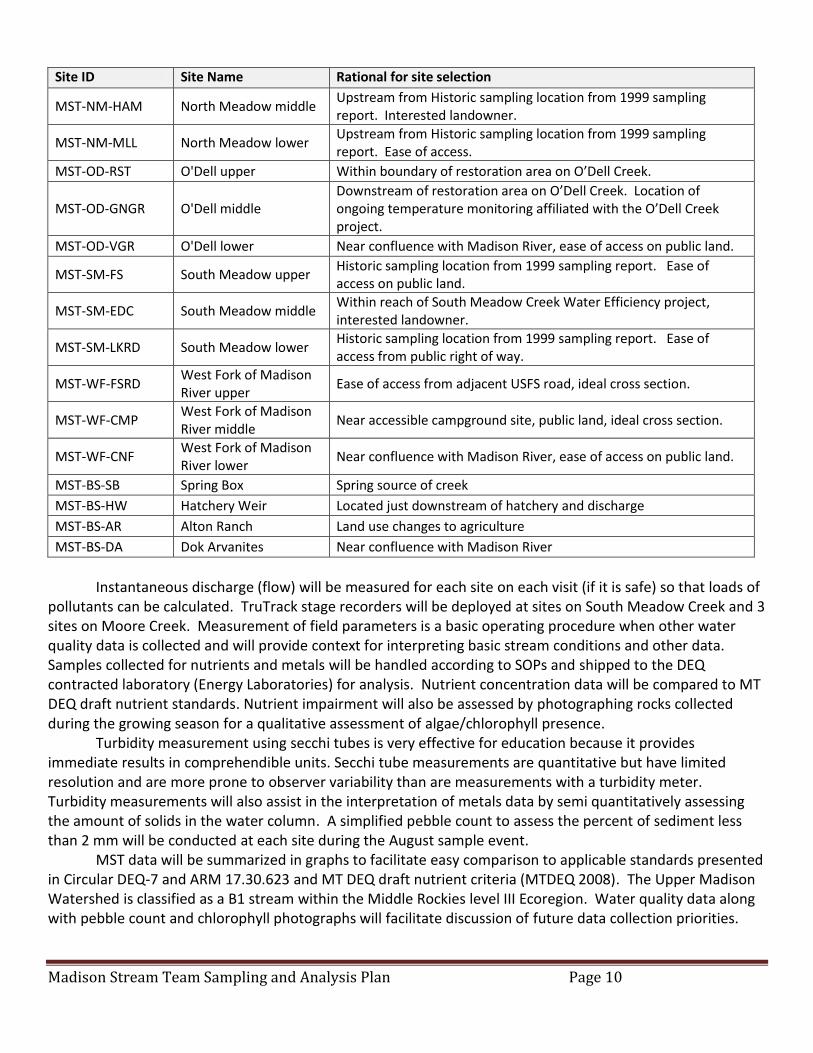
Table 3: Sample site selection rational
Site ID Site Name Rational for site selection
MST-MC-BRK Moore upper Stream relatively unaffected by urban influence, ease of access. Interested landowner.
MST-MC-GOG Moore middle Near upstream boundary of restoration project on Moore Creek. Interested landowner.
MST-MC-CNF Moore lower Near downstream boundary of restoration project on Moore Creek. Interested landowner.
MST-MC-IRS Moore UT Tributary to Moore Creek with irrigation return flow. Flows potentially affected by urban influence. Interested landowner.
MST-NM-FSCG North Meadow upper2 Ease of access from USFS road, ideal cross section. This site replaced
Madison Stream Team Sampling and Analysis Plan Page 10
Site ID Site Name Rational for site selection
MST-NM-HAM North Meadow middle Upstream from Historic sampling location from 1999 sampling report. Interested landowner.
MST-NM-MLL North Meadow lower Upstream from Historic sampling location from 1999 sampling report. Ease of access.
MST-OD-RST O'Dell upper Within boundary of restoration area on O’Dell Creek.
MST-OD-GNGR O'Dell middle Downstream of restoration area on O’Dell Creek. Location of ongoing temperature monitoring affiliated with the O’Dell Creek project.
MST-OD-VGR O'Dell lower Near confluence with Madison River, ease of access on public land.
MST-SM-FS South Meadow upper Historic sampling location from 1999 sampling report. Ease of access on public land.
MST-SM-EDC South Meadow middle Within reach of South Meadow Creek Water Efficiency project, interested landowner.
MST-SM-LKRD South Meadow lower Historic sampling location from 1999 sampling report. Ease of access from public right of way.
MST-WF-FSRD West Fork of Madison River upper
Ease of access from adjacent USFS road, ideal cross section.
MST-WF-CMP West Fork of Madison River middle
Near accessible campground site, public land, ideal cross section.
MST-WF-CNF West Fork of Madison River lower
Near confluence with Madison River, ease of access on public land.
MST-BS-SB Spring Box Spring source of creek
MST-BS-HW Hatchery Weir Located just downstream of hatchery and discharge
MST-BS-AR Alton Ranch Land use changes to agriculture
MST-BS-DA Dok Arvanites Near confluence with Madison River
Instantaneous discharge (flow) will be measured for each site on each visit (if it is safe) so that loads of
pollutants can be calculated. TruTrack stage recorders will be deployed at sites on South Meadow Creek and 3 sites on Moore Creek. Measurement of field parameters is a basic operating procedure when other water quality data is collected and will provide context for interpreting basic stream conditions and other data. Samples collected for nutrients and metals will be handled according to SOPs and shipped to the DEQ contracted laboratory (Energy Laboratories) for analysis. Nutrient concentration data will be compared to MT DEQ draft nutrient standards. Nutrient impairment will also be assessed by photographing rocks collected during the growing season for a qualitative assessment of algae/chlorophyll presence.
Turbidity measurement using secchi tubes is very effective for education because it provides immediate results in comprehendible units. Secchi tube measurements are quantitative but have limited resolution and are more prone to observer variability than are measurements with a turbidity meter. Turbidity measurements will also assist in the interpretation of metals data by semi quantitatively assessing the amount of solids in the water column. A simplified pebble count to assess the percent of sediment less than 2 mm will be conducted at each site during the August sample event. MST data will be summarized in graphs to facilitate easy comparison to applicable standards presented in Circular DEQ-7 and ARM 17.30.623 and MT DEQ draft nutrient criteria (MTDEQ 2008). The Upper Madison Watershed is classified as a B1 stream within the Middle Rockies level III Ecoregion. Water quality data along with pebble count and chlorophyll photographs will facilitate discussion of future data collection priorities.
Madison Stream Team Sampling and Analysis Plan Page 11
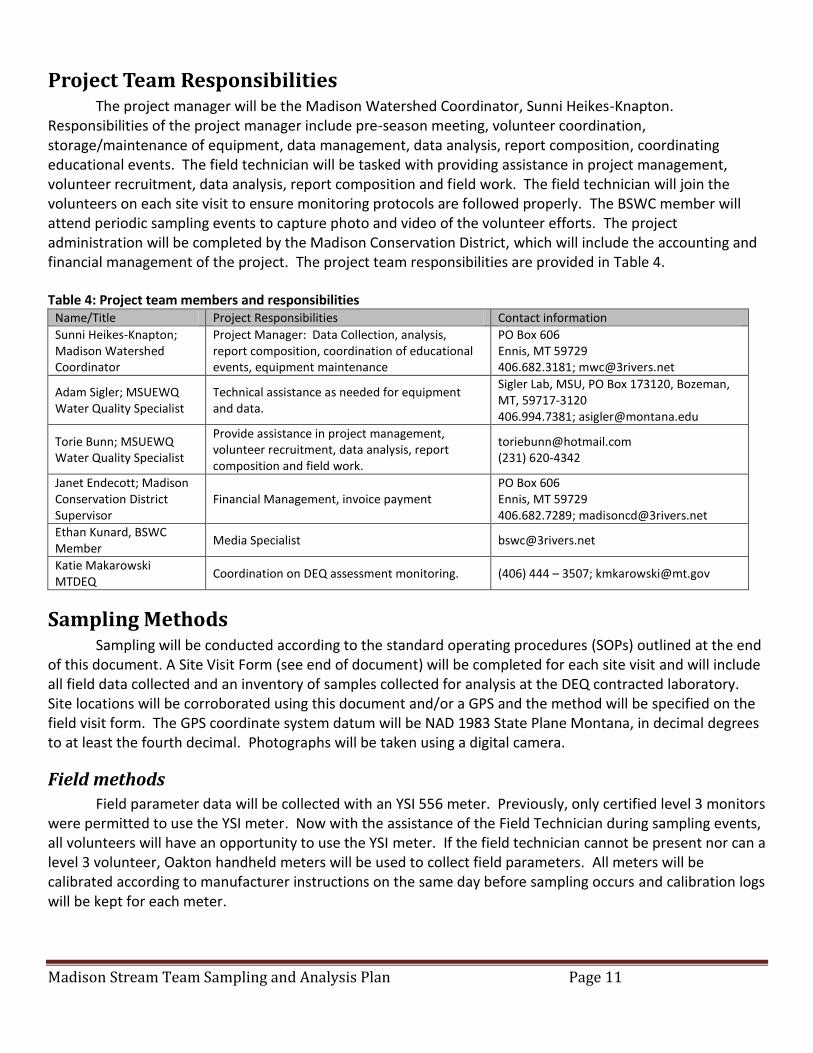
Project Team Responsibilities The project manager will be the Madison Watershed Coordinator, Sunni Heikes-Knapton. Responsibilities of the project manager include pre-season meeting, volunteer coordination, storage/maintenance of equipment, data management, data analysis, report composition, coordinating educational events. The field technician will be tasked with providing assistance in project management, volunteer recruitment, data analysis, report composition and field work. The field technician will join the volunteers on each site visit to ensure monitoring protocols are followed properly. The BSWC member will attend periodic sampling events to capture photo and video of the volunteer efforts. The project administration will be completed by the Madison Conservation District, which will include the accounting and financial management of the project. The project team responsibilities are provided in Table 4. Table 4: Project team members and responsibilities
Name/Title Project Responsibilities Contact information
Sunni Heikes-Knapton; Madison Watershed Coordinator
Project Manager: Data Collection, analysis, report composition, coordination of educational events, equipment maintenance
PO Box 606 Ennis, MT 59729 406.682.3181; [email protected]
Adam Sigler; MSUEWQ Water Quality Specialist
Technical assistance as needed for equipment and data.
Sigler Lab, MSU, PO Box 173120, Bozeman, MT, 59717-3120 406.994.7381; [email protected]
Torie Bunn; MSUEWQ Water Quality Specialist
Provide assistance in project management, volunteer recruitment, data analysis, report composition and field work.
[email protected] (231) 620-4342
Janet Endecott; Madison Conservation District Supervisor
Financial Management, invoice payment PO Box 606 Ennis, MT 59729 406.682.7289; [email protected]
Ethan Kunard, BSWC Member
Media Specialist [email protected]
Katie Makarowski MTDEQ
Coordination on DEQ assessment monitoring. (406) 444 – 3507; [email protected]
Sampling Methods Sampling will be conducted according to the standard operating procedures (SOPs) outlined at the end of this document. A Site Visit Form (see end of document) will be completed for each site visit and will include all field data collected and an inventory of samples collected for analysis at the DEQ contracted laboratory. Site locations will be corroborated using this document and/or a GPS and the method will be specified on the field visit form. The GPS coordinate system datum will be NAD 1983 State Plane Montana, in decimal degrees to at least the fourth decimal. Photographs will be taken using a digital camera.
Field methods
Field parameter data will be collected with an YSI 556 meter. Previously, only certified level 3 monitors were permitted to use the YSI meter. Now with the assistance of the Field Technician during sampling events, all volunteers will have an opportunity to use the YSI meter. If the field technician cannot be present nor can a level 3 volunteer, Oakton handheld meters will be used to collect field parameters. All meters will be calibrated according to manufacturer instructions on the same day before sampling occurs and calibration logs will be kept for each meter.
Madison Stream Team Sampling and Analysis Plan Page 12
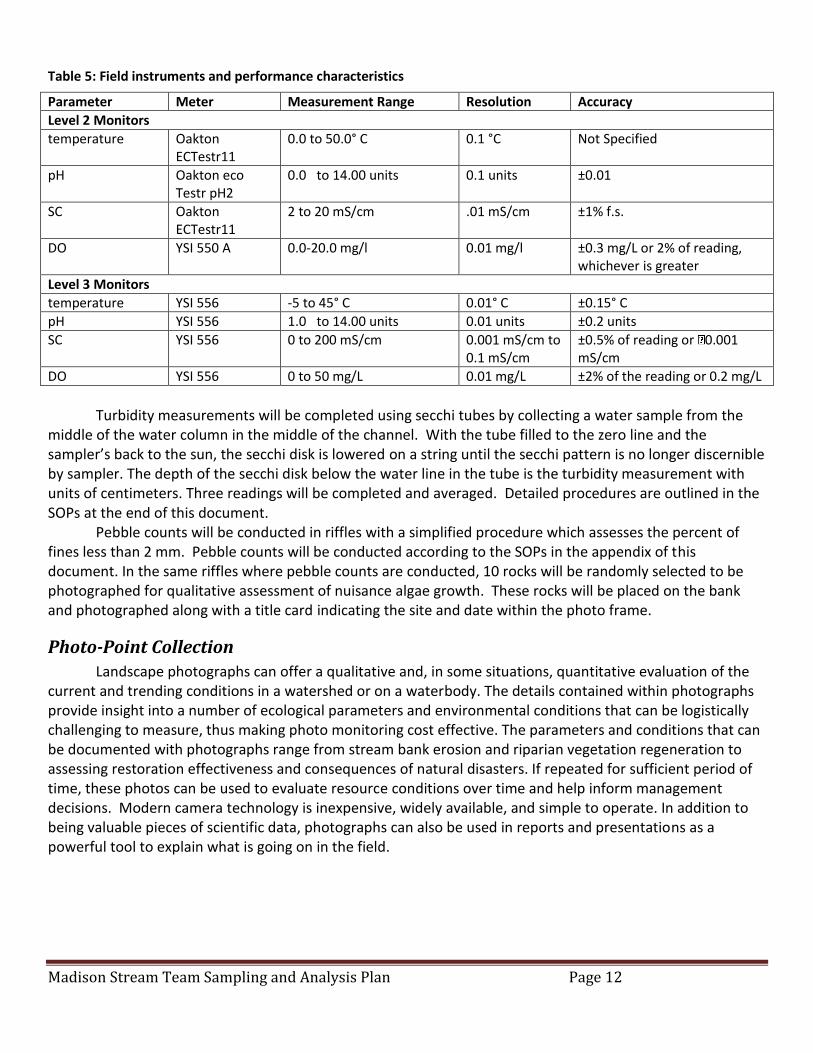
Table 5: Field instruments and performance characteristics
Turbidity measurements will be completed using secchi tubes by collecting a water sample from the middle of the water column in the middle of the channel. With the tube filled to the zero line and the sampler’s back to the sun, the secchi disk is lowered on a string until the secchi pattern is no longer discernible by sampler. The depth of the secchi disk below the water line in the tube is the turbidity measurement with units of centimeters. Three readings will be completed and averaged. Detailed procedures are outlined in the SOPs at the end of this document.
Pebble counts will be conducted in riffles with a simplified procedure which assesses the percent of fines less than 2 mm. Pebble counts will be conducted according to the SOPs in the appendix of this document. In the same riffles where pebble counts are conducted, 10 rocks will be randomly selected to be photographed for qualitative assessment of nuisance algae growth. These rocks will be placed on the bank and photographed along with a title card indicating the site and date within the photo frame.
Photo-Point Collection
Landscape photographs can offer a qualitative and, in some situations, quantitative evaluation of the current and trending conditions in a watershed or on a waterbody. The details contained within photographs provide insight into a number of ecological parameters and environmental conditions that can be logistically challenging to measure, thus making photo monitoring cost effective. The parameters and conditions that can be documented with photographs range from stream bank erosion and riparian vegetation regeneration to assessing restoration effectiveness and consequences of natural disasters. If repeated for sufficient period of time, these photos can be used to evaluate resource conditions over time and help inform management decisions. Modern camera technology is inexpensive, widely available, and simple to operate. In addition to being valuable pieces of scientific data, photographs can also be used in reports and presentations as a powerful tool to explain what is going on in the field.
Parameter Meter Measurement Range Resolution Accuracy
Level 2 Monitors
temperature Oakton ECTestr11
0.0 to 50.0° C 0.1 °C Not Specified
pH Oakton eco Testr pH2
0.0 to 14.00 units 0.1 units ±0.01
SC Oakton ECTestr11
2 to 20 mS/cm .01 mS/cm ±1% f.s.
DO YSI 550 A 0.0-20.0 mg/l 0.01 mg/l ±0.3 mg/L or 2% of reading, whichever is greater
Level 3 Monitors
temperature YSI 556 -5 to 45° C 0.01° C ±0.15° C
pH YSI 556 1.0 to 14.00 units 0.01 units ±0.2 units
SC YSI 556 0 to 200 mS/cm 0.001 mS/cm to 0.1 mS/cm
±0.5% of reading or 0.001 mS/cm
DO YSI 556 0 to 50 mg/L 0.01 mg/L ±2% of the reading or 0.2 mg/L
Madison Stream Team Sampling and Analysis Plan Page 13
Types of Photographs
Photo-points Photo-points are photographs that are taken at a specific location to address a specific objective. These photographs will always be taken from the same position and oriented in the same direction with the same vertical angle. The goal is recreate the same scene within the picture so changes can be documented. Using the same camera through time will make it easier to exactly repeat the photo, although this is not requisite. Camera operators must take extra precaution when taking photo-points to ensure they are in the correct location and are pointing the camera in exactly the correct direction, as well as recording the necessary information about the photograph (metadata).
Supplementary Photos Supplementary photos can be taken of features or evidence of activity within the stream and riparian area that are either unusual or of interest. These photos do not need to be taken in any particular position, but should be documented with the same information (metadata) used with the photo-points. In the extreme case of an extraordinary finding, such as Bigfoot, GPS coordinates should be recorded in the photo description section of the datasheet. Examples of supplementary photos include:
o Evidence of flood damage
o Invasive plants
o Unidentifiable plants or animals
o Extreme erosion
o Irrigation structure damage
o Turbidity events
o Trash dumps
o Happy volunteers
Flow (Discharge) Measurement
Stream discharge data will be collected at all water quality monitoring sites using the Marsh-McBirney Model 2000 Flo-Mate. The flo-mate is a portable flow meter that uses an electromagnetic sensor to measure velocity. As resources are available, TruTrack capacitance rods will be installed and programmed to record hourly water height (mm), water temperature (C), and air temperature (C). Upon each subsequent site visit, data will be downloaded to laptop computer equipped with Omnilog Software and saved as a Microsoft Excel file with site name, date, and time of download. Measured flow and recorded height will be used to create a stage/discharge relationship for each year data is collected. At DEQ staff suggestion, stage data for periods with air temperatures less than freezing will be evaluated and data may be qualified based on DEQ observations that stage data accuracy decreases within this temperatures range.
Water Sample Collection and Handling for Laboratory Analysis Grab samples will be collected for delivery to the DEQ contracted lab for chemistry analysis using acid washed, polyethylene bottles provided by the testing laboratory. Table 6 details the analytical methods and handling procedures for each parameter. Table 1 lists parameters to be analyzed by stream, and a detailed parameter list for each stream is included in the SOPs at the end of this document.
Bottles shall be rinsed three times with stream water prior to sampling. Samples will be collected in a well-mixed portion of each stream. During sampling, the sample bottle opening should face upstream and should be drawn through the water column once, carefully avoiding disturbance of bottom sediments. Samples will be preserved in the field and stored on ice until shipment to the lab. Dissolved Aluminum samples will be collected in separate bottles using the DEQ method of filtration.
Madison Stream Team Sampling and Analysis Plan Page 14
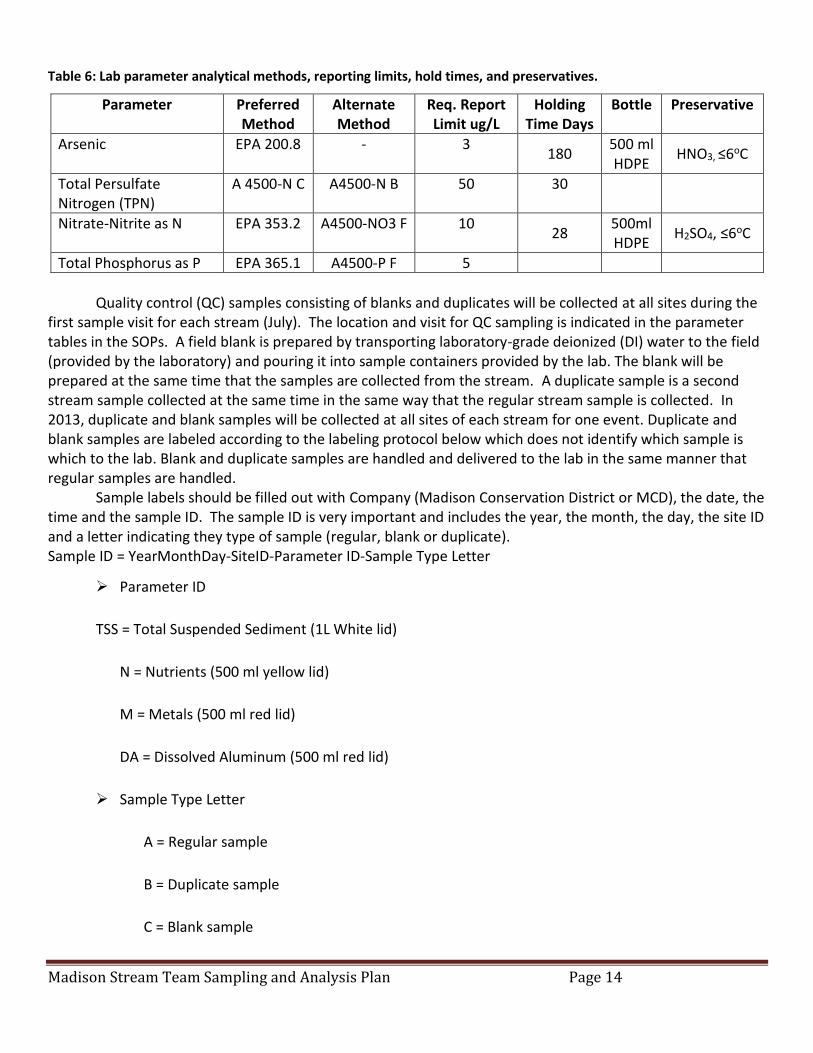
Table 6: Lab parameter analytical methods, reporting limits, hold times, and preservatives.
Quality control (QC) samples consisting of blanks and duplicates will be collected at all sites during the first sample visit for each stream (July). The location and visit for QC sampling is indicated in the parameter tables in the SOPs. A field blank is prepared by transporting laboratory-grade deionized (DI) water to the field (provided by the laboratory) and pouring it into sample containers provided by the lab. The blank will be prepared at the same time that the samples are collected from the stream. A duplicate sample is a second stream sample collected at the same time in the same way that the regular stream sample is collected. In 2013, duplicate and blank samples will be collected at all sites of each stream for one event. Duplicate and blank samples are labeled according to the labeling protocol below which does not identify which sample is which to the lab. Blank and duplicate samples are handled and delivered to the lab in the same manner that regular samples are handled. Sample labels should be filled out with Company (Madison Conservation District or MCD), the date, the time and the sample ID. The sample ID is very important and includes the year, the month, the day, the site ID and a letter indicating they type of sample (regular, blank or duplicate). Sample ID = YearMonthDay-SiteID-Parameter ID-Sample Type Letter
Parameter ID
TSS = Total Suspended Sediment (1L White lid)
N = Nutrients (500 ml yellow lid)
M = Metals (500 ml red lid)
DA = Dissolved Aluminum (500 ml red lid)
Sample Type Letter
A = Regular sample
B = Duplicate sample
C = Blank sample
Parameter Preferred Method
Alternate Method
Req. Report Limit ug/L
Holding Time Days
Bottle Preservative
Arsenic EPA 200.8 - 3 180
500 ml HDPE
HNO3, ≤6oC
Total Persulfate Nitrogen (TPN)
A 4500-N C A4500-N B 50 30
Nitrate-Nitrite as N EPA 353.2 A4500-NO3 F 10 28
500ml HDPE
H2SO4, ≤6oC
Total Phosphorus as P EPA 365.1 A4500-P F 5
Madison Stream Team Sampling and Analysis Plan Page 15
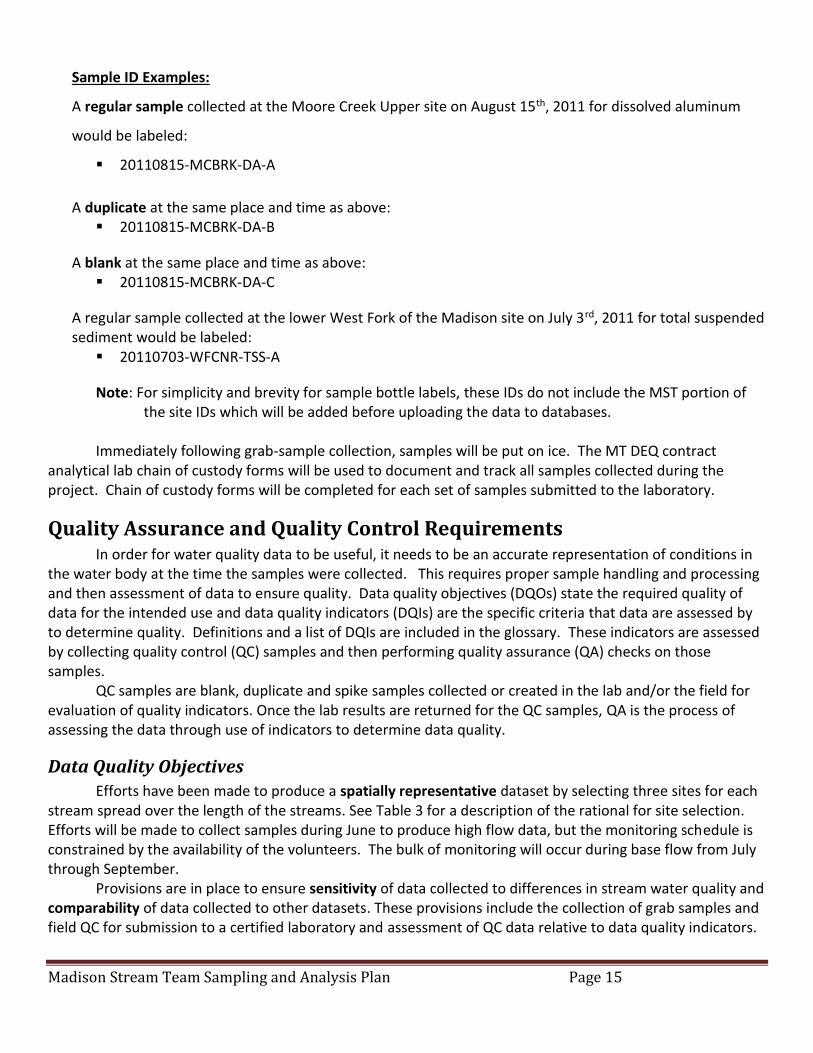
Sample ID Examples:
A regular sample collected at the Moore Creek Upper site on August 15th, 2011 for dissolved aluminum
would be labeled:
20110815-MCBRK-DA-A
A duplicate at the same place and time as above: 20110815-MCBRK-DA-B
A blank at the same place and time as above: 20110815-MCBRK-DA-C
A regular sample collected at the lower West Fork of the Madison site on July 3rd, 2011 for total suspended sediment would be labeled:
20110703-WFCNR-TSS-A
Note: For simplicity and brevity for sample bottle labels, these IDs do not include the MST portion of the site IDs which will be added before uploading the data to databases.
Immediately following grab-sample collection, samples will be put on ice. The MT DEQ contract analytical lab chain of custody forms will be used to document and track all samples collected during the project. Chain of custody forms will be completed for each set of samples submitted to the laboratory.
Quality Assurance and Quality Control Requirements In order for water quality data to be useful, it needs to be an accurate representation of conditions in the water body at the time the samples were collected. This requires proper sample handling and processing and then assessment of data to ensure quality. Data quality objectives (DQOs) state the required quality of data for the intended use and data quality indicators (DQIs) are the specific criteria that data are assessed by to determine quality. Definitions and a list of DQIs are included in the glossary. These indicators are assessed by collecting quality control (QC) samples and then performing quality assurance (QA) checks on those samples. QC samples are blank, duplicate and spike samples collected or created in the lab and/or the field for evaluation of quality indicators. Once the lab results are returned for the QC samples, QA is the process of assessing the data through use of indicators to determine data quality.
Data Quality Objectives
Efforts have been made to produce a spatially representative dataset by selecting three sites for each stream spread over the length of the streams. See Table 3 for a description of the rational for site selection. Efforts will be made to collect samples during June to produce high flow data, but the monitoring schedule is constrained by the availability of the volunteers. The bulk of monitoring will occur during base flow from July through September.
Provisions are in place to ensure sensitivity of data collected to differences in stream water quality and comparability of data collected to other datasets. These provisions include the collection of grab samples and field QC for submission to a certified laboratory and assessment of QC data relative to data quality indicators.
Madison Stream Team Sampling and Analysis Plan Page 16
Data that does not meet quality criteria will be qualified appropriately in the annual report and during the MT EQUIS submission process.
In order to ensure the highest degree of data completeness possible, the team leaders will fill out datasheets and review them before leaving a site. Sunni Heikes-Knapton will review datasheets for completeness and will follow-up with volunteers if fields are not completed. A minimum of 60% completeness (2 out of 3 scheduled events) is the goal for the project for 2011-12 accounting for possible weather, access, and volunteer availability challenges.
Data Quality Indicators Quality assurance and quality control (QAQC) can be broken down into a field and a laboratory
component. The field component consists of collection of blank and duplicate samples and comparison of data to criteria. The laboratory component consists of assessment of data for blanks as well as a variety of duplicate and spiked samples analyzed by the lab. Blank samples should ideally yield results indicating “no detection” of the analyte in question. Duplicate samples should ideally produce identical results and analysis of spiked samples should recover exactly the amount of analyte added. Methods are not perfect however, so the criteria outlined in the following two sections are used to assess if data is of acceptable quality.
Quality Assurance for Field Quality Control Samples
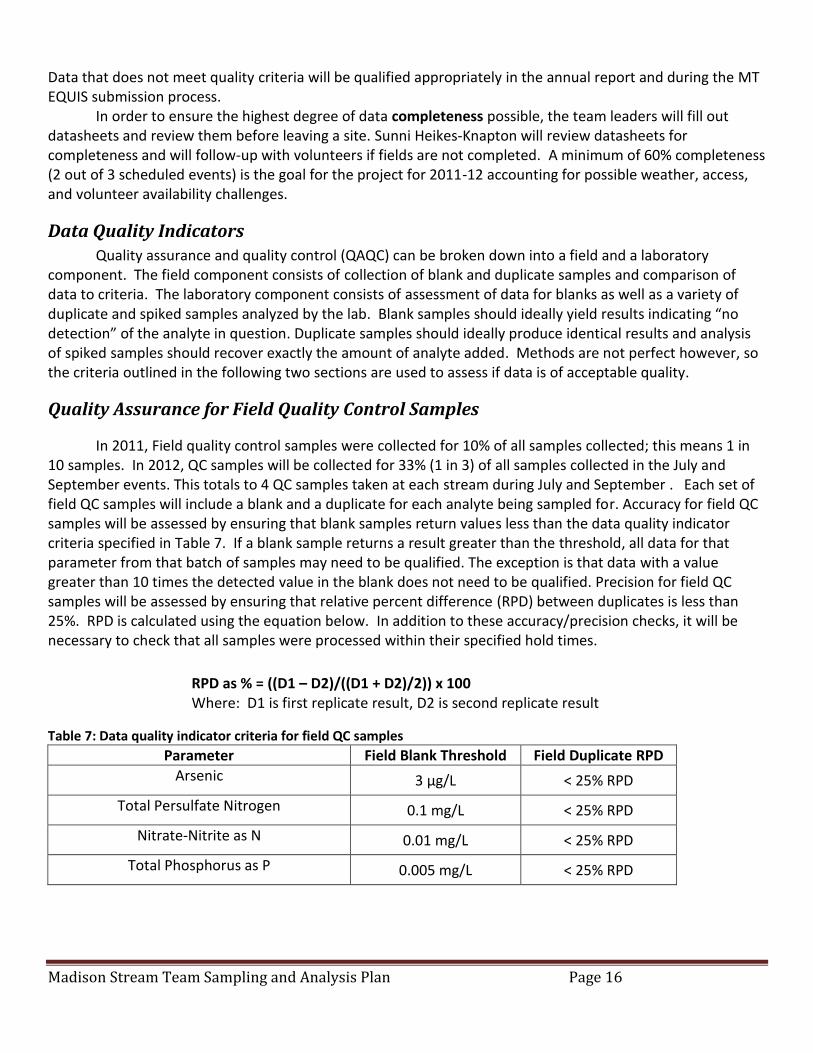
In 2011, Field quality control samples were collected for 10% of all samples collected; this means 1 in 10 samples. In 2012, QC samples will be collected for 33% (1 in 3) of all samples collected in the July and September events. This totals to 4 QC samples taken at each stream during July and September . Each set of field QC samples will include a blank and a duplicate for each analyte being sampled for. Accuracy for field QC samples will be assessed by ensuring that blank samples return values less than the data quality indicator criteria specified in Table 7. If a blank sample returns a result greater than the threshold, all data for that parameter from that batch of samples may need to be qualified. The exception is that data with a value greater than 10 times the detected value in the blank does not need to be qualified. Precision for field QC samples will be assessed by ensuring that relative percent difference (RPD) between duplicates is less than 25%. RPD is calculated using the equation below. In addition to these accuracy/precision checks, it will be necessary to check that all samples were processed within their specified hold times.
RPD as % = ((D1 – D2)/((D1 + D2)/2)) x 100 Where: D1 is first replicate result, D2 is second replicate result
Table 7: Data quality indicator criteria for field QC samples
Parameter Field Blank Threshold Field Duplicate RPD
Arsenic 3 µg/L < 25% RPD
Total Persulfate Nitrogen 0.1 mg/L < 25% RPD
Nitrate-Nitrite as N 0.01 mg/L < 25% RPD
Total Phosphorus as P 0.005 mg/L < 25% RPD
Madison Stream Team Sampling and Analysis Plan Page 17
Quality Assurance for Lab Quality Control Samples
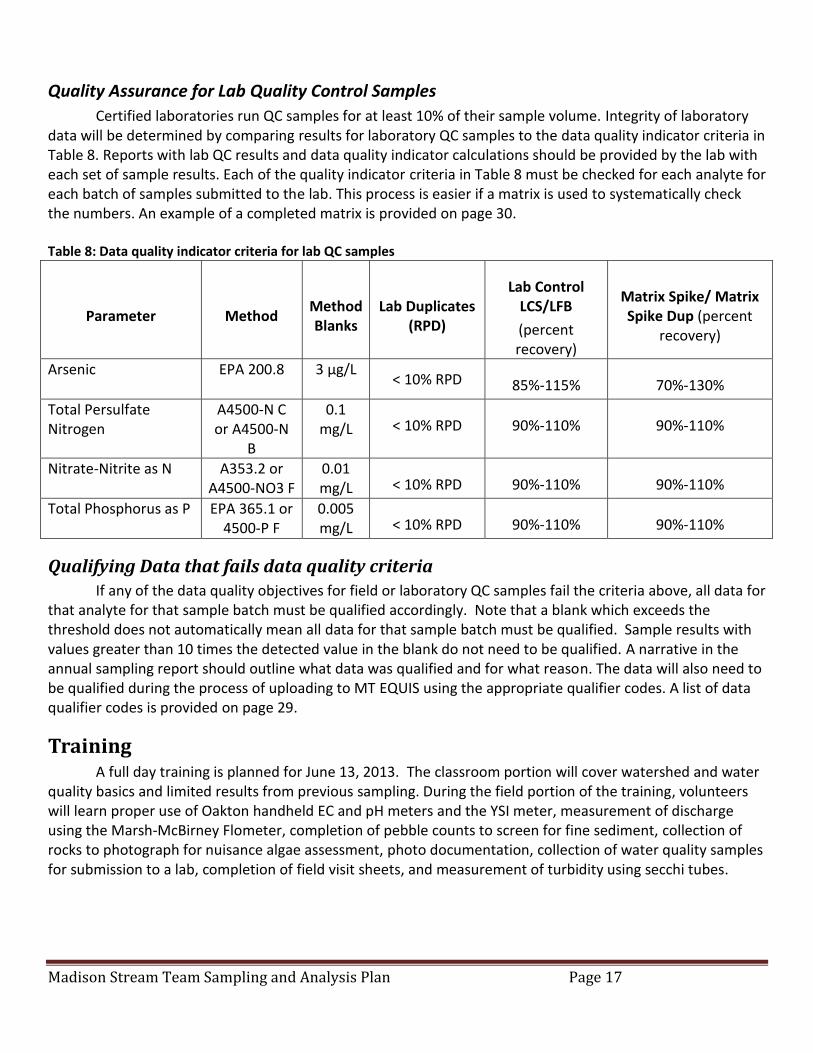
Certified laboratories run QC samples for at least 10% of their sample volume. Integrity of laboratory data will be determined by comparing results for laboratory QC samples to the data quality indicator criteria in Table 8. Reports with lab QC results and data quality indicator calculations should be provided by the lab with each set of sample results. Each of the quality indicator criteria in Table 8 must be checked for each analyte for each batch of samples submitted to the lab. This process is easier if a matrix is used to systematically check the numbers. An example of a completed matrix is provided on page 30. Table 8: Data quality indicator criteria for lab QC samples
Parameter Method Method Blanks
Lab Duplicates (RPD)
Lab Control LCS/LFB
(percent recovery)
Matrix Spike/ Matrix Spike Dup (percent
recovery)
Arsenic EPA 200.8 3 µg/L < 10% RPD 85%-115% 70%-130%
Total Persulfate Nitrogen
A4500-N C or A4500-N
B
0.1 mg/L < 10% RPD 90%-110% 90%-110%
Nitrate-Nitrite as N A353.2 or A4500-NO3 F
0.01 mg/L < 10% RPD 90%-110% 90%-110%
Total Phosphorus as P EPA 365.1 or 4500-P F
0.005 mg/L < 10% RPD 90%-110% 90%-110%
Qualifying Data that fails data quality criteria If any of the data quality objectives for field or laboratory QC samples fail the criteria above, all data for that analyte for that sample batch must be qualified accordingly. Note that a blank which exceeds the threshold does not automatically mean all data for that sample batch must be qualified. Sample results with values greater than 10 times the detected value in the blank do not need to be qualified. A narrative in the annual sampling report should outline what data was qualified and for what reason. The data will also need to be qualified during the process of uploading to MT EQUIS using the appropriate qualifier codes. A list of data qualifier codes is provided on page 29.
Training A full day training is planned for June 13, 2013. The classroom portion will cover watershed and water quality basics and limited results from previous sampling. During the field portion of the training, volunteers will learn proper use of Oakton handheld EC and pH meters and the YSI meter, measurement of discharge using the Marsh-McBirney Flometer, completion of pebble counts to screen for fine sediment, collection of rocks to photograph for nuisance algae assessment, photo documentation, collection of water quality samples for submission to a lab, completion of field visit sheets, and measurement of turbidity using secchi tubes.
Madison Stream Team Sampling and Analysis Plan Page 18
Data Analysis, Record Keeping & Reporting Requirements Copies of laboratory analytical reports and electronic data deliverable spreadsheets will be provided by the DEQ contract analytical lab to both the Madison Watershed Coordinator and to DEQ. The MST coordinator will review the laboratory data to ensure lab results are within reporting limits (including the laboratory QA/QC samples) prior to data entry into MT EQUIS. A review of field and analytical data will be conducted following receipt of the laboratory data package that includes all items on the QC Checklist on page 24. Data qualifiers provided on page 29 will be assigned to data in both hardcopy and electronic form that does not meet these target quality control criteria. A brief synopsis of any SAP methodology derivations that occurred will also be drafted. Data generated during this project will be stored on field forms and in laboratory reports obtained from the laboratories. Electronic copies of field photographs will also be taken. Site Visit and Chain of Custody forms will be properly completed for all samples. Written field notes, field forms, and digital photos will be processed by field staff following QA/QC procedures to screen for data entry errors. Data from all sampling events will be entered into EQUIS. Records of miles driven per volunteer monitor or monitoring crew will be kept to reimburse volunteers. Records of number of hours worked by volunteer monitoring crews will also be tracked for purposes of budget tracking.
Madison Stream Team Sampling and Analysis Plan Page 19
References DEQ 2005a. Water Quality Planning Bureau Field Procedures Manual for Water Quality Assessment Monitoring.
Montana Dept. of Environmental Quality, WQPBWQM-020, revision 2. April 21, 2005. Available at
http://deq.mt.gov/wqinfo/qaprogram/PDF/SOP%20WQPBWQM-020.pdf
DEQ, 2005b. Quality Assurance Project Plan (QAPP) Sampling and Water Quality Assessment of Streams and Rivers in
Montana, 2005. Available at http://www.deq.state.mt.us/wqinfo/QAProgram/WQPBQAP-02.pdf.
DEQ, 2006. Circular DEQ-7, Montana Numeric Water Quality Standards, 2006. Available at
http://www.cedarcreekengineering.com/customers/carolina/Avon/Reports/Montana/GW%20-
%20CompiledDEQ-7.pdf
MT DEQ. 2008. Scientific and Technical Basis of the Numeric Nutrient Criteria for Montana’s Wadeable Streams and Rivers. Michael Suplee, Ph.D. - Montana Department of Environmental Quality; Vicki Watson, Ph.D. – University of Montana; Arun Varghese and Josh Cleland – ICF International. Available on the web at: http://deq.mt.gov/wqinfo/standards/PDF/WhitePaper_FNL3_Nov12-08.pdf [verified June 5, 2010].Appendix A: Site Visit Form and QC Checklist
MT DEQ. 2011. MT DEQ. Clean Water Act Information Center, Jack Creek Water Quality Assessment.
http://cwaic.mt.gov/wqrep/2010/assmtrec/MT41F004_050.pdf URL confirmed: 5/10/2011
MT DEQ. 2011. MT DEQ. Montana Department of Environmental Quality Metals Assessment Method, Final. Prepared by Jonathan Drygas, Water Quality Planning Bureau, Monitoring and Assessment Section. WQPBMASTR-03 www.deq.mt.gov/wqinfo/qaprogram/PDF/SOPs/FINAL_MetalsMethod.pdf URL confirmed: 8/17/2011
Madison Stream Team Sampling and Analysis Plan Page 20
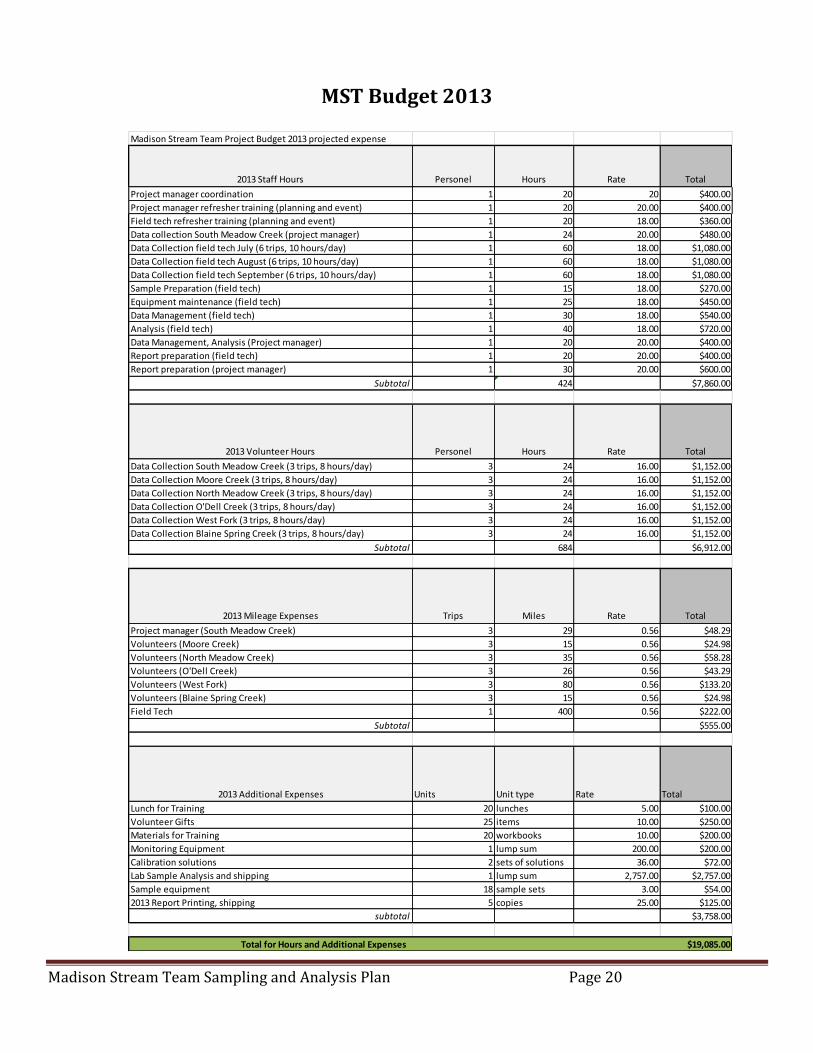
MST Budget 2013
Madison Stream Team Project Budget 2013 projected expense
2013 Staff Hours Personel Hours Rate Total
Project manager coordination 1 20 20 $400.00
Project manager refresher training (planning and event) 1 20 20.00 $400.00
Field tech refresher training (planning and event) 1 20 18.00 $360.00
Data collection South Meadow Creek (project manager) 1 24 20.00 $480.00
Data Collection field tech July (6 trips, 10 hours/day) 1 60 18.00 $1,080.00
Data Collection field tech August (6 trips, 10 hours/day) 1 60 18.00 $1,080.00
Data Collection field tech September (6 trips, 10 hours/day) 1 60 18.00 $1,080.00
Sample Preparation (field tech) 1 15 18.00 $270.00
Equipment maintenance (field tech) 1 25 18.00 $450.00
Data Management (field tech) 1 30 18.00 $540.00
Analysis (field tech) 1 40 18.00 $720.00
Data Management, Analysis (Project manager) 1 20 20.00 $400.00
Report preparation (field tech) 1 20 20.00 $400.00
Report preparation (project manager) 1 30 20.00 $600.00
Subtotal 424 $7,860.00
2013 Volunteer Hours Personel Hours Rate Total
Data Collection South Meadow Creek (3 trips, 8 hours/day) 3 24 16.00 $1,152.00
Data Collection Moore Creek (3 trips, 8 hours/day) 3 24 16.00 $1,152.00
Data Collection North Meadow Creek (3 trips, 8 hours/day) 3 24 16.00 $1,152.00
Data Collection O'Dell Creek (3 trips, 8 hours/day) 3 24 16.00 $1,152.00
Data Collection West Fork (3 trips, 8 hours/day) 3 24 16.00 $1,152.00
Data Collection Blaine Spring Creek (3 trips, 8 hours/day) 3 24 16.00 $1,152.00
Subtotal 684 $6,912.00
2013 Mileage Expenses Trips Miles Rate Total
Project manager (South Meadow Creek) 3 29 0.56 $48.29
Volunteers (Moore Creek) 3 15 0.56 $24.98
Volunteers (North Meadow Creek) 3 35 0.56 $58.28
Volunteers (O'Dell Creek) 3 26 0.56 $43.29
Volunteers (West Fork) 3 80 0.56 $133.20
Volunteers (Blaine Spring Creek) 3 15 0.56 $24.98
Field Tech 1 400 0.56 $222.00
Subtotal $555.00
2013 Additional Expenses Units Unit type Rate Total
Lunch for Training 20 lunches 5.00 $100.00
Volunteer Gifts 25 items 10.00 $250.00
Materials for Training 20 workbooks 10.00 $200.00
Monitoring Equipment 1 lump sum 200.00 $200.00
Calibration solutions 2 sets of solutions 36.00 $72.00
Lab Sample Analysis and shipping 1 lump sum 2,757.00 $2,757.00
Sample equipment 18 sample sets 3.00 $54.00
2013 Report Printing, shipping 5 copies 25.00 $125.00
subtotal $3,758.00
Total for Hours and Additional Expenses $19,085.00
Madison Stream Team Sampling and Analysis Plan Page 21
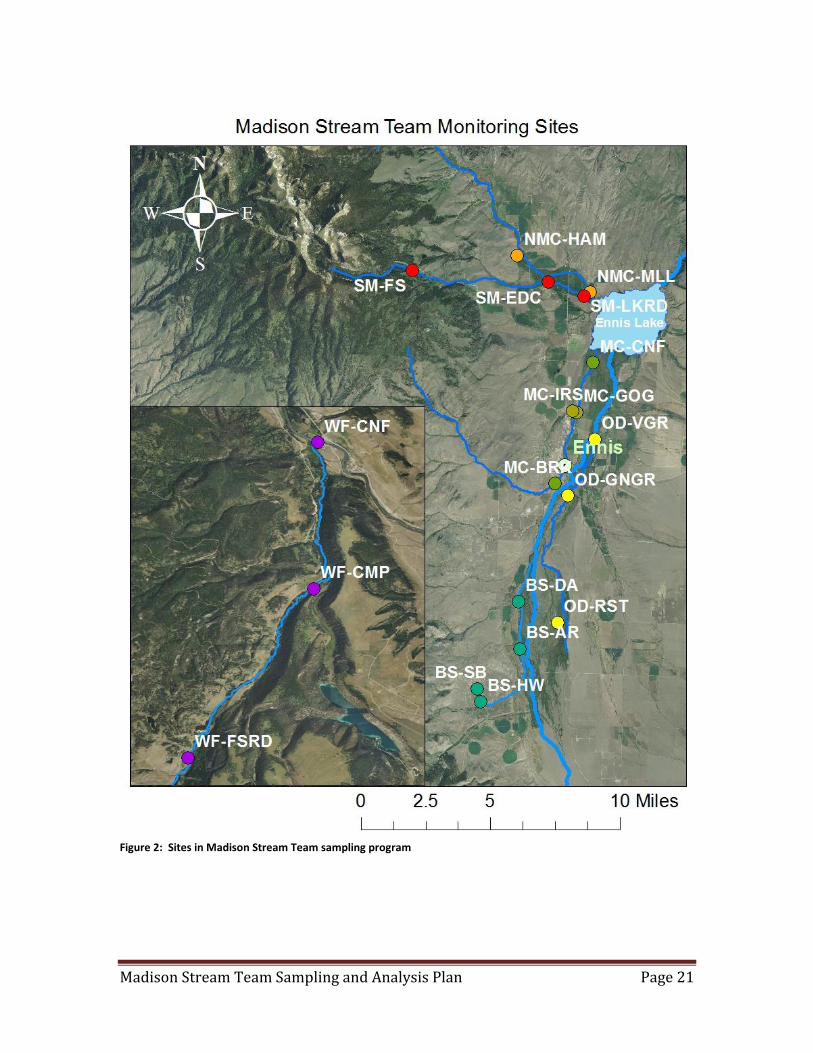
Figure 2: Sites in Madison Stream Team sampling program
Madison Stream Team Sampling and Analysis Plan Page 22
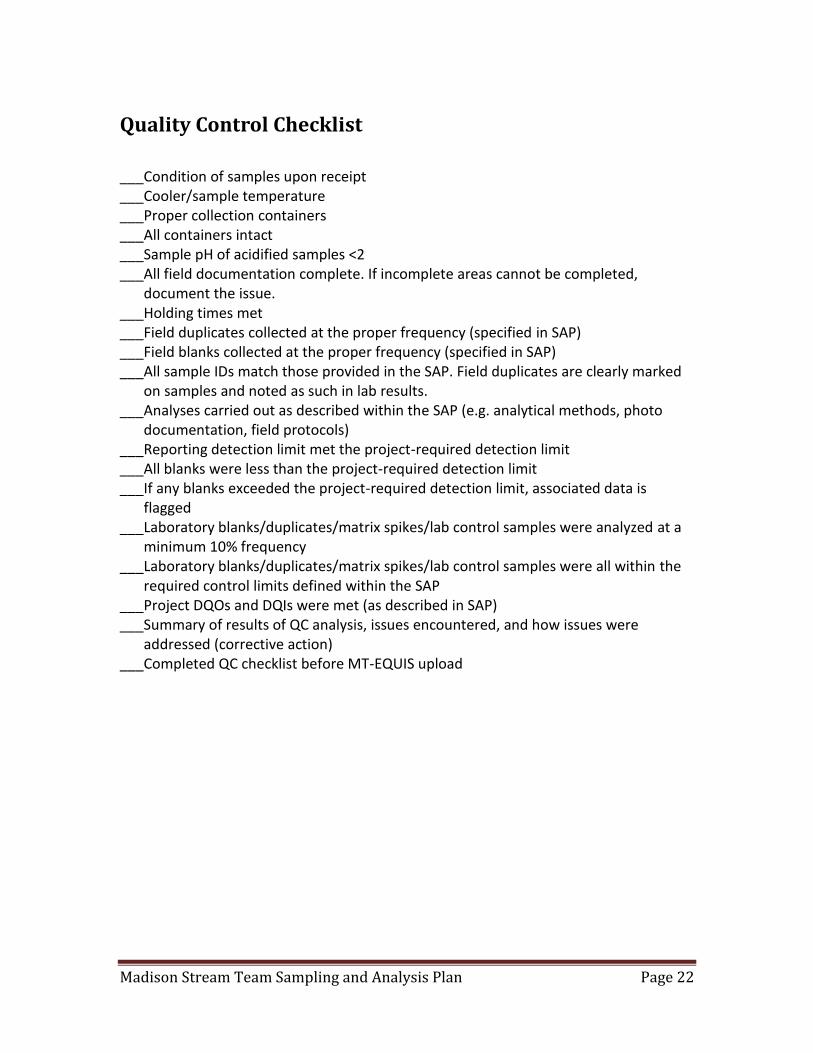
Quality Control Checklist
___Condition of samples upon receipt ___Cooler/sample temperature ___Proper collection containers ___All containers intact ___Sample pH of acidified samples <2 ___All field documentation complete. If incomplete areas cannot be completed,
document the issue. ___Holding times met ___Field duplicates collected at the proper frequency (specified in SAP) ___Field blanks collected at the proper frequency (specified in SAP) ___All sample IDs match those provided in the SAP. Field duplicates are clearly marked
on samples and noted as such in lab results. ___Analyses carried out as described within the SAP (e.g. analytical methods, photo
documentation, field protocols) ___Reporting detection limit met the project-required detection limit ___All blanks were less than the project-required detection limit ___If any blanks exceeded the project-required detection limit, associated data is
flagged ___Laboratory blanks/duplicates/matrix spikes/lab control samples were analyzed at a
minimum 10% frequency ___Laboratory blanks/duplicates/matrix spikes/lab control samples were all within the
required control limits defined within the SAP ___Project DQOs and DQIs were met (as described in SAP) ___Summary of results of QC analysis, issues encountered, and how issues were
addressed (corrective action) ___Completed QC checklist before MT-EQUIS upload
Madison Stream Team Sampling and Analysis Plan Page 23
QA/QC Terms Accuracy. A data quality indicator, accuracy is the extent of agreement between an observed value (sampling result) and the accepted, or true, value of the parameter being measured. High accuracy can be defined as a combination of high precision and low bias. Analyte. Within a medium, such as water, an analyte is a property or substance to be measured. Examples of analytes would include pH, dissolved oxygen, bacteria, and heavy metals. Bias. Often used as a data quality indicator, bias is the degree of systematic error present in the assessment or analysis process. When bias is present, the sampling result value will differ from the accepted, or true, value of the parameter being assessed. Blind sample. A type of sample used for quality control purposes, a blind sample is a sample submitted to an analyst without their knowledge of its identity or composition. Blind samples are used to test the analyst’s or laboratory’s expertise in performing the sample analysis. Comparability. A data quality indicator, comparability is the degree to which different methods, data sets, and/or decisions agree or are similar. Completeness. A data quality indicator that is generally expressed as a percentage, completeness is the amount of valid data obtained compared to the amount of data planned. Data users. The group(s) that will be applying the data results for some purpose. Data users can include the monitors themselves as well as government agencies, schools, universities, businesses, watershed organizations, and community groups. Data quality indicators (DQIs). DQIs are attributes of samples that allow for assessment of data quality. These include precision, accuracy, bias, sensitivity, comparability, representativeness and completeness. Data quality objectives (DQOs). Data quality objectives are quantitative and qualitative statements describing the degree of the data’s acceptability or utility to the data user(s). They include data quality indicators (DQIs) such as accuracy, precision, representativeness, comparability, and completeness. DQOs specify the quality of the data needed in order to meet the monitoring project's goals. The planning process for ensuring environmental data are of the type, quality, and quantity needed for decision making is called the DQO process.
Madison Stream Team Sampling and Analysis Plan Page 24
Detection limit. Applied to both methods and equipment, detection limits are the lowest concentration of a target analyte that a given method or piece of equipment can reliably ascertain and report as greater than zero. Duplicate sample. Used for quality control purposes, duplicate samples are two samples taken at the same time from, and representative of, the same site that are carried through all assessment and analytical procedures in an identical manner. Duplicate samples are used to measure natural variability as well as the precision of a method, monitor, and/or analyst. More than two duplicate samples are referred to as replicate samples. Environmental sample. An environmental sample is a specimen of any material collected from an environmental source, such as water or macroinvertebrates collected from a stream, lake, or estuary. Equipment or rinsate blank. Used for quality control purposes, equipment or rinsate blanks are types of field blanks used to check specifically for carryover contamination from reuse of the same sampling equipment (see field blank). Field blank. Used for quality control purposes, a field blank is a “clean” sample (e.g., distilled water) that is otherwise treated the same as other samples taken from the field. Field blanks are submitted to the analyst along with all other samples and are used to detect any contaminants that may be introduced during sample collection, storage, analysis, and transport. Instrument detection limit. The instrument detection limit is the lowest concentration of a given substance or analyte that can be reliably detected by analytical equipment or instruments (see detection limit). Matrix. A matrix is a specific type of medium, such as surface water or sediment, in which the analyte of interest may be contained. Measurement Range. The measurement range is the extent of reliable readings of an instrument or measuring device, as specified by the manufacturer. Method detection limit (MDL). The MDL is the lowest concentration of a given substance or analyte that can be reliably detected by an analytical procedure (see detection limit). Precision. A data quality indicator, precision measures the level of agreement or variability among a set of repeated measurements, obtained under similar conditions. Relative percent difference (RPD) is an example of a way to calculate precision by looking at the difference between results for two duplicate samples.
Madison Stream Team Sampling and Analysis Plan Page 25
Protocols. Protocols are detailed, written, standardized procedures for field and/or laboratory operations. Quality assurance (QA). QA is the process of ensuring quality in data collection including: developing a plan, using established procedures, documenting field activities, implementing planned activities, assessing and improving the data collection process and assessing data quality by evaluating field and lab quality control (QC) samples. Quality assurance project plan (QAPP). A QAPP is a formal written document describing the detailed quality control procedures that will be used to achieve a specific project’s data quality requirements. This is an overarching document that might cover a number of smaller projects a group is working on. A QAPP may have a number of sample analysis plans (SAPs) that operate underneath it. Quality control (QC). QC samples are the blank, duplicate and spike samples that are collected in the field and/or created in the lab for analysis to ensure the integrity of samples and the quality of the data produced by the lab. Relative percent difference (RPD). RPD is an alternative to standard deviation, expressed as a percentage and used to determine precision when only two measurement values are available. Calculated with the following formula: RPD as % = ((D1 – D2)/((D1 + D2)/2)) x 100 Where: D1 is first replicate result D2 is second replicate result Replicate samples. See duplicate samples. Representativeness. A data quality indicator, representativeness is the degree to which data accurately and precisely portray the actual or true environmental condition measured. Sample analysis plan (SAP). A SAP is a document outlining objectives, data collection schedule, methods and data quality assurance measures for a project. Sensitivity. Related to detection limits, sensitivity refers to the capability of a method or instrument to discriminate between measurement responses representing different levels of a variable of interest. The more sensitive a method is, the better able it is to detect lower concentrations of a variable. Spiked samples. Used for quality control purposes, a spiked sample is a sample to which a known concentration of the target analyte has been added. When analyzed, the
Madison Stream Team Sampling and Analysis Plan Page 26
difference between an environmental sample and the analyte’s concentration in a spiked sample should be equivalent to the amount added to the spiked sample. Split sample. Used for quality control purposes, a split sample is one that has been equally divided into two or more subsamples. Splits are submitted to different analysts or laboratories and are used to measure the precision of the analytical methods. Standard reference materials (SRM). An SRM is a certified material or substance with an established, known and accepted value for the analyte or property of interest. Employed in the determination of bias, SRMs are used as a gauge to correctly calibrate instruments or assess measurement methods. SRMs are produced by the U. S. National Institute of Standards and Technology (NIST) and characterized for absolute content independent of any analytical method. Standard operating procedures (SOPs). An SOP is a written document detailing the prescribed and established methods used for performing project operations, analyses, or actions. True value. In the determination of accuracy, observed measurement values are often compared to true, or standard, values. A true value is one that has been sufficiently well established to be used for the calibration of instruments, evaluation of assessment methods or the assignment of values to materials.
Madison Stream Team Sampling and Analysis Plan Page 27
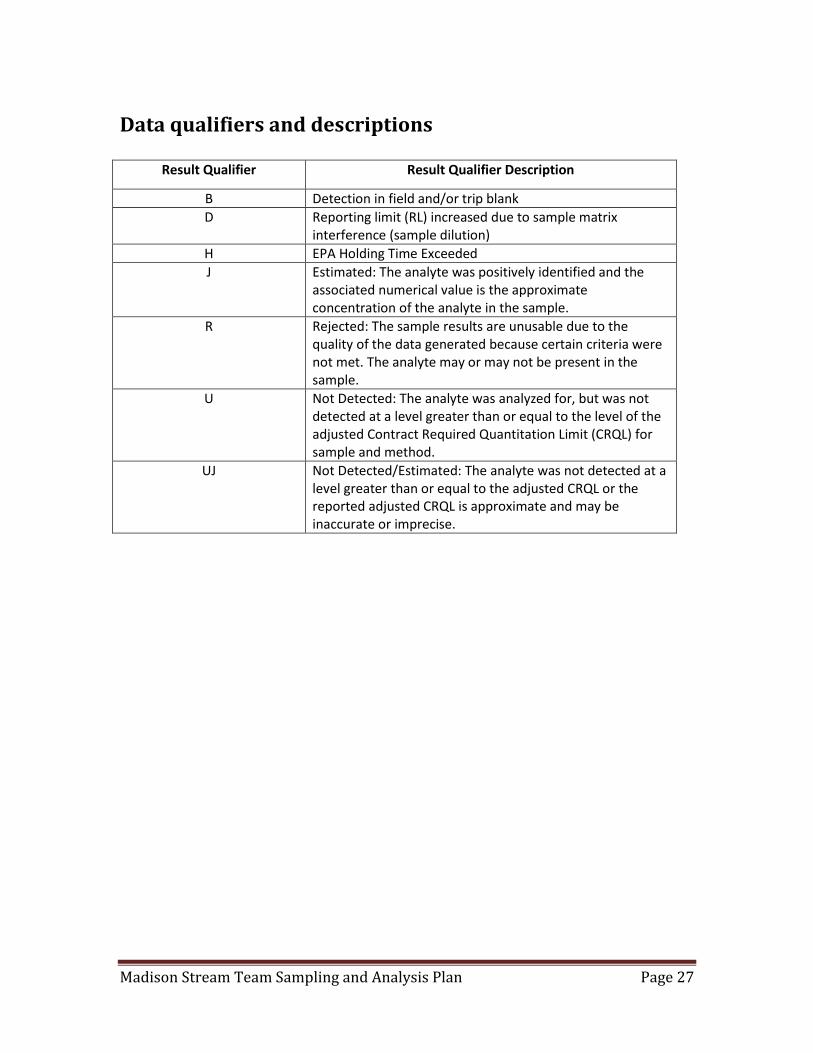
Data qualifiers and descriptions
Result Qualifier Result Qualifier Description
B Detection in field and/or trip blank
D Reporting limit (RL) increased due to sample matrix interference (sample dilution)
H EPA Holding Time Exceeded
J Estimated: The analyte was positively identified and the associated numerical value is the approximate concentration of the analyte in the sample.
R Rejected: The sample results are unusable due to the quality of the data generated because certain criteria were not met. The analyte may or may not be present in the sample.
U Not Detected: The analyte was analyzed for, but was not detected at a level greater than or equal to the level of the adjusted Contract Required Quantitation Limit (CRQL) for sample and method.
UJ Not Detected/Estimated: The analyte was not detected at a level greater than or equal to the adjusted CRQL or the reported adjusted CRQL is approximate and may be inaccurate or imprecise.
Madison Stream Team Sampling and Analysis Plan Page 28
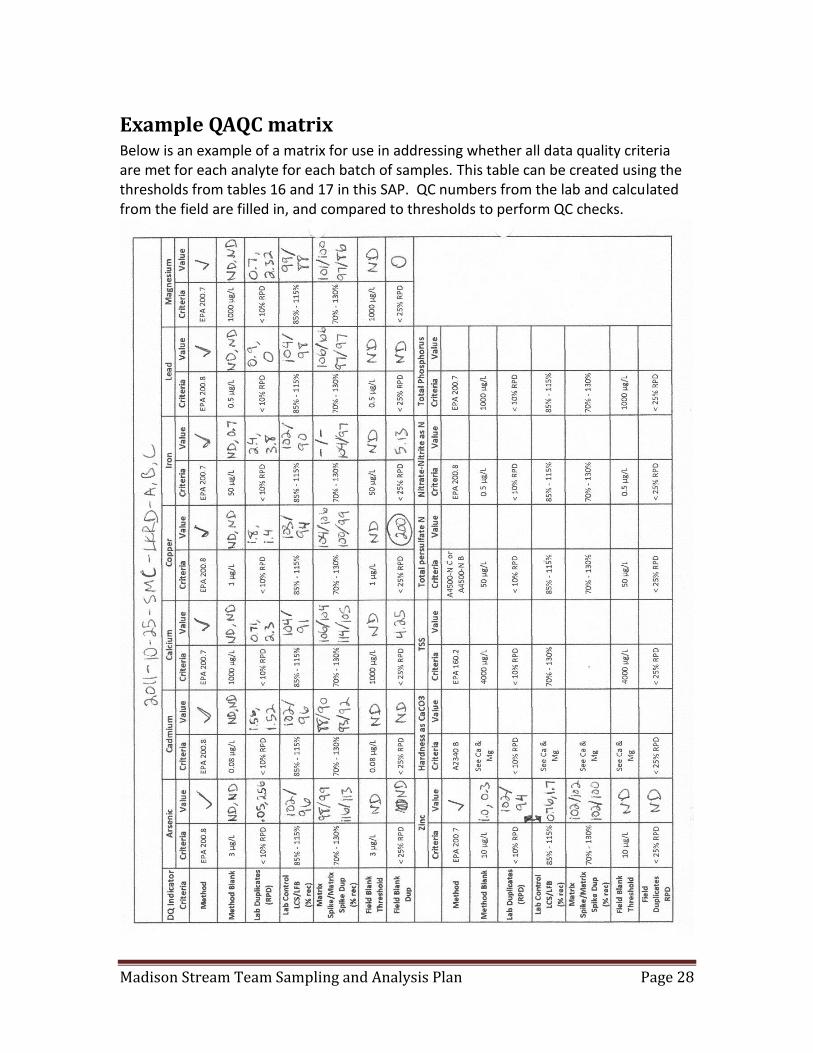
Example QAQC matrix Below is an example of a matrix for use in addressing whether all data quality criteria are met for each analyte for each batch of samples. This table can be created using the thresholds from tables 16 and 17 in this SAP. QC numbers from the lab and calculated from the field are filled in, and compared to thresholds to perform QC checks.