Embed Size (px)
Citation preview

Jalal Pirzada: CEO
Maria Legos: COO
Colleen McDonald: CFO

Overview• Industry: Auto & Truck Manufacturers• Ford #2 maker of cars and trucks. • Major competitors: DaimlerChrysler, General
Motors, and Toyota. • Ford makes vehicles under Aston Martin, Ford,
Jaguar, Lincoln, Mercury, and Volvo brands. • Owns a stake in Mazda and has purchased
BMW’s Land Rover SUV operations. • Hertz car rental, it has an auto finance company,
Ford Motor Credit, and owns QualityCare and Kwik-Fit automotive services.
• The Ford family owns about 40% of the firm’s voting stock / Ford’s employees own 20%.

History


Vision
To be the world’s largest consumer
company for automotive products and
services.

Mission
We are a global family with a proud heritage, passionately committed to providing personal mobility for people around the world. We anticipate consumer needs and deliver outstanding products and services that improve people’s lives.

Strategic Objectives• To build strong lasting relationships with our
customers and grow our business.• To improve the fuel economy of our sport
utility vehicles 25% by 2005.• To continue to be a positive contributor to the
community.• To create family service and learning centers
at our facilities in the United States in partnership with the United Auto Workers Union.
• In 2002 will launch “Tire Pressure Monitoring System”

Strategic Objectives (cont..)
• To become a consumer focused team.• To view our customer business from a
customers perspective.• To create an “early warning system” for
tire information• To introduce at least 45 new products in
the next five years.• To improve our performance in South
America
Financial Objectives• We plan to continue to deliver superior
shareholder returns into the future.
• To be in the top quartile of the Standard & Poor’s 500 for share holder returns.
• To achieve more than 4% return on sales in North America.
• To achieve more than 1% return on sales in Europe.

Financial Objectives (cont..)
• To save $200m in the next 2 years with our Consumer Driven 6-Sigma.
• To reduce total costs by $1 billion.
• To contain capital spending at $8b or less.
• To improve returns and grow earnings 10% of Ford’s credit.
• To increase revenue $5 billion.

Strengths
• Ford Focus and F-Series best selling car and truck in the world
• #4 Fortune 500, S&P 500, #89 FT Global 500• Ford corporate umbrella strong brand names:
Aston Martin, Ford, Jaguar, Lincoln, Land Rover, Mercury, 33% Mazda and Volvo
• US #1 auto finance company (Ford Motor Credit) & Quality Care
• Hertz #1 car rental firm in the world• Kwik-Fit and Automobile Protection
Corporation (APCO)• Sold 7424 000 Cars & Trucks up 204 000
units from 1999

Weaknesses• Decrease in Automotive cash of $5b in 2000
compared to 1999 due bought back shares
• Visteon had a $2.3 billion loss due to carrying value was more than fair market value
• 6.5 million tires recalled, Bridgestone /Firestone controversy increased higher warranty costs
• Assets impairment and restructuring costs in Europe $1019m of Ford brand operations

Weaknesses (cont..)
• South America lost $240m in the automotive sector
• Write down of assets associated with Nemak Joint Venture $133 million
• Inventory related profit reduction Land Rover $106m
Opportunities
• Implementing a long term European Turnaround strategy
• To become an industry leader we will address environmental issues
• View our business from the customers perspective; “transaction” mentality to a “relationship” headset

Opportunities (cont..)
• Ford.com & FordDirect.com
• Wingcast will bring wireless, digital information and entertainment services directly into our cars and trucks
• Web portal launched with GM, DaimlerChrysler, Bell, and Howell to make distribution of service parts faster and more efficient

Threats
• Difficult economic conditions• Tougher competition
• Rapidly advancing technology• Stricter regulations
• Changing marketplace• Increasing demands from a variety of
stakeholder groups

Market Data: Ford 2000
• HQ: Dearborn, MI
• Employees: 345 911
• NYSE: F
• 52-Week High: $58.40 Low: $22.75
• Shares Outstanding (M): 1837
• Market Value (M): $43 059.3
• Total Consolidated Revenue: $170.06 Billion, Up 6% from 1999

Wall Street Consensus
Ford Motor

Financial Ratios Analysis
Profitability Ratios1. Gross Profit Margin = Measures how much of each
sales dollar earned use to cover operating expenses and profit
Gross Profit Margin = Sales – COSG / Sales 170064 – 140499 / 170064 = 26.76%
Ford = 26.76% Industry = 27.79%
Ford’s every one dollar of sales, it has 27 cents left to cover operating costs and profit.

Profitability Ratios
2. Profit Margin = Measures the percentage of profits earned per dollar of sales
Profit Margin = (Net Profit / Net Sales) x 100
(3467 / 170064) x 100 = 2.04%
Ford = 2.04% Industry = 1.47%
Ford makes 2 cents for every $1.00 dollar of sale.

Liquidity Ratios
1. Current Ratio = Measures how much current assets are available to meet its maturing short term obligations
Current Ratio = Current Assets / Current Liabilities 39310 / 43327 = 0.91
Ford = 0.91:1 Industry = 1.99:1
Ford has 91 cents of current assets to meet $1.00 of its current liability.
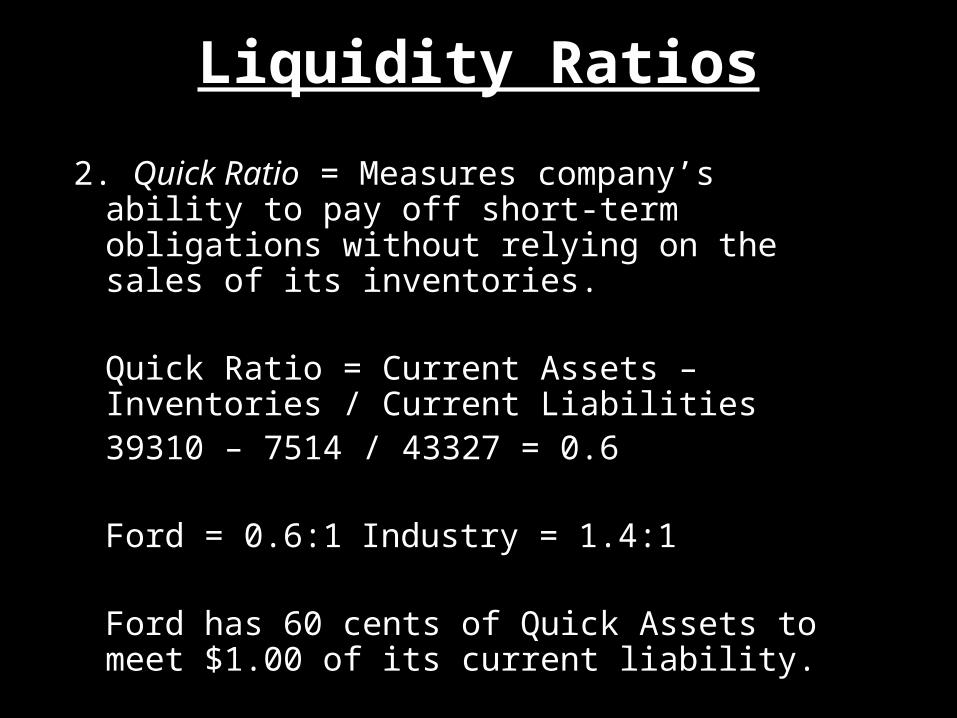
Liquidity Ratios
2. Quick Ratio = Measures company’s ability to pay off short-term obligations without relying on the sales of its inventories.
Quick Ratio = Current Assets – Inventories / Current Liabilities 39310 – 7514 / 43327 = 0.6
Ford = 0.6:1 Industry = 1.4:1
Ford has 60 cents of Quick Assets to meet $1.00 of its current liability.

Leverage Ratios1. Interest Coverage Ratio = is the measurement of
how many times interest payments could be made with a firm’s earnings before interest expenses and taxes are paid
Interest Coverage Ratio = Earnings Before Interest and Taxes (EBIT) over Interest expense
EBIT = 5529 + 1383 + 9519 + 2705 = 19136Interest Expense = 1383 + 9519 = 10902
19136 / 10902 = 1.7
Ford = 1.7 Industry = 2.1
Ford compared to industry is less solvent and can only meet interest obligation little less than twice a year.

Leverage Ratios2. Debt-To-Equity Ratio = Measures how much
funds provided by Creditors versus Owners. Higher Debt to Equity ratio means that creditors have more stake and risk then shareholders.
Debt-To-Equity Ratio = Total Debt / Total Stockholders’ Equity 166279 / 18610 = 8.90
Ford = 8.90 Industry = 2.10
Ford has $8.90 of LT debt for every $1.00 of equity.

Activity Ratios1. Days of Sales Outstanding = Measures how
long in days it takes a company to convert its sales receivables into cash
Days of Sales Outstanding = (Accounts Receivables / Sales) 3656272 / 170064 x 365 = 13.28
Ford = 13 Days Industry = 121 Days
It takes 13 days for Ford to covert its receivables into cash while it takes 121 days for the industry.

Activity Ratios2. Inventory Turnover Ratio = Measures firm’s
efficiency in terms of how fast can a company move its inventory in a year
Inventory Turnover = Net Sales / Inventory
170064 / 7514 = 17.9
Ford = 17.9 Industry = 8.9
Ford is able to rotate its inventory in sales 18 times in a fiscal year.
Recommendations• Shift from Transactional view to Customer
relationship
• #2 South Korea car maker DAEWOO MOTOR
• Acquisitions Land Rover, Kwit-Fit and spin off costs loss Viseton and High Unusual Items losses Assets Impairment & Restructuring. Further Purchases put on HOLD. Debt is expensive then equity
• Think cars available at Avis and other nations wide car rentals

![[ENG] When Mr. Pirzada Came to Dine](https://img.pdfslide.net/doc/110x75/5571f30949795947648d643a/eng-when-mr-pirzada-came-to-dine.jpg)